Preprint
Article

This version is not peer-reviewed.

Irreversibility of Ag|AgCl Reference Electrodes

A peer-reviewed version of this preprint was published in:
Electrochem 2026, 7(3), 21. https://doi.org/10.3390/electrochem7030021

Submitted:

13 June 2026

Posted:

17 June 2026

You are already at the latest version

Abstract

An Ag|AgCl redox couple has been thought to work as a reversible reference electrode although metal dissolution often occurs irreversibly. This report examines the kinetics by means of ac–impedance of AgCl films at the Ag electrode. A brief result is that the reaction rate for conventional voltammetric currents is totally irreversible although it can be enhanced with a thickness of the AgCl film. According to the frequency–dependence of the imaginary admittance, the double layer capacitance is determined only by the geometrical area of the Ag–electrode to exhibit 140 mF cm–2. This value is caused by the delocalized charge of AgCl dipoles rather than water dipoles. The charge transfer rate of AgCl + e « Ag + Cl was evaluated from the variation of the real admittance with the frequency to yield the charge transfer rate constant with the order of 10–9 cm s–1. The rate constants increased with the surface density (G) of the deposited AgCl in proportion to G0.3. The fractional power of the increase indicates that the reaction should occur not only at the geometrical area of the Ag–electrode but also at fluctuated Ag–particles in electric connection with the Ag–electrode caused by percolation. The reversibility of Ag|AgCl can be realized at current densities smaller than 0.1 mA mm–2, exemplified by 10 nA at a 0.3 mm disk. Then, Ag|AgCl can be used for a counter electrode at ultramicroelectrode techniques in a two–electrode system.
Keywords: 
;  ;  ;  ;  

1. Introduction

A film of silver chloride on a silver metal immersed in a given concentration of Cl, denoted by Ag|AgCl, has been extensively used for a reference electrode because it shows not only (A) high reproducibility and repeatability but also (B) high reversibility [1,2]. The (A) can be successfully accomplished by improving construction of cell geometry and fabrication techniques at the aim of miniaturization [3,4,5,6,7,8]. In contrast, the (B) belongs to a thermodynamic or a kinetic subject, proper to the chemical reaction rate of AgCl + e ↔ Ag0 + Cl. A delay of the reaction can be neglected when voltammetric currents through a voltage follower are extremely small in a three–electrode cell. However, the miniaturization by incorporating a counter electrode into a reference one [4,6,9,10,11] makes currents of nA order flow through the reference electrode. Then, a question arises on how much intensity of the current alter a potential of the reference electrode.
The homogeneously bimolecular reaction rate of Ag0 with Cl has been reported to be 20 M–1 s–1 (M = mol dm–3) [12], which corresponds to a reaction period being 0.05 s for [Cl] = 1 M. Application of this time scale to electrochemical measurements ought to cause a delay of potential responses as slow as 0.05 s or 3 Hz. The slow rate is due to the bond–breaking and the formation of Ag and Cl after the charge transfer. This is in contrast to fast charge transfer rates of outer–sphere metal complexes without rearrangement molecular structure [13], exemplified by ferrocenyl complexes. Heterogeneous reactions are generally slower than homogeneous ones because reactants in different phases can meet only at an interface, while homogeneous reactants collide more freely and frequently [14]. As a result, a heterogeneous reaction at Ag|AgCl should exhibit a further delay over 0.05 s. The electrochemically determined heterogeneous charge transfer rates have been reported in the form of exchange current densities, j0, which depend on measurement techniques and their analysis, as listed in Table 1. They are so largely scattered that it is difficult to estimate even the order of the reversibility. A reason for the scattering is alteration of the electrode surface during the reaction. It is desirable to evaluate explicitly the heterogeneous rates of AgCl without altering thickness of AgCl films.
We evaluate here the charge transfer rates of Ag|AgCl electrodes to predict the stability of potentials at reference electrodes in the context of thickness of AgCl films. Our technique of the evaluation is ac–impedance, coupled with the concept of the constant phase element [19,20,21,22,23]. Since the redox current at Ag|AgCl electrodes has been enhanced with the thickness of the AgCl film [15], the rate per geometrical electrode area would be increased with the thickness. In order to grasp the reversibility, it is necessary to determine a quantitative relationship between the apparent heterogeneous reaction rate and the film thickness.

2. Materials and Methods

Three kinds of solutions were prepared: 0.2 M citric acid (M = mol dm–3, pH 2.9) + 0.3 M NaCl, 0.05 M pH buffered solution (pH 7.0) + 0.45 M NaCl, and 0.2 M NaHCO3 (pH 8.4) + 0.3 M NaCl. A silver wire 0.5 mm in diameter, of which surface was polished, was inserted into a solution 5 mm in length by means of a z–stage. It was used as a working electrode. A reference and a counter electrode were an Ag|AgCl in the solution of [Cl-] = 0.3 M and a platinum coil, respectively.
A constant current, ranging from 1 μA to 2 mA, was applied to the Ag wire to form an AgCl film at a given deposition time, tdp, (from 4 s to 20 s). The product of the current and the time provides the theoretical thickness of AgCl through jWMtdp/Fd [17], where j is the current density, WM is the molar weight, F is the Faraday constant, and d is the density of AgCl. A typical thickness is 0.27 nm for j = 0.1 mA cm–2 at tdp = 1 s. We express the density of a deposited amount of AgCl as
Γ = jtdp /F
Ac–impedance was made at the open circuit potential under the conditions of the ac–amplitude, 10 mV, and of the frequency domain from 1 Hz to 4 kHz. After the ac–impedance measurement, cyclic voltammetry was made at several scan rates in order to confirm the amount of the deposited AgCl.

3. Results and Discussion

Figure 1A shows a cyclic voltammogram in the NaCl solution at pH 7. This voltammogram was almost the same as those for the other pH solutions. The sudden rise of the anodic current at E = 0 V is a well–known feature of dissolution [24] of metal to generate AgCl on the surface. The anodic current decreased after exhibiting a peak, probably because of a loss of diffusional supply of Cl. In contrast, the cathodic wave starting at 0 V is caused by the reduction of AgCl. The deposited AgCl is consumed at –0.9 V to generate Ag0, and then the cathodic current drops after passing through the peak. Figure 1B shows voltammograms in the narrow potential domain at three scan rates. The anodic currents and the cathodic ones were almost independent of the scan rates. Therefore, the currents should be controlled with chemical reaction rates rather than mass transport. The forward cathodic current near 0 V (Figure 1B(d)) is connected smoothly with the anodic one. This suggests apparently a reversible reaction. Since the waves at the backward scan shifted positively from the anodic ones, however, the reaction is not reversible essentially. The intersection of the cathodic waves at the forward scan with those at the backward one indicates that the oxidation of Ag0 should occur faster than the reduction of AgCl. As a result, kinetics ought to be detected even at scan rates as slowly as 0.03 V s–1 (= v0). This scan rate corresponds to the period, RT/Fv0, which provides the rate δ/(RT/Fv0) passing through a distance δ. A typical value of the rate calculated from δ/(RT/Fv0) is 10–7 cm s–1 for δ = 1 nm of a AgCl film. It belongs to one of the slowest charge transfer reaction couples.
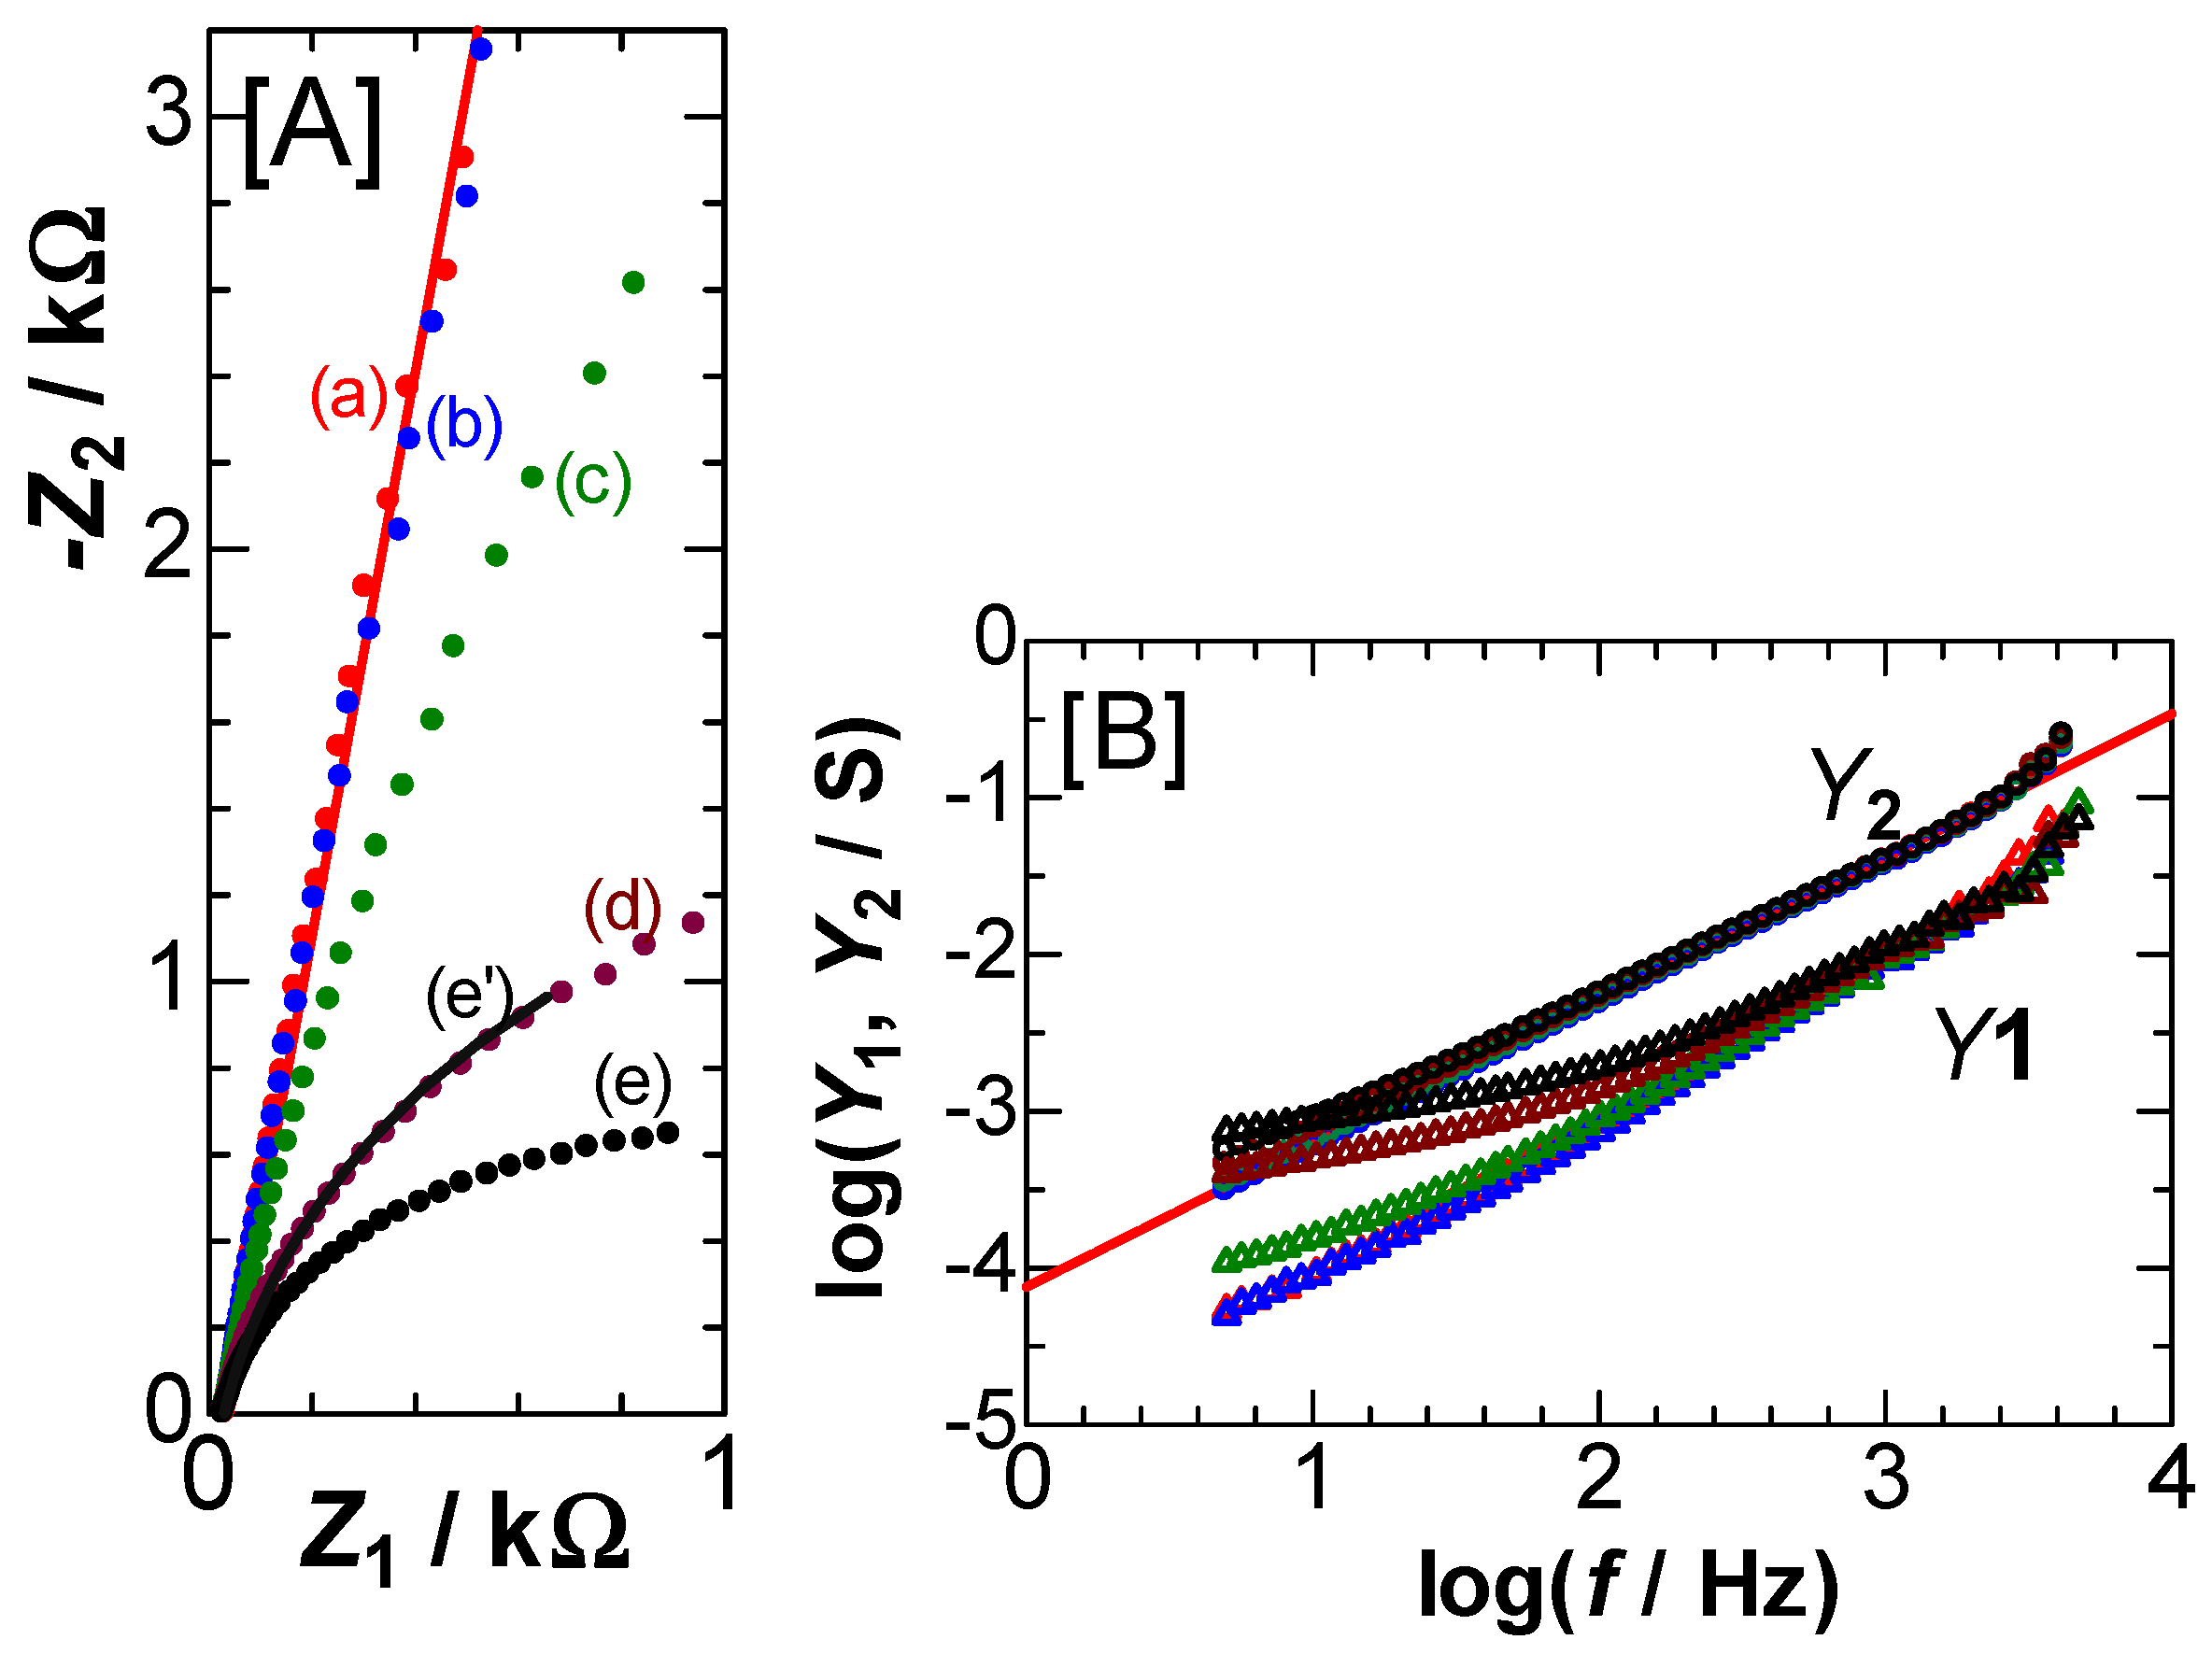
It is difficult to determine kinetic parameters quantitatively from such large voltammetric currents as for dissolution of metals. The difficulty can be covered with a usage of ac–impedance when it is observed at an open circuit dc–potential (OCP), Edc. We made it for the frequency (f) domain from 1 Hz to 4 kHz. Figure 2A shows the Nyquist plots at the Ag–electrode coated with various amount of AgCl, Γ, obtained for an OCP, where Z1 and Z2 are the real and the imaginary impedance, respectively. The value of Z1 at which –Z2 was extrapolated to zero was ca. 30 Ω, independent of Γ. This independence implies that the resistance should be due to the solution resistance, Rs rather than film resistance [15,17]. Plot (a) measured without deliberately forming any AgCl film takes a line with a slope 7. The linearity with the large slope represents the constant phase element [19,20,21,22,23] or the power–law of the frequency [34,35], which can discriminate against a vertical line for an ideal capacitance. The complex admittance of the double layer capacitance (DLC) with the power–law has been expressed by [35]
YDLC = (λ + i)ωC1Hz f λ
for ω = 2πf, where λ is a positive constant near 0.1, i is the imaginary unit, and C1Hz is the capacitance at f = 1 Hz. Figure 2B shows logarithmic plots of Y1 and Y2 against f for several values of Γ, where Rs was subtracted from Z1 through Y = 1/(ZRs), and Y1 and Y2 are the real and the imaginary parts of Y, respectively. Values of log(Y2) were approximately linear with log f, almost independent of Γ, as supported by the power law (Y2 = 2πC1Hz f 1–λ) in Eq. (2). The value of λ was close to 0.1, as is similar to platinum electrodes in polarizable electrolytes [25]. The intercept of plot (a) without deliberately generated AgCl gave a value of C1Hz to be (150±10) μF cm–2, which is four times larger than that of platinum electrode. The four times increase is ascribed partially to the dipole moment of AgCl (6.0 Debye [26]) which is 3.2 times larger than that of water and partially to an increase in surface roughness by the metal dissolution [18].
With an increase in Γ, values of –Z2 decreased (Figure 2A) or those of Y1 at low frequencies increased (Figure 2B) from the lines, because the charge transfer resistance, Rct, of Ag+Cl ↔ AgCl + e becomes conspicuous. Then the equivalent circuit may be approximated as the parallel combination of Rct and YDLC [27]. The total admittance is expressed by
YY1 + iY2 = {λωC1Hz f λ + 1/Rct }+ iωC1Hz f λ
which yields Z = Rct(λx+1–ix)/{(λx+1)2+x2} for x = 2πC1Hz f 1–λRct. Eliminating x provides
(Z1Rct/2)2 + (Z2λRct/2)2 = (Rct/2)2 (1 +λ 2)
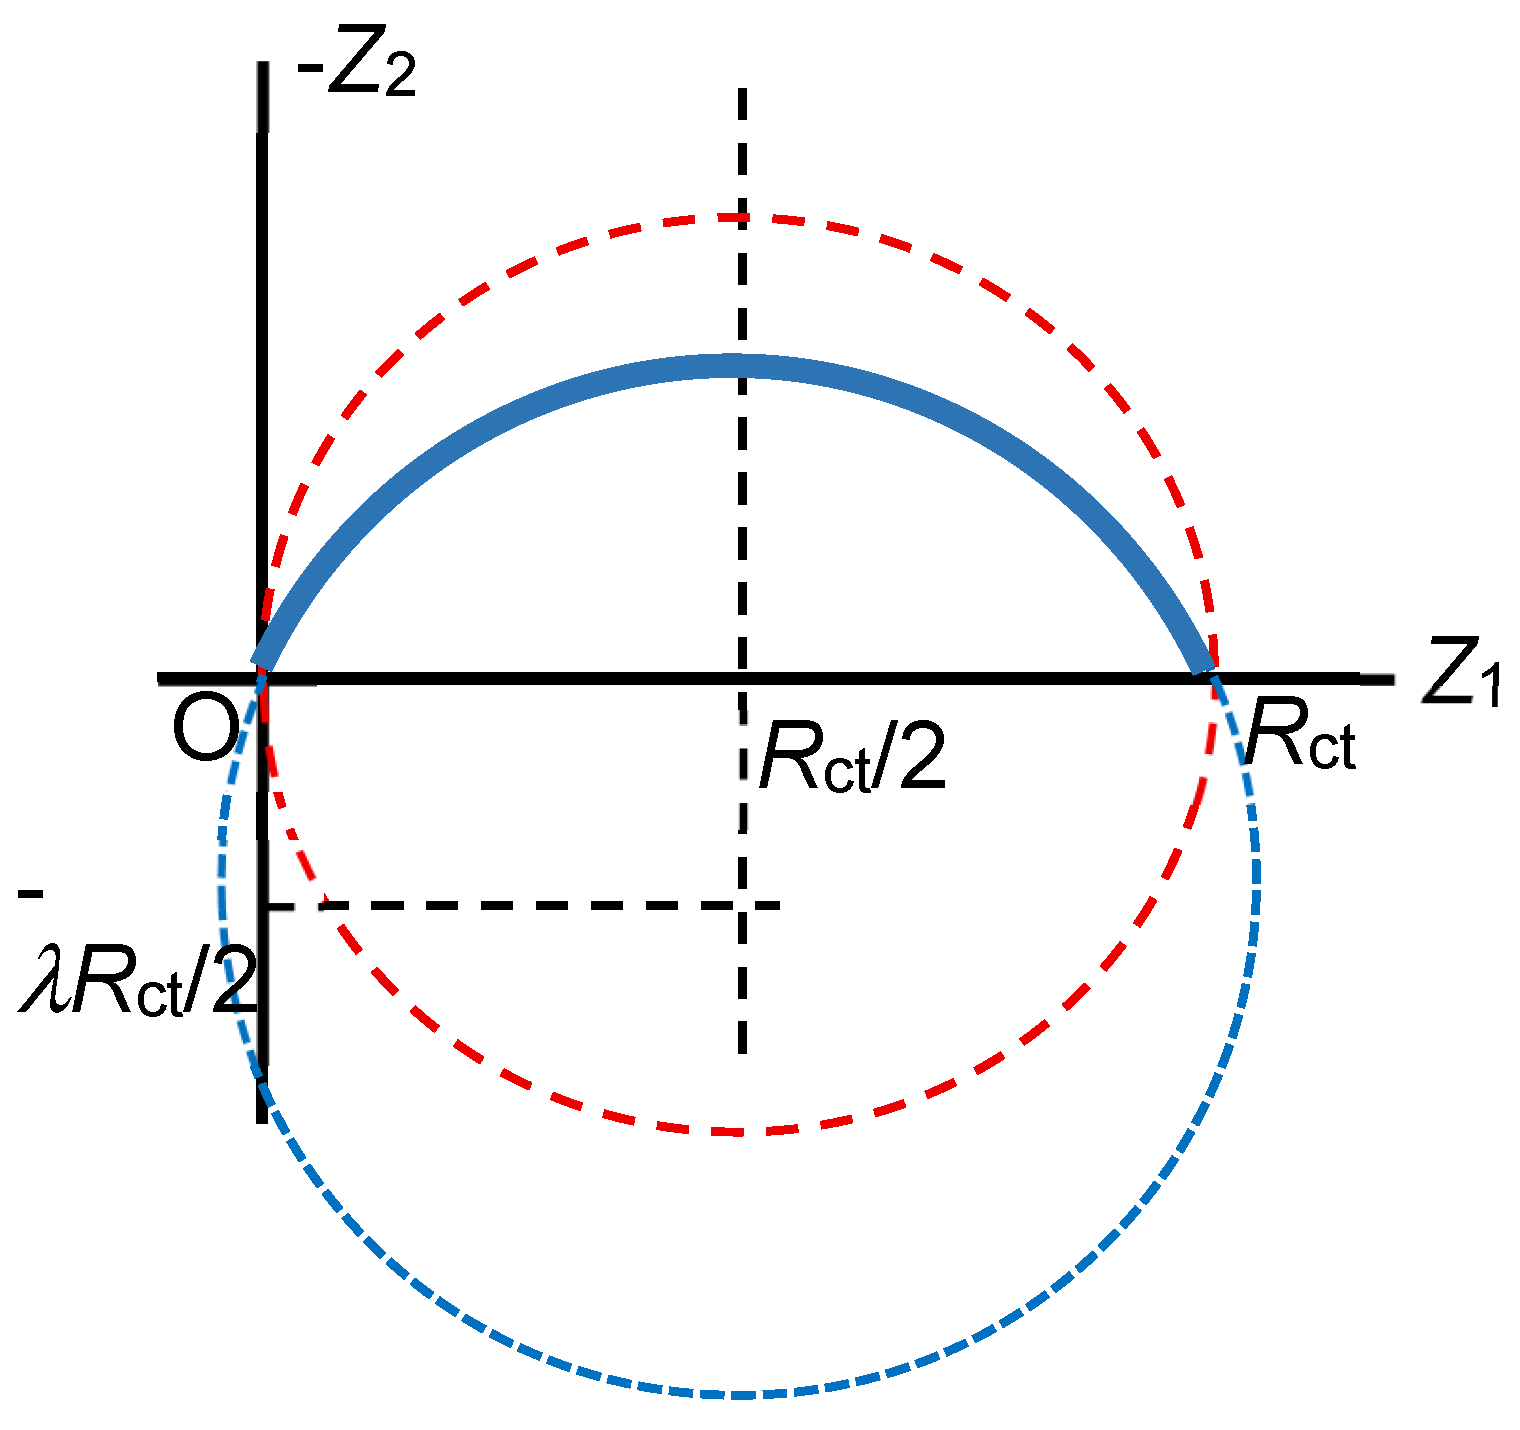
A variation of –Z2 with Z1 takes obviously a circle in the Nyquist plot, passing through the origin, as shown in Figure 3 [28,29]. Since values of –Z2 are positive, an observed circle should be limited to the domain of the first quadrant. From the comparison of the variations in Figure 1A with those in Figure 3, values of Rct decrease with an increase in Γ for a positive value of λ.
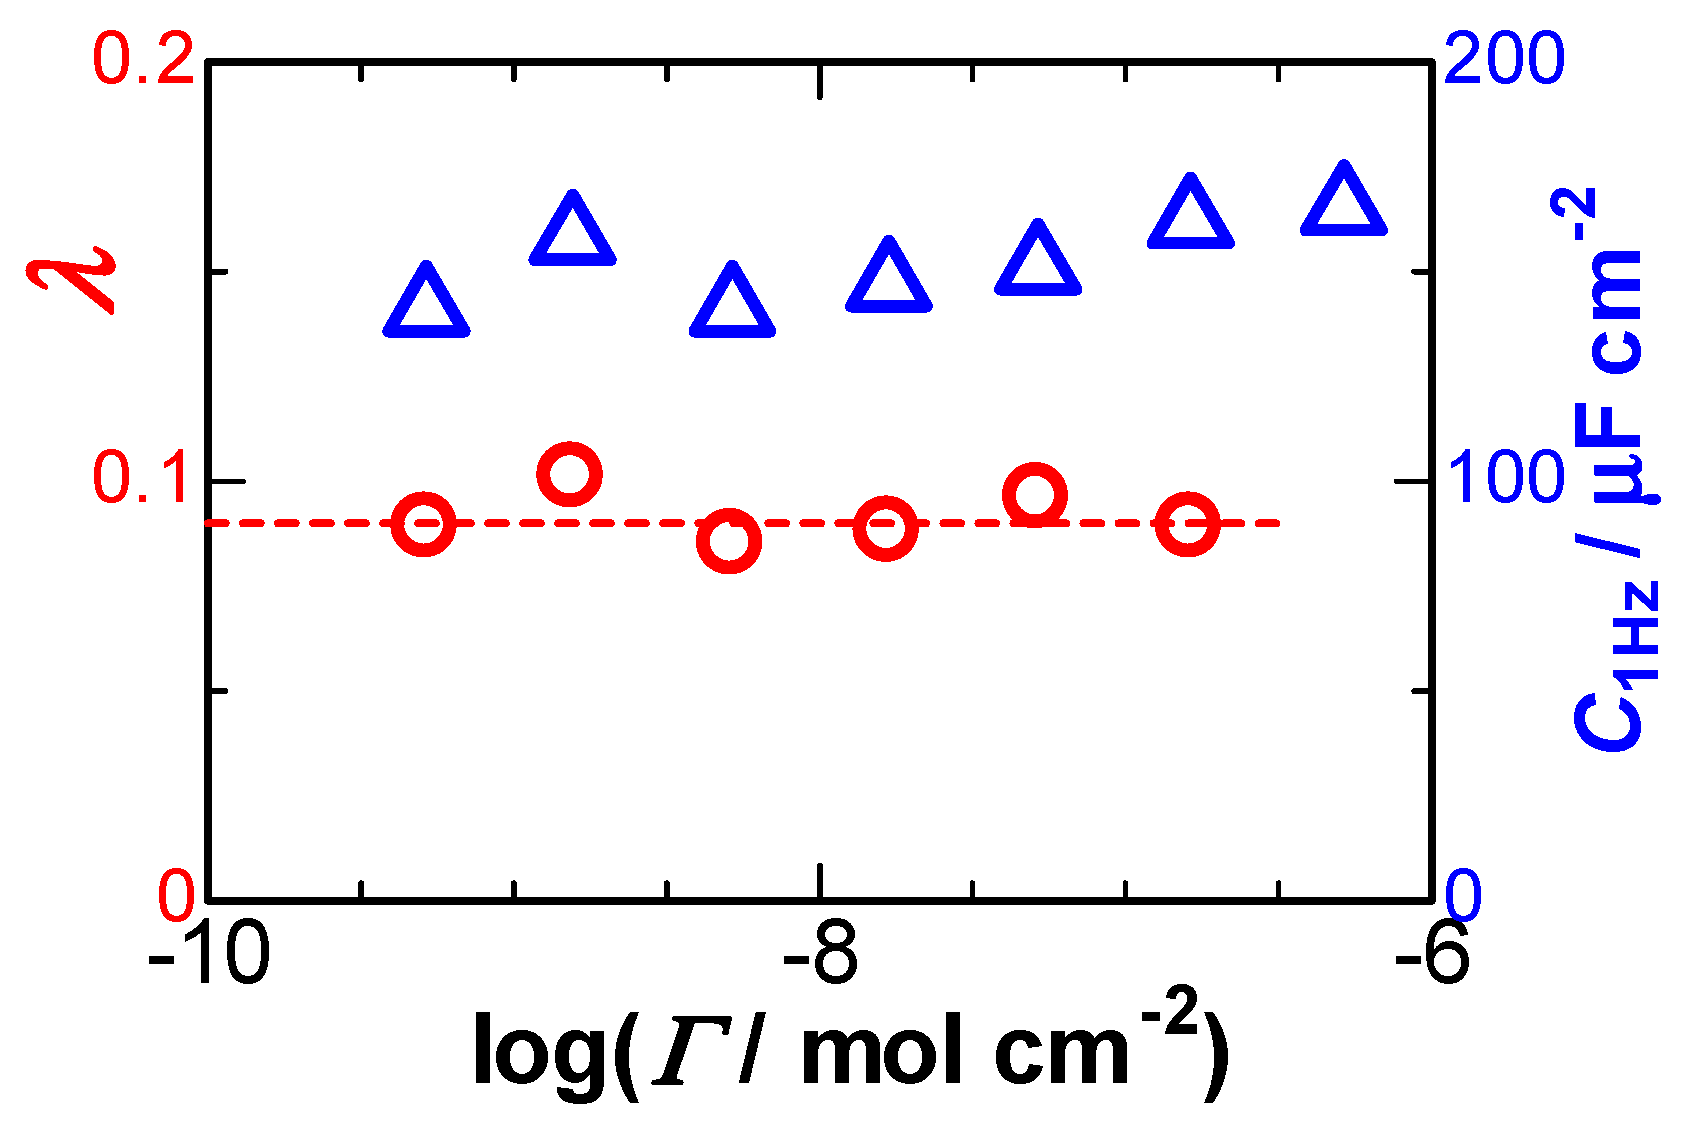
Our aim is to evaluate Rct and C1Hz as a function of Γ by use of Eq. (3) or (4). Although Eq. (4) is mathematically equivalent to Eq. (3), it does not include frequency–dependence explicitly. The frequency–dependence in Eq. (3) can be examined through linearity of log Y2 with log f, whereas Eq. (4) is limited to curve–fitting without examination of the dependence [30,31]. We apply the admittance to Eq. (3), paying attention to the frequency–dependence. Values of λ determined from the plot of log Y2 vs. log f were almost constant (0.09) for log Γ < –6.5 in Figure 4A, where the lowest Γ corresponds to a monomolecular layer of the AgCl film. The constant means that Y2 should be controlled by the conventional frequency dispersion (Eq. (2)). The intercept of the log Y2 vs. log f (Figure 2B) provides C1Hz, according to Eq. (3). The variation of the thus evaluated C1Hz with log(Γ) is shown in Figure 4. Values of C1Hz range from 140 to 160 μF cm–2, being almost independent of Γ. Therefore, the DLC should be provided only with the geometrical surface area of the Ag electrode. The gradual increase in C1Hz with logΓ may be ascribed to enhancement of the surface roughness caused by the iterative surface ac–modulation in the series of experimental runs.
The real part in Eq. (3) indicates that logY1 is not linear with log f owing to 1/Rct. The equation of logY1 can be approximated for high frequency and large values of Rct as
log Y1 ≈ (1–λ)log f + log(2πC1Hz) + 1/(RctλC1Hz f1–λ)
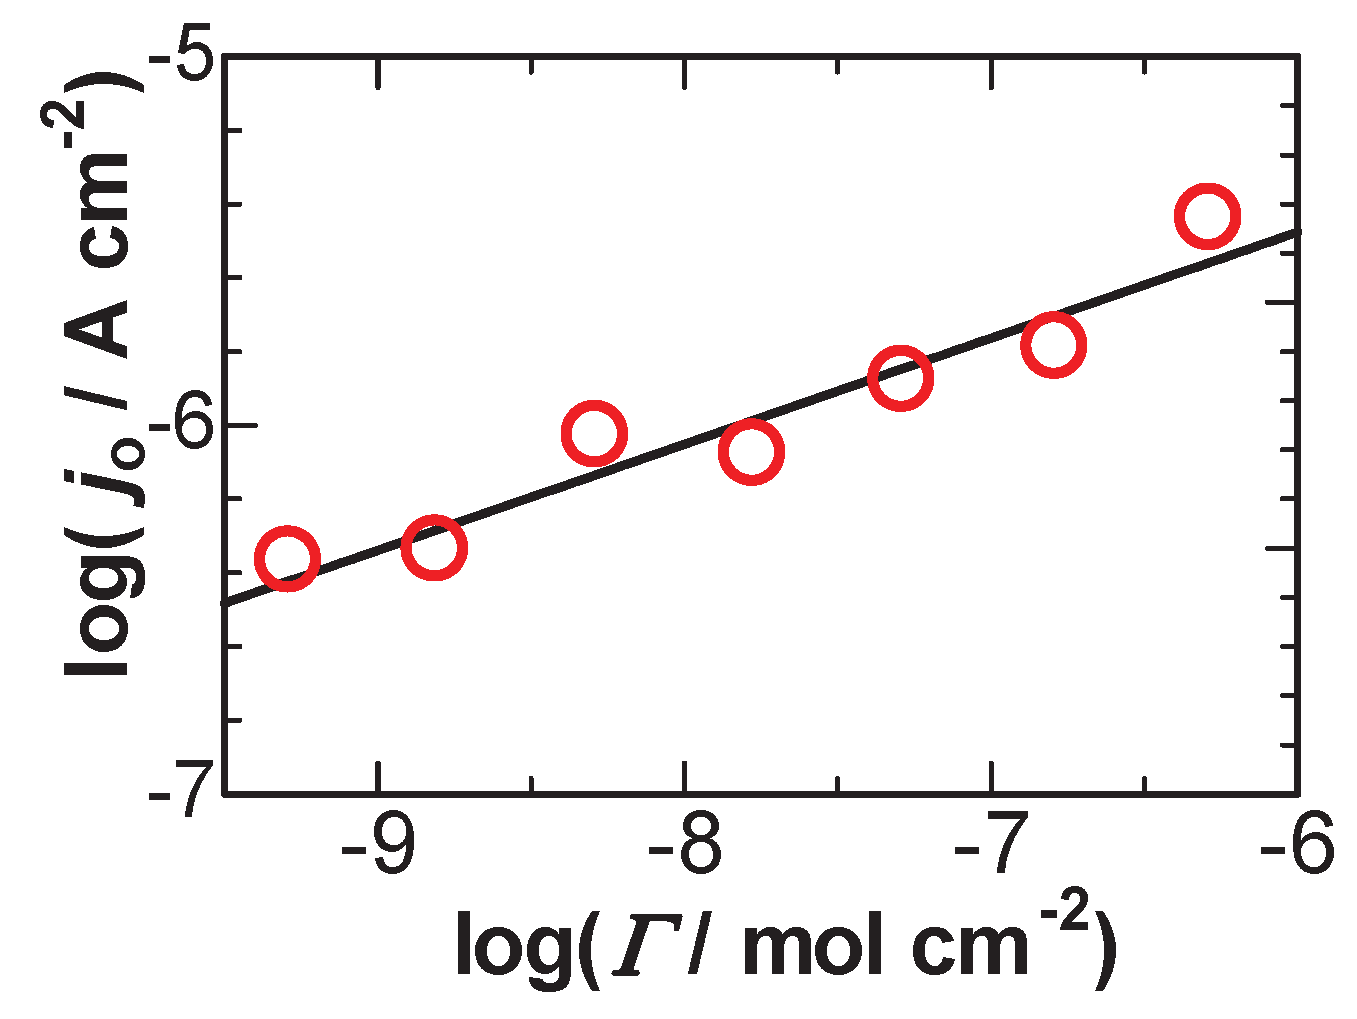
It suggests a linear plot of log Y1 against log f at high frequency with a slope of 1–λ and an intercept of log(2πC1Hz) + 1/(RctλC1Hz) for a known value of λ. The intercept gives values of Rct from the known values of λ and C1Hz. Since values of Rct are often proportional to experimentally used electrode areas, A. they are not universally physicochemical parameters. A universal, kinetic parameter is the exchange current density through j0 = RT/FRctA. Figure 5 shows the plot thus determined variation of j0 against Γ, which can be represented by an empirical relation,
j0 /A cm–2 = 1.86×10⁻⁴ (Γ /mol cm–2)0.3
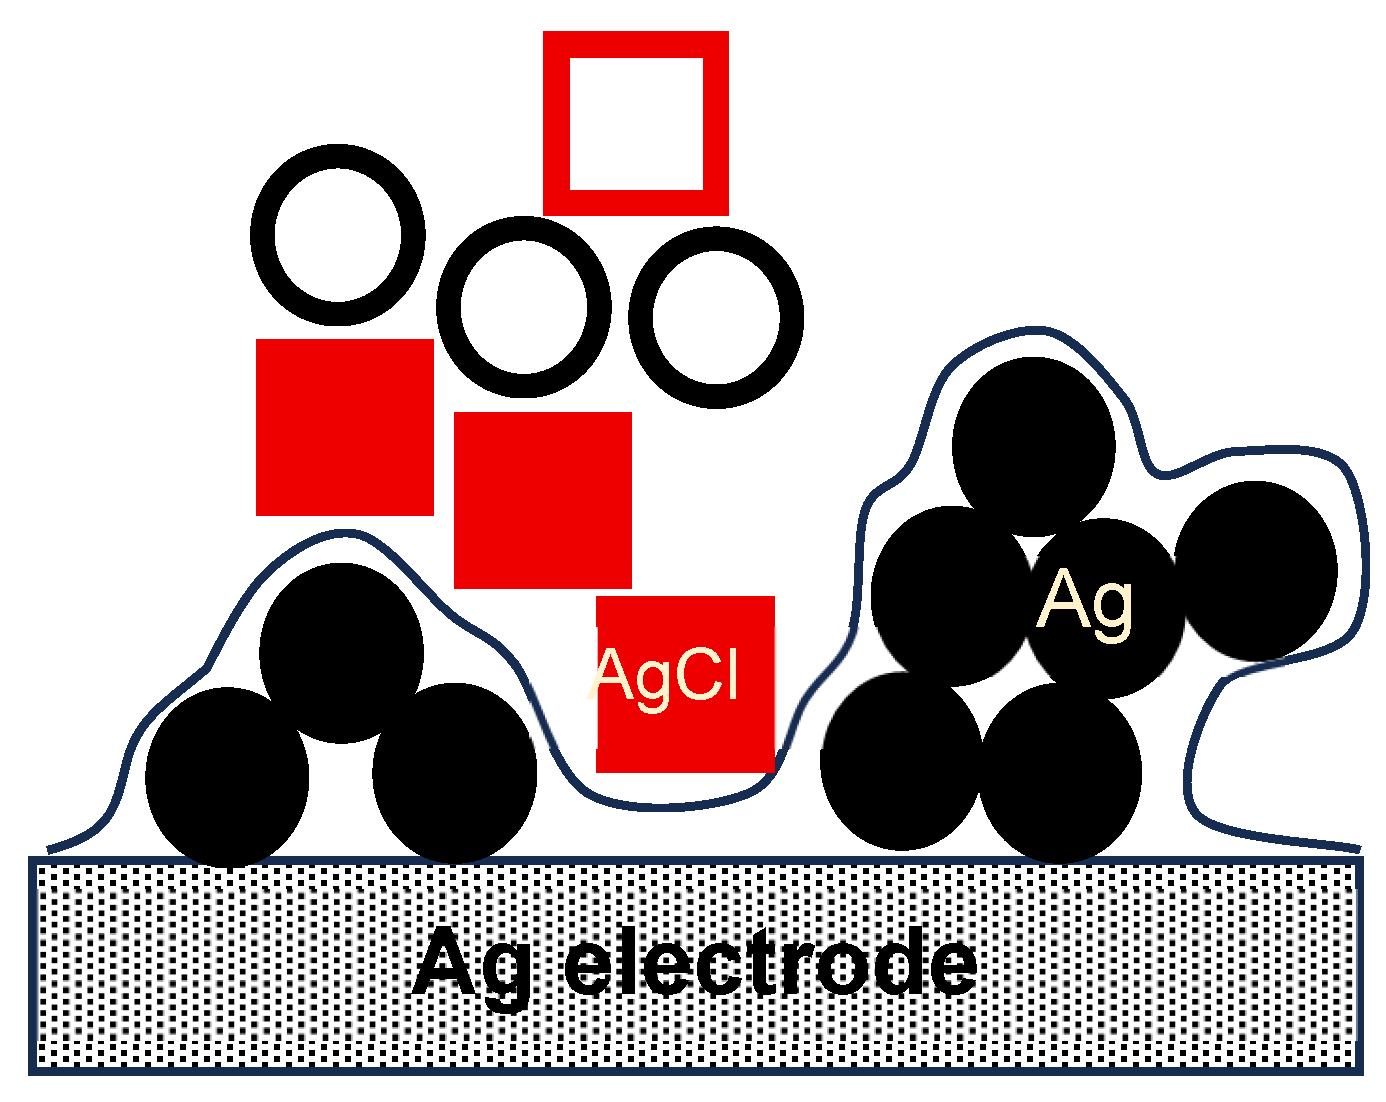
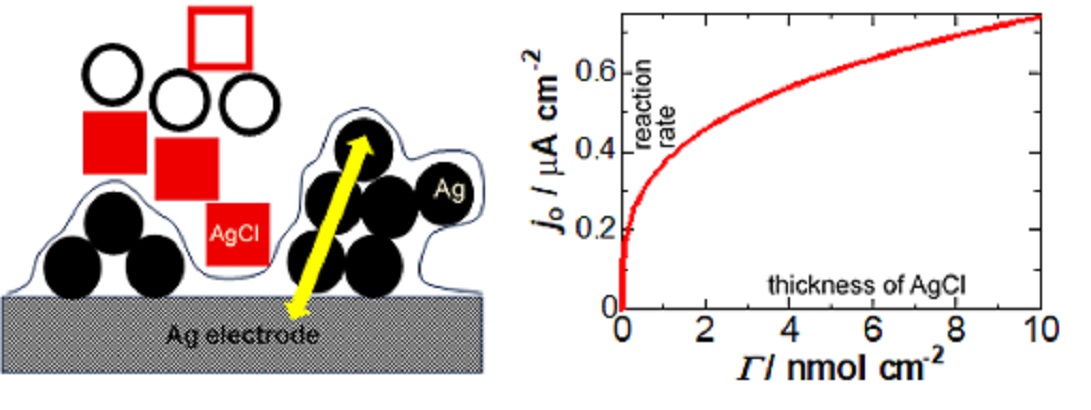
The fractional power of Γ in Eq. (6) implies that the reaction could not occur at a plateau of the Ag electrode but would do at a fluctuated surface of Ag particles electrically connected to the Ag electrode, as illustrated in Figure 6. For example, Ag particles described by open circles in Figure 6 cannot work as an electrode because of a loss of electric connection to the Ag electrode, while the Ag particles with the filled circles have electric connection to the electrode. The latter can function as a surface for the electrode reaction.
The area of the boundary between the electrically connected Ag particles and the solution is increased with an increase in the film thickness, exhibiting fluctuated rough surfaces [32]. The ratio of the boundary area to the geometrical Ag area is proportional to the fractional power (0.3) of the thickness. Electrode reactions associated with electrical connection or disconnection have been found to generate fluctuated surfaces, as observed in iterative redox reactions of polyaniline films [33,34,35]. Although this larger area should generate a capacitance, Cconnect, larger than C1Hz (140±10 μF cm–2), Cconnect cannot be observed because the inverse of the detected capacitance is 1/Cconnect + 1/C1Hz.
The smallest value of Γ (= 5.2×10⁻¹⁰ mol cm–2) may correspond to a monolayer adsorption of AgCl. The smallest j0–value (j0sm = 4.3×10⁻⁷ A cm–2) for this Γ can be regarded as a physicochemically significant quantity for discussing the standard charge transfer rate constant k0 through j0 = Fk0c = Fk0Γ/δ, where c is the concentration of a redox species, and δ is a distance between neighboring adsorbed redox species, 0.56 nm for a crystalline AgCl. It can be expressed also by Eq. (6). Extracting k0 by use of the density d = ΓWM/δ yields
k0 = (1.86×10⁻⁴ A cm–2)WMΓ 0.3 /Fd = 2.8×10⁻⁷Γ 0.3 cm s–1
for d = 1 g cm–3 in the right term. When AgCl films are 10 times, 102 times and 104 times larger than the that of monolayer, the values of k0 are, respectively, 1×10⁻⁹, 2×10⁻⁹ and 7×10⁻⁹ cm s–1. These values belong to the totally irreversible domain although the power (0.3) of Γ in Eq. (7) can enhance slightly the reversibility with an increase in the thickness. These determined values are much smaller than those (Table 1) reported so far. A main reason for the smallness is the fractal area of the Ag particles much larger than the geometrical area of the electrode.
When current 1 nA flows in an Ag|AgCl electrode, values of Rct ranging from 0.1 MΩ to 1 MΩ provide the interfacial voltages from 1 mV to 10 mV, which may be neglected in practical voltammetry. Thus, Ag|AgCl reference electrodes would be used as counter electrodes for a two–electrode cell configuration, as has been carried out in miniaturization of reference electrodes [36] without counter electrodes in a two–electrode cell [4,6]. It is worth while to examine quantitatively this prediction. It is assumed that the current I flows through both a working and a reference electrode in a two–electrode cell. The voltage at Rct is given by ΔV = IRct = I(RT/FAj0) with the help of j0 = RT/FRctA, where A is the area of the reference electrode. When Eq. (6) is inserted into the above j0, the condition of keeping ΔV < 1 mV is (RT/F)(I/A)(104/1.86 Γ 0.3) < 1 mV or
I/0.3 < 0.72×10⁻⁵
at 25oC at the units of ampere for I, cm2 for A and mol cm–2 for Γ. Examples of the maximum area of Ag|AgCl for some combinations are shown in Table 2.

4. Conclusions

The electrochemical reaction between Ag and AgCl has the standard rate constant of 10–9 cm s–1 order, which belongs to the totally irreversible domain. However, it has been extensively used as a reversible reference electrode. The contradiction results in the magnitude of the currents in a two–electrode cell; normal voltammetric currents of μA order in magnitude yield 1 V voltage drop at the interface for Rct = 1 MΩ, whereas currents of 1 nA order yield only 1 mV voltage drop across the interface. Therefore, microelectrode voltammetry can be carried out at a two–electrode cell.
The plots of logY2 vs. log f, which can represent the properties of the DLC, took a line, independent of values of Γ. Thus, the DLC should be determined only by the area of the Ag–electrode. The value of the DLC is 140 μF cm–2, which is caused by delocalized charge of AgCl dipoles rather than water dipoles. In contrast, Rct evaluated from the logarithmic plots of Y1 vs. f varies with the film thickness although it is a property of an electrode|solution interface. This interface is not for the DLC at the planar Ag–electrode|solution but is for the charge transfer at the fluctuated surface of Ag–particles electrically percolated to the electrode.

Author Contributions

Conceptualization, K.J.A; methodology, K.J.A. and J.C.; investigation, K.J.A. and J.C.; writing—original draft preparation, K.J.A; writing—review and editing, K.J.A and J.C.; supervision, K.J.A; project administration, J.C.; funding acquisition, K.J.A and J.C. All authors have read and agreed to the published version of the manuscript.

Funding

This research received no external funding.

Institutional Review Board Statement

Not applicable.

Data Availability Statement

Ask K.J.A. at d930099@yahoo.co.jp.

Conflicts of Interest

The authors declare no conflicts of interest.

References

  1. Ives, D.J.G.; Janz, G.J. Reference Electrodes: Theory and Practice; Academic Press Inc.: New York, 1961. [Google Scholar]
  2. Maksimov, I.; Asakai, T.; Ohata, M. On the optimal use of silver–silver chloride reference electrodes. Accred. Qual. Assur. 2023, 28, 65–68. [Google Scholar] [CrossRef]
  3. Dawkins, R.C.; Wen, D.; Hart, J.N.; Vepsalainen, M. A screen–printed Ag/AgCl reference electrode with long–term stability for electroanalytical applications. Electrochim. Acta 2021, 393, 139043. [Google Scholar] [CrossRef]
  4. Lee, Y.–.G.; Han, J.; Kwon, S.; Kang, S.; Jang, A. Development of a rotary disc voltammetric sensor system for semi–continuous and on–site measurements of Pb(II). Chemosphere 2016, 143, 78–84. [Google Scholar] [CrossRef] [PubMed]
  5. Shinwari, M.W.; Zhitomirsky, D.; Deen, I.A.; Selvaganapathy, P.R.; Deen, M.J.; Landheer, D. Microfabricated Reference Electrodes and their Biosensing Applications. Sensors 2010, 10, 1679–715. [Google Scholar] [CrossRef] [PubMed]
  6. Lee, Y.–.G.; Jang, A.J. Effect of the working and counter/quasi–reference electrode relative area ratio of silver sensor electrodes on voltammetric detection of Pb(II). Ind. Eng. Chem. 2020, 81, 67–70. [Google Scholar] [CrossRef]
  7. Zhao, Z.; Tu, H.; Kim, E.G.R.; Sloane, B.F.; Xu, Y. A flexible Ag/AgCl micro reference electrode based on a parylene tube structure. Sens. Act. B 2017, 247, 92–97. [Google Scholar] [CrossRef] [PubMed]
  8. Brewer, P.J.; Brown, R.J.C. Effect of Structural Design of Silver/Silver Chloride Electrodes on Stability and Response Time and the Implications for Improved Accuracy in pH Measurement. Sensors 2009, 9, 118–130. [Google Scholar] [CrossRef] [PubMed]
  9. Brewer, M.G.; Baldi, A.; Merlos, A.; Sanchez, C.F. Array of individually addressable two–electrode electrochemical cells sharing a single counter/reference electrode for multiplexed enzyme activity measurements. Bios. Bioelect. 2022, 201, 113952. [Google Scholar] [CrossRef]
  10. Xu, Q.; Xi, Y.; Wang, L.; Xu, M.; Ruan, T.; Du, Z.; Jiang, C.; Cao, J.; Zhu, X.; Wang, X.; Yang, B.; Liu, J. In situ self–referenced intracellular two–electrode system for enhanced accuracy in single–cell analysis. Bios. Bioelect. 2024, 253, 116173. [Google Scholar] [CrossRef] [PubMed]
  11. Wang, N.; Wang, D.; Pan, R.; Wang, D.; Jiang, D.; Chen, H.–.Y. Self–Referenced Nanopipette for Electrochemical Analysis of Hydrogen Peroxide in the Nucleus of a Single Living Cell. Anal. Chem. 2021, 31, 10744–10749. [Google Scholar] [CrossRef] [PubMed]
  12. Miah, M.R.; Sen, D.; Rahman, M.A.; Siddiquey, I.A.; Alam, M.M. Conductometric Studies of Kinetics of Ionic Reaction between Ag And Cl in Aqueous Solution. Int. J. Sci. Tec. Res. 2017, 6, 52–56. [Google Scholar]
  13. Neha; Kant, R. Theory for Outer Sphere Electron Transfer Coupled with Ion Transfer Kinetics on Atomically Stepped Metal. J. Phys. Chem. C 2024, 128, 12399–12413. [Google Scholar] [CrossRef]
  14. Poovan, F.; Chandrashekhar, V.G.; Natte, K.; Jagadeesh, R.V. Synergy between homogeneous and heterogeneous catalysis. Catal. Sci. Technol. 2022, 12, 6623–6649. [Google Scholar] [CrossRef]
  15. Ha, H.; Payer, J. The effect of silver chloride formation on the kinetics of silver dissolution in chloride solution. Electrochim. Acta 2011, 56, 2781–2791. [Google Scholar] [CrossRef] [PubMed]
  16. Despic, A.R.; Bockris, J.O.M. Kinetics of the deposition and dissolution of silver. J. Chem. Phys. 1960, 32, 389. [Google Scholar] [CrossRef]
  17. Tjon, K.C.E.; Yuan, J. Impedance characterization of silver/silver chloride micro–electrodes for bio–sensing applications. Electrochim. Acta 2019, 320, 134638. [Google Scholar] [CrossRef]
  18. Lu, X.; Hu, J.; Feng, X.; Zhou, Q.; Qu, Z.; Zhang, J.; Zhu, R.; Zhang, H.; Chen, S. Long–Lifetime Ag/AgCl Electrodes Prepared by Pulse Current Electrodeposition for Chloride Monitoring in the Concrete Environment. Sens. 2025, 25, 5032. [Google Scholar] [CrossRef] [PubMed]
  19. Lasia, A. Modern Aspects of Electrochemistry; White, R.E., Conway, B.E., Bockris, J.O.’.M., Eds.; 32; Kluwer Academic/Plenum Publishers: New York, 1999; p. 143. [Google Scholar]
  20. Brug, G.J.; Van Den Eeden, A.L.G.; Sluyters–Rehbach, M.; Sluyters, J.H. J. Electroanal. Chem. 1984, 176, 275–295. [CrossRef]
  21. Zoltowski, P. On the electrical capacitance of interfaces exhibiting constant phase element behaviour. J. Electroanal. Chem. 1998, 443, 149–154. [Google Scholar] [CrossRef]
  22. Nyikos, L.; Pajkossy, T. Fractal dimension and fractional power frequency–dependent impedance of blocking electrodes. Electrochim. Acta 1985, 30, 1533–1540. [Google Scholar] [CrossRef]
  23. Schalenbach, M.; Durmus, Y.E.; Robinson, S.A.; Tempel, H.; Kungl, H.; Eichel, R.A. Physicochemical Mechanisms of the Double–Layer Capacitance Dispersion and Dynamics: An Impedance Analysis. J. Phys. Chem. C 2021, 125, 5870–5879. [Google Scholar] [CrossRef]
  24. Low, C.T.J.; Leon, C.P.de; Walsh, F.C. Copper deposition and dissolution in mixed chloride–sulphate acidic electrolytes: cyclic voltammetry at static disc electrode. Trans. IMF 2015, 93, 74–81. [Google Scholar] [CrossRef]
  25. Hou, Y.; Aoki, K.J.; Chen, J.; Nishiumi, T. Invariance of double layer capacitance to polarized potential in halide solutions. Univ. J. Chem. 2013, 1, 162–169. [Google Scholar] [CrossRef]
  26. Nair, R.K.P. Electric dipole moment of the diatomic AgCl molecule. J. Phys. B 1985, 17, 735. [Google Scholar] [CrossRef]
  27. Das, S.; Banerjee, A.; Nandi, U.; Ghosh, A. Critical review on the analysis of electrochemical impedance spectroscopy data. J. Appl. Phys. 2025, 138, 125002. [Google Scholar] [CrossRef]
  28. Abouzari, M.R.S.; Berkemeier, F.; Schmitz, G.; Wilmer, D. On the physical interpretation of constant phase elements. Solid State Ion. 2009, 180, 922–927. [Google Scholar] [CrossRef]
  29. Mulder, W.H.; Sluyters, J.H. An explanation of depressed semi–circular arcs in impedance plots for irreversible electrode reactions. Electrochim. Acta 1988, 33, 303–310. [Google Scholar] [CrossRef]
  30. Huang, J.; Li, Z.; Liaw, B.Y.; Zhang, J. Graphical analysis of electrochemical impedance spectroscopy data in Bode and Nyquist representations. J. Power Sour. 2016, 309, 82–98. [Google Scholar] [CrossRef]
  31. Lazanas, A.C.; Prodromidis, M.I. Electrochemical Impedance Spectroscopy–A Tutorial. ACS Meas. Sci. 2023, 3, 162–193. [Google Scholar] [CrossRef] [PubMed]
  32. Stauffer, D. Introduction to Percolation Theory; Taylor and Francis: London, 1985. [Google Scholar]
  33. Aoki, K.; Aramoto, T.; Hoshino, Y. Photographic measurements of propagation speeds of the conducting zone in polyaniline films during electrochemical switching. J. Electroanal. Chem. 1992, 340, 127–135. [Google Scholar] [CrossRef]
  34. Aoki, K.; Cao, J.; Hoshino, Y. Logarithmic Relaxation of Electrochemical Insulating–to–Conducting Conversion at Polyaniline Films: Interpretation by Electric Percolation. Electrochim. Acta 1994, 39, 2291–2297. [Google Scholar] [CrossRef]
  35. Han, T.; Song, T.; Gan, J.; Han, D.; Niu, L. Frequency Dependence of Effective Capacitance Cec for Polyaniline Membrane–Based pH Sensor and its Extension to the Gouy–Chapman–Stern Model. Electrochem 2026, 7, 10. [Google Scholar] [CrossRef]
  36. Kahlert, H. Chapter 11, Micro–reference Electrodes. In Handbook of Reference Electrodes; Inzelt, G., Ed.; Springer–Verlag Berlin, 2013. [Google Scholar] [CrossRef] [PubMed]
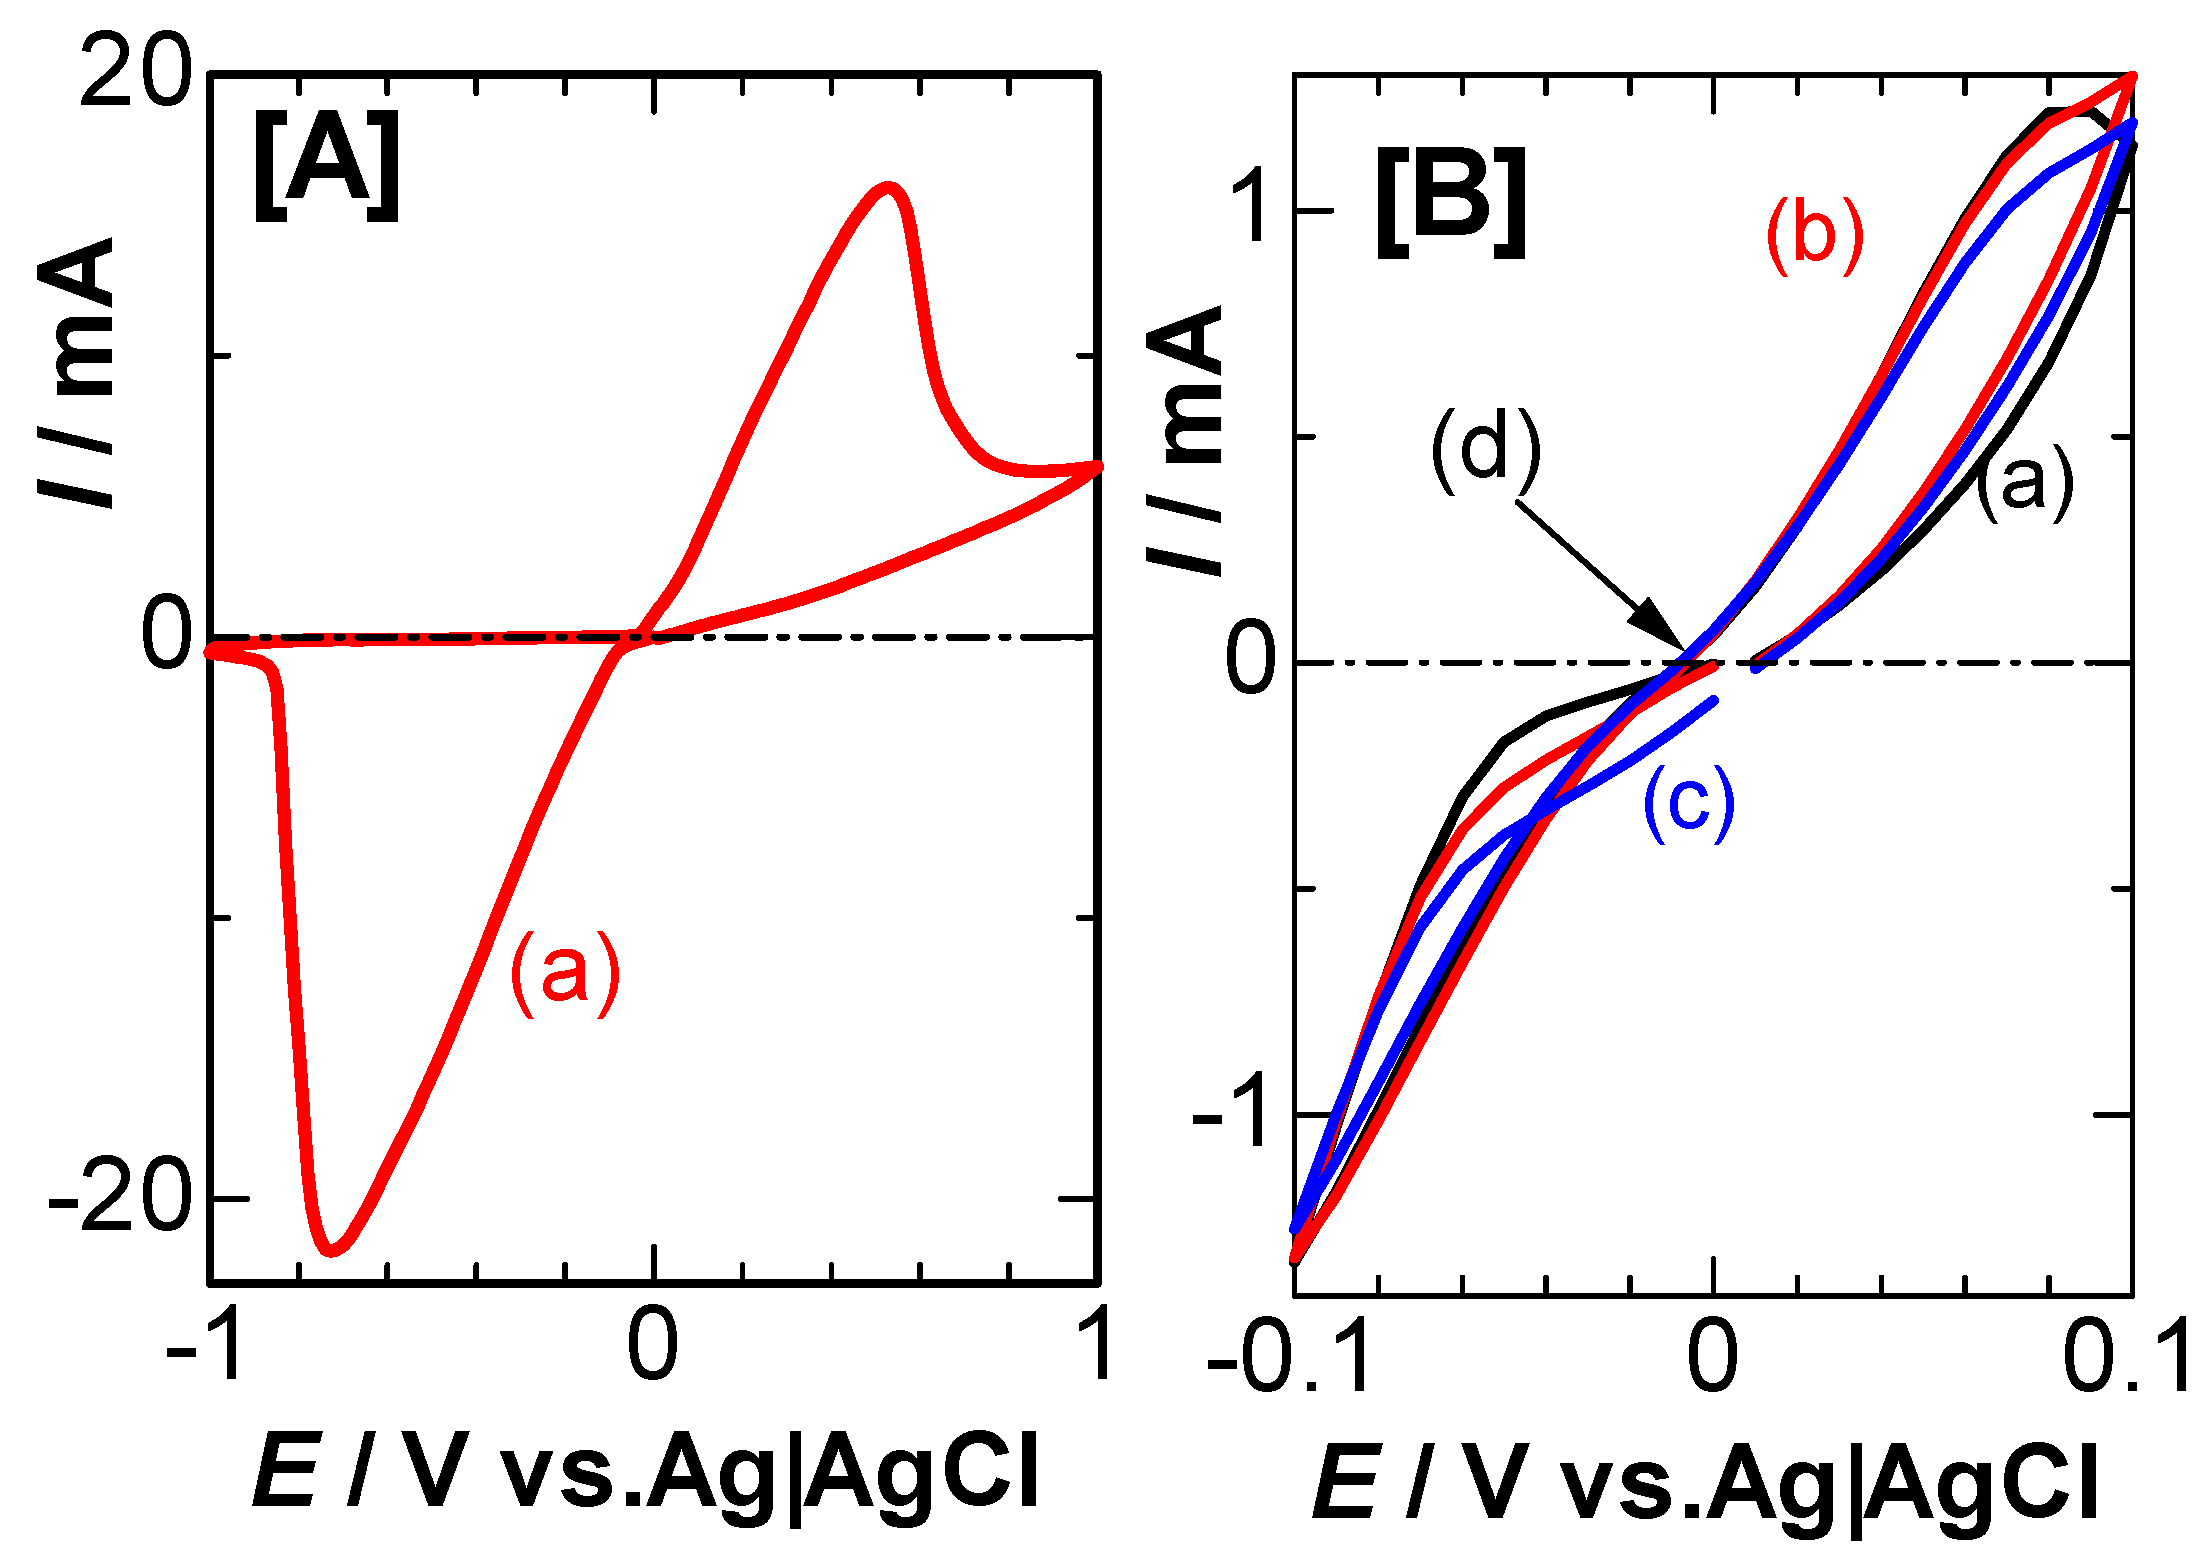
Figure 1. Cyclic voltammograms at the Ag working electrode in NaCl solution with pH 7 for v = (a) 0.03, (b) 0.1 and (c) 0.2 V s–1 in the [A] wide and [B] narrow domain.
Preprints 218483 g001
Figure 2. Nyquist plots [A] and the frequency dependence of Y [B] at the Ag wire electrode for Γ = (a) 0, (b) 5.2×10⁻¹⁰, (c) 1.6×10⁻⁹, (d) 5.2×10⁻⁹, (e) 1.7×10⁻⁸ mol cm–2. Open circuit potentials were (a) –0.065, (b) 0.025 and (c)–(e) 0.004 V in the solution of pH 7. Line (e') was computed from Eq. (6).
Preprints 218483 g002
Figure 3. Semicircles expressed by Eq. (3) for λ = 0 (dashed) and 0.5 (solid).
Preprints 218483 g003
Figure 4. Variations of λ (circles) and C1Hz (triangles) with log(Γ ), obtained from Figure 2B.
Preprints 218483 g004
Figure 5. Logarithmic variation of j0 with Γ, obtained from Eq. (5).
Preprints 218483 g005
Figure 6. Illustration of an AgCl film mixed with AgCl particles (squares) and Ag particles (circles), where the filled circles are electrically percolated to the electrode and open ones are not.
Preprints 218483 g006
Table 1. Reported exchange current density of Ag|AgCl.
j0 / mA cm–2 Techniques Rate determining step ref.
0.13 quasi–steady–state IV curves mixed activation–ohmic step [15]
100 chronopotentiometry surface diffusion kinetics [16]
30 – 110 ac–impedance change in [Cl] by resistance of AgCl [17]
4×10⁻⁵–10–4 Tafel slopes porosity of AgCl [18]
Table 2. Maximum areas (mm2) of satisfying ΔV < 1 mV for some values of I and Γ.
Γ / mol cm–2 I= 1 nA I= 10 nA
10–8 3.5 35
10–7 0.017 0.17
10–6 0.01 0.09
Disclaimer/Publisher’s Note: The statements, opinions and data contained in all publications are solely those of the individual author(s) and contributor(s) and not of MDPI and/or the editor(s). MDPI and/or the editor(s) disclaim responsibility for any injury to people or property resulting from any ideas, methods, instructions or products referred to in the content.
Copyright: This open access article is published under a Creative Commons CC BY 4.0 license, which permit the free download, distribution, and reuse, provided that the author and preprint are cited in any reuse.
Prerpints.org logo

Preprints.org is a free preprint server supported by MDPI in Basel, Switzerland.

Subscribe

© 2026 MDPI (Basel, Switzerland) unless otherwise stated

Accessibility

Disclaimer

Terms of Use

Privacy Policy

Privacy Settings