
Submitted:
13 June 2026
Posted:
25 June 2026
You are already at the latest version
Abstract
Fresh camel meat is an important red meat source, but culture-independent evidence on its bacterial community changes during refrigerated storage remains limited. This study used 16S ribosomal RNA (16S rRNA) gene amplicon sequencing to profile camel meat from three retail meat stores and three anatomical cuts, sampled at Day 0 and after seven days of aerobic storage at 5 °C. After preprocessing, 38 samples were retained for diversity, community composition, taxonomic, and amplicon sequence variant (ASV)-level differential abundance analyses. Model-estimated richness decreased from 217.96 at Day 0 to 63.81 at Day 7, while Shannon diversity increased and Simpson index values decreased, indicating storage-associated changes in both richness and relative-abundance structure. Storage duration was significantly associated with Bray–Curtis community variation (R² = 0.107, p = 0.001), whereas anatomical cut did not show a significant global community-level effect. Butcher source differed in multivariate dispersion, indicating source-level variability in community structure. Differential abundance analysis identified 59 storage-associated ASV features, including enrichment of Pseudomonas-assigned features at Day 7. Overall, aerobic refrigerated storage was associated with reduced richness, altered bacterial community composition, and increased relative abundance of Pseudomonas-assigned ASV features in camel meat.
Keywords:
camel meat
; bacterial community
; 16S rRNA gene sequencing
; refrigerated storage
; biodiversity
1. Introduction
Microbial spoilage remains a major constraint on the refrigerated shelf life, quality, and marketability of fresh meat [1,2]. Refrigeration slows microbial growth, but it does not prevent the development of psychrotrophic bacteria that can grow under low-temperature storage [3,4]. The bacterial communities that emerge on meat reflect initial contamination, storage temperature, oxygen availability, packaging atmosphere, handling practices, and contact with processing or retail environments [1,3,4,5]. These factors influence not only microbial load, but also the composition of the spoilage-associated community that develops during storage [6].
Aerobic refrigerated storage is particularly important because oxygen availability can favor aerobic psychrotrophic taxa [4,7]. Among these, members of Pseudomonas are frequently reported in aerobically stored chilled meat because they grow at refrigeration temperatures and compete effectively under oxygenated conditions. However, spoilage-associated communities are not uniform across storage systems [6]. Aerobic, vacuum-packaged, and modified-atmosphere conditions can select for different bacterial groups [3,5]. Processing and retail environments can also shape initial microbial profiles, and spoilage-associated bacteria may overlap between meat products and meat-processing environments [7,8,9].
Camel meat is an important red meat in Middle Eastern, African, and Asian regions and has gained attention because of its nutritional composition and potential as an alternative red meat source [10,11]. Despite this relevance, microbiological research on camel meat remains less developed than comparable work on beef and poultry [12]. Existing camel meat studies have mainly examined culture-based microbial indicators, sensory quality, irradiation, packaging, marination, or antimicrobial preservation strategies [13,14,15]. For example, refrigerated camel meat has been evaluated after gamma irradiation, and marinated camel meat has been studied under aerobic and vacuum-packaged storage with essential oil treatments. These studies provide useful information on microbial quality and preservation, but they do not resolve the broader bacterial community structure of fresh camel meat during refrigerated storage.
Culture-independent sequencing provides a wider view of meat-associated bacterial communities than targeted culture-based enumeration [7,16]. In meat systems, 16S ribosomal RNA (16S rRNA) gene amplicon sequencing has been used to characterize bacterial community changes during refrigerated storage and to compare microbial profiles across storage temperatures, meat types, and anatomical parts [7]. This approach can identify changes in diversity, taxonomic composition, and community structure that conventional plate counts may miss [17].
Previous camel meat studies provide useful information on microbial quality and preservation, but they offer limited insight into community-level bacterial changes during aerobic refrigerated storage [11,12,13,14]. This gap is important because fresh camel meat may enter retail storage with microbial communities shaped by both the meat matrix and the handling environment. In particular, to the best of the knowledge, no study is available on fresh camel meat microbiota using 16S rRNA gene amplicon sequencing in designs that consider storage duration, anatomical cut, and butcher-source variability together. Anatomical cuts may differ in surface exposure, tissue composition, handling, and contact with equipment, while butcher source may influence baseline microbial communities through differences in sanitation, tools, surfaces, and local handling practices [9]. Accounting for these factors can help distinguish storage-associated microbial shifts from variation introduced by tissue type or retail source.
Therefore, the present study investigated bacterial community changes in fresh camel meat collected from three butcher shops and three anatomical cuts, evaluated immediately after collection and after seven days of aerobic refrigerated storage at 5 °C. Using 16S rRNA gene amplicon sequencing, we assessed alpha diversity, Bray–Curtis community composition, taxonomic relative abundance, and multivariable differential abundance at the amplicon sequence variant (ASV) level. The study aimed to determine whether storage duration, anatomical cut, and butcher source were associated with microbial diversity and composition, and to identify ASV features linked to storage-associated community change.
2. Materials and Methods
2.1. Sample Collection and Storage
Meat samples were collected from three retail meat stores located in the Qassim region. From each location, three tissue cuts, back, leg, and shoulder, were obtained, with three biological replicates per cut in the initial sampling design. Samples were transported under chilled conditions at 0–4 °C and processed aseptically within 4h of collection. A subset of each sample was analyzed immediately as Day 0, while the remaining portions were stored aerobically in a hanging position at 5 °C for 7 days.
2.2. DNA Extraction and 16S ribosomal RNA (16S rRNA) Sequencing
Samples (10 g) were aseptically collected from meat surfaces and homogenized in 90 mL of sterile peptone water. An aliquot of 1.8 mL of the homogenate was then transferred to a sterile microcentrifuge tube, and microbial DNA was extracted using the DNeasy PowerFood Microbial Kit (Qiagen, Hilden, Germany) according to the manufacturer’s instructions. The V3–V4 hypervariable region of the 16S rRNA gene was amplified using the forward primer 5′-TCGTCGGCAGCGTCAGATGTGTATAAGAGACAGCCTACGGGNGGCWGCAG-3′ and reverse primer 5′-GTCTCGTGGGCTCGGAGATGTGTATAAGAGACAGGACTACHVGGGTATCTAATCC-3′. Amplicon libraries were sequenced using paired-end sequencing, 2 × 250 bp, on an Illumina MiSeq platform.
2.3. Sequence Processing and Taxonomic Assignment
Raw sequencing reads were quality-checked using FastQC v0.12.1 and MultiQC v1.32 [18,19]. Adapter sequences were removed using Cutadapt v5.1 and downstream processing was performed in QIIME2 v2025.10 [20,21]. Amplicon sequence variants (ASVs) were inferred using the DADA2 plugin v2025.10 implemented in QIIME2, including quality filtering, denoising, paired-end read merging, and chimera removal [22]. Taxonomic classification was performed using the consensus VSEARCH classifier against the SILVA 138 reference database at 99% sequence identity [23]. Non-bacterial sequences, including Eukaryota, Archaea, and unassigned taxa, were removed prior to downstream analyses. Representative ASVs were aligned and a rooted phylogenetic tree was constructed using the QIIME2 phylogeny align-to-tree-mafft-fasttree pipeline. ASVs were filtered to retain sequences within the expected amplicon length range of 440–485 bp, and samples with fewer than 1,000 reads were excluded from downstream analyses [24,25]. Out of the 54 originally collected samples, 38 passed sequencing quality-control thresholds and were retained for downstream analysis. Sample exclusion was based on sequencing and preprocessing criteria, including insufficient read depth after denoising or failure to meet sequence-quality thresholds, before downstream statistical analyses. Sequencing-depth coverage of the retained samples was assessed using rarefaction curves, with the 1,000-read inclusion threshold indicated in Figure S1.
2.4. Diversity and Statistical Analysis
2.4.1. Alpha Diversity
To evaluate alpha diversity, microbial richness was estimated using Breakaway while Shannon and Simpson diversity indices were estimated using DivNet [26,27]. Breakaway-estimated richness was analyzed using the betta_random() framework to test whether richness was associated with storage duration and tissue cut while accounting for butcher-level variability as a random effect [26]. Storage duration and tissue cut were included as fixed effects, and butcher source was included as a random effect. Bayesian hierarchical modelling was additionally performed as a sensitivity analysis for richness using the same fixed- and random-effects structure as the betta_random() model [28]. Shannon and Simpson diversity estimates were analyzed within the DivNet framework using an additive formula including storage duration and tissue cut, with statistical significance assessed using DivNet’s built-in testDiversity() function [27].
2.4.2. Beta Diversity
To reduce low-frequency noise, ASVs with a global relative abundance below 0.005% were removed prior to beta-diversity analysis [29]. Beta diversity was assessed using Bray–Curtis dissimilarities, and community structure was visualized using Principal Coordinate Analysis [30,31].
Homogeneity of multivariate dispersion was evaluated using betadisper()followed by permutation testing with permutest() using 999 permutations [32,33]. Dispersion was assessed separately for storage duration, tissue cut, and butcher source by testing whether distances of samples to group centroids differed among groups.
Differences in microbial community composition were tested using PERMANOVA with adonis2() in the vegan package [32]. Models were run with 999 permutations restricted within butcher source to account for butcher-level grouping in the sampling design. Term-wise PERMANOVA was performed for storage duration and tissue cut, and models were fitted in both Day + Cut and Cut + Day order to assess the influence of sequential term ordering. Pairwise PERMANOVA comparisons were performed for storage duration and tissue cut, with Benjamini–Hochberg false-discovery-rate correction applied to account for multiple testing [34,35].
2.5. Differential Abundance Analysis
Differential abundance analysis was performed on ASV features using Microbiome Multivariable Associations with Linear Models 2 (MaAsLin2) [36]. Feature abundances were normalized by total sum scaling and log-transformed before modelling. Linear models were fitted with storage duration and tissue cut as fixed effects and butcher source as a random effect to account for butcher-level variability. Day 0 and Back were set as the reference categories for storage duration and tissue cut, respectively. Benjamini–Hochberg false-discovery-rate correction was applied across tested features, with FDR-adjusted q values < 0.05 considered significant [35]. Significant ASV features were retained as ASV-level results and were also annotated at genus and phylum levels for biological interpretation.
3. Results
3.1. Alpha Diversity Across Storage Duration and Tissue Types
Following sequence preprocessing, taxonomic filtering, and sample-level quality control, the final dataset comprised 38 samples and 4091 amplicon sequence variants (ASVs) for downstream diversity and compositional analyses. Alpha diversity was evaluated using Breakaway-estimated richness and DivNet-estimated Shannon and Simpson diversity indices (Figure 1).
Breakaway-estimated richness ranged from 34.17 to 469.17 across samples. The betta_random() mixed-effects model for Breakaway-estimated richness identified a significant reduction in richness at Day 7 relative to Day 0 (estimate = −154.15, SE = 21.61, p < 0.001), with model-estimated richness decreasing from 217.96 to 63.81 following storage. Tissue cut did not significantly affect richness. Detailed Breakaway estimates and model outputs are provided in Table S1.
Bayesian hierarchical modelling was performed as a sensitivity analysis and supported the reduction in richness at Day 7 (posterior mean = −161.98, 95% credible interval: −217.89 to −110.39), whereas cut-specific credible intervals contained zero (Figure S2; Table S2).
DivNet-estimated Shannon diversity ranged from 4.97 to 7.25, while Simpson index values ranged from 0.0043 to 0.0324 across the retained samples. Using an additive model including storage duration and tissue cut, DivNet identified a positive Day 7 effect on Shannon diversity (estimate = 1.64, SE = 0.11, p < 0.001) and a negative Day 7 effect on Simpson index values (estimate = −0.0126, SE = 0.0012, p < 0.001). Back samples exhibited higher Shannon diversity relative to Leg samples (estimate = 0.56, SE = 0.15, p < 0.001), whereas Shoulder samples did not differ significantly from Leg samples. Tissue cut did not significantly affect Simpson index values. Sample-level DivNet estimates and uncertainty intervals are provided in Tables S3 and S4.
3.2. Compositional Variation in Microbial Communities Across Storage Duration
Pairwise Bray–Curtis dissimilarities calculated across 703 sample pairs ranged from 0.192 to 1.000, with a mean of 0.808 and a median of 0.879 (Table S5). Lower dissimilarities were observed among some samples from the same butcher and storage timepoint, whereas several Day 0 versus Day 7 comparisons reached the maximum Bray–Curtis value of 1.000, indicating compositional divergence following refrigerated storage.
No significant differences in multivariate dispersion were detected for storage duration or anatomical cut (Figure S3). In contrast, dispersion differed significantly among butcher sources (F = 8.766, p = 0.002), indicating unequal within-group variability across butcher groups.
PERMANOVA with permutations restricted within butcher source identified storage duration as a significant contributor to microbial community variation (R2 = 0.107, F = 4.292, p = 0.001; Table S6). This effect remained significant when storage duration was fitted after anatomical cut in sequential testing (R2 = 0.101, F = 4.049, p = 0.001). Anatomical cut did not significantly affect overall community composition after accounting for storage duration.
Pairwise PERMANOVA with Benjamini–Hochberg false-discovery-rate correction showed that the overall model remained significant between Day 0 and Day 7 microbial communities when anatomical cut was retained in the model (R2 = 0.153, F = 2.047, FDR-adjusted p = 0.001). Because anatomical cut was not significant in the term-wise PERMANOVA after accounting for storage duration, cut-based pairwise comparisons were interpreted as exploratory. The overall models were significant for Back versus Leg (R2 = 0.198, F = 2.964, FDR-adjusted p = 0.001) and Back versus Shoulder (R2 = 0.129, F = 1.557, FDR-adjusted p = 0.003), whereas Leg-versus-Shoulder overall model was not significant (Table S7).
Principal Coordinate Analysis (PCoA) based on Bray–Curtis dissimilarities showed a storage-duration-associated shift in ordination space (Figure 2). PCoA1 and PCoA2 explained 24.5% and 18.1% of the total variation, respectively. The ordination provided a two-dimensional visualization of the storage-duration-associated pattern, while PERMANOVA based on the full Bray–Curtis distance matrix identified a significant storage-duration effect on microbial community composition. Butcher-stratified ordination plots are provided in Figure S4.
3.3. Taxonomic Composition and Relative Abundance of Dominant Microbial Taxa Across Storage Duration
Taxonomic profiling showed storage-associated shifts in the relative abundance of dominant microbial taxa (Figure 3). At the genus level, the selected dominant genera shown in Figure 3A included Psychrobacter, Macrococcus, Pseudomonas, Brochothrix, Acinetobacter, Bacillus, Kocuria, Rothia, Staphylococcus, Enhydrobacter, Carnobacterium, Acetitomaculum, and Acidovorax (Table S8). Day 0 communities showed higher representation of Psychrobacter, Brochothrix, Acinetobacter, and Macrococcus, whereas Day 7 profiles were characterized by higher relative abundance of Pseudomonas in several samples. At Day 0, Psychrobacter exceeded 45% relative abundance in multiple Butcher 2 samples across Back, Leg, and Shoulder cuts. Following refrigerated storage, Pseudomonas increased in selected Day 7 Back and Leg samples, reaching up to 89.8% relative abundance. Brochothrix was abundant in selected samples, including one Day 7 Back sample in which it reached 52.5% relative abundance. Macrococcus also showed high relative abundance in selected samples, exceeding 50% in Butcher 1 Leg and Shoulder samples.
At the phylum level, communities were mainly represented by Bacillota and Pseudomonadota, with lower relative abundances of Actinomycetota, Bacteroidota, Fusobacteriota, Campylobacterota, Deinococcota, and Thermodesulfobacteriota (Figure 3B; Table S9). Day 0 samples showed more variable phylum-level profiles, with contributions from Bacillota, Pseudomonadota, and Actinomycetota. Following refrigerated storage, Pseudomonadota showed higher relative abundance in several Day 7 profiles, exceeding 70% in selected Back and Leg samples.
Clustered heatmap analysis provided visual support for storage-associated differences in genus-level composition, including variation in Pseudomonas, Brochothrix, Psychrobacter, Macrococcus, and Acinetobacter across storage duration, tissue cut, and butcher source (Figure S5). Phylum-level heatmaps showed corresponding variation in dominant phyla, including higher Pseudomonadota abundance in selected Day 7 samples (Figure S6).
Phylogenetic reconstructions summarizing relationships among detected genera and phyla are provided in Figures S7–S8.
3.4. Differentially Abundant ASV Features Identified by Microbiome Multivariable Associations with Linear Models 2 (MaAsLin2)
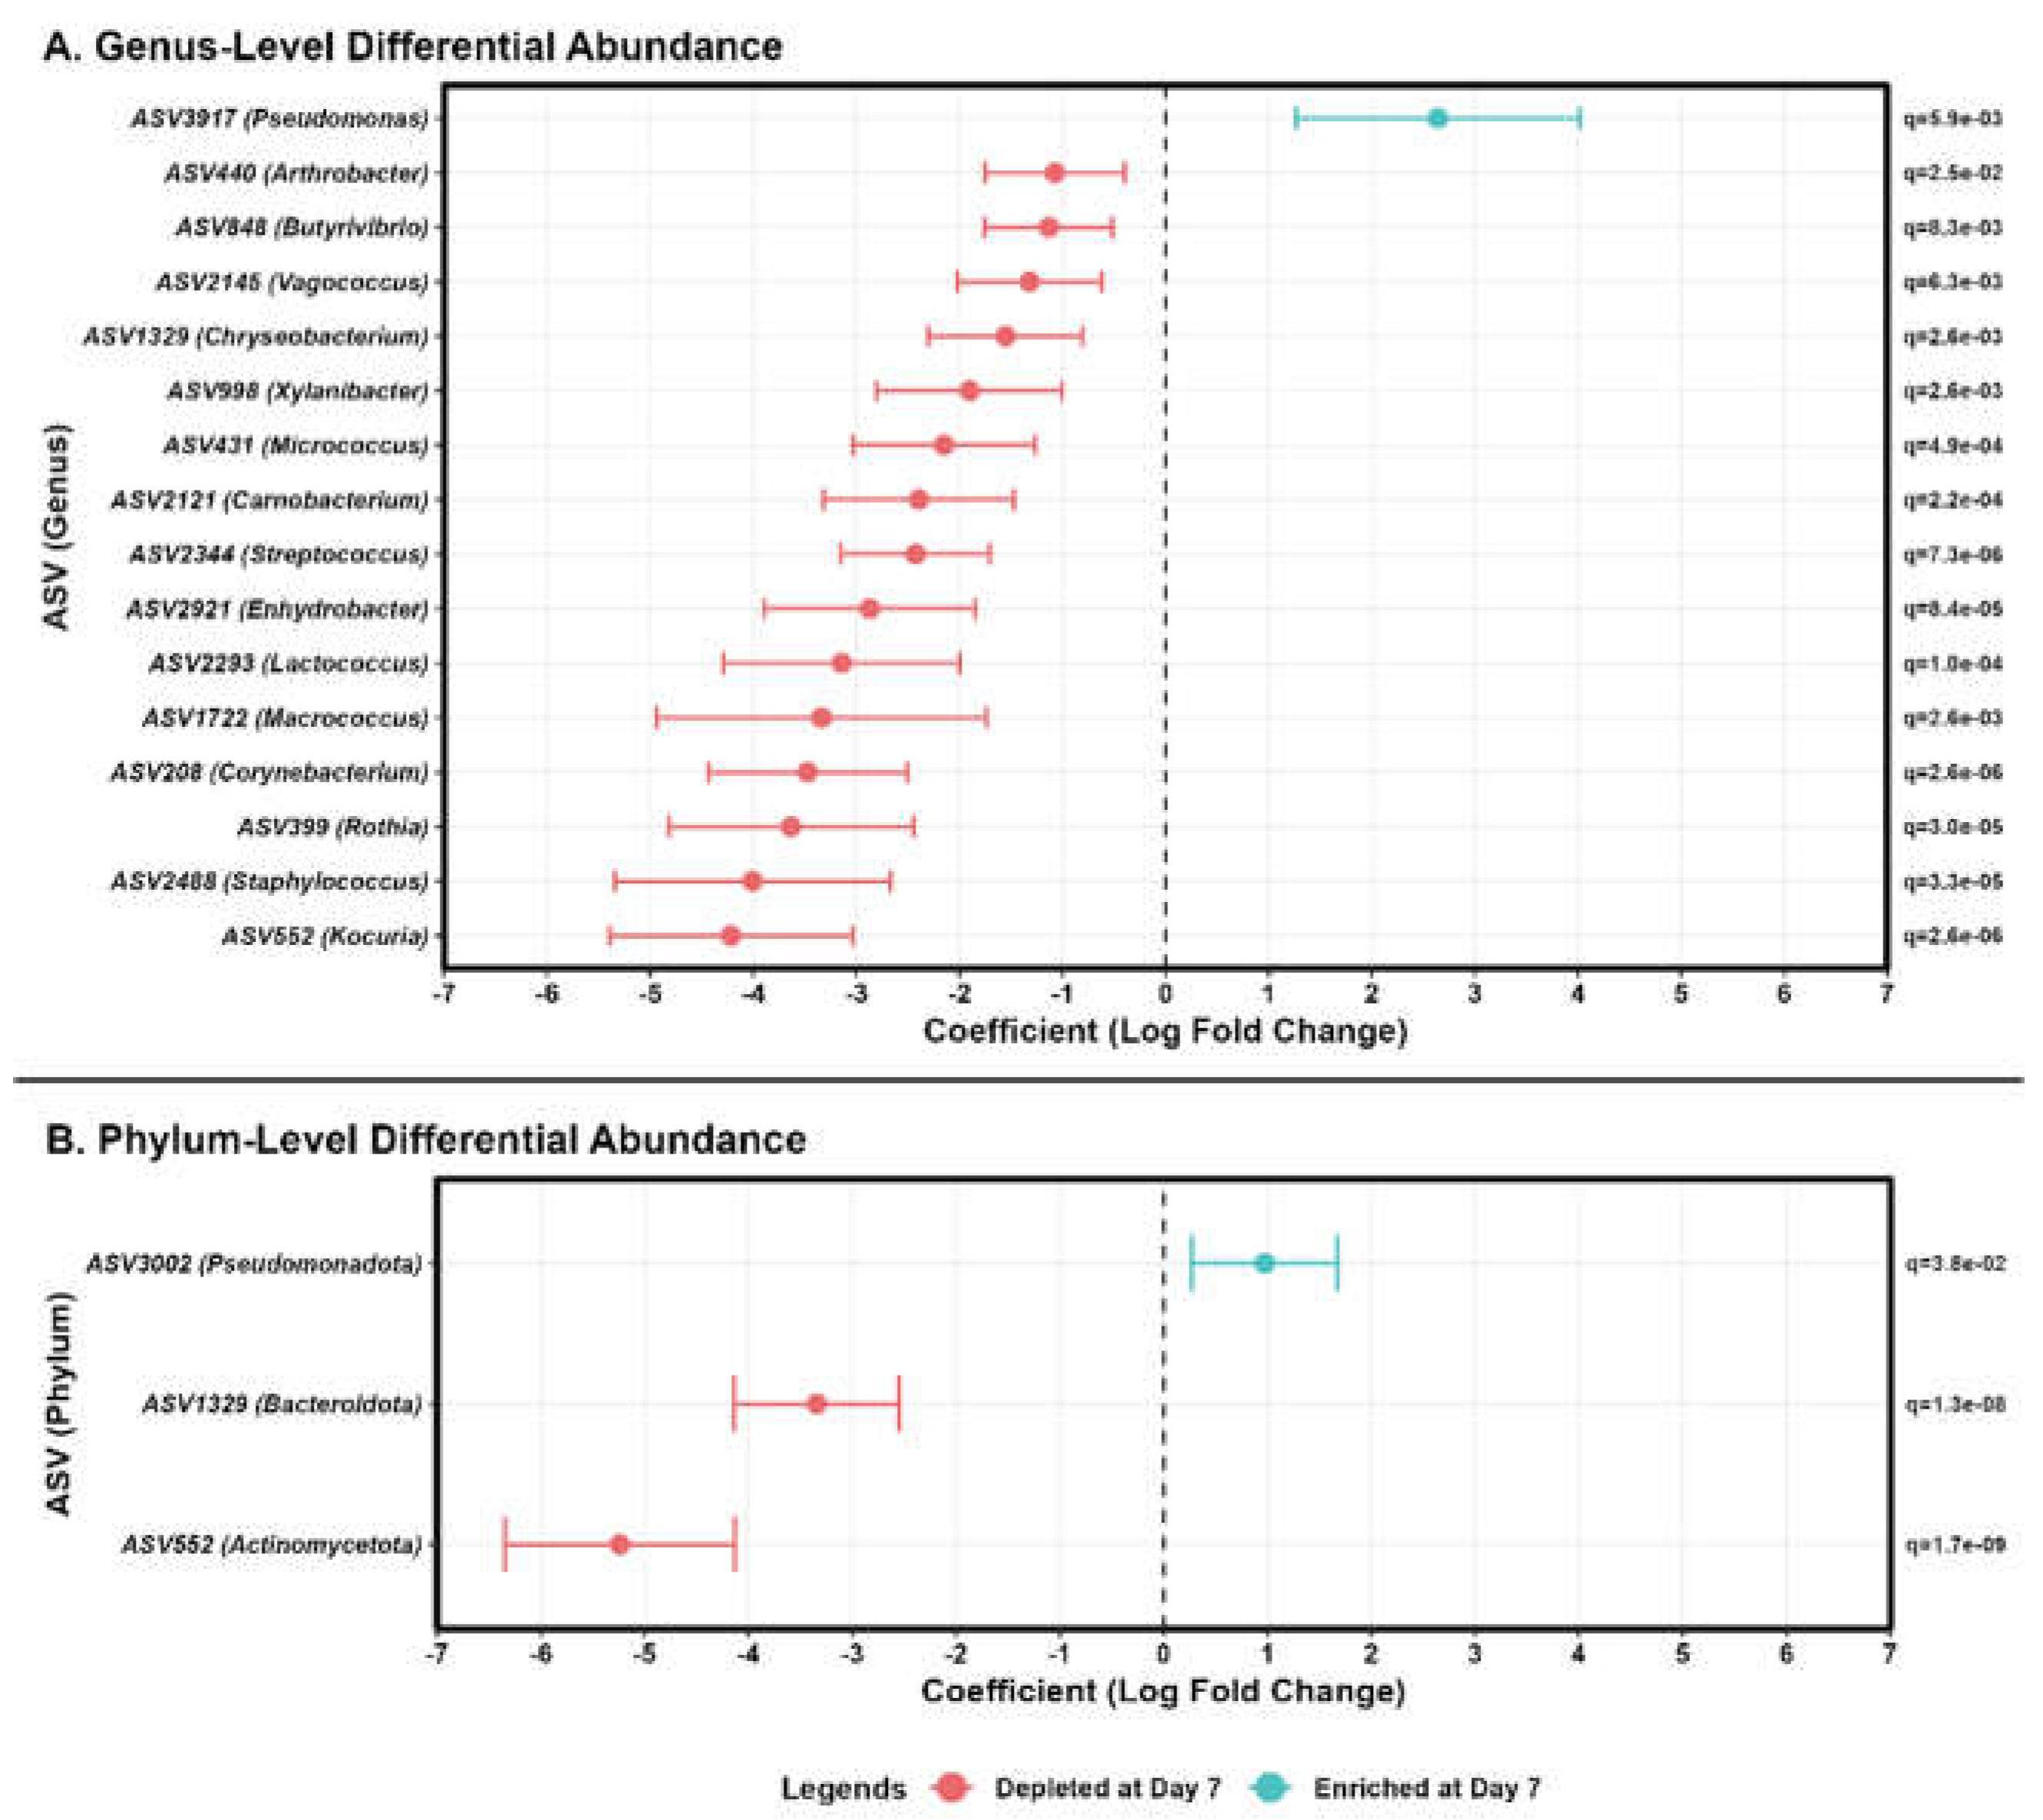
Differential abundance analysis using MaAsLin2 identified storage-duration-associated changes at the genus, phylum, and ASV levels. At the genus level, 16 genera were significantly associated with storage duration (Figure 4A; Table S10). Pseudomonas was the only genus enriched at Day 7 (coefficient = 2.641, q = 0.0059). In contrast, Corynebacterium (coefficient = −3.474, q = 2.63 × 10⁻⁶), Kocuria (coefficient = −4.216, q = 2.63 × 10⁻⁶), Streptococcus (coefficient = −2.426, q = 7.34 × 10⁻⁶), Rothia (coefficient = −3.634, q = 3.01 × 10⁻⁵), Staphylococcus (coefficient = −4.006, q = 3.35 × 10⁻⁵), Lactococcus (coefficient = −3.142, q = 1.00 × 10⁻⁴), and Carnobacterium (coefficient = −2.393, q = 2.16 × 10⁻⁴) were depleted at Day 7. Vagococcus was lower in Shoulder samples relative to Back samples (coefficient = −1.263, q = 0.0250).
At the phylum level, Pseudomonadota was enriched at Day 7 (coefficient = 0.974, q = 0.0378), whereas Actinomycetota (coefficient = −5.238, q = 1.73 × 10⁻⁹) and Bacteroidota (coefficient = −3.341, q = 1.33 × 10⁻⁸) were depleted (Figure 4B; Table S11). Bacteroidota was also lower in Leg samples relative to Back samples (coefficient = −1.197, q = 0.0378).
At the ASV level, 59 ASVs were significantly associated with storage duration (FDR-adjusted q < 0.05), whereas no ASVs were significantly associated with anatomical cut (Table S12). Most significant ASVs belonged to Pseudomonadota (45/59 ASVs), followed by Bacillota, Actinomycetota, and Bacteroidota. 23 Pseudomonas ASVs were enriched at Day 7, whereas ASVs assigned to Acinetobacter, Psychrobacter, Kocuria, Carnobacterium, Macrococcus, Lactococcus, and Chryseobacterium were depleted following storage (Figure S9).
4. Discussion
This study examined bacterial community changes in camel meat during seven days of aerobic refrigerated storage. Across alpha-diversity estimation, Bray–Curtis community analysis, taxonomic profiling, and multivariable differential abundance testing using Microbiome Multivariable Associations with Linear Models 2 (MaAsLin2), storage duration was the main factor linked to microbial community structure. Anatomical cut showed limited evidence of a global community-level effect, whereas butcher source was associated with differences in multivariate dispersion. Overall, aerobic refrigerated storage was associated with reduced estimated richness and a shift in community composition toward taxa more represented under refrigerated aerobic conditions.
Breakaway-estimated richness decreased at Day 7, indicating a reduction in estimated total richness, including unobserved taxa. Concurrently, increased Shannon diversity and decreased Simpson index values suggested that refrigerated storage altered the distribution of relative abundances among the remaining taxa. Together, these findings suggest that refrigerated storage altered both richness and community structure. This pattern is consistent with storage acting as a selective filter, where taxa less suited to refrigerated aerobic conditions become less represented over time [7]. Previous studies of raw meat microbiota have shown that storage time, temperature, and packaging atmosphere influence bacterial community development, particularly under aerobic chilled conditions [3,4,5,7].
Homogeneity of multivariate dispersion was assessed before interpreting permutational multivariate analysis of variance (PERMANOVA) results based on Bray–Curtis dissimilarities. Dispersion did not differ significantly by storage duration or anatomical cut, reducing the likelihood that the storage-duration effect detected by PERMANOVA was driven by unequal within-group variability. In contrast, dispersion differed significantly among butcher sources, indicating that community variability was not uniform across retail sources. This may reflect differences in handling, sanitation routines, equipment surfaces, environmental exposure, or initial contamination [7,9]. Studies of meat-processing environments have shown that spoilage-associated microbiota can overlap between meat products and processing environments, supporting the relevance of retail or facility conditions in shaping initial meat microbiota [6,9]. In this study, however, butcher source was associated with dispersion rather than a direct compositional effect and should therefore be interpreted as a source of variability, not as a confirmed driver of community composition. These findings supported the use of butcher-restricted permutations in PERMANOVA and butcher-level random effects in the relevant regression models. PERMANOVA identified storage duration as a significant contributor to Bray–Curtis community variation, and this effect remained significant when storage duration was fitted after anatomical cut. The first two Principal Coordinate Analysis (PCoA) axes explained 42.6% of the total variation and provided a two-dimensional visualization of the storage-associated pattern, whereas PERMANOVA tested the full Bray–Curtis distance matrix.
The main taxonomic change after storage was the increase in amplicon sequence variant (ASV) features assigned to Pseudomonas. Descriptive profiling showed high Pseudomonas relative abundance in selected Day 7 samples, and MaAsLin2 identified Pseudomonas-assigned ASV features enriched at Day 7 (Figure 4; Figure S9). This agrees with previous reports describing psychrotrophic Pseudomonas as important members of aerobically stored chilled meat microbiota [3,4,9]. However, the present findings should remain at the ASV/genus-annotation level. Short-read V3–V4 16S ribosomal RNA (16S rRNA) sequencing does not provide reliable species-level resolution for closely related bacterial taxa [37,38]. Species-level claims within Pseudomonas would therefore require additional species-resolved methods, such as full-length 16S rRNA sequencing, shotgun metagenomics, targeted isolate sequencing, or validated species-specific assays [39,40,41,42].
Some genera showed notable sample-level abundance patterns without being identified as significant storage-associated features in MaAsLin2. For example, Brochothrix reached high relative abundance in several Day 7 samples, including 52.5% in one Day 7 Back sample, but was not significantly associated with storage duration in the multivariable analysis. This illustrates that descriptive relative-abundance profiles and covariate-adjusted differential abundance models provide complementary information. Accordingly, such patterns should be interpreted as sample-level observations rather than evidence of a consistent storage-associated increase.
Several ASV features assigned to genera more prominent in Day 0 communities were depleted at Day 7, including features assigned to Corynebacterium, Kocuria, Streptococcus, Rothia, Staphylococcus, Lactococcus, and Carnobacterium. At broader taxonomic resolution, Actinomycetota- and Bacteroidota-assigned features were depleted, whereas a Pseudomonadota-assigned feature was enriched. These patterns are consistent with a shift from the initial community toward taxa more represented after aerobic refrigerated storage. Because 16S rRNA sequencing provides relative-abundance data, these decreases should not be interpreted as direct evidence of bacterial death or elimination. Absolute-abundance methods, quantitative polymerase chain reaction (qPCR), culture-based enumeration, or internal-standard-based sequencing would be needed to distinguish population decline from compositional replacement [14].
Anatomical cut had a weaker association with microbial composition than storage duration. The term-wise PERMANOVA did not identify Cut as a significant contributor to overall community composition after accounting for storage duration. Pairwise cut comparisons suggested differences between some cuts, but these were interpreted as exploratory because the omnibus Cut effect was not significant. MaAsLin2 also identified limited cut-associated signals at different taxonomic resolutions, including a genus-annotated Vagococcus ASV feature that was lower in Shoulder relative to Back and a phylum-annotated Bacteroidota ASV feature that was lower in Leg relative to Back. These findings may indicate localized taxon-level differences, but they do not establish a broad cut-specific community pattern.
The enrichment of Pseudomonas-assigned ASV features is relevant to meat storage, but interpretation should remain limited to microbiome composition. Sensory spoilage, volatile organic compounds (VOCs), pH, total viable counts, and specific spoilage-organism counts were not measured. Therefore, the observed community changes should be interpreted as storage-related microbiome shifts, not as direct evidence of off-odors, slime formation, VOC production, or product rejection.
Although this study provides a controlled assessment of refrigerated aerobic storage, several aspects of the design and analytical approach should be considered when interpreting the findings. First, sampling was limited to Day 0 and Day 7, so the analysis captures the net storage effect but not the intermediate trajectory of microbial succession. Second, the retained dataset was modest in size and unbalanced across storage duration and butcher source, limiting the ability to evaluate interaction effects and subtle cut-specific patterns. Third, 16S rRNA sequencing provides relative abundance profiles with limited species-level resolution and does not distinguish viable, dormant, or dead cells. Fourth, MaAsLin2 results were interpreted at the ASV-feature level with genus and phylum annotations; true genus- or phylum-level differential abundance testing would require feature tables collapsed at those taxonomic ranks before modelling. Fifth, sensory, physicochemical, culture-based, and volatile-compound measurements were not included, so the observed community shifts cannot be directly linked to spoilage phenotype or shelf-life endpoints. Finally, the findings are specific to aerobic refrigerated storage at 5 °C and should not be generalized to vacuum-packaged or modified-atmosphere-packaged meat without comparative analysis.
Future work should extend the storage time course beyond Day 7 to resolve intermediate stages of microbial succession and identify when storage-associated taxa become established. Combining microbiome profiling with total viable counts, targeted enumeration of spoilage organisms, qPCR-based absolute quantification, pH, water activity, sensory evaluation, and volatile-compound analysis would help connect compositional shifts with measurable quality changes. Comparative studies across aerobic, vacuum, and modified-atmosphere packaging are also needed to determine how oxygen availability and packaging conditions influence community trajectories. Larger and more balanced sampling across butcher sources and tissue cuts would further improve the assessment of facility-level variability and cut-specific effects.
5. Conclusions
Seven days of aerobic refrigerated storage at 5 °C was associated with reduced bacterial richness, altered community composition, and enrichment of Pseudomonas-assigned amplicon sequence variant (ASV) features. Storage duration was the main factor linked to microbial community change, whereas anatomical cut showed limited evidence of a global community-level effect.
These findings support a storage-associated filtering model in which aerobic refrigeration favors storage-tolerant bacterial groups over parts of the initial meat microbiota. Further studies integrating microbial community profiling with direct quality and spoilage indicators are needed to determine how these compositional shifts relate to practical meat-quality and shelf-life outcomes.
Supplementary Materials
The following supporting information can be downloaded at: Preprints.org, Figure S1: Rarefaction curves showing observed amplicon sequence variant richness across sequencing depth by butcher source; Figure S2: Bayesian hierarchical sensitivity analysis of Breakaway-estimated richness across storage duration and tissue cut; Figure S3: Homogeneity of multivariate dispersion based on Bray–Curtis dissimilarities; Figure S4: Butcher-stratified Principal Coordinate Analysis of microbial community composition based on Bray–Curtis dissimilarities; Figure S5: Genus-level clustered heatmap of selected dominant bacterial genera; Figure S6: Phylum-level clustered heatmap of bacterial community composition; Figure S7: Genus-level phylogenetic relationships among detected bacterial genera; Figure S8: Phylum-level phylogenetic relationships among detected bacterial phyla; Figure S9: Amplicon sequence variant-level differential abundance associated with storage duration identified by Microbiome Multivariable Associations with Linear Models 2 (MaAsLin2); Table S1: Breakaway-estimated richness and betta_random() mixed-effects model output; Table S2: Bayesian hierarchical sensitivity analysis of Breakaway-estimated richness; Table S3: DivNet-estimated Shannon diversity across retained samples; Table S4: DivNet-estimated Simpson index values across retained samples; Table S5: Bray–Curtis dissimilarity matrix; Table S6: Term-wise PERMANOVA results for Bray–Curtis dissimilarities; Table S7: Pairwise PERMANOVA comparisons with false-discovery-rate correction; Table S8: Relative abundance of selected dominant bacterial genera; Table S9: Phylum-level relative abundance table; Table S10: Genus-annotated ASV-feature associations identified by Microbiome Multivariable Associations with Linear Models 2 (MaAsLin2); Table S11: Phylum-annotated ASV-feature associations identified by Microbiome Multivariable Associations with Linear Models 2 (MaAsLin2); Table S12: ASV-level differential abundance associated with storage duration identified by Microbiome Multivariable Associations with Linear Models 2 (MaAsLin2).
Supplementary Materials
The following supporting information can be downloaded at the website of this paper posted on Preprints.org.
Funding
The author gratefully acknowledges Qassim University, represented by the Deanship of Scientific “ Research, on the financial support for this research under the number (20016-cavm-2021-1-2w) during the academic year 1443 AH/2021AD.
Institutional Review Board Statement
Not applicable.
Informed Consent Statement
Not applicable.
Conflicts of Interest
The author declare no conflicts of interest.
References
- Rodriguez-Caturla, M.Y.; Garre, A.; Castillo, C.J.C.; Zwietering, M.H.; Den Besten, H.M.W.; SantˈAna, A.S. Shelf Life Estimation of Refrigerated Vacuum Packed Beef Accounting for Uncertainty. Int. J. Food Microbiol. 2023, 405, 110345. [Google Scholar] [CrossRef] [PubMed]
- Mortazavi, S.M.H.; Kaur, M.; Farahnaky, A.; Torley, P.J.; Osborn, A.M. The Pathogenic and Spoilage Bacteria Associated with Red Meat and Application of Different Approaches of High CO2 Packaging to Extend Product Shelf-Life. Crit. Rev. Food Sci. Nutr. 2023, 63, 1733–1754. [Google Scholar] [CrossRef] [PubMed]
- Doulgeraki, A.I.; Ercolini, D.; Villani, F.; Nychas, G.-J.E. Spoilage Microbiota Associated to the Storage of Raw Meat in Different Conditions. Int. J. Food Microbiol. 2012, 157, 130–141. [Google Scholar] [CrossRef] [PubMed]
- Wickramasinghe, N.N.; Ravensdale, J.; Coorey, R.; Chandry, S.P.; Dykes, G.A. The Predominance of Psychrotrophic Pseudomonads on Aerobically Stored Chilled Red Meat. Compr. Rev. Food Sci. Food Saf. 2019, 18, 1622–1635. [Google Scholar] [CrossRef] [PubMed]
- Ercolini, D.; Russo, F.; Torrieri, E.; Masi, P.; Villani, F. Changes in the Spoilage-Related Microbiota of Beef during Refrigerated Storage under Different Packaging Conditions. Appl. Environ. Microbiol. 2006, 72, 4663–4671. [Google Scholar] [CrossRef] [PubMed]
- Rovira, P.; Brugnini, G.; Rodriguez, J.; Cabrera, M.C.; Saadoun, A.; de Souza, G.; Luzardo, S.; Rufo, C. Microbiological Changes during Long-Storage of Beef Meat under Different Temperature and Vacuum-Packaging Conditions. Foods 2023, 12, 694. [Google Scholar] [CrossRef] [PubMed]
- Dourou, D.; Spyrelli, E.D.; Doulgeraki, A.I.; Argyri, A.A.; Grounta, A.; Nychas, G.-J.E.; Chorianopoulos, N.G.; Tassou, C.C. Microbiota of Chicken Breast and Thigh Fillets Stored under Different Refrigeration Temperatures Assessed by Next-Generation Sequencing. Foods 2021, 10, 765. [Google Scholar] [CrossRef] [PubMed]
- Stellato, G.; La Storia, A.; De Filippis, F.; Borriello, G.; Villani, F.; Ercolini, D. Overlap of Spoilage-Associated Microbiota between Meat and the Meat Processing Environment in Small-Scale and Large-Scale Retail Distributions. Appl. Environ. Microbiol. 2016, 82, 4045–4054. [Google Scholar] [CrossRef] [PubMed]
- Sequino, G.; Cobo-Diaz, J.F.; Valentino, V.; Tassou, C.; Volpe, S.; Torrieri, E.; Nychas, G.-J.; Ordonez, A.A.; Ercolini, D.; De Filippis, F. Microbiome Mapping in Beef Processing Reveals Safety-Relevant Variations in Microbial Diversity and Genomic Features. Food Res. Int. 2024, 186, 114318. [Google Scholar] [CrossRef] [PubMed]
- Baba, W.N.; Rasool, N.; Selvamuthukumara, M.; Maqsood, S. A Review on Nutritional Composition, Health Benefits, and Technological Interventions for Improving Consumer Acceptability of Camel Meat: An Ethnic Food of Middle East. J. Ethn. Foods 2021, 8, 18. [Google Scholar] [CrossRef]
- Korany, A.M.; Abdel-Atty, N.S.; Zeinhom, M.M.A.; Hassan, A.H.A. Application of Gelatin-Based Zinc Oxide Nanoparticles Bionanocomposite Coatings to Control Listeria Monocytogenes in Talaga Cheese and Camel Meat during Refrigerated Storage. Food Microbiol. 2024, 122, 104559. [Google Scholar] [CrossRef] [PubMed]
- Djenane, D.; Aider, M. The One-Humped Camel: The Animal of Future, Potential Alternative Red Meat, Technological Suitability and Future Perspectives. F1000Research 2024, 11, 1085. [Google Scholar] [CrossRef] [PubMed]
- Yirgalem, M.; Kemal, J.; Wolkaro, T.; Bekele, M.; Terefe, Y. Identification and Antimicrobial Susceptibility Profiles of Campylobacter Isolated from Camel at Municipal Abattoirs in Eastern Ethiopia. Sci. Rep. 2024, 14, 26335. [Google Scholar] [CrossRef] [PubMed]
- Osaili, T.M.; Hasan, F.; Al-Nabulsi, A.A.; Dhanasekaran, D.K.; Obaid, R.S.; Hashim, M.S.; Radwan, H.M.; Cheikh Ismail, L.; Hasan, H.; Faris, M.A.-I.E. Effect of Essential Oils and Vacuum Packaging on Spoilage-Causing Microorganisms of Marinated Camel Meat during Storage. Foods 2021, 10, 2980. [Google Scholar] [CrossRef] [PubMed]
- Al-Bachir, M.; Zeinou, R. Effect of Gamma Irradiation on Microbial Load and Quality Characteristics of Minced Camel Meat. Meat Sci. 2009, 82, 119–124. [Google Scholar] [CrossRef] [PubMed]
- Brightwell, G.; Clemens, R.; Adam, K.; Urlich, S.; Boerema, J. Comparison of Culture-Dependent and Independent Techniques for Characterisation of the Microflora of Peroxyacetic Acid Treated, Vacuum-Packaged Beef. Food Microbiol. 2009, 26, 283–288. [Google Scholar] [CrossRef] [PubMed]
- Weinroth, M.D.; Belk, A.D.; Dean, C.; Noyes, N.; Dittoe, D.K.; Rothrock, M.J., Jr.; Ricke, S.C.; Myer, P.R.; Henniger, M.T.; Ramírez, G.A. Considerations and Best Practices in Animal Science 16S Ribosomal RNA Gene Sequencing Microbiome Studies. J. Anim. Sci. 2022, 100, skab346. [Google Scholar] [CrossRef] [PubMed]
- Andrews, S. FastQC: A Quality Control Tool for High Throughput Sequence Data. Available online: https://www.bioinformatics.babraham.ac.uk/projects/fastqc/ (accessed on 1 June 2026).
- Ewels, P.; Magnusson, M.; Lundin, S.; Käller, M. MultiQC: Summarize Analysis Results for Multiple Tools and Samples in a Single Report. Bioinformatics 2016, 32, 3047–3048. [Google Scholar] [CrossRef] [PubMed]
- Martin, M. Cutadapt Removes Adapter Sequences from High-Throughput Sequencing Reads. EMBnet. J. 2011, 17, 10–12. [Google Scholar] [CrossRef]
- Bolyen, E.; Rideout, J.R.; Dillon, M.R.; Bokulich, N.A.; Abnet, C.C.; Al-Ghalith, G.A.; Alexander, H.; Alm, E.J.; Arumugam, M.; Asnicar, F. Reproducible, Interactive, Scalable and Extensible Microbiome Data Science Using QIIME 2. Nat. Biotechnol. 2019, 37, 852–857. [Google Scholar] [CrossRef] [PubMed]
- Callahan, B.J.; McMurdie, P.J.; Rosen, M.J.; Han, A.W.; Johnson, A.J.A.; Holmes, S.P. DADA2: High-Resolution Sample Inference from Illumina Amplicon Data. Nat. Methods 2016, 13, 581–583. [Google Scholar] [CrossRef] [PubMed]
- Quast, C.; Pruesse, E.; Yilmaz, P.; Gerken, J.; Schweer, T.; Yarza, P.; Peplies, J.; Glöckner, F.O. The SILVA Ribosomal RNA Gene Database Project: Improved Data Processing and Web-Based Tools. Nucleic Acids Res. 2012, 41, D590–D596. [Google Scholar] [CrossRef] [PubMed]
- Klindworth, A.; Pruesse, E.; Schweer, T.; Peplies, J.; Quast, C.; Horn, M.; Glöckner, F.O. Evaluation of General 16S Ribosomal RNA Gene PCR Primers for Classical and Next-Generation Sequencing-Based Diversity Studies. Nucleic Acids Res. 2013, 41, e1. [Google Scholar] [CrossRef] [PubMed]
- Yeo, K.; Wu, F.; Li, R.; Smith, E.; Wormald, P.-J.; Valentine, R.; Psaltis, A.J.; Vreugde, S.; Fenix, K. Is Short-Read 16S RRNA Sequencing of Oral Microbiome Sampling a Suitable Diagnostic Tool for Head and Neck Cancer? Pathogens 2024, 13, 826. [Google Scholar] [CrossRef] [PubMed]
- Willis, A.; Bunge, J.; Whitman, T. Improved Detection of Changes in Species Richness in High Diversity Microbial Communities. J. R. Stat. Soc. Ser. C Appl. Stat. 2017, 66, 963–977. [Google Scholar] [CrossRef]
- Willis, A.D.; Martin, B.D. Estimating Diversity in Networked Ecological Communities. Biostatistics 2022, 23, 207–222. [Google Scholar] [CrossRef] [PubMed]
- Bürkner, P.-C. Brms: An R Package for Bayesian Multilevel Models Using Stan. J. Stat. Softw. 2017, 80, 1–28. [Google Scholar] [CrossRef]
- Bokulich, N.A.; Subramanian, S.; Faith, J.J.; Gevers, D.; Gordon, J.I.; Knight, R.; Mills, D.A.; Caporaso, J.G. Quality-Filtering Vastly Improves Diversity Estimates from Illumina Amplicon Sequencing. Nat. Methods 2013, 10, 57–59. [Google Scholar] [CrossRef] [PubMed]
- Bray, J.R.; Curtis, J.T. An Ordination of the Upland Forest Communities of Southern Wisconsin. Ecol. Monogr. 1957, 27, 326–349. [Google Scholar] [CrossRef] [PubMed]
- Gower, J.C. Principal Coordinates Analysis. Wiley StatsRef Stat. Ref. online 2014, 1–7. [Google Scholar] [CrossRef]
- Oksanen, J.; Simpson, G.L.; Blanchet, F.G.; Kindt, R.; Legendre, P.; Minchin, P.R.; O’Hara, R.B.; Solymos, P.; Stevens, M.H.H.; Szoecs, E.; et al. Community Ecology Package [R Package Vegan Version 2.7-5]. CRAN Contrib. Packag. 2026. [Google Scholar] [CrossRef]
- Legendre, P.; Legendre, L. Numerical Ecology, Third English Ed. Dev. Environ. Model. Elsevier, Amsterdam 2012, 1006.
- Arbizu, M. PairwiseAdonis: Pairwise Multilevel Comparison Using Adonis. R Packag. version 2020.
- Benjamini, Y.; Hochberg, Y. Controlling the False Discovery Rate: A Practical and Powerful Approach to Multiple Testing. J. R. Stat. Soc. Ser. B 1995, 57, 289–300. [Google Scholar] [CrossRef]
- Mallick, H.; Rahnavard, A.; McIver, L.J.; Ma, S.; Zhang, Y.; Nguyen, L.H.; Tickle, T.L.; Weingart, G.; Ren, B.; Schwager, E.H. Multivariable Association Discovery in Population-Scale Meta-Omics Studies. PLoS Comput. Biol. 2021, 17, e1009442. [Google Scholar] [CrossRef] [PubMed]
- Bartoš, O.; Chmel, M.; Swierczková, I. The Overlooked Evolutionary Dynamics of 16S RRNA Revises Its Role as the “Gold Standard” for Bacterial Species Identification. Sci. Rep. 2024, 14, 9067. [Google Scholar] [CrossRef] [PubMed]
- Kiepas, A.B.; Hoskisson, P.A.; Pritchard, L. 16S RRNA Phylogeny and Clustering Is Not a Reliable Proxy for Genome-Based Taxonomy in Streptomyces. Microb. Genom. 2024, 10, 1287. [Google Scholar] [CrossRef] [PubMed]
- Biada, I.; Santacreu, M.A.; González-Recio, O.; Ibáñez-Escriche, N. Comparative Analysis of Illumina, PacBio, and Nanopore for 16S RRNA Gene Sequencing of Rabbit’s Gut Microbiota. Front. Microbiomes 2025, 4, 1587712. [Google Scholar] [CrossRef] [PubMed]
- Muñoz-Martinez, T.I.; Rodríguez-Hernández, B.; Rodríguez-Montaño, M.; Alfau, J.; Reyes, C.; Fernandez, Y.; Ramos, R.T.; De Los Santos, E.F.F.; Maroto-Martín, L.O. Unlocking the Hidden Microbiome of Food: The Role of Metagenomics in Analyzing Fresh Produce, Poultry, and Meat. Appl. Microbiol. 2025, 5, 26. [Google Scholar] [CrossRef]
- Hamdan, M.; Wafa Masoud. Characterization of Bacterial Communities in Palestinian Lamb Meat by Phenotyping and 16S RRNA Gene Sequence Analysis. Palest. Tech. Univ. Res. J. 2020, 8, 12–22. [Google Scholar] [CrossRef]
- Cheng, Y.; Wang, S.; Ju, S.; Zhou, S.; Zeng, X.; Wu, Z.; Pan, D.; Zhong, G.; Cai, Z. Heat-Treated Meat Origin Tracing and Authenticity through a Practical Multiplex Polymerase Chain Reaction Approach. Nutrients 2022, 14, 4727. [Google Scholar] [CrossRef] [PubMed]
Figure 1.
Alpha diversity across storage duration. (A) Breakaway-estimated richness, (B) DivNet-estimated Shannon diversity index, and (C) DivNet-estimated Simpson index in Day 0 and Day 7 samples. Boxplots show the median and interquartile range, and points represent individual samples. Statistical annotations indicate model-based significance testing using betta_random() for richness and DivNet’s testDiversity() for Shannon and Simpson indices.
Figure 1.
Alpha diversity across storage duration. (A) Breakaway-estimated richness, (B) DivNet-estimated Shannon diversity index, and (C) DivNet-estimated Simpson index in Day 0 and Day 7 samples. Boxplots show the median and interquartile range, and points represent individual samples. Statistical annotations indicate model-based significance testing using betta_random() for richness and DivNet’s testDiversity() for Shannon and Simpson indices.
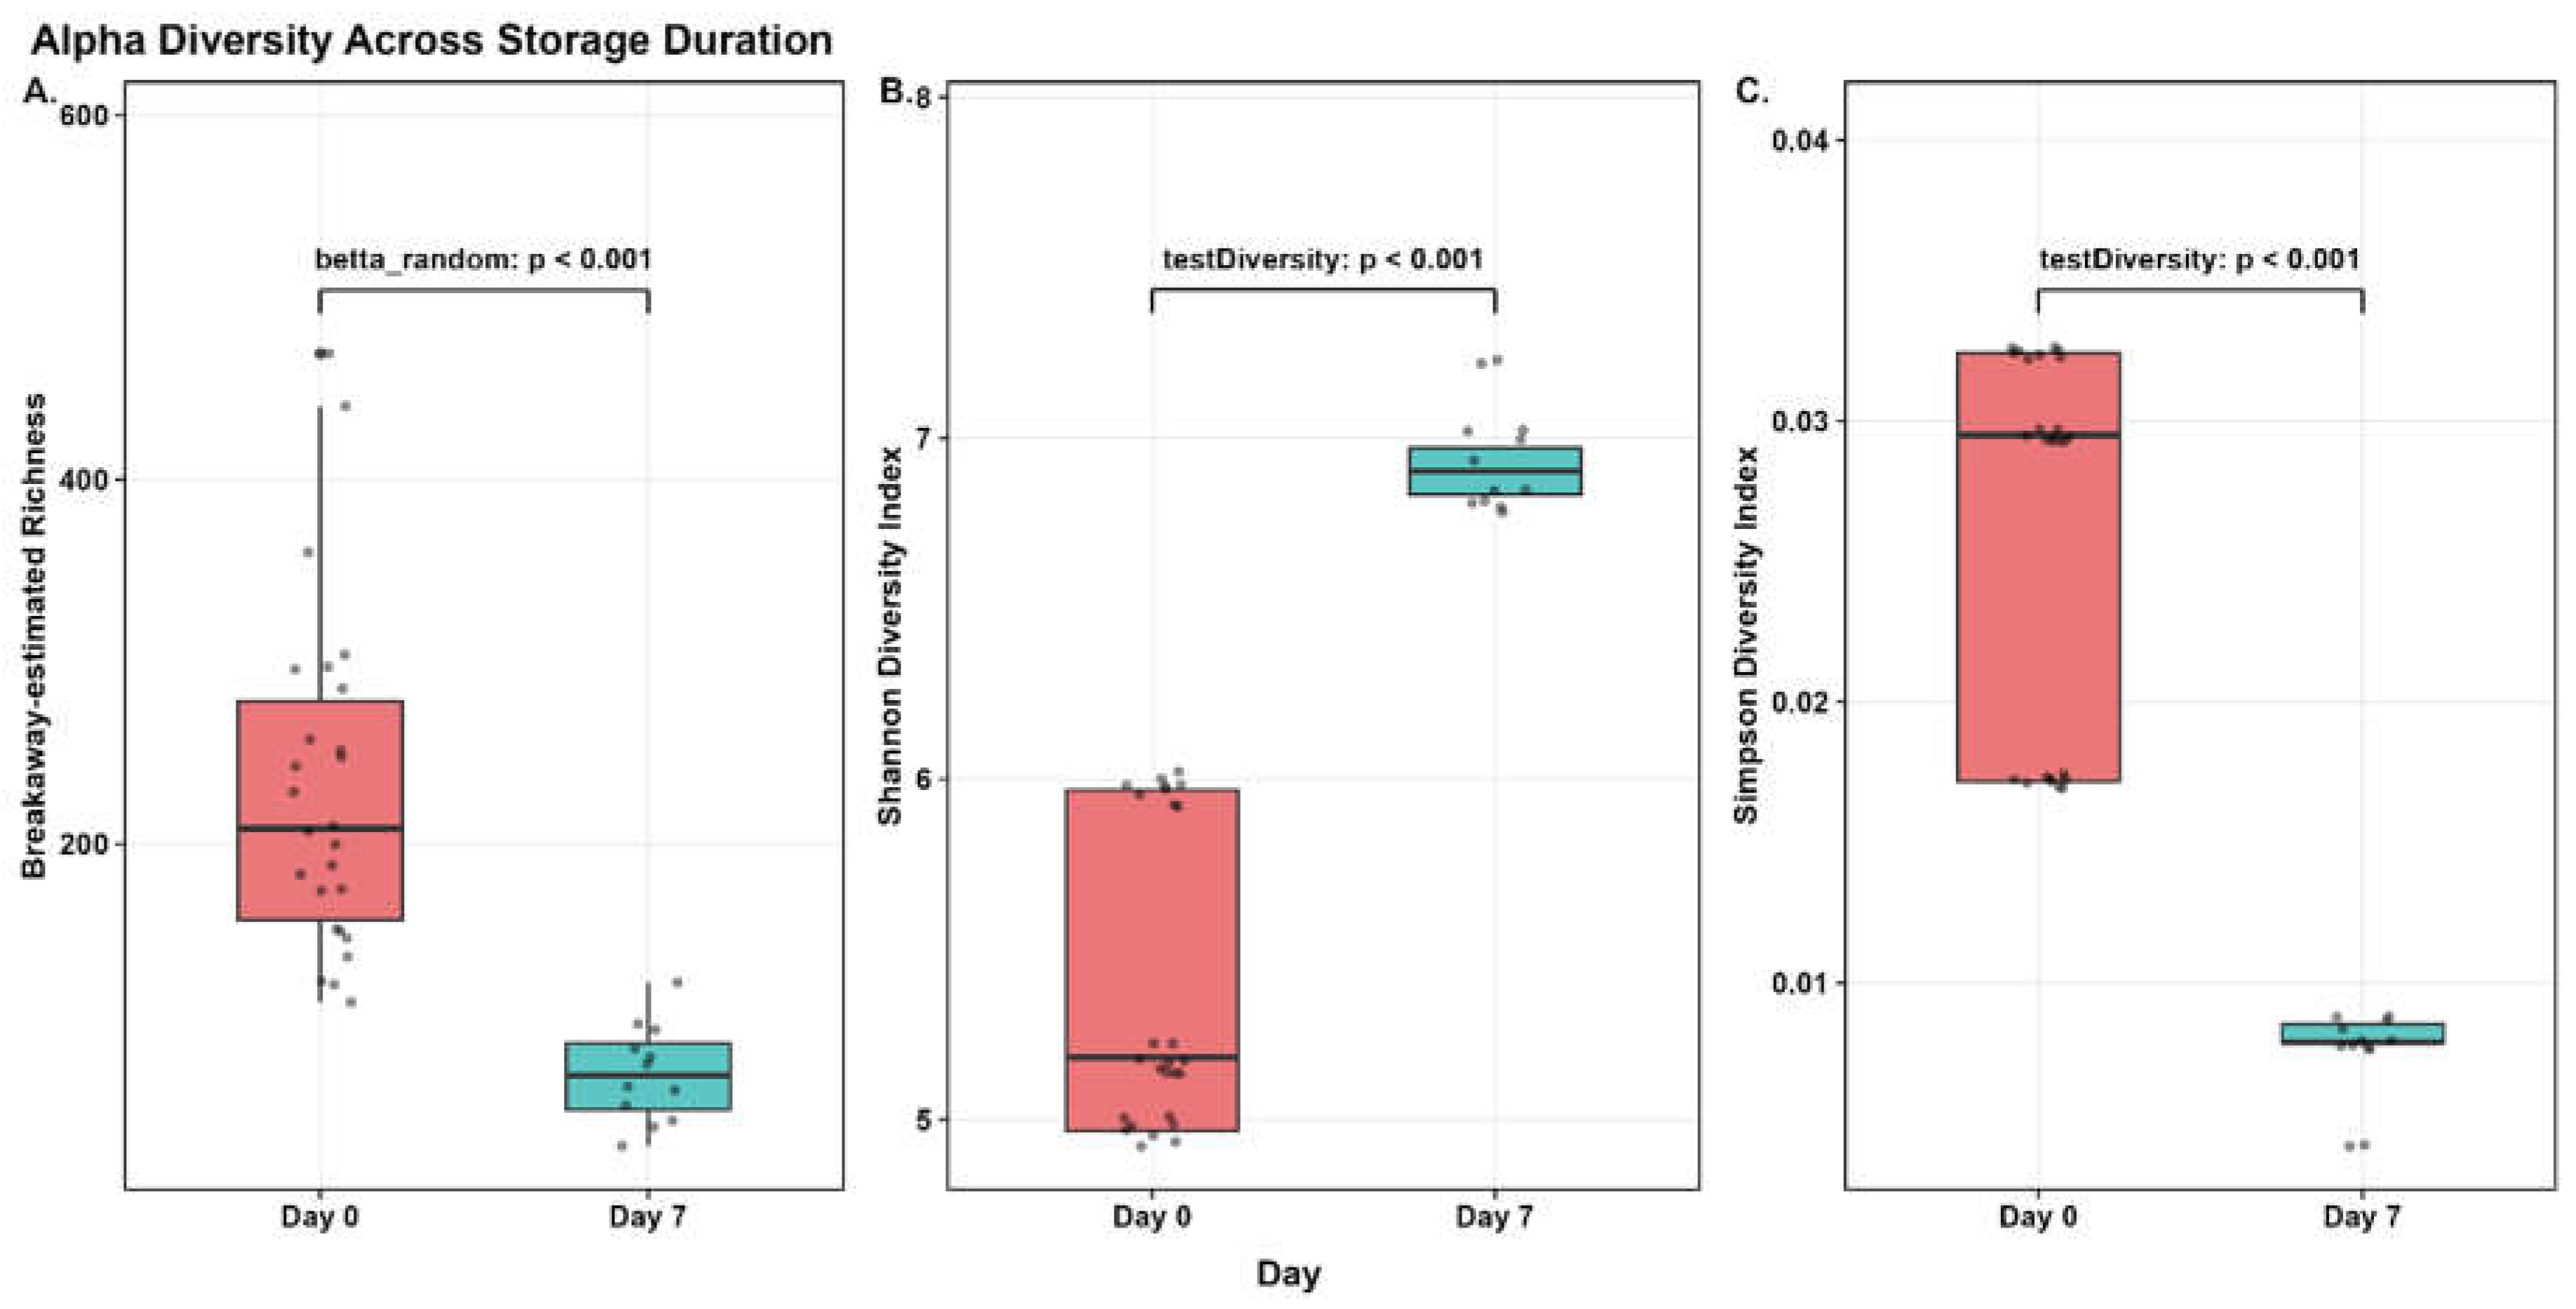
Figure 2.
Principal Coordinate Analysis (PCoA) of microbial community composition based on Bray–Curtis dissimilarities. Samples are colored by storage duration and shaped according to tissue cut. PCoA1 and PCoA2 explained 24.5% and 18.1% of the total variation, respectively. Dashed ellipses represent 95% confidence regions for each storage-duration group in the two-dimensional ordination. space. PERMANOVA based on the full Bray–Curtis distance matrix identified a significant storage-duration effect on microbial community composition (R2 = 0.107, p = 0.001).
Figure 2.
Principal Coordinate Analysis (PCoA) of microbial community composition based on Bray–Curtis dissimilarities. Samples are colored by storage duration and shaped according to tissue cut. PCoA1 and PCoA2 explained 24.5% and 18.1% of the total variation, respectively. Dashed ellipses represent 95% confidence regions for each storage-duration group in the two-dimensional ordination. space. PERMANOVA based on the full Bray–Curtis distance matrix identified a significant storage-duration effect on microbial community composition (R2 = 0.107, p = 0.001).
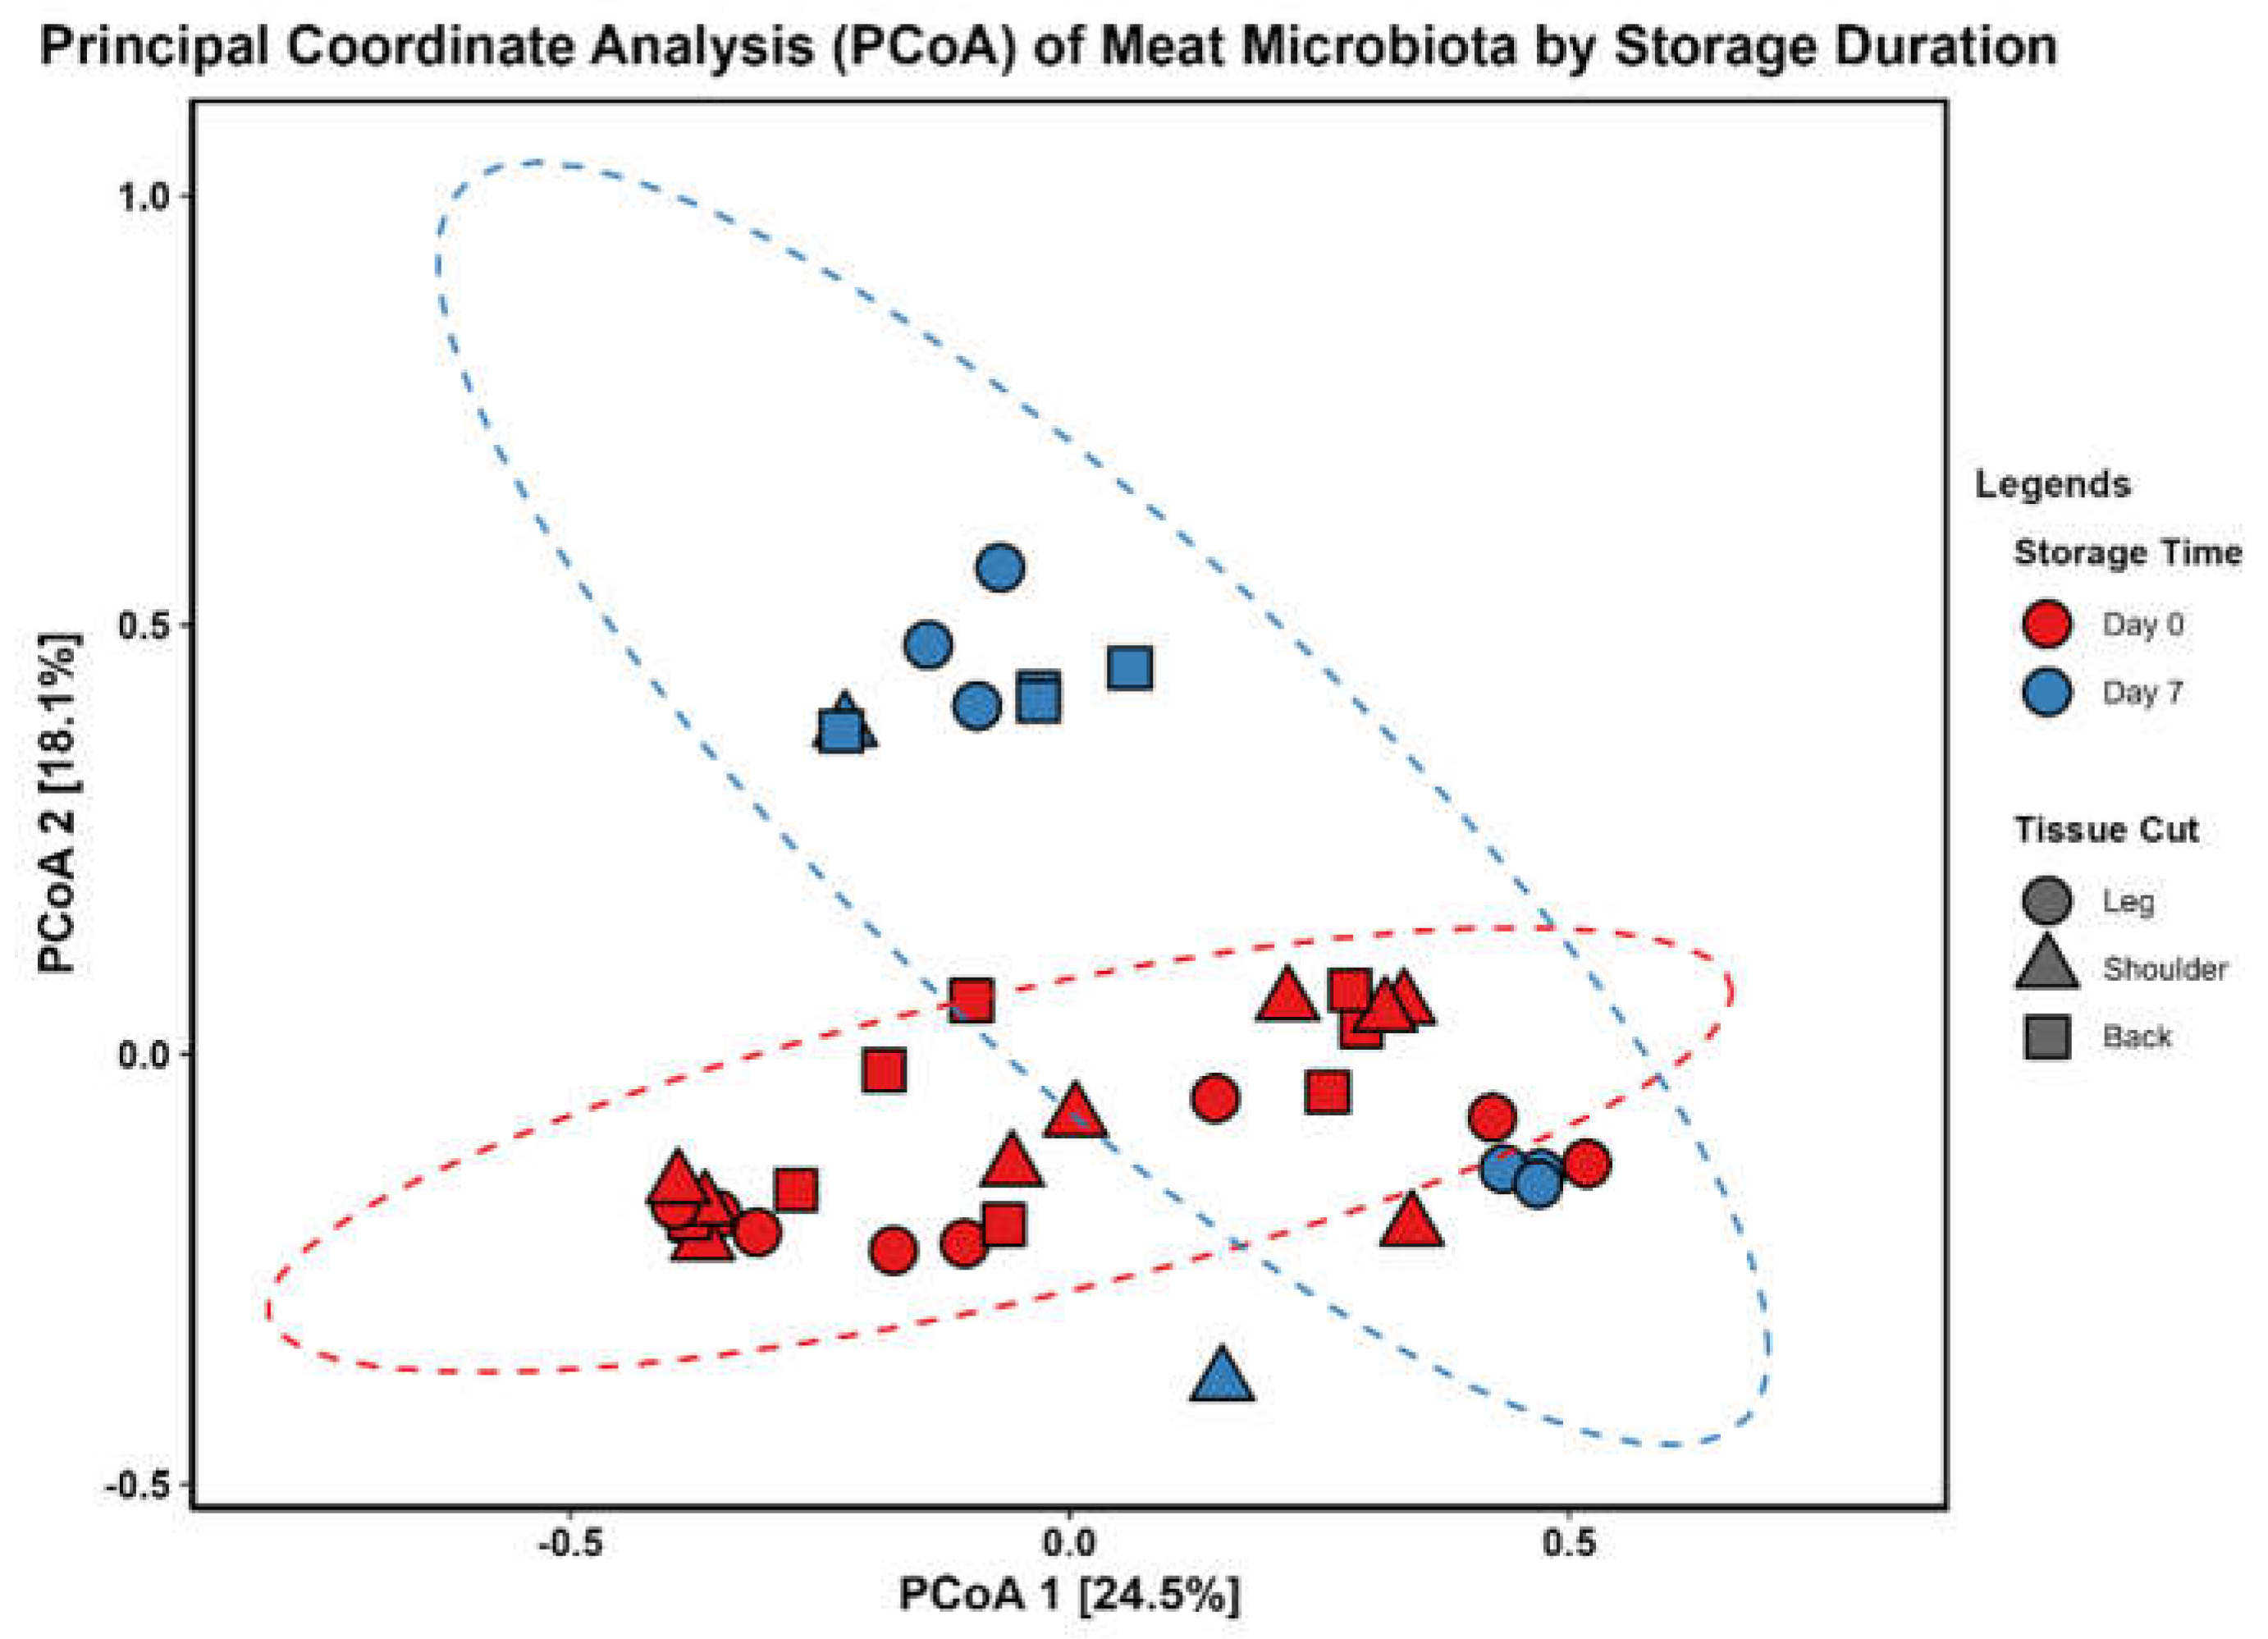
Figure 3.
Taxonomic composition of meat microbiota across butcher source, storage duration, and tissue cut. (A) Genus-level relative abundance of dominant bacterial genera across individual samples. (B) Phylum-level relative abundance of detected bacterial phyla across individual samples. Samples are grouped by butcher source, storage duration, and tissue cut.
Figure 3.
Taxonomic composition of meat microbiota across butcher source, storage duration, and tissue cut. (A) Genus-level relative abundance of dominant bacterial genera across individual samples. (B) Phylum-level relative abundance of detected bacterial phyla across individual samples. Samples are grouped by butcher source, storage duration, and tissue cut.
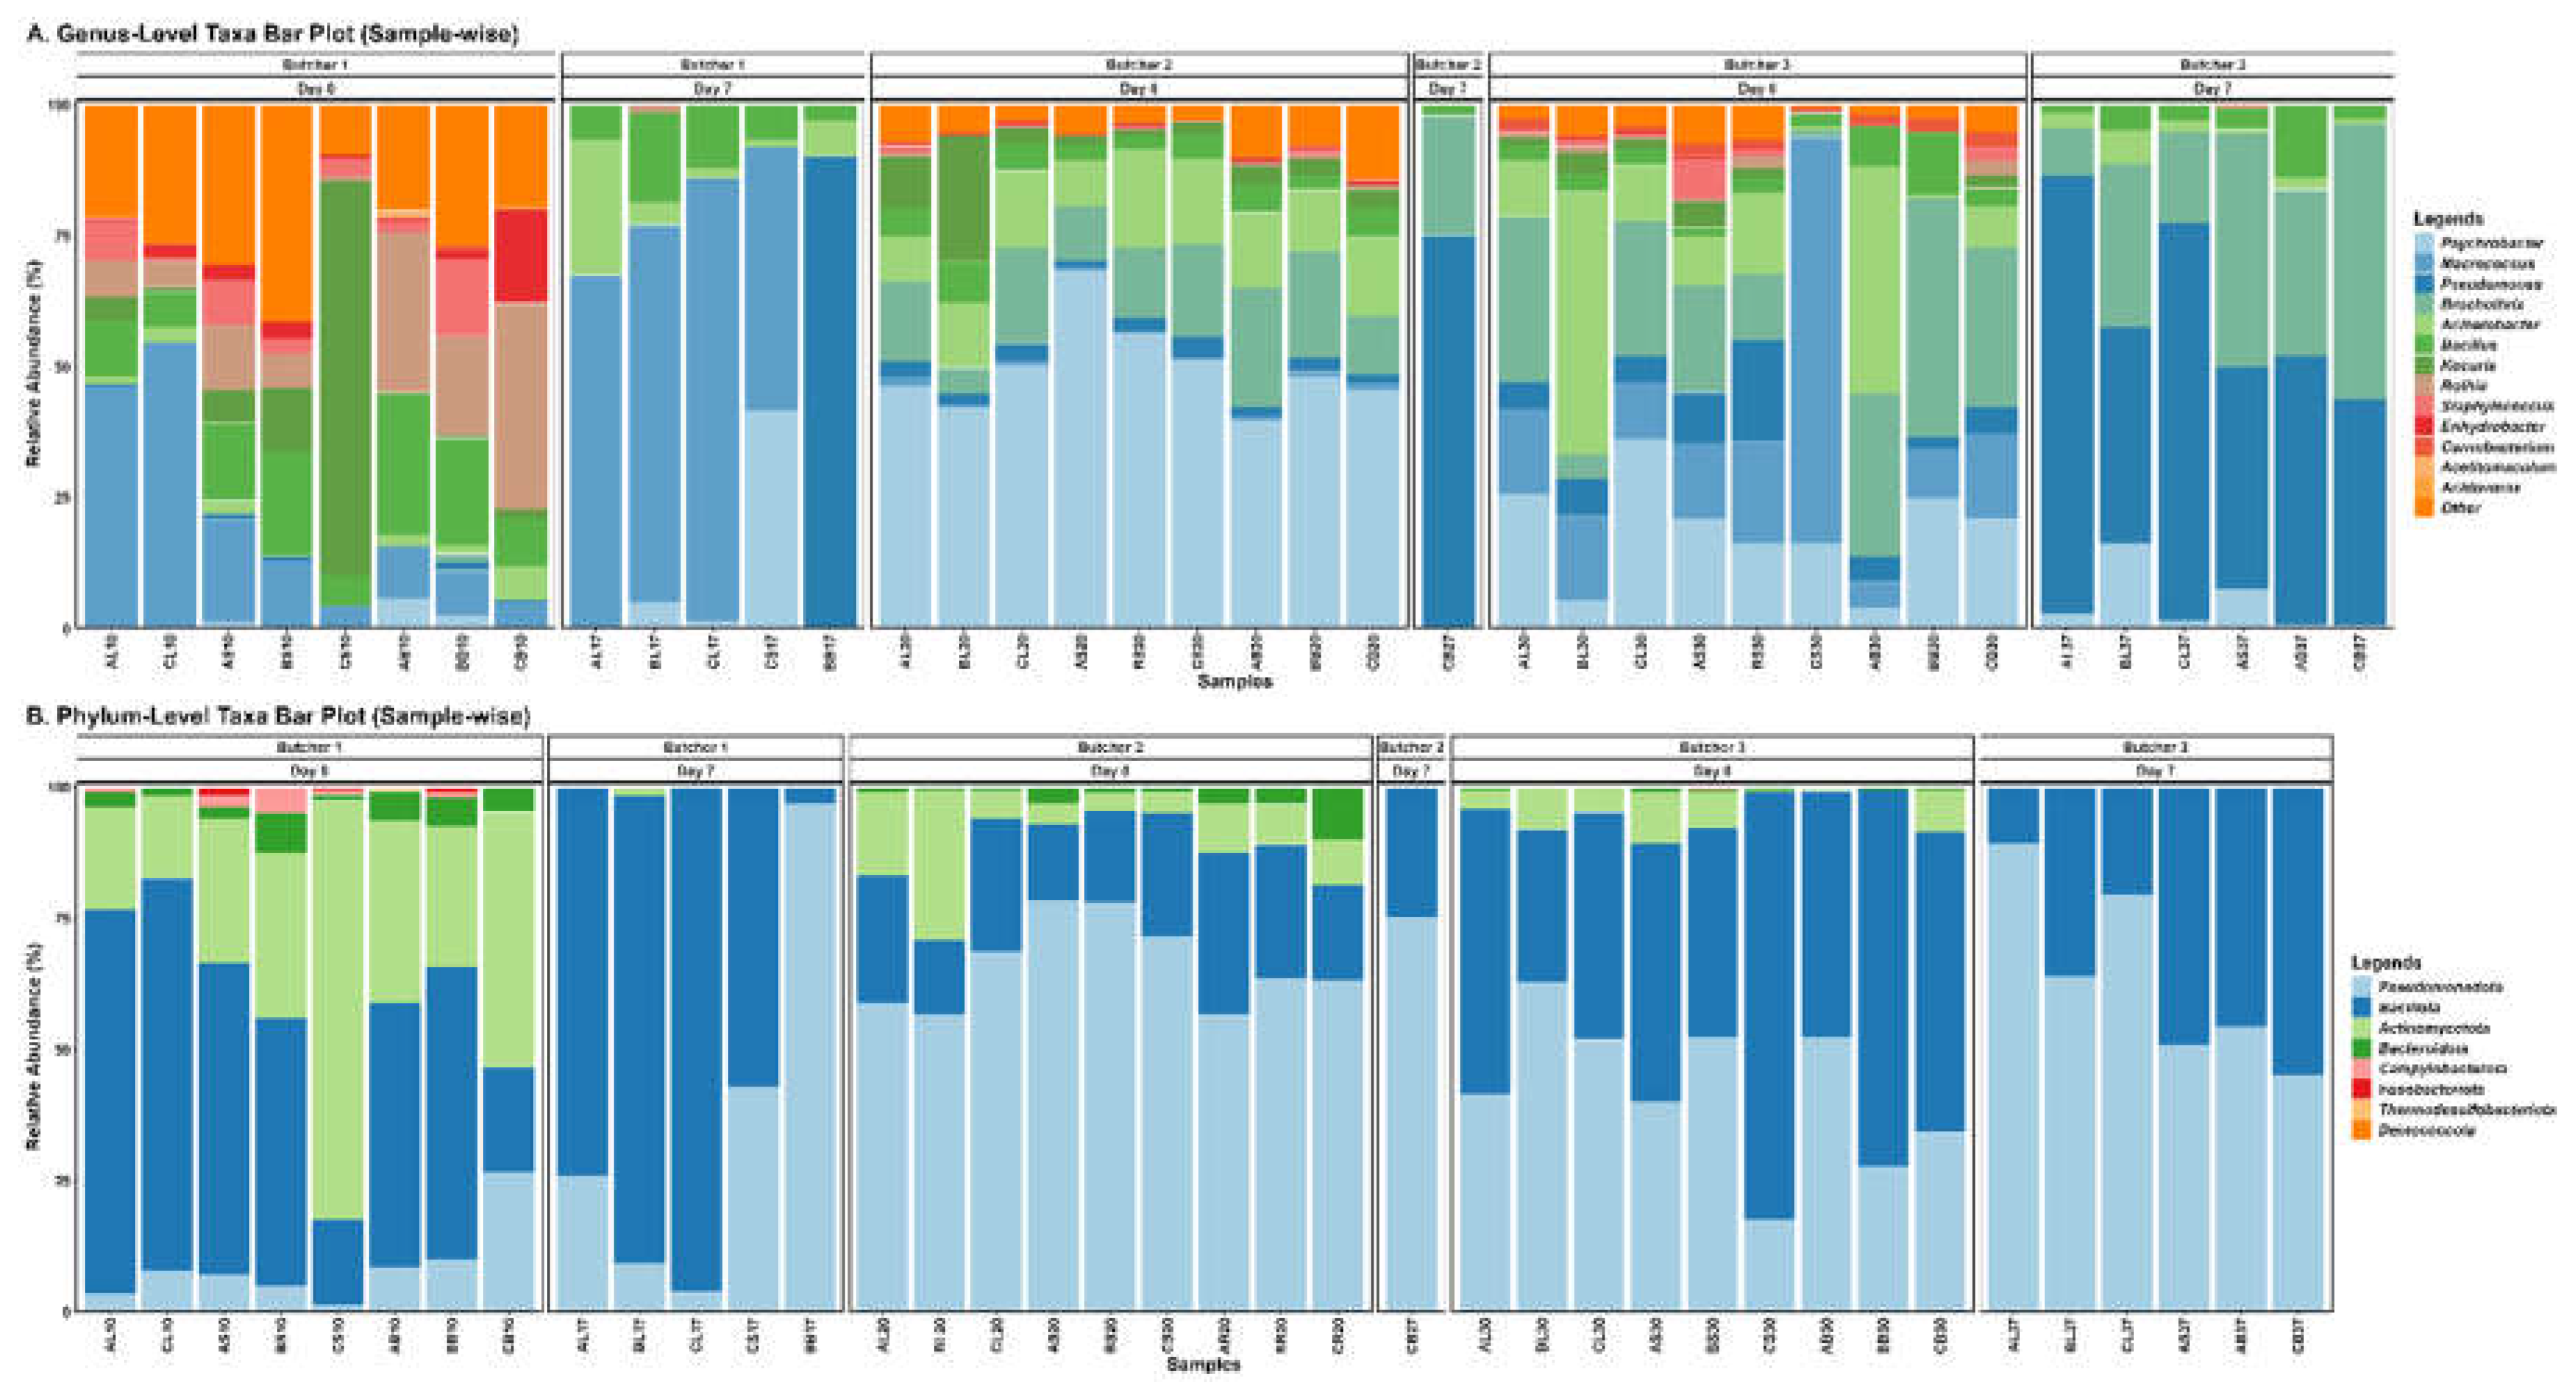
Figure 4.
Differentially abundant bacterial taxa associated with storage duration. (A) Significant genus-annotated amplicon sequence variant (ASV) features identified by MaAsLin2. (B) Significant phylum-annotated ASV identified by MaAsLin2. Positive coefficients indicate enrichment at Day 7 compared with Day 0, whereas negative coefficients indicate depletion at Day 7. Points represent MaAsLin2 model coefficients, and horizontal bars represent approximate 95% confidence intervals calculated as coefficient ± 1.96 × standard error. Features shown passed Benjamini–Hochberg false-discovery-rate correction at q < 0.05.
Figure 4.
Differentially abundant bacterial taxa associated with storage duration. (A) Significant genus-annotated amplicon sequence variant (ASV) features identified by MaAsLin2. (B) Significant phylum-annotated ASV identified by MaAsLin2. Positive coefficients indicate enrichment at Day 7 compared with Day 0, whereas negative coefficients indicate depletion at Day 7. Points represent MaAsLin2 model coefficients, and horizontal bars represent approximate 95% confidence intervals calculated as coefficient ± 1.96 × standard error. Features shown passed Benjamini–Hochberg false-discovery-rate correction at q < 0.05.
Disclaimer/Publisher’s Note: The statements, opinions and data contained in all publications are solely those of the individual author(s) and contributor(s) and not of MDPI and/or the editor(s). MDPI and/or the editor(s) disclaim responsibility for any injury to people or property resulting from any ideas, methods, instructions or products referred to in the content. |
© 2026 by the authors. Licensee MDPI, Basel, Switzerland. This article is an open access article distributed under the terms and conditions of the Creative Commons Attribution (CC BY) license (http://creativecommons.org/licenses/by/4.0/).
Copyright: This open access article is published under a Creative Commons CC BY 4.0 license, which permit the free download, distribution, and reuse, provided that the author and preprint are cited in any reuse.