
Submitted:
13 June 2026
Posted:
15 June 2026
You are already at the latest version
Abstract
Gold and Silver nanoparticles were fabricated using Camellia sinensis extracts, the Camellia sinensis serves as a dual role playing the role of reductant and stabilizers in the reduction of silver and gold and silver ions into the free states and potentially stabilized the surface of the synthesized silver nanoparticles. The synthesized Camellia sinensis stabilized silver and gold nanoparticles were characterized using Fourier Transform Infrared spectroscopy, Thermal analysis, Scanning electron microscope, Transmission electron microscope, Powder X-ray diffraction techniques, Microanalysis and uv/visible spectroscope. The localized surface plasmon resonance appeared at 401nm and gold 535nm. The synthesised green tea-AgNPs were used for the detection of heavy metals such as (copper, nickel and gold) and removal of copper from aqueous solution, the results obtained the ability of the Camellia sinensis stabilized AgNPs(GT-AgNPs) to be used as a portable sensor for the detection of heavy metals and subsequently used for the removal of heavy metals from aqueous solutions. The synthesized green tea stabilized gold nanoparticles were used for the detection of silver, nickel and copper.
Keywords:
nanoparticles
; Camellia sinensis
; reductant
; stabilizer
Introduction
Nanoparticles are materials having one dimension in the range 1-100 nm in the minimum, and they tend to possess physicochemical properties that differ to the bulk material.[2] Nanomaterials can be traced to the Roman era by accidental colouration of glass by throwing coins into melts.[2] Due to the unique property of nanomaterials such as intrinsic particle size and high surface to volume area, they found many applications in the fields of science, industry, biomedical science and medicines.[4,5,6] Nanomaterials are generally categorized based on the dimensions of the material which are in the indo or exo of the nanoregion. In zero-dimensional nanomaterials all the dimensions are measured within the nanoregion Nanoparticles is popular example.
In one-dimensional nanomaterials, one of the dimensions is at the external region in the nanoregion, popular examples are the nanorods. Common examples of 2D nanomaterials are nanolayers and nanofilms as this involved the two of its dimensions are outside the nanoregion.
Three-dimensional nanomaterials (3D): these are classes of nanomaterials that cannot be compressed to the nanoregion in any dimension. Common examples include the nanotubes and multi-nanolayers.[7]
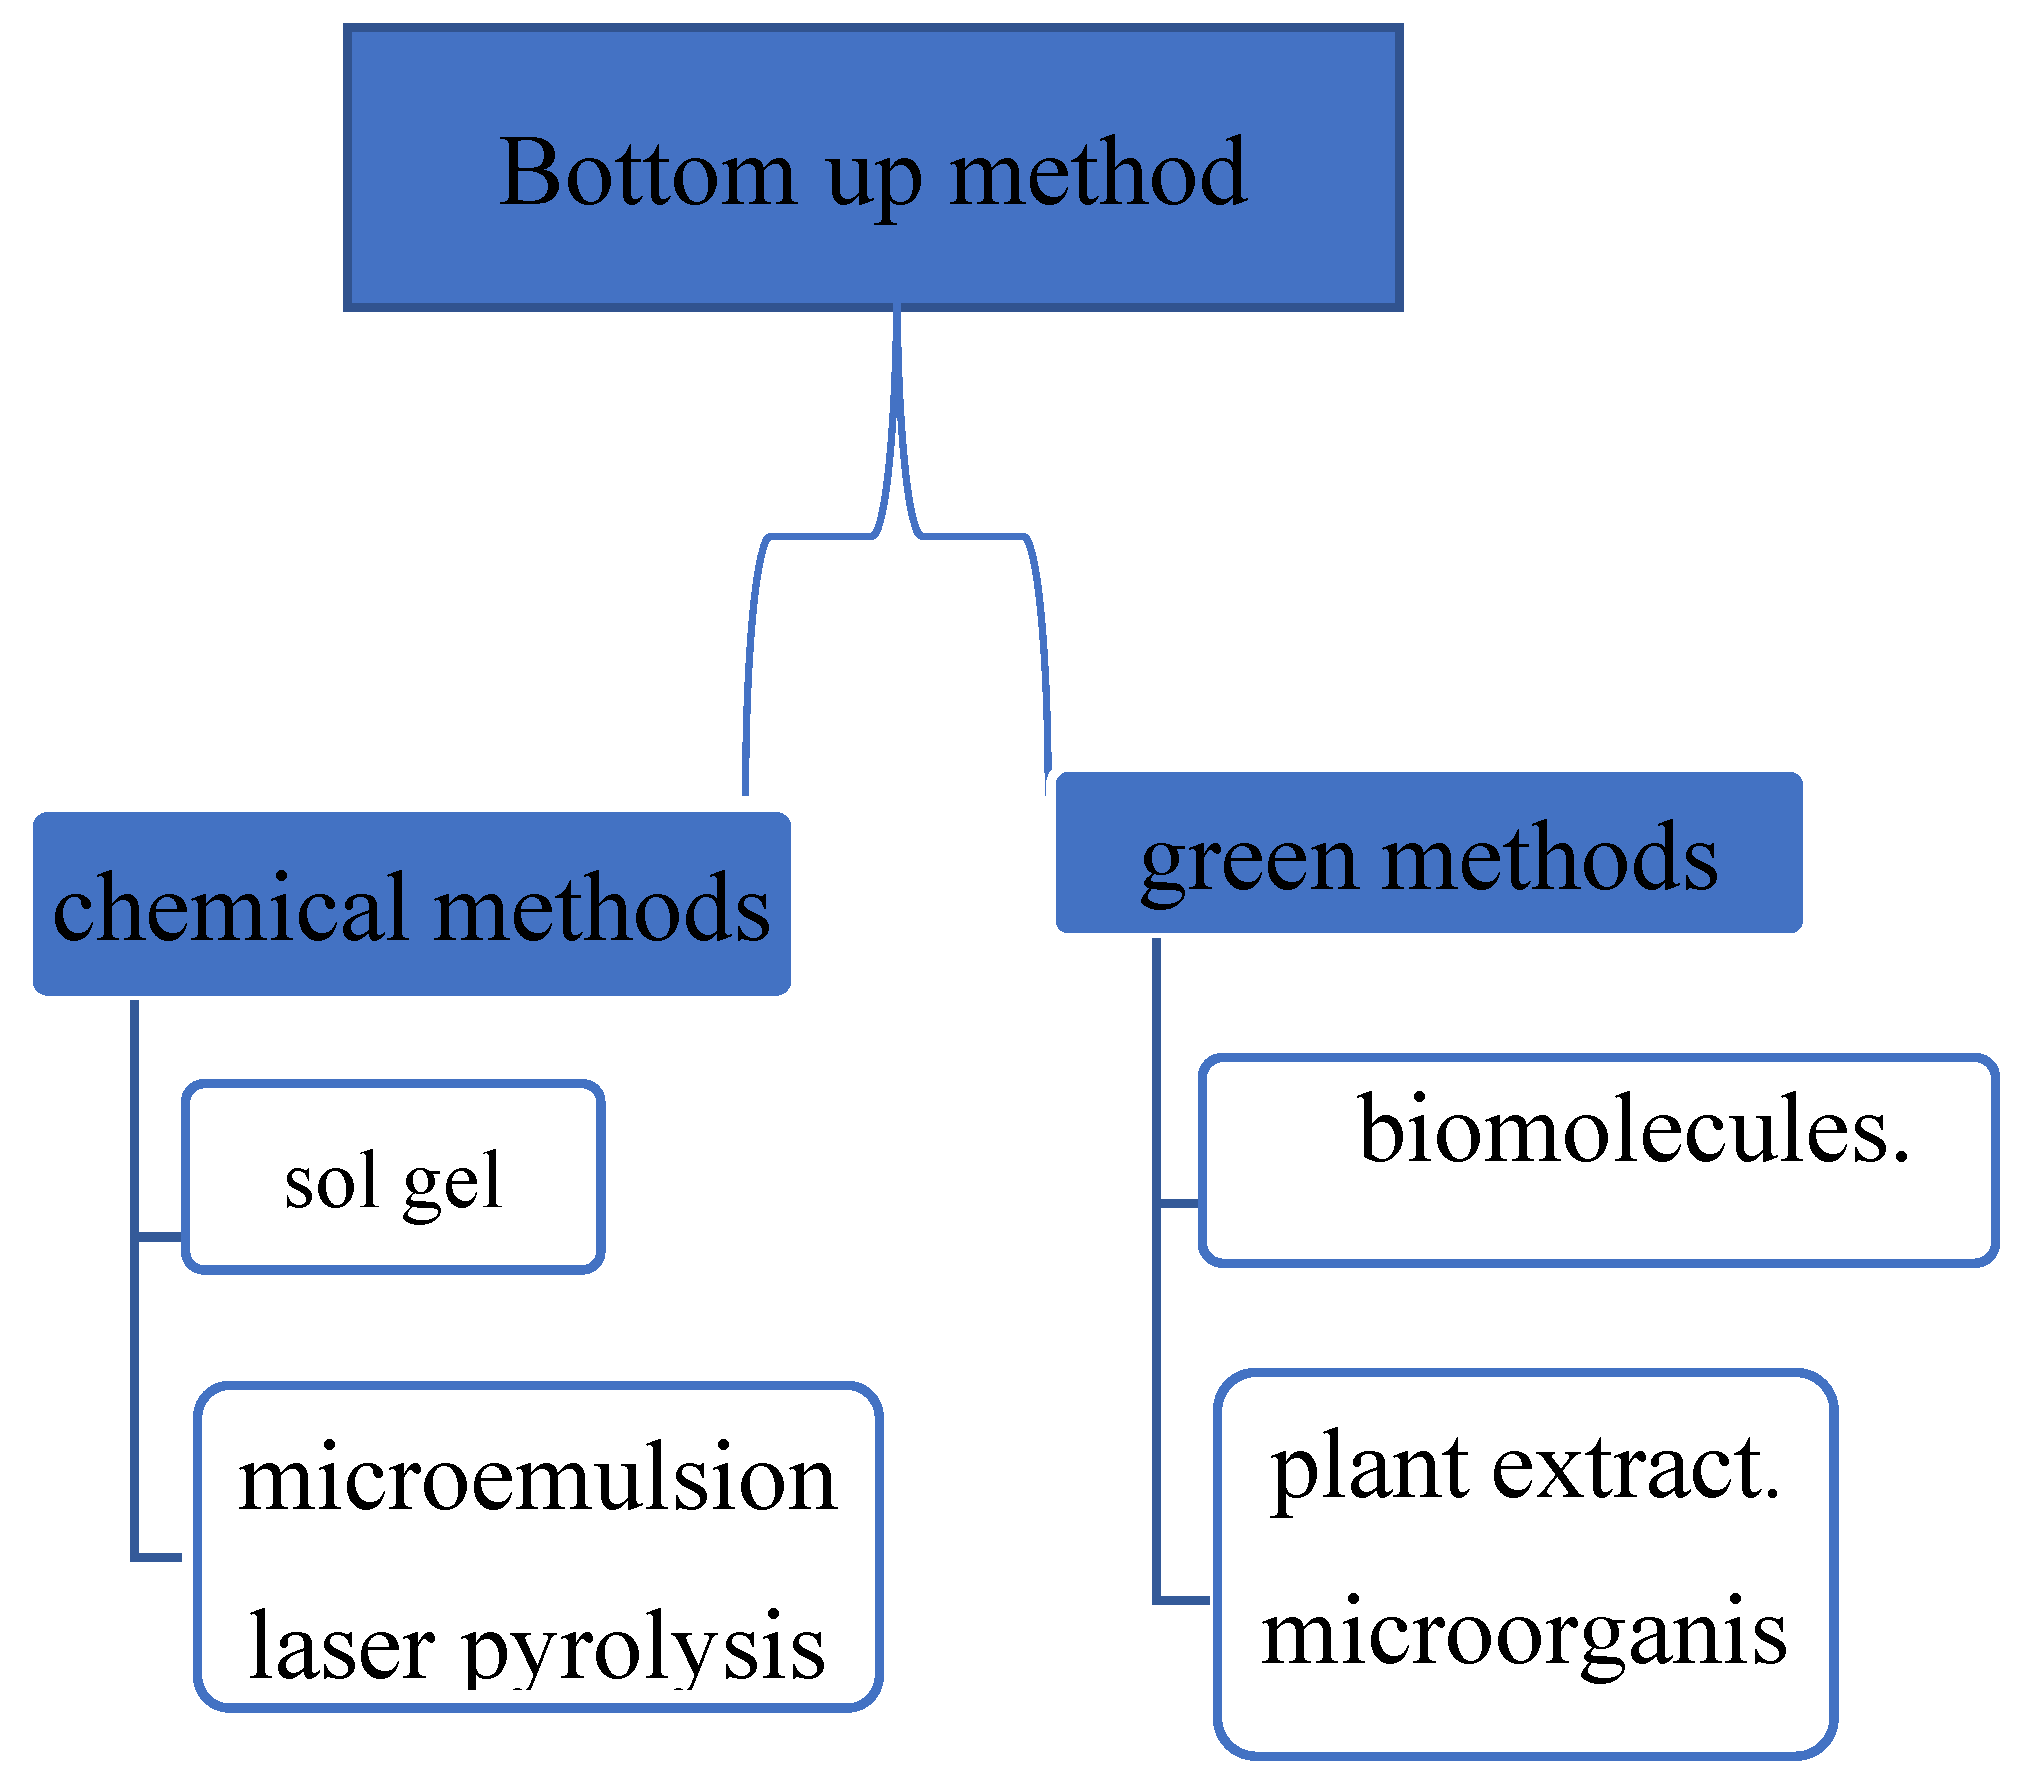
synthesis of metal nanoparticles can be achieved in two ways the top-down approach and the bottom -down approach, In the top-down approach it involves the dissociating of the bulk solids to a small bite of size of particles in the nanoregion, the bottom-up approach involves the starting of nanomaterial with small molecules such as atoms or clusters and building it up to make the nanomaterial and is called bottom-up approach. The bottom-up techniques make use of self-processes for ordering of solid-state architectures from the atomic to the mesoscopic scale. The process of bottom-up include gas-phase and liquid-phase methods. For two synthetic methods, the synthesis of nanomaterials was controlled when starting from the single atom or cluster.
Figure 1.
classification of Bottom -up metal nanoparticles synthetic steps.
Additionally, a new synthetic route called molecular self-assembly emerged. The areas of application for nanotechnology have different fields such as chemical sensors, biological sensors, and energy storage, and catalysis nanomaterial requires the manipulation into functional materials and devices. Self-assembly is the method important for designing and controlling the bottom-up assembly of the materials in the nanoscale range into structures of sheets, tubes, wires, nanoelectronics devices and drug delivery systems [9].In this report a greener routes of synthesized gold nanoparticles were employed which involved the used of extracts of jasmine green tea bags and were applied towards the interaction of heavy metals from aqueous solutions. The greener routes of fabricating metal nanoparticles exclude the use of chemical reductants and stabilizers rather it uses a green and safe approach to fabricate the metal nanoparticles.
Like other systems, AuNPs demonstrate a greater flexibility permitting appropriate size selections, structure and assembly. This unique feature of AuNPs allows for the fine-tuning of NPs properties which leads toa wide range of applications. Synthetic methods used for AuNPs production have been devised and employed since antiquity to make coloured glasses. In 1908, the different colour of gold colloids is explained by Mie by correlating the optical absorption of spherical objects with their dimensions [10] Therefore, the frequency of plasmon resonance can be utilized to estimate NPs’ dimensions. In these report gold and silver nanoparticles were synthesized using a bottom-up approach, green tea extracts were choice as the reducing and stabilizing agent, the synthesized silver and gold nanoparticles were applied towards the interaction of heavy metals (copper, nickel, silver and gold), silver nanoparticles were used to remove copper ions on another set of experiments.
Material and Methods
All chemicals were of analytical grade and were used as obtained from University of York laboratory suppliers. All chemicals and solvents were used as obtained without further purification. The stoichiometry quantities of salts were mixed in deionized water or their respective solvent to prepare the metallic solutions that were used in the experiments. Ahmad Jasmine Green tea bag was sourced from a friend which gifts as a present. gold (III) chlorides, copper nitrate trihydrate, silver nitrate and nickel chloride.
Green Synthesis of Gold Nanoparticles Using Jasmine Green Tea Extracts
To a 1000mL round bottom flask was added 600mL of doubly deionized water, followed by the addition of 5 bag of jasmine green tea leaves. The reaction mixture was stirred continuously at room temperature, after which the extract of the green tea was allowed to cool down and then filtered. To the stirred mixture was added 100mL of 0.002M gold (III) chloride solution in deionised water. The colour of the mixture turned purple-red from pale yellow within 5 minutes after the addition indicating the formation of gold nanoparticles. The reaction mixture was stirred. The colloidal jasmine green tea stabilized gold nanoparticles were then freeze dried for the collection of the product [11].
Green Synthesis of Silver Nanoparticles Using Green Tea Extracts
The method used Satish et.al. 2009 [11] were slightly modified, to a 1000 mL vessel was added 600ml of doubly deionized water (DI), followed by the addition of 5 bags of green Tea leaves (Green Tea). The reaction mixture was stirred continuously at elevated temperature (∼ 100 °C) for 5 min, after which the hot green tea extract was allowed to cool and filtered through a filter paper , 100ml of the tea extract was stirred on the hot plate stirrer and onto the stirring mixture was added 100 mL of 0.1M AgNO3 solution at 60 0C for 60 minutes. The colour of the mixture turned light yellow to pale brown instantly indicating the formation of silver nanoparticles. The reaction mixture was stirred for an additional 5 minutes.
Heavy Metal Detection by Synthesized Green Tea Metal Nanoparticles
The colorimetric measurement of heavy metals such as copper nitrate trihydrate, nickel chloride anhydrous and silver(I) chloride are carried out by preparing 2-20ppm solution of each heavy metal. From it 2ml of each heavy metal concentrations were added to a 20ml glass vial and 2 ml of the synthesized metal nanoparticle solution were added and left to stand for 5 minutes after which the solution was analysed using Uv-visible spectroscopy.
Adsorption Experiments
The adsorption of heavy metals by metal nanoparticles was carried out using 0.1g of the synthesized metal nanoparticles.1000 ppm of the stock solution of each metal ion was prepared as in section 2.5 and from it different concentration ranging from 0.5-20 ppm were prepared by successive dilution with deionized water into these solutions was added 0.1g of synthesized metal nanoparticles was added and agitated in orbital shaker at room temperature for 2 hours after which the solution was centrifuged and the supernatant analysed using Uv/visible spectroscopy. The same procedure was used for each metal nanoparticle.
Characterization of the Synthesized Metal Nanoparticles
Green tea stabilized gold nanoparticles sample were obtained in colloidal state and were dried at 1100C in order to obtain the powdery form, except for the Uv-visible spectroscopy characterization which was performed directly on the aqueous solution of each metal nanoparticles (with appropriate dilution where necessary).
UV–VIS Spectrophotometric Analysis
An UV–VIS spectrophotometer was used to identify the presence of LSPR in the synthesized GT-AgNPs and GT-AuNPs, the sample was diluted with deionized water and taken in a small plastic corvettes cell for the recording the UV–VIS absorption spectrum at wavelength of 300–800nm.
X-Ray Diffraction (XRD) Analysis
Powder XRD was used to identify the crystalline phase and particle size of the prepared material. The sample was placed on a grid of XRD instrument and the diffraction patterns were recorded at 40 kV and 40 mA of voltage with Kβ filter 1D for Cu. X-ray diffraction can be used to determine the size of crystal with phase certain. The determination refers to the main peaks of the pattern diffractogram through approach Debye Scherrer's equation formulated in Equation below.
where D is the crystallite size, K is the Scherrer constant (0.9nm), ℷ is the wavelength of the X-rays used (0.154, β is the Full Width at Half Maximum, radians), and ∅ is the peak position (radians)s.[12]
D = Kℷ/βcos cos ∅
Fourier Transform Infrared (FT-IR) Analysis
The functional groups that stabilize the GT-AuNPs and GT-AgNPs surfaces are observed using FT-IR spectra of the samples were recorded from 650 to 4000 cm−1 with a FT-IR ATR spectroscopy. Resolution was 4 cm-1 and 10 scans were carried out as standard.
Thermogravimetry Analysis
Thermogravimetric analyses were performed using Stanton Red croft STA 625 under nitrogen atmosphere in a low flow rate, and at a heating rate of 10 o C / min.
Microanalysis
The structural organic composition of GT-AuNPs and GT-AgNPs was estimated in order to established the percentage carbon, hydrogen and nitrogen present in each sample.5mg of GT-AuNPs was submitted to the microanalysis unit at Chemistry Department University of York, UK for sample analysis.
Scanning Electron Microscopy
5mg of GT-AuNPs and GT-AgNPs were submitted to the Imaging and cytometry department, University of York for analysis of the morphology and structure of GT-AuNPs and GT-AgNPs
Transmission Electron Microscopy
5mg of GT-AuNPs and GT-AgNPs were submitted to the Imaging and cytometry department, University of York for analysis of the morphology and structure of each metal nanoparticles. Each of the nanoparticle’s colloids suspended in deionized water in the presence of stabilizing agents was deposited and air dried on the specimen grid and observed with a transmission electron microscope (TEM: JEOL – JEM 1010). Transmission electron microscope specimens consist of carbon or collodion coated copper grids. Transmission electron microscope images have been recorded with a JEOL standard software.
Results and Discussion
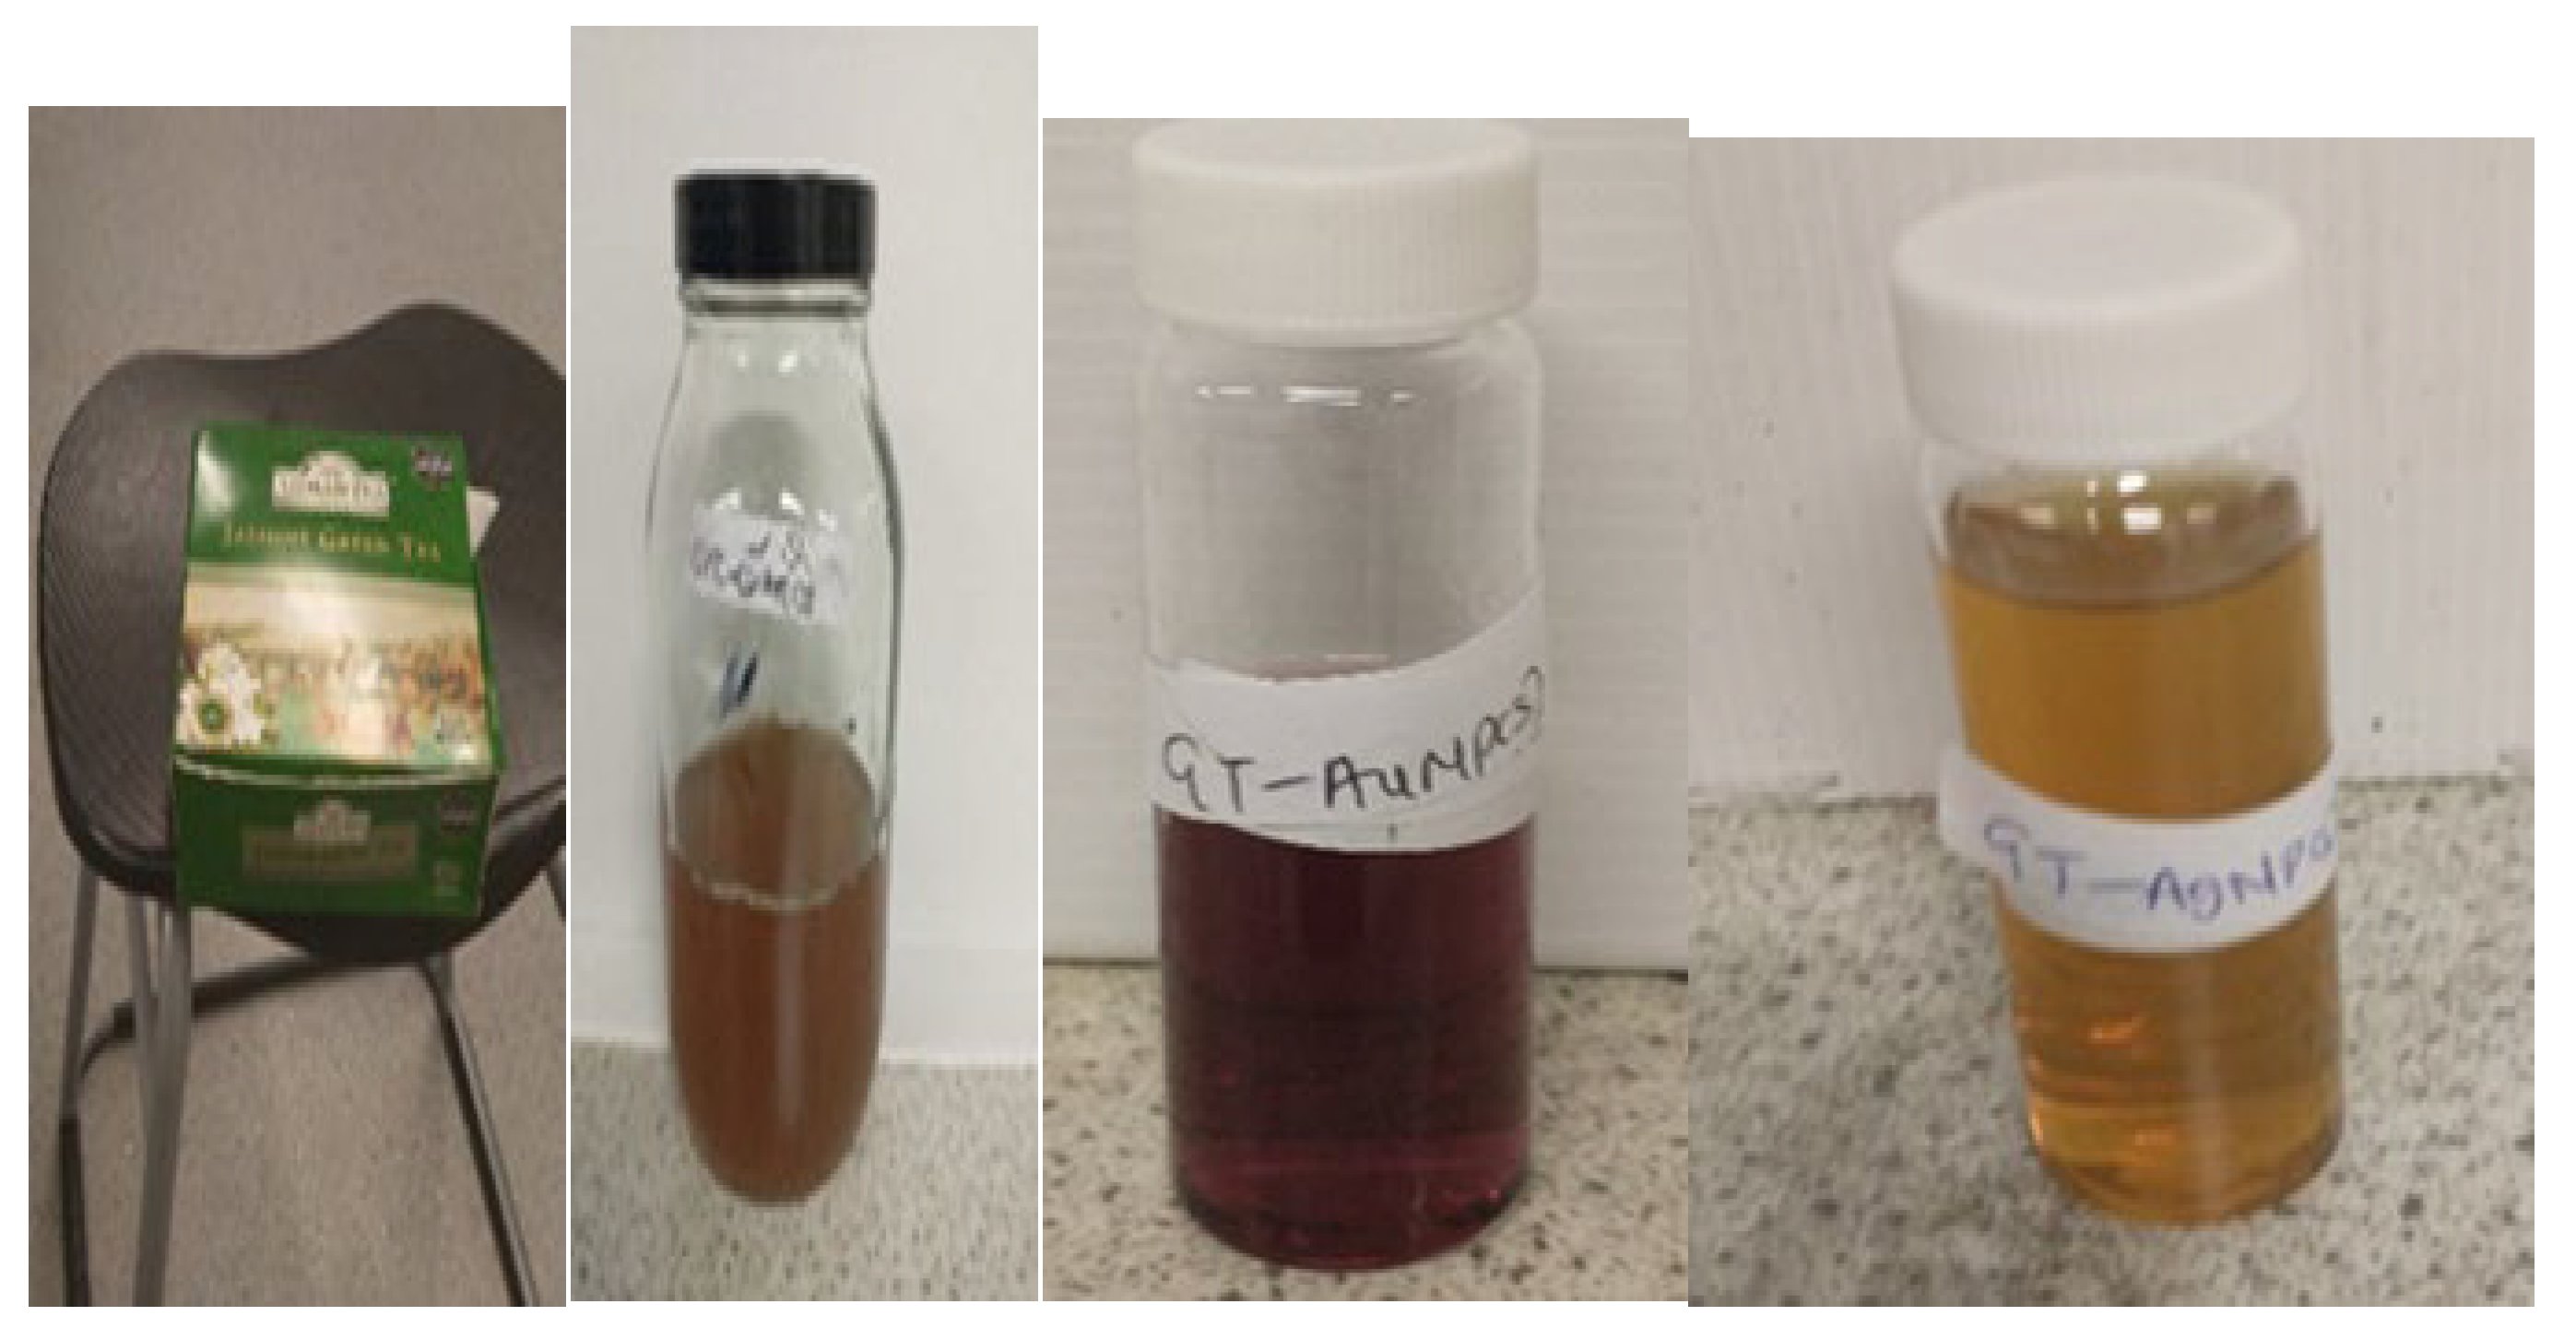
The physical appearance of the synthesized GT-AuNPs appeared to be purple red and the colour transition changer from brown to purplish red after the synthetic process which confirms the complete synthesis of GT-AuNPs. The physical colour of the jasmine green tea silver nanoparticles appears as a vibrant yellow. the initial colour of the extract is brown and addition of silver nitrate to the extract the solution turns yellow after the completion of the reaction times.
Figure 2.
JPEG image A) green tea bags b) green tea extracts c) GT-AuNPs and d) GT-AgNPs.
Fourier transform infrared spectra of green tea silver nanoparticles and dried green tea powder are depicted in (Figure 4). The spectra were explained by the linking of the absorption bands to the respective functional group presents in the compounds which are responsible for the reduction and capping of silver nanoparticles. The spectra of green tea Ag nanoparticles dried powder showed a very broad peak stretching from ca.3500 cm -1 to almost 2100 cm-1 as well as sharper peaks at, 2971, 2851, 1740, 1360, 1218, 1191, and 1000 cm−1. The very broad band is assigned to the O–H stretching of alcohol in polyphenols, acids and N–H stretching in amines. The bands representing sp 3 C–H stretching appear at 2971 and 2851 cm−1. The strong sharp bands at 1740 and 1360 cm−1 are assigned to C=O group of gallate esters or some organic acids found in the green tea extracts respectively; the 1191 and 1000 cm−1 peaks represent C–O–C stretching, and the strong band at 973 cm−1 is assigned to aromatic C=C bending. A phytochemical analysis of green tea powder reveals the presence of polyphenols such as gallic acid, Gallo catechin, catechin, epigallocatechin, protein, flavonoid, saponin, glycosides and some secondary metabolites. [12] The most abundant constituent in Green Tea is polyphenols, accounting for 36 percent in dry weight in the form of catechins [13]. The results obtained from the infrared spectra are broadly consistent to those of polyphenols and saccharides. The Fourier transform infrared spectra of green tea silver nanoparticles (Figure 4) indicate a distinct broad peak from 3357 cm-1 stretching all the way to 2000 cm-1 which is indicative of carboxylic group and also consistent with oxidation of alcohol or aldehydes by the metal salts, 2971, 1744, 1367, 1544, 1000, and 824cm−1 . The peaks at, 2971 cm-1 corresponds to C-H – stretching, and 1744 cm−1 correspond to C=O stretching, respectively. The remaining bands at 1367, 1000, and 1544 cm−1 are assigned to aliphatic amine NH band, C–O stretching, and C=O carboxylate, respectively. The peak at 824cm-1 corresponds to C–H twisting. Changes in the spectral of chemical components of green tea dried power and green tea silver nanoparticles can be recognized by comparing their respect infrared spectra. All the vibrational peaks in the green tea dried powder spectrum were shifted in the green tea silver nanoparticles spectrum, they tend to be narrower after reducing and stabilizing of the nanoparticles. Literature study revealed that it likely the presence of flavonoid in the green tea plays a significant and has help in reducing the silver from +1 states to zero sates which is due to the abundance of the hydroxyl group which makes epigallocatechin gallate (epigallocatechin-3-gallate) a powerful antioxidant and a strong reducing agent for the nanoparticles fabrication [14], after the nanoparticles synthesis, the colloid were dried in the oven and the powder are washed with ethanol and deionized water and further dried at 103 0C at this stage the epigallocatechin would have dissolved away.
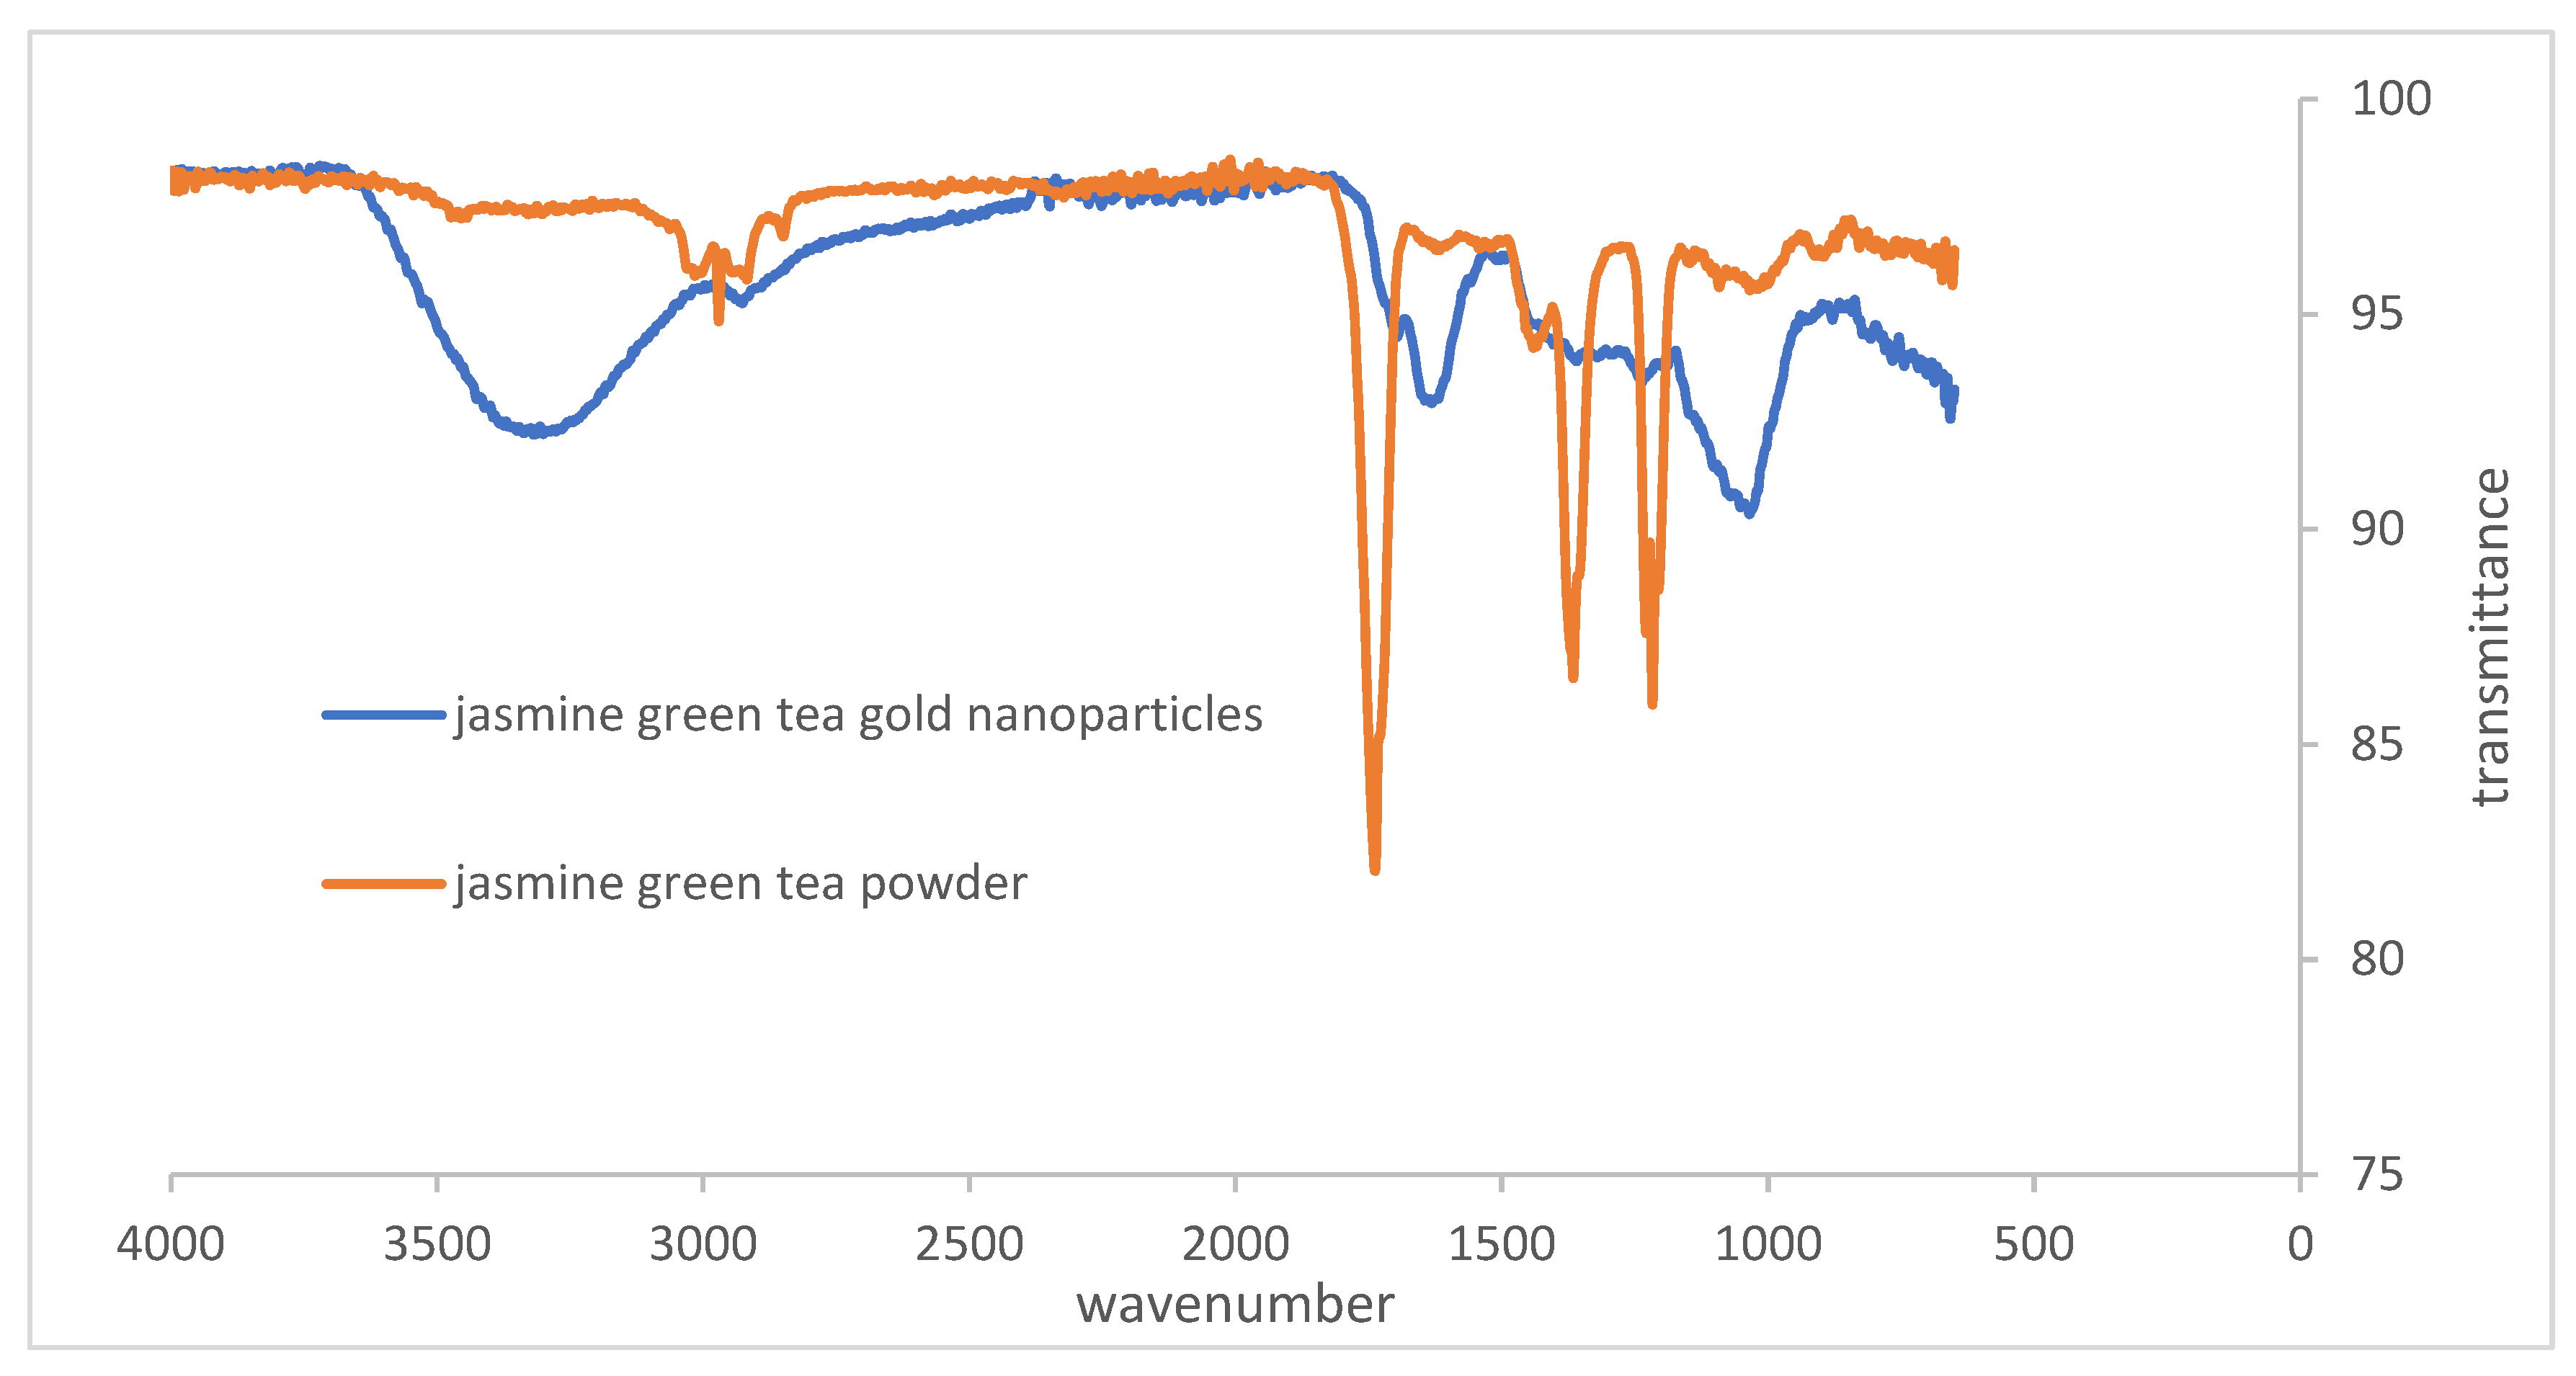
The Fourier transform infrared spectra of green tea powder and colloidal solution of green tea gold nanoparticles was obtained immediately after the synthesis process. In order to investigate the nature of interaction between the tea extract and gold(III) ions, Fourier transform infrared spectra were carried out, it could be observed that the green tea powder consists of a weak broad peak in the region of 3454 cm−1 corresponding to the O–H stretch and the peaks at 2971, 2907 and 2785cm−1 are assigned to the sp3 C–H stretching vibrations of the organic constituents of the jasmine green tea. A band at 1739 cm−1 could be attributed to the C=O stretch of the acid groups present in green tea powder and the peak at 1366 cm−1 could be assigned to the stretching vibration of carboxylate ion (–COO–). A peak at 1217cm−1 shows the C-O- stretching vibration in the polyphenolic compounds and peaks at 1220 and 1000 cm−1 could be attributed to the C–O and C–OH single-bond vibrations. The peaks present at 813 and 631 cm−1 confirm the presence of aromatic-substituted rings .In the spectra of green tea gold nanoparticles, some changes are seem: a new peak at 1708 cm−1 and a slight shift in the C=O stretch from 1739 cm−1, the appearance of a broad band of -OH—band in the region of 3312 cm -1 .The rest of the fingerprint region is broader and weaker , but no clearly new peaks appear compared to that of green tea gold nanoparticles after the reaction with tea extract as shown below. The new peak at 1708 cm−1 could possibly be due to the conversion of C–OH group to C=O group during the reduction reaction of Au3+ → Au. The very low intensity of this peak also suggests that most of the C–OH groups remain as such and only a small fraction of them converts to C=O group, which is in good agreement with the fact that tea aliquot is taken in large excess to carry out the reaction. A red shift in the carbonyl frequency by 31 cm−1 indicates a weak coordination between the carbonyl group and the surface of green tea AuNPs, which suggests that the gold nanoparticles are protected by the polyphenolic compounds present in tea. From the FT-IR spectra of green tea GT-AuNPs the fabrication of the GT-AuNPs can be attributed to the reduction and stabilization pattern of flavonoids present in the jasmine green tea.
Figure 3.
Chemical structure of epigallocatechin gallate.
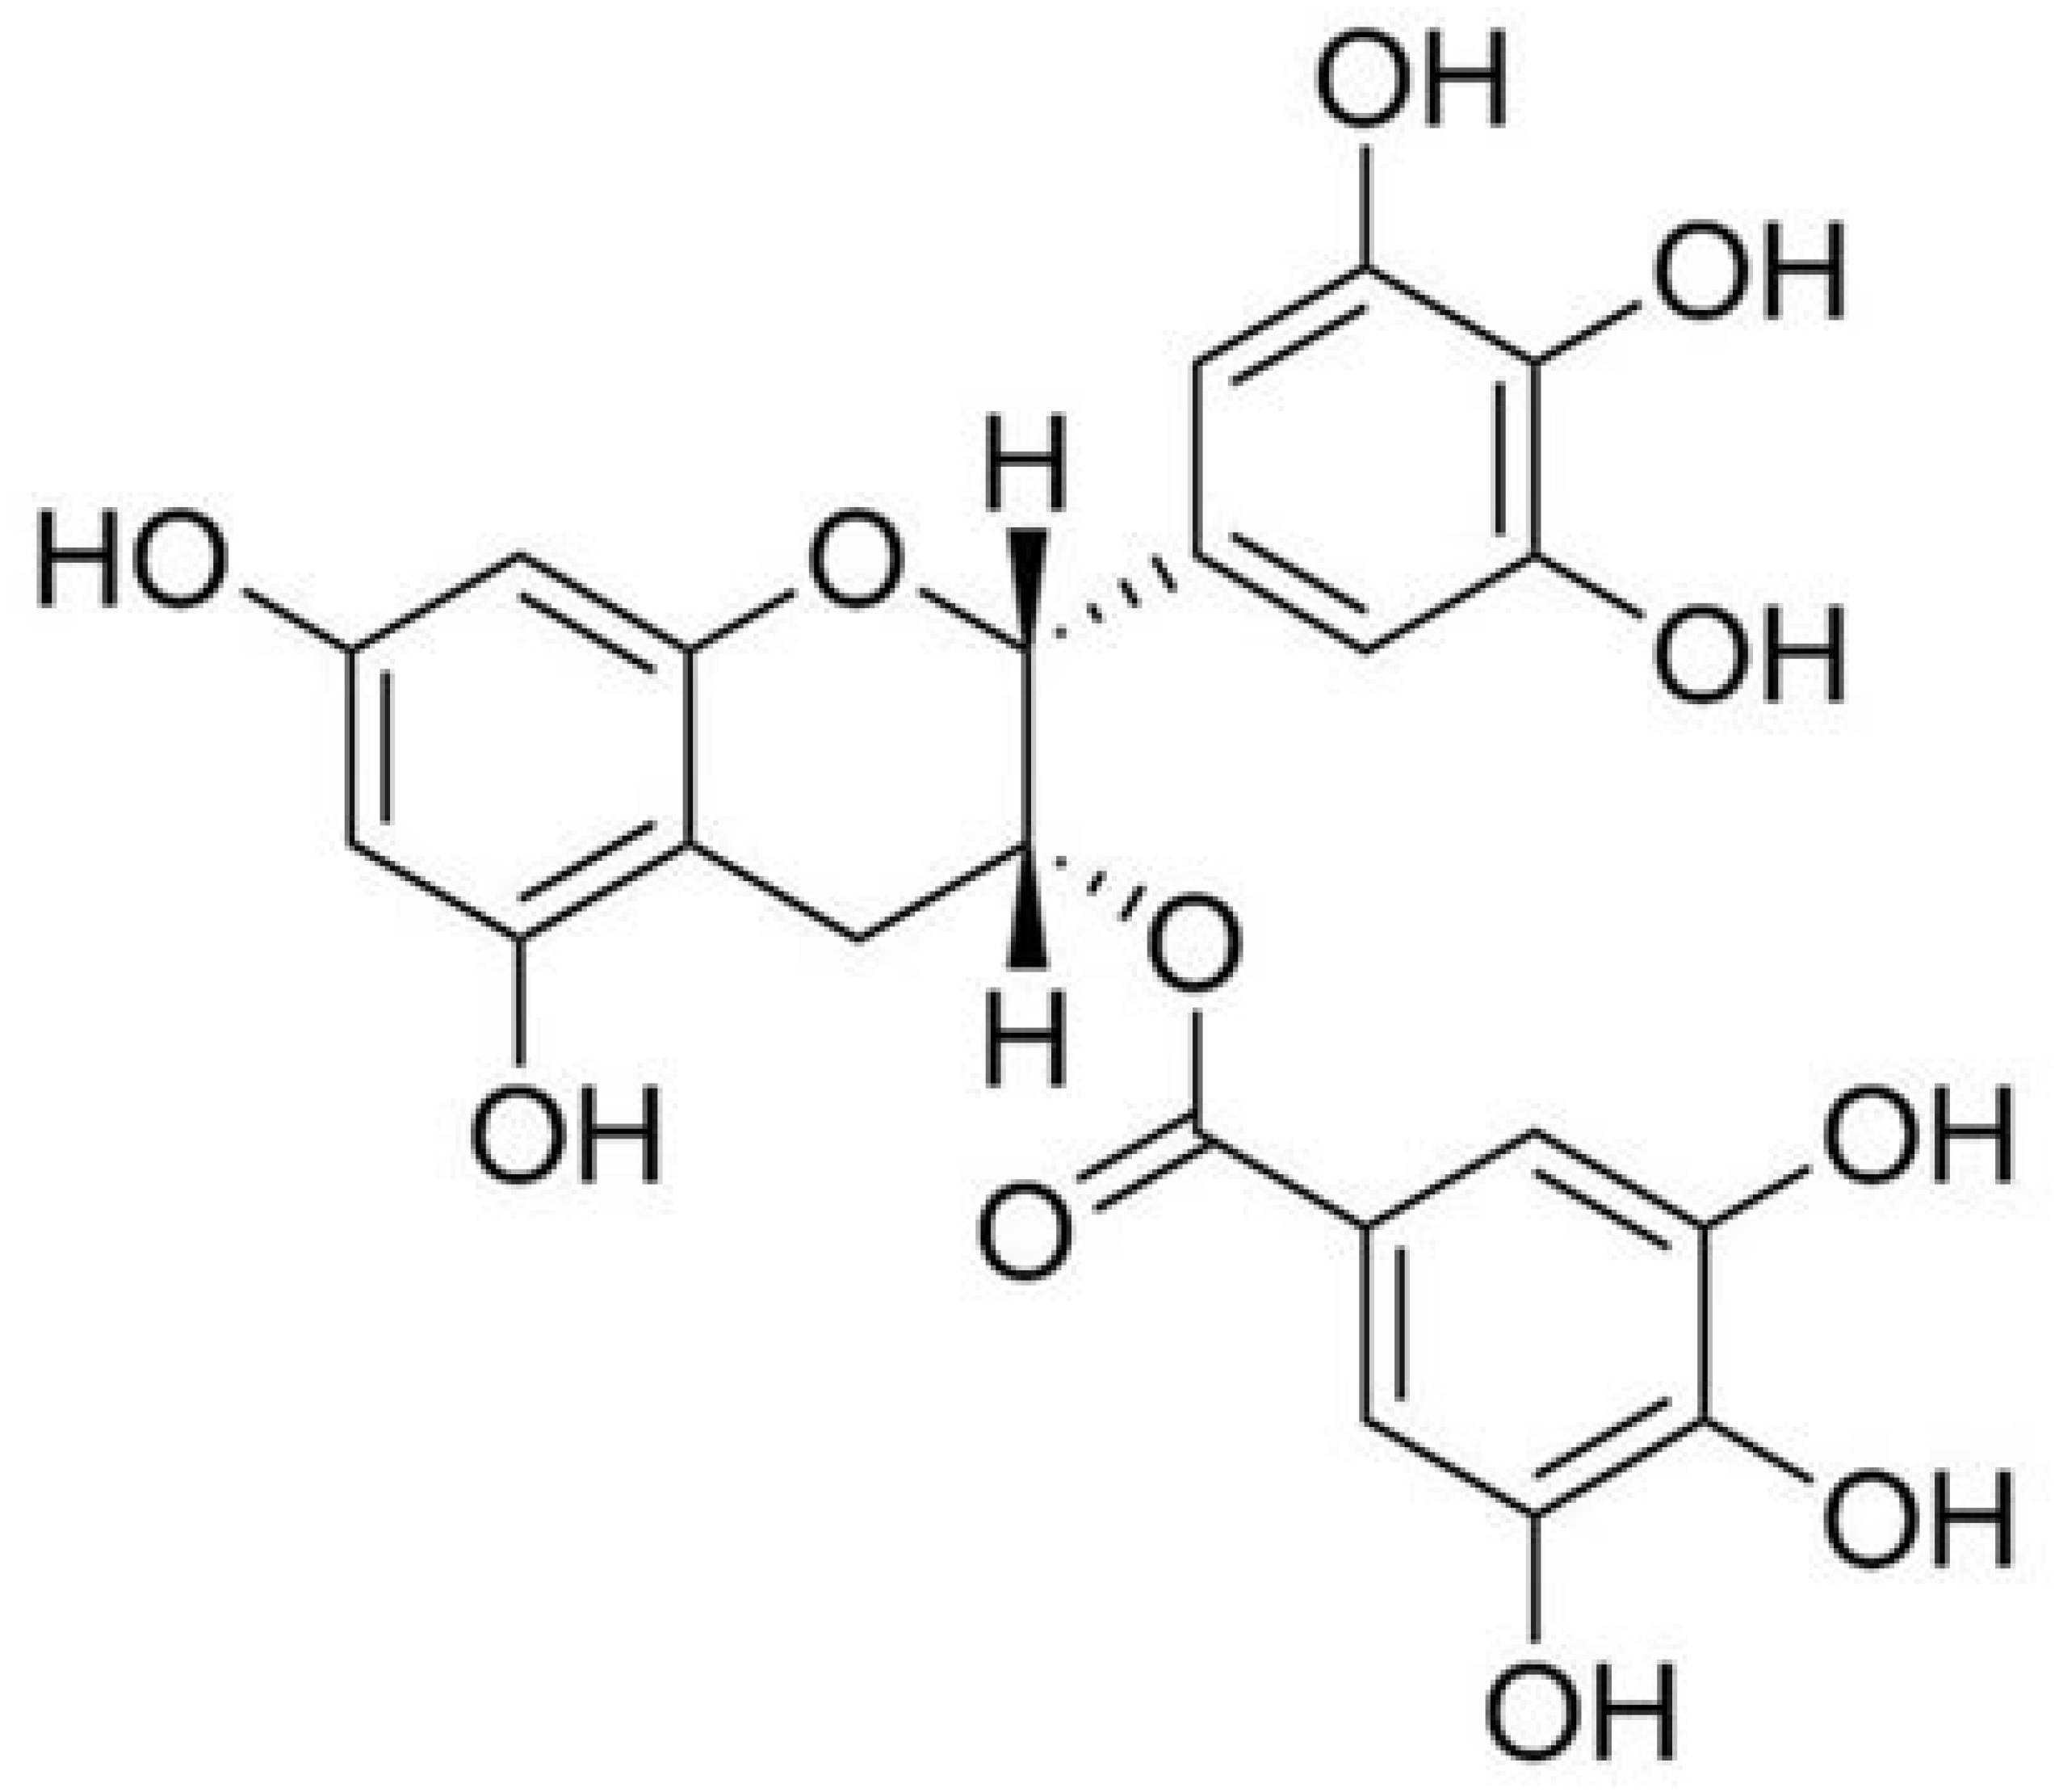
Figure 4.
FTIR of GT-AgNPs and green tea dried powder.
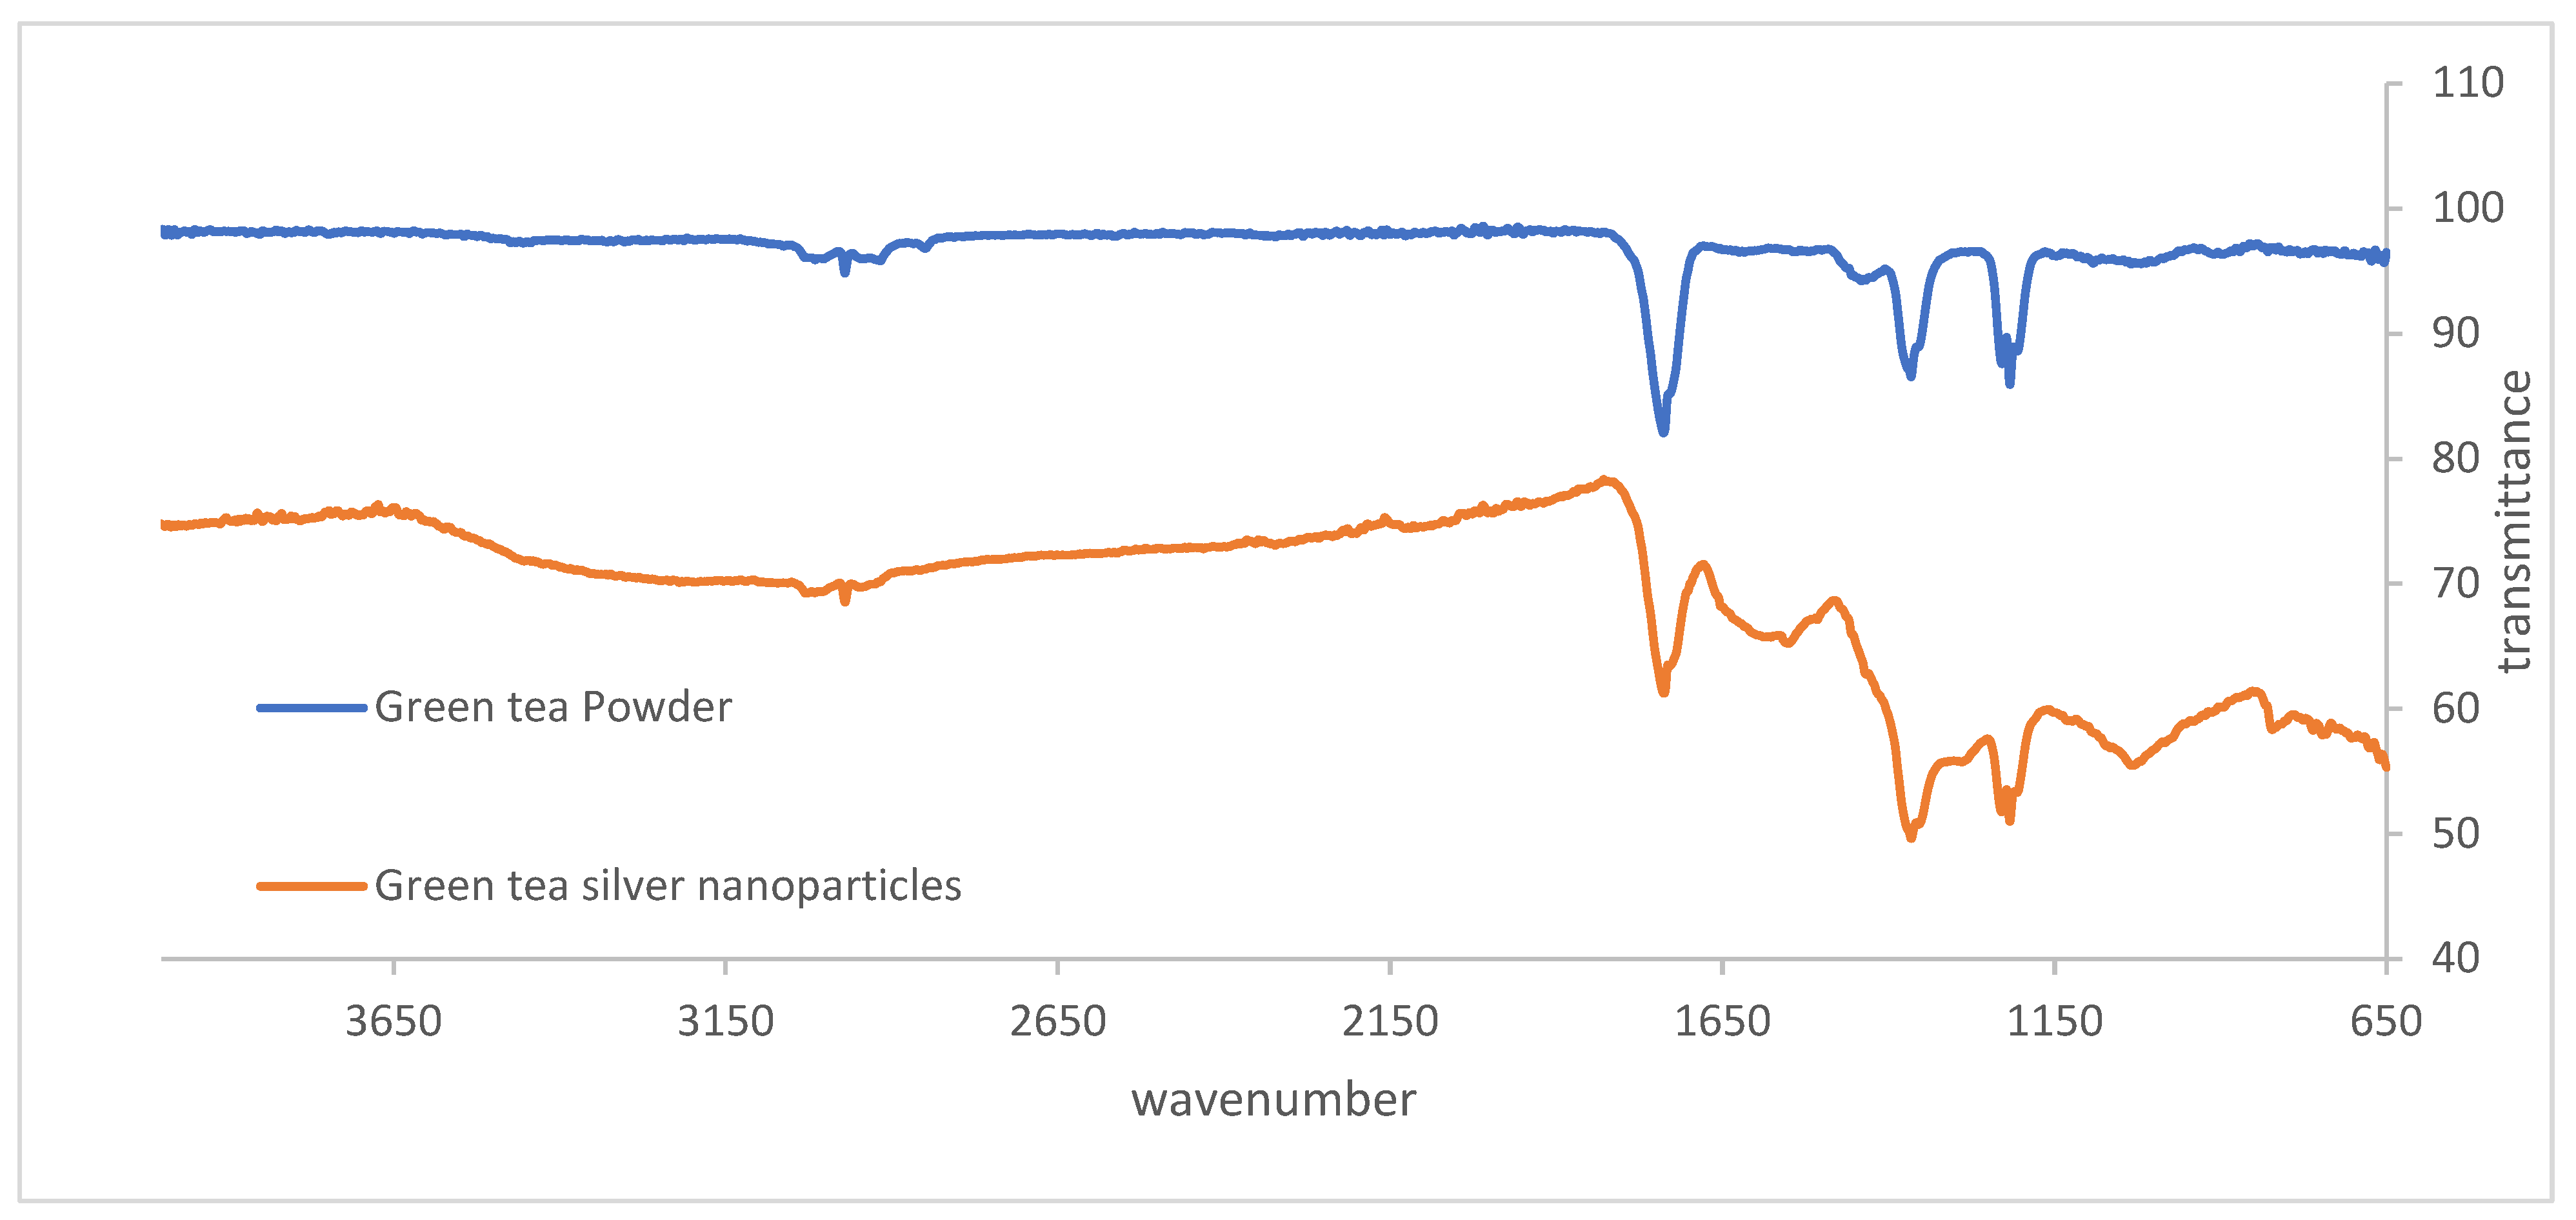
Figure 5.
FTIR of GT-AuNPs and green tea dried powder.
The silver nanoparticles absorption band are affected by the size of particles, dielectric effect, and immediate chemical environments.[15,16,17,18] Nanoparticles sized between 2 and 100nm, is identified with a characteristic localized surface plasmon peaks.[19,20,21] A study published by Nazima et al., 2020 [22] concluded that the average peak for silver nanoparticles was noticed at the range of 370- 430 nm. A research study conducted by Alomar et al., 2020 [23]focused on the use of a green chemistry technique to produce eco-friendly metal nanoparticles using Peganum harmala leaves. Uv−visible spectroscopy was employed to analysed the synthesized silver nanoparticles, and a sharp peak was detected at 350 nm for neem, aloe Vera, Indian mint, and guava leaves, Alex et al., 2020 [24]observed localized surface plasmon resonance bands of silver nanoparticles at 446, 456, 443, and 347 nm, respectively. In another study, in which Al Masoud et al., 2020 [25] prepared silver Nanoparticles from ginger, an absorbance peak was observed at 434 nm, A study carried out by Rani et al., 2020 [26] saw the use of a green approach to synthesize highly stable spherical silver nanoparticles. This study involved the use of UV−visible spectroscopy to examine the stability of nanoparticles over three months, where a sharp band between 420 and 430 nm was detected. Parit et al., 2020 [27]conducted a further green study and reported the existence of two distinct peaks at 363 and 426 nm when synthesizing non-spherically shaped silver nanoparticles. In this research, the localized surface plasmon resonance was observed at 441 nm which confirms the complete synthesis of the silver nanoparticles by the green tea extracts. The LSPR was observed at 441nm and remains stable with time.(Figure 6) .Absorption spectra of the synthesized green tea gold nanoparticles (Figure 7) reveals the existence of surface plasmon resonance wavelength at 535nm. Presumably the Flavonoids components embedded in the green tea can be responsible for the effective reduction of gold ions to zero oxidation state gold nanoparticles, their chemical topologies permit effective encapsulation around the gold nanoparticles thus retarding aggregation and agglomeration of the nanoparticles. The recent discovery on the distinct feature of phytochemicals components in tea in initiating nanoparticle formation is of significant value in the fabrication of greener gold nanoparticles and this has makes it useful for medical and technological applications under safe conditions.[28,29,30,31,32,33,34]The LSPR of the synthesized jasmine green tea gold nanoparticles was observed at 533nm and remain stables with time certainly for over 60 minutes and then drops.
The thermogram curve of the green tea synthesized silver nanoparticles were depicted in Figure 8, 5mg of the green tea silver nanoparticles samples were placed in the Thermogravimetry analysis pan and this was placed in the thermogravimetry analyser and was analysed in a nitrogen atmosphere w the temperature of 25 0C to 625 0C at a heating rate of 10 C per minutes. The first weight loss was observed at 1000C which is attributed to the loss of retained water molecules at the nanoparticles surface. The second weight loss, which accounted for 6% of the total green tea silver nanoparticles weight, appeared at 180–6000C. The decomposition of organic components presents in the nanoparticles considered for these weight loss [35]. A steady weight loss appeared near the end of the analysis time, which accounted for larger amount of the total weight loss which might be due to the thermal degradation of more resistant components (either present form the start or formed in the earlier stages of thermal treatment organic compounds and the decomposition of biogenic salt, such as carbonates from oxidation of the alcohol or aldehyde by the metal salt [14]. Data from thermogravimetry indicated the content of tea component estimated from the weight loss was 6% of the green tea extract synthesized silver nanoparticles.. Thermogravimetric analysis shows that the green tea gold nanoparticles are homogenous in nature and contain a significant number of organic constituents. The earliest weight loss for the synthesized green tea gold nanoparticles occurred at 180-190°C and shows a steady weight loss in the temperature range from 180–620 °C with a total weight loss up to 650 °C which is about 50 % percent weight loss and the breakdown of the loss is as follows , 22.2.2 % and occurred at 190 °C (13 %), 200-390°C, (10 %), and 640 °C (31.71 %). The thermograph of the synthesized green tea gold nanoparticles is in best agreement with the research published by Hojat et al., 2018 [36]. As there is no expected weight loss over this range for gold, and it is likely that the organics decompose partly to volatiles and partly to involatile carbonaceous deposits, it appears that the organic content is at least 50%. The thermolysis jasmine green tea extract(dried) suggest it contains 15% water and also volatiles components.
The percentage Carbon hydrogen and nitrogen of the green tea silver nanoparticle revealed that 18% of the fabricated nanomaterials are organic and 82% is the remainder component and oxygen contents. These results are in best agreement with the Powder x-ray diffraction analysis of the jasmine green tea silver nanoparticles which suggest 84 percent of jasmine green tea silver nanoparticles. The PXRD software using match and find the percentage metal present in the examined sample. The discrepancies in the TGA and microanalysis data might be as a result of some of the carbon rich organic compound are probably left in the sample. The CHN analysis of jasmine GT-AuNPs shows that there exists a total of 66.6 % inorganics and 33 % organic compounds and this is in best agreement with the TGA data obtained for GT-AuNPs. (Table 1). If we assume that the extracts retain their overall composition after NP formation, then the 66.56% remainder in the GT-AuNPs should consist of [53.13 / 42.21]x29.4 = 37.0% oxygen from organics. If we also assume that the residual mass in the GT-AuNPs is composed of the same proportion of residual mass from the extracts themselves, plus all the gold, then the residual 66.56% is 7.52% O and 59.15% Au. we see the presence of N in the AuNPs (Table 1). This suggests that there may be selective adsorption of some components form the extracts onto the NP surface (e.g. protein) and thus the above calculation can only be an approximation.
The Powder X-ray diffraction pattern of the jasmine green tea silver nanoparticles are depicted in the (Figure 9) The XRD peaks at 2θ degree of 38.1, 44.3, 64.4 and 77.4 can be attributed to the (1 1 1), (2 0 0), (2 2 0), and (3 1 1) crystalline planes of the face centred cubic crystalline structure of metallic silver (JCPDS file No. 01-071-4613). Besides, the peak near 31.9 implied the possible existence of Ag2O [27]. The diffractogram of the dried jasmine green tea silver nanoparticles and jasmine green tea there are appearance of peaks which are not the diffractogram of the latter. the crystalline feature of green tea gold nanoparticles was confirmed with an X-ray intensity (Figure 6) which reflected from crystals which are highest at certain angles. Diffraction peaks appeared at 38.067, 44.215, 64.291, and 77.592 in a 2θ range 100–80° relating to (111), (200), (220), and (311) facets of a face centred cubic crystal structure (JCPDS. No. 004-0784) and showed the crystalline structure of prepared gold nanoparticles with green tea extract. this shows the possible synthesis of the AuNPs of FCC crystal structure.
Scanning Electron Microscope of Jasmine Green Tea Silver Nanoparticle
The scanning electron microscope images of Green tea silver nanoparticles are (Figure 9) and the SEM of jasmine green tea silver nanoparticles are made up of clusters of Nanoparticles which are predominantly dispersed in the form of spheres. The nanoparticles were very close to each other within the formed spherical range, which may be due to the high stabilizing power of the green tea extracts. Similarly, SEM image of silver NPs (in organic solvents) are also made of clusters of NPs. SEM images of the green tea gold nanoparticles synthesized showed the existence of cluster nanoparticles. The particles comprise of nearly spherical and some occluded shapes of nanoparticles. This variety of geometrical shapes is typical of green synthesis of gold nanoparticles and has been described in the literature [37,38,39,40].
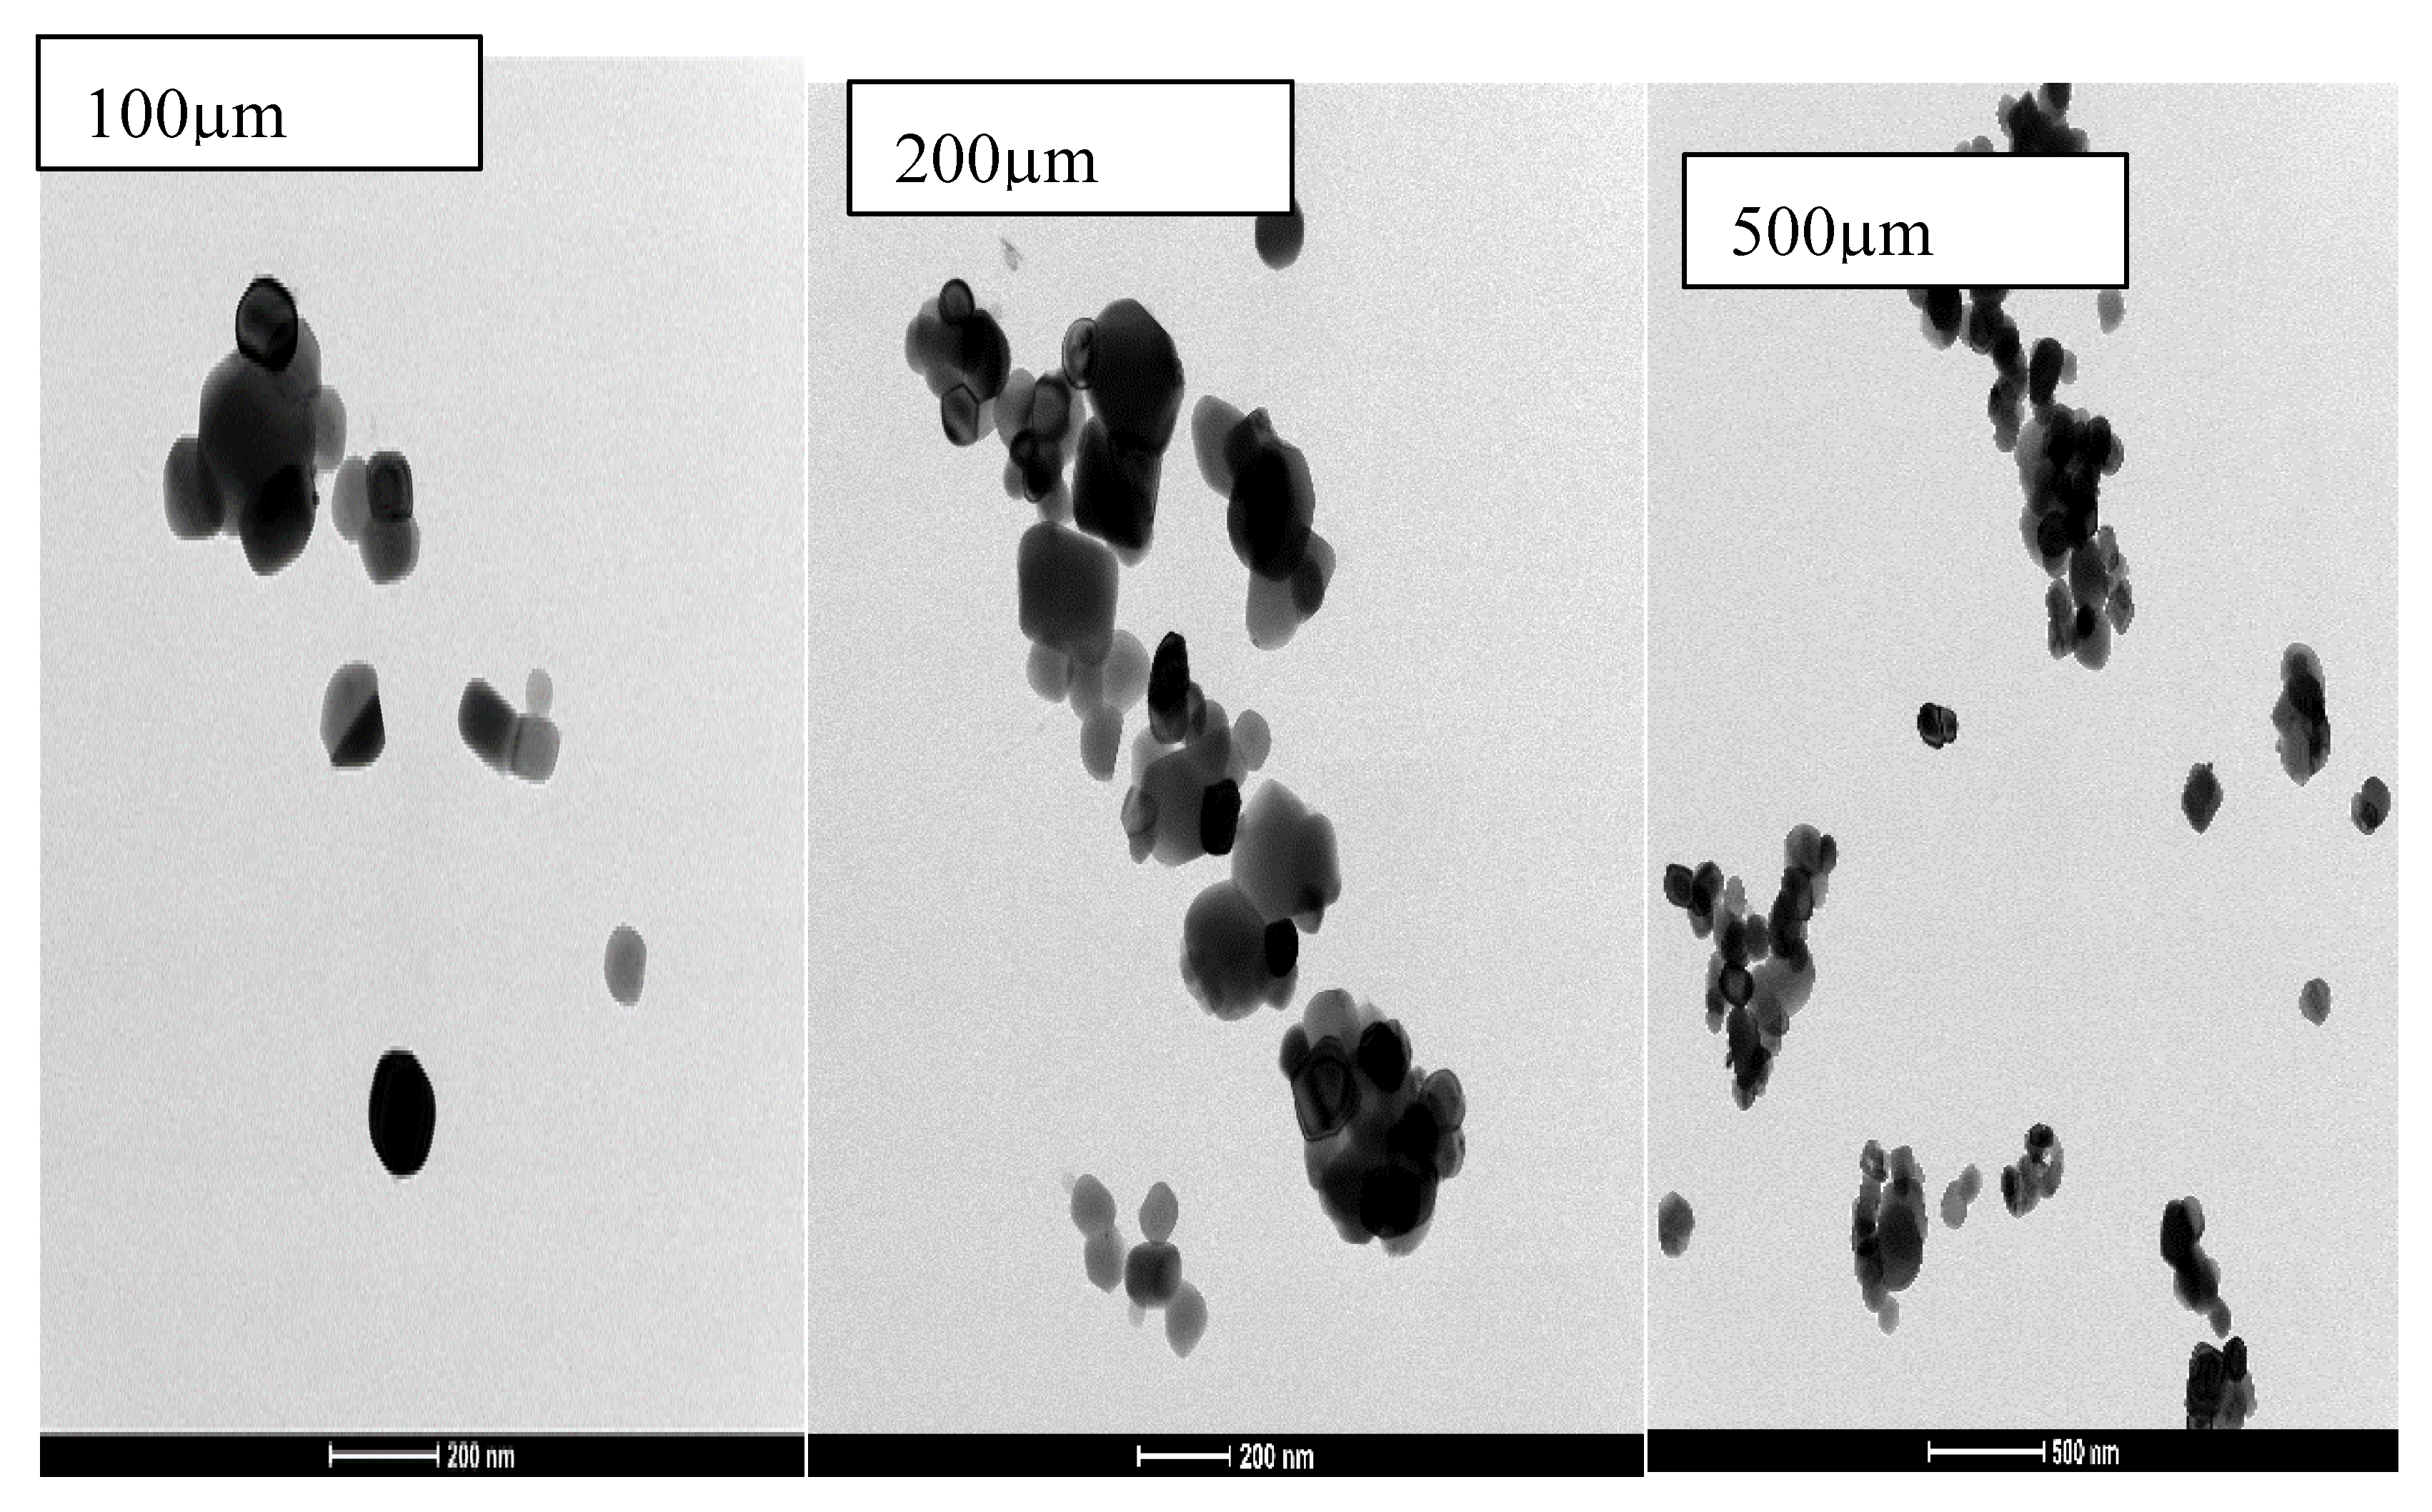
TEM image was employed to further complement the scanning electron microscope results in order to characterize the size, shape and morphology of the synthesized green tea silver nanoparticles. The Transmission electron microscopes images of jasmine green tea silver nanoparticles morphology depicted in Figure 10 shows a mixture of spherical in nature and some diamond forms. Green tea silver nanoparticles have particle sizes ranged from 20 to 90 nm. High resolution transmission electron microscopy was applied to determine the dimension and shape and morphology of the nanoparticles. The transmission electron microscope obtained for the synthesized green tea gold nanoparticles are depicted below (Figure 7). Based on the image, the synthesized nanoparticles tend to be spherical in nature, it is obvious that green tea gold nanoparticles have a nearly spherical and triangular morphology with an excellent distribution of particles with sizes between 30 and 50nm. Based on this image, the green tea gold nanoparticles contained lattice fringes, which confirmed their great crystallinity. The crystalline nature of the particles was clearly indicated by the lattice structures shown in image. (Figure 12)
Figure 11.
TEM images of jasmine green tea silver nanoparticles.
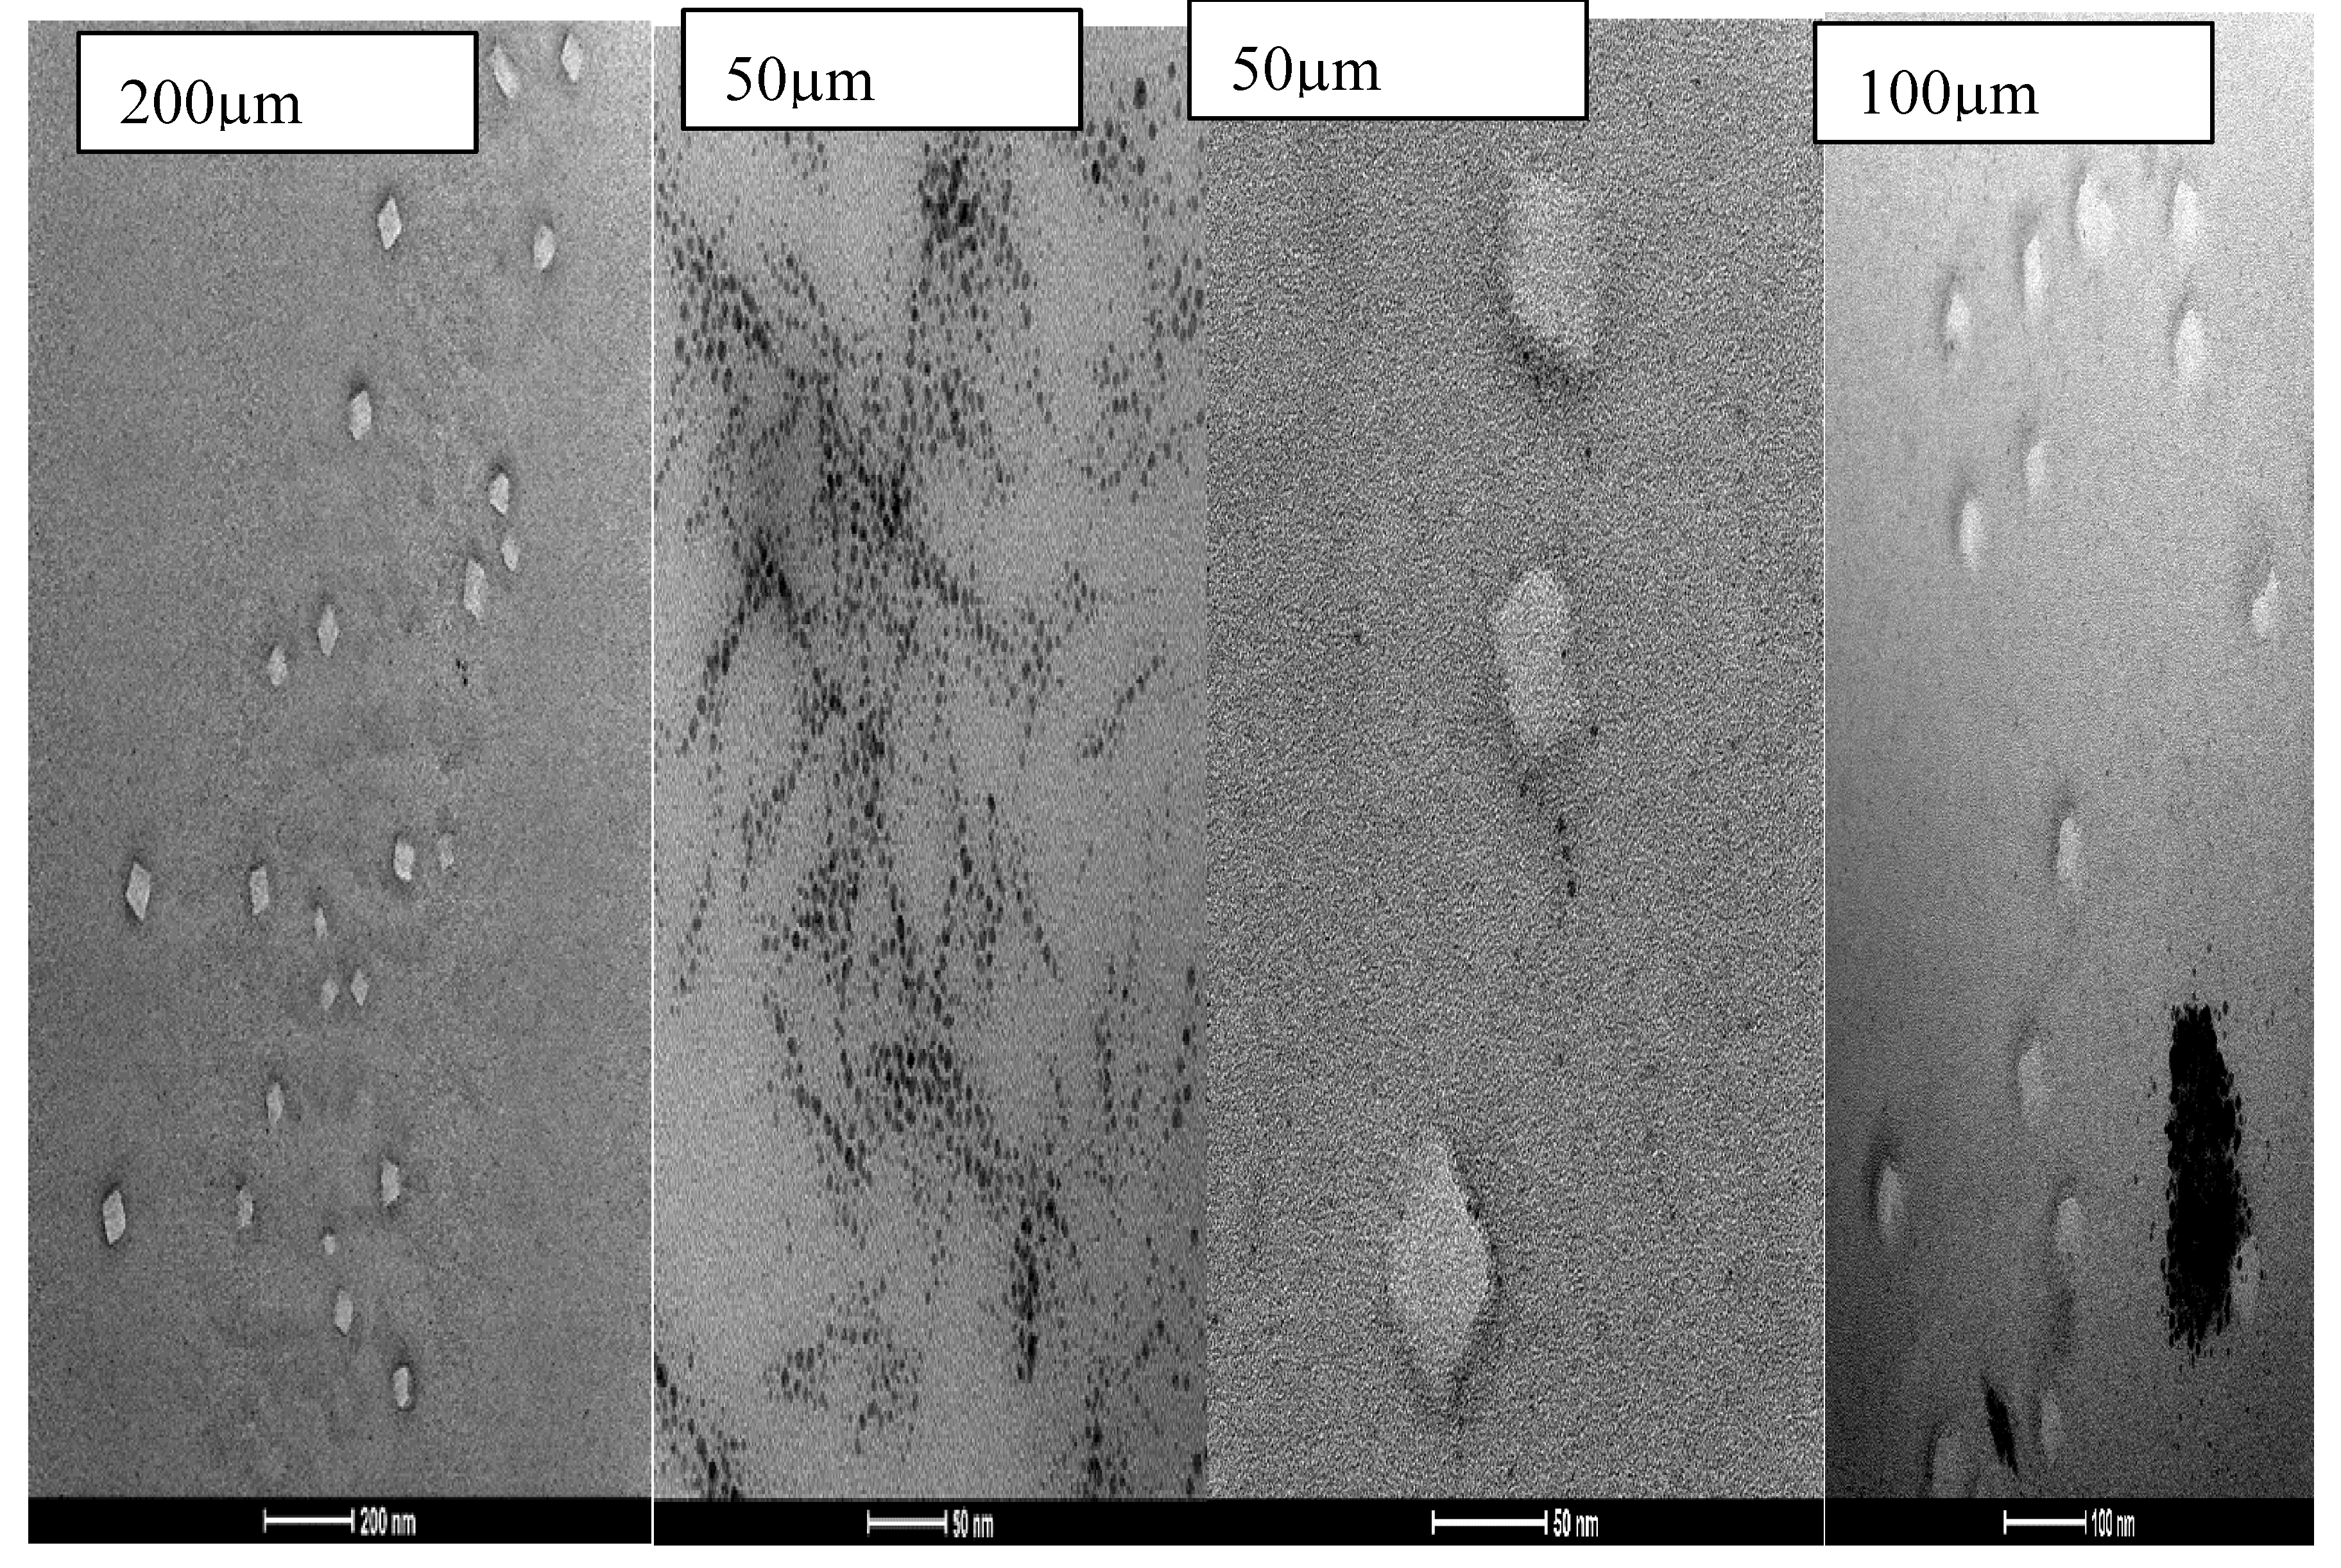
Figure 12.
TEM of jasmine green tea gold nanoparticles.
Interaction of Nickel with GT-AuNPs and GT-AgNPs
The interaction of heavy metals by GT-AuNPs shows a distinct pinkish red colour after 5 minutes contact time, The LSPR tends to remain the same with shape of the LSPR. (Figure 13). The interaction of Ni(II) ions with GT-AgNPs induces a slight bathochromic shift with a change in the shape of the LSPR indicating the possible detection of Ni(II) by GT-AgNPs, (Figure 14)
Detection of Au(III) by GT-AgNPs and Ag(I) by GT-AuNPs
The interaction of Au(III) by GT-AgNPs show a bathochromic shift in the LSPR. The visual colour observation changes from yellow to light brick red colour, the LSPR shifted from 424 nm to 446 nm. (Figure 15) The interaction of silver by GT-AuNPs appear to change from purple red to pinkish purple and the quenching of the silver by GT-AuNPs appears to have shift the LSPR from 537 nm to 571 nm with the change in the shape of the LSPR. (Figure 16). The interaction of copper by GT-AuNPs shows that the initial pink colour changes after the 5 minutes contact times and the intensities of the colour decrease as the concentration of the copper increases. The LSPR suffers a slight blue shift from 537 nm to 534nm. (Figure 17).
Adsorption of Cu (II) by GT-AgNPs
Effect of Initial Concentration
The effect of initial concentration was tested on the concentration ranges between 20-800 ppm and 0.1g of the adsorbents agitated for 2 hours after which the adsorbents were separated from the supernatant using filtration methods, the supernatant solution is analysed using Uv-visible spectroscopy. The quantity of Cu(II) ions adsorbed increased with initial concentration till 400ppm and tends to desorbed at 800 ppm. (Figure 13)
Effect of Contact Time at Optimal Dose
The adsorption reaches equilibrium at 60 minutes. (Figure 14)
Effect of Dose at Optimal Initial Concentration and Time
The qe of Cu(II) ions decreases with the dose of GT-AgNPs. Which might suggest that at 400ppm of the metals the metals is not sufficiently available to be removed by the GT-AgNPs.(Figure 15) and subsequent increase in the dose of GT-AgNPs lead to decrease in the qe values.
Effect of pH at Optimal Initial Concentration, Optimal Time and Dose
The qe values increases for Cu(II) ions examined as expected, the reason can be attributed as a result of the high pH is been dominated by negative charge and the surface of the GT-AgNPs is also negatively charged and there exist a strong electrostatic attraction of the metal cations and the GT-AgNPs as a result of these.(Figure 16)
Effect of Temperature at Optimal Initial Concentration, Time, Dose and pH
The qe values increases for Cu(II) ions adsorbed by GT-AgNPs increases with the temperature.(Figure 17)
Adsorption Isotherm
Adsorption Kinetic
The adsorption fits best using Pseudo second-order kinetic model. (Figure 19) Which suggest the adsorption process is more of physisorption’s rather chemisorption’s.
Adsorption Thermodynamic
The change in enthalpy values at -29.88 kj/mole, the change in entropy values at 97.98 J/Mol/ K and the change in Gibbs free energy give -59.08kj/mole. The adsorption of Cu (II) by GT-AgNPs suggests a spontaneous process and there is an increase in the disorder overall. (Figure 20).
Conclusions
The synthesis of metal nanoparticles using jasmine green tea extracts shows the ability of the extract to reduce and capped the metal nanoparticles as this is evidenced by the various analytical tools used in the characteristics of the metal nanoparticles. The metal nanoparticles synthesized were exposed to various metal ions at low (2-20 ppm) concentrations. In the majority of cases there was a clear change to the LSPR, which often diminished in intensity, and also shifted as is depicted in the following, The detection of Ni(II) by GT-AgNPs Detection of Au (III) over the range 6 ppm- 20 ppm by GT-AgNPs shows a change in the yellow colour of GT-AgNPs to a reddish brown and there exists a change in the LSPR of the GT-AgNPs with a red shift.Detection of Au(III), Cu(II) and Ni(II) by GT-AgNPs shows a suitable interaction with the heavy metals examined and thus no signals of gold were shown in the uv-visible spectra and thus shows the potential of the green tea synthesized Ag-NPs to be utilized for interaction with heavy metals. Adsorption of Cu(II) by GT-AgNPs shows the potential to remove heavy metals from aqueous solutions. Detection of Ag(I) by GT-AuNPs shows a colour change from, brick red to pinkish colour over the concentration range examined and there exist a shift in LSPR from 537nm to 571nm. gold was shown in the uv-visible spectra and thus shows the potential of the green tea synthesized Ag-NPs and GT-AuNPs to be utilized for interaction with heavy metals. Detection of Ag(I), Cu (II) and Ni (II) by GT-AuNPs shows an excellent interaction property towards the detection of heavy metals and both give a better result and can be used as greener alternative to detect heavy metals. Removal of Cu(II) ions by GT-AgNPs prove to be an excellent adsorbent for the removal of heavy metals from waste water , the adsorption kinetic follows pseudo second-order kinetics, the adsorption mechanisms fit best in Henry law, . The adsorption of Cu(II) by GT-AgNPs suggests a spontaneous process and there is an increase in the disorder overall.
References
- Pillai, Z. S.; Kamat, P. V. What Factors Control the Size and Shape of Silver Nanoparticles in the Citrate Ion Reduction Method? J. Phys. Chem. B 2003, 108, 945–951. [Google Scholar] [CrossRef]
- Auffan, M.; Rose, J.; Bottero, J.-Y.; Lowry, G. V.; Jolivet, J.-P.; Wiesner, M. R. Towards a definition of inorganic nanoparticles from an environmental, health and safety perspective. Nat. Nanotechnol. 2009, 4, 634–641. [Google Scholar] [CrossRef] [PubMed]
- Walters, G.; Parkin, I. P.; Palgrave, R.; Parkin, I. P.; Han, S. W.; Goyes, C.; Jestin, Y.; Mattarelli, M. L.; Montagna, M.; Conti, G. N.; Pelli, S.; Righini, G. C.; Tosello, C.; Vishunubhatla, K. C. The incorporation of noble metal nanoparticles into host matrix thin films: synthesis, characterisation and applications. J. Mater. Chem. 2009, 19, 574–590. [Google Scholar] [CrossRef]
- Bottero, J.-Y.; Rose, J.; Wiesner, M. R. Nanotechnologies: Tools for sustainability in a new wave of water treatment processes. Integr. Environ. Assess. Manag. Integr. Environ. Assess. Manag. 2006, 2, 391–395. [Google Scholar] [CrossRef] [PubMed]
- Emerich, D. F.; Thanos, C. G. The pinpoint promise of nanoparticle-based drug delivery and molecular diagnosis. Biomol. Eng. 2006, 23, 171–184. [Google Scholar] [CrossRef] [PubMed]
- Gupta, A.K.; Gupta, M. Synthesis and surface engineering of iron oxide nanoparticles for biomedical applications. Biomaterials. 2005, 26, 3995–4021. [Google Scholar] [CrossRef] [PubMed]
- Eustis, S.; El-Sayed, M. A. Why gold nanoparticles are more precious than gold: Noble metal surface plasmon resonance and its 1000 uses in art. Chem. Soc. Rev. 2006, 35, 209–217. [Google Scholar] [CrossRef] [PubMed]
- www.nanowerk.com (accessed July 2022). accessed.
- Daniel, M.S. Nanotecnología: Una Nueva Revolución en la Ciencia de Materiales. Proyecto Fin de Carrera, Proyecto fin de Carrera Universidad de Cantabria; 2012. [Google Scholar]
- Mie, G. Beiträge zur Optik trüber Medien, speziell kolloidaler Metallösungen (Contributions to the optics of turbid media, particularly colloidal metal solutions). Ann. Der Phys. Ann. Phys 1908, 330, 377–445. [Google Scholar] [CrossRef]
- Ajitha, B.; Reddy, Y. Ashok Kumar; Shameer, S.; Rajesh, K. M.; Suneetha, Y.; Reddy, P. Sreedhara. green" method for synthesizing silver nanoparticles (AgNPs) using the leaf extract of the Lantana camara plant. J. Photochem. Photobiol.B 2015, 84–92. [Google Scholar] [CrossRef] [PubMed]
- Selvan, D. A.; Mahendiran, D.; Kumar, R. S.; A. K. Rahiman, J. Photochem. Photobiol. B 2018, 180, 243–252. [Google Scholar]
- Xing, L.; Zhang, H.; Qi, R.; Tsao, R.; Mine, Y.; Agric, J. Food Chem. 2020, 67, 1029–1043.
- Al Rashid, H.; Kundu, A.; Mandal, V.; Wangchuk, P.; Mandal, S. C. Herbal Medicine in India; 2020. [Google Scholar] [CrossRef]
- Link, S.; Ei-Sayed, M.A. Annu. Rev. Phys. Chem. 2003, 54, 331–366. [Google Scholar]
- Noginov, M.A.; Zhu, G.; Bahoura, M.; Adegoke, J.; Small, C.; Ritzo, B.A.; Draciiev, V.P.; Siialaev, V.M. Appl. Phys. B 2007, 86, 455–460.
- Nath, S.S.; Gope, D.G. Nano Trends 2007, 2, 20–28.
- Taleb, A.; Petit, C.; Pileni, M.P. J. Phys. Chem. B. 1998, 102, 2214–2220.
- Sastry, M.; Patil, V.; Sainkar, S.R. J. Phys. Chem. B. 1998, 102, 1404–1410.
- Henglein, A. J. Phys. Chem. 1993, 97, 5457–5471. [CrossRef]
- Sastry, M.; Mayya, K.S.; Bandyopadhyay, K. Colloids Surf A Physicochem. Eng. Asp. 1997, 127, 221–228.
- Sultana, N.; Raul, P.K.; Goswami, D.; Das, D.; Islam, S.; Tyagi, V.; Das, B.; Gogoi, H. K.; Chattopadhyay, P.; Raju, P.S. RSC Adv. 2020, 10, 9356−9368.
- Alomar, T.S.; AlMasoud, N.; Awad, M.A.; El-Tohamy, M.F.; Soliman, D.A. Mater. Chem. Phys. 2020, 249, 123007.
- Varghese, A.K.; Tamil, P.; Rugmini, R.; Shiva, P.M.; Kamaksh, K.; Sekhar, K.C. ACS Omega 2020, 5, 13123−13129. [CrossRef]
- Masoud, N. A.; Alomar, T.S.; Awad, M.A.; El-Tohamy, M.F.; Soliman, D.A. Green Chem. Lett. Rev. 2020, 13, 316−327.
- Rani, P.; Kumar, V.; Singh, P.P.; Matharu, A.S.; Zhang, W.; Kim, K.H.; Singh, J.; Rawat, M. Environ. Int. 2020, 143, 105924. [PubMed]
- Parit, S.B.; Karade, V.C.; Patil, R.B.; Pawar, N.V.; Dhavale, R.P.; Tawre, M.; Pardesi, K.; Jadhav, U.U.; Dawkar, V.V.; Tanpure, R.S.; Kim, J.H.; Jadhav, J.P.; Chougale, A.D. Mater. Today Chem. 2020, 17, 100285.
- Zhang, G.; Keita, B.; Dolbecq, A.; Mialane, P.; Secheresse, F.; Miserque, F.; Nadjo, L. Covalent modification of multiwalled carbon nanotubes by a Lindqvist-type polyoxometalate. Chem. Mater. 2007, 5821–5823. [Google Scholar]
- Shankar, S.S.; Rai, A.; Ankamwar, B.; Singh, A.; Ahmad, A. Ahmad andM.; Sastry. Biological synthesis of triangular gold nanoprisms. Nat. Mater. 2004, 3, 482–488. [Google Scholar] [CrossRef] [PubMed]
- Dyal, C.; Nguyen, N.; Hadden, J.; Gou, L.F.; Li, T.; Murphy, C.J.; Nivens, D.A.; Lynch, W.E. Synthesis and characterization of silver and gold nanoparticles for use in surface-enhanced Raman spectroscopy (SERS). Abstr. Pap. Am. Chem. S 2006, 231. [Google Scholar]
- Huang, J.L.; Li, Q.B.; Sun, D.H.; Lu, Y.H.; Su, Y.B.; Yang, X.; Wang, H.X.; Wang, Y.P.; Shao, W.Y.; He, N.; Hong, J.Q.; Chen, C.X. Biosynthesis of silver and gold nanoparticles by novel sundried Cinnamomum camphora leaf. Nanotechnology 2007, 18. [Google Scholar] [CrossRef] [PubMed]
- Mohanpuria, P.; Rana, N.K.; Yadav, S.K. Biosynthesis of nanoparticles: technological aspects and mechanisms. J. Nanopart Res. 2008, 507–517. [Google Scholar]
- Raveendran, P.; Fu, J.; Wallen, S.L. Completely "green" synthesis and stabilization of silver nanoparticles. J. Am. Chem. Soc. 2003, 125, 13940–13941. [Google Scholar] [CrossRef] [PubMed]
- Vigneshwaran, N.; Nachane, R.P.; Balasubramanya, R.H.; Varadarajan, P.V. A novel one-pot "green" synthesis of stable silver nanoparticles using soluble starch. Carbohyd Res. 2006, 341, 2012–2018. [Google Scholar] [CrossRef]
- Lopez, C.D.; Gomez-Estaca, J.; Catala, R. Food Chem. 2012, 131((4)), 1376–1384.
- Hojat, V.; Maliheh, F.; Mona, H.; Saba, H. Green synthesis of Au nanoparticles using an aqueous extract of Stachys lavandulifolia and their catalytic performance for alkyne–aldehyde–amine coupling reactions. RSC Adv. 2018, 67. [Google Scholar]
- Ascencio, J.A.; Pérez, M.; José-Yacamán, aad M. A truncated icosahedral structure for small colloidal gold particles. Surf. Sci. 2000, 447, 73–80. [Google Scholar] [CrossRef]
- Chen, R.; Wu, J.; Li, H.; Cheng, G.; Lu, Z.; Che, C.M. Rare earth ion-doped zinc oxide nanophosphors: Synthesis, characterization and luminescence properties. Rare Met. 2010, 29, 180–186. [Google Scholar]
- Cornejo-Monroy, D.; Acosta-Torres, L.S.; Moreno-Vega, A.; Saldana, C.; Morales-Tlalpan, V.; Castaño, V.M. Gold nanostructures in medicine: past, present and future. J. Nanosci. Lett. 2013, 3, 25. [Google Scholar]
- Foss, C.A., Jr.; Hornyak, G.L.; Stockert, J.A.; Martin, C.R. Template-synthesized nanoscopic gold particles: optical spectra and the effects of the particle size and shape. J. Phys. Chem. 1994, 98, 2963–2971. [Google Scholar] [CrossRef]
Figure 6.
a) Uv/visible spectroscopy of green tea extracts and silver nitrate b)Uv/visible spectroscope of jasmine green tea silver nanoparticles and its absorbance stability measurements with time (10-100 min) at 10 minutes interval.
Figure 6.
a) Uv/visible spectroscopy of green tea extracts and silver nitrate b)Uv/visible spectroscope of jasmine green tea silver nanoparticles and its absorbance stability measurements with time (10-100 min) at 10 minutes interval.
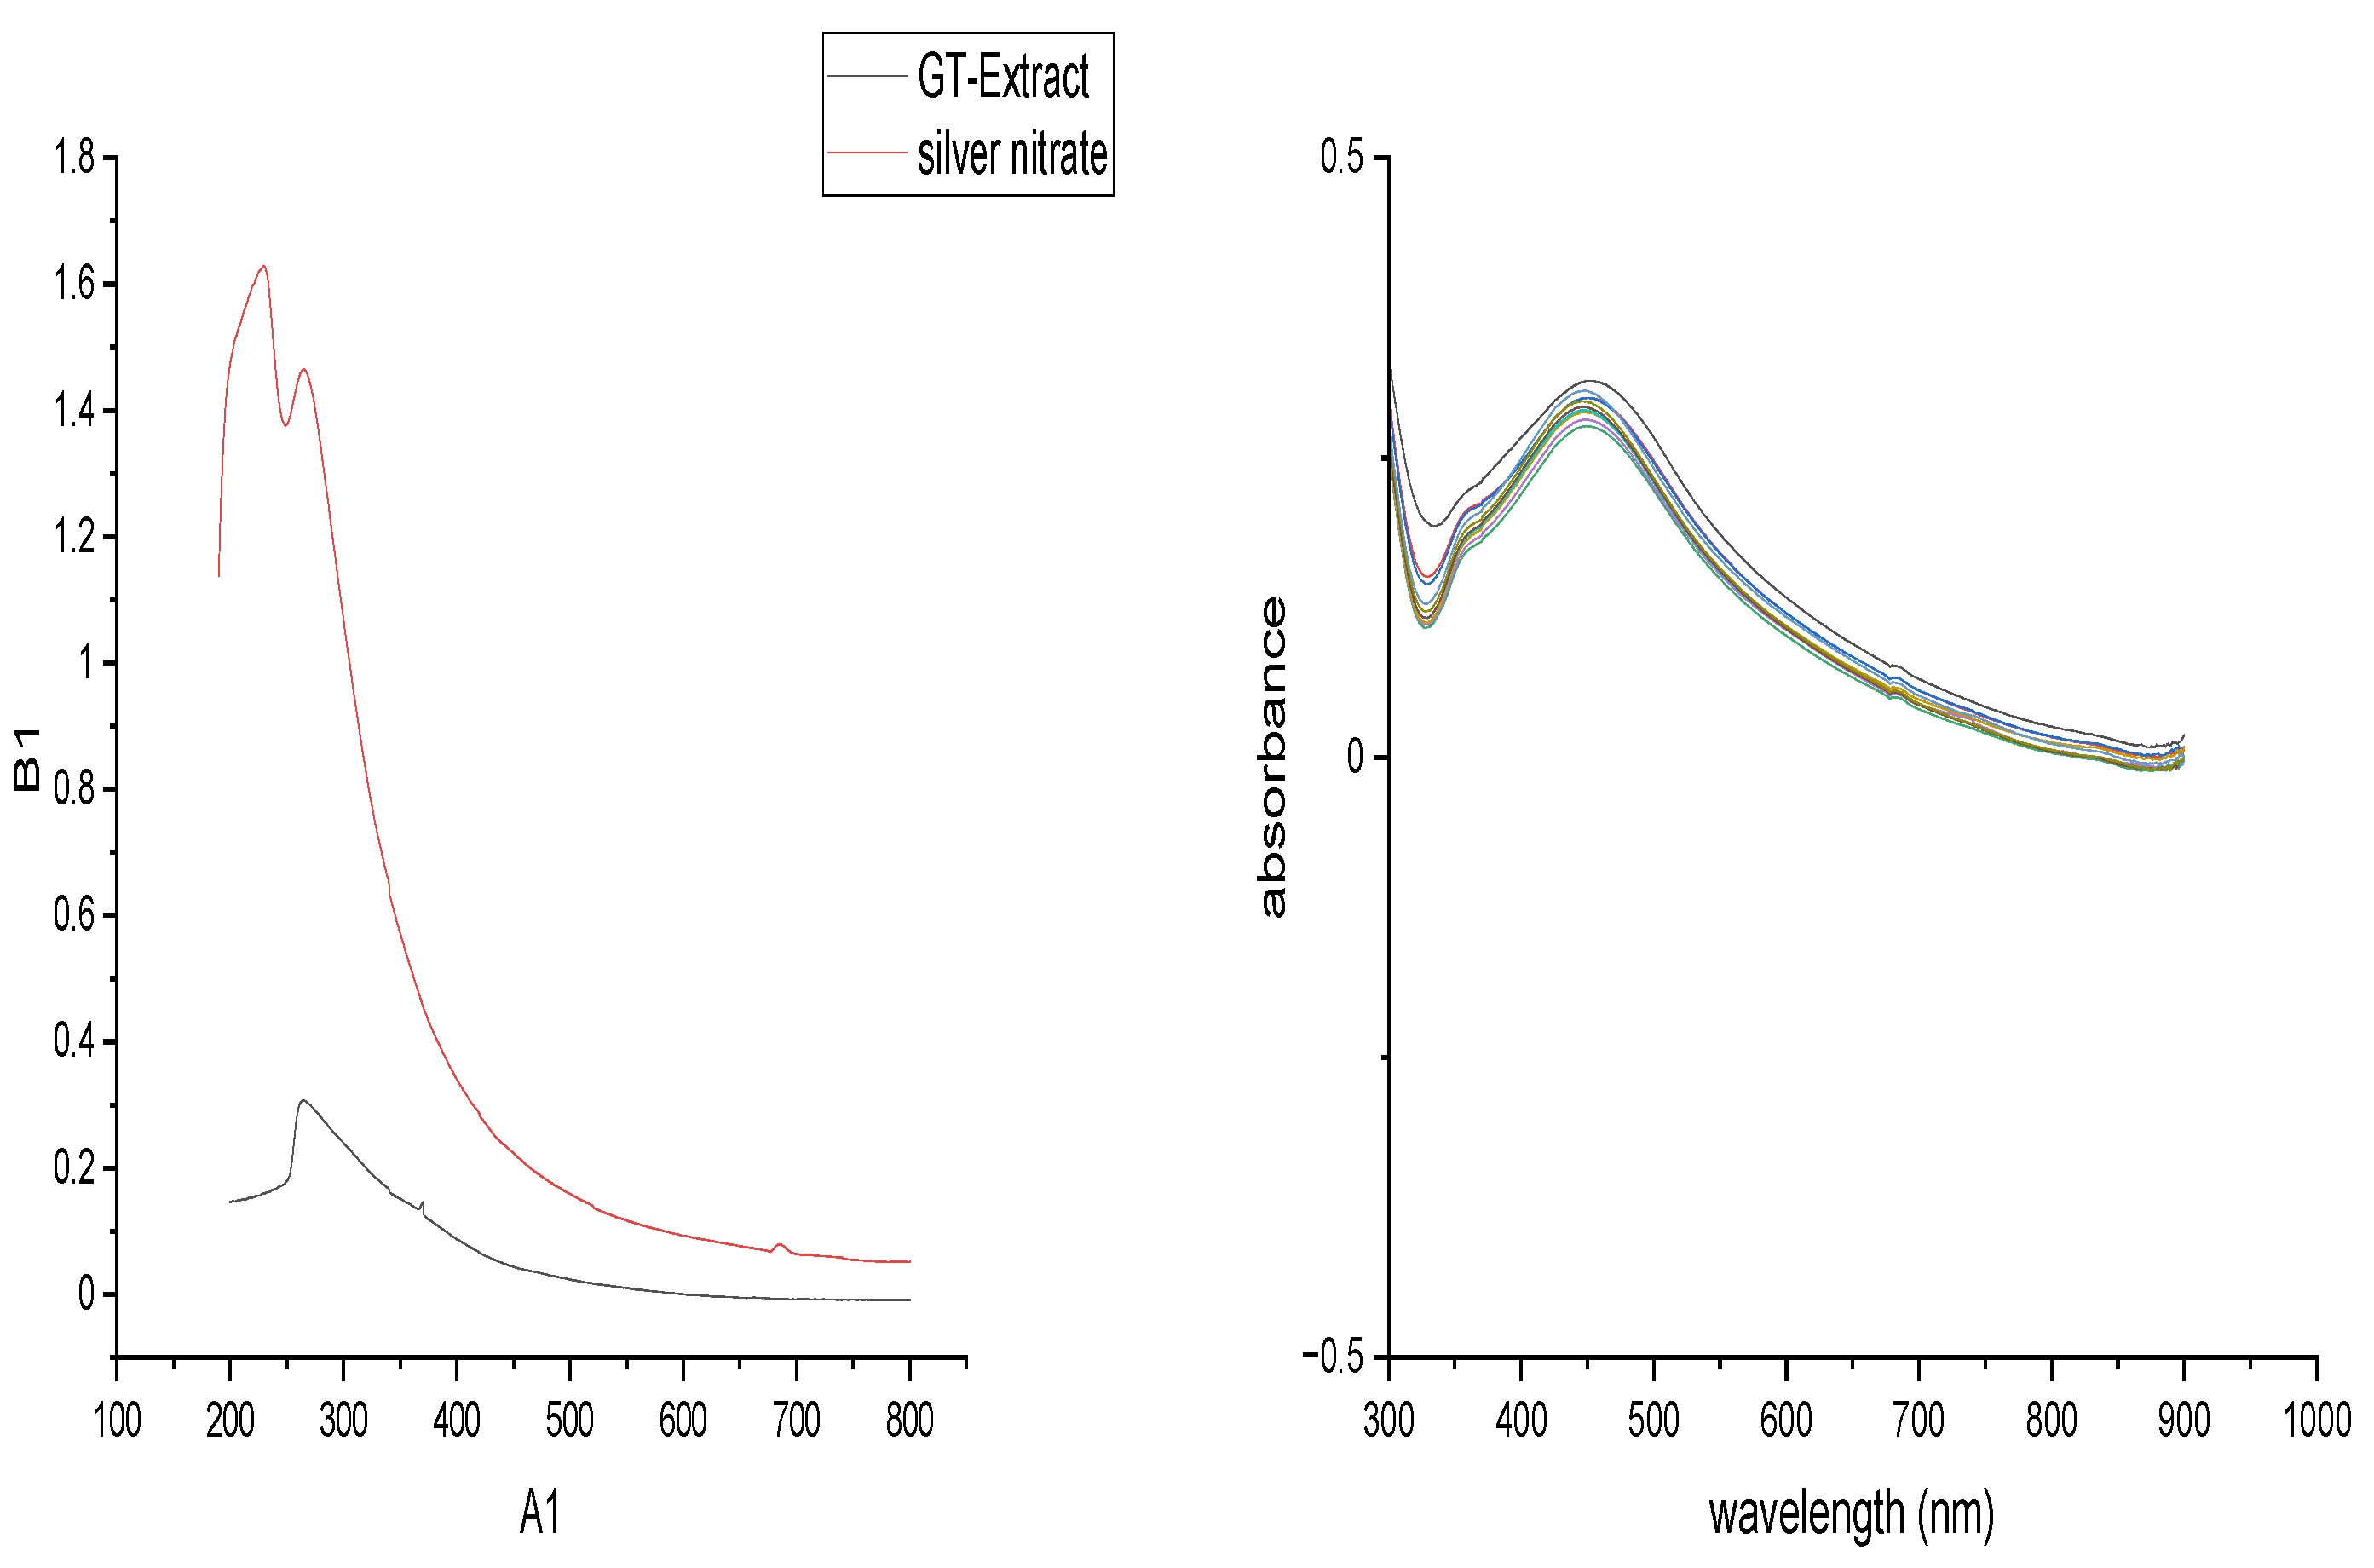
Figure 7.
a)Uv/visible spectroscopy of Green tea extracts and gold chloride b) Uv/visible spectroscopy of jasmine green tea gold nanoparticles (10-100 minutes) at 10 minutes interval.
Figure 7.
a)Uv/visible spectroscopy of Green tea extracts and gold chloride b) Uv/visible spectroscopy of jasmine green tea gold nanoparticles (10-100 minutes) at 10 minutes interval.
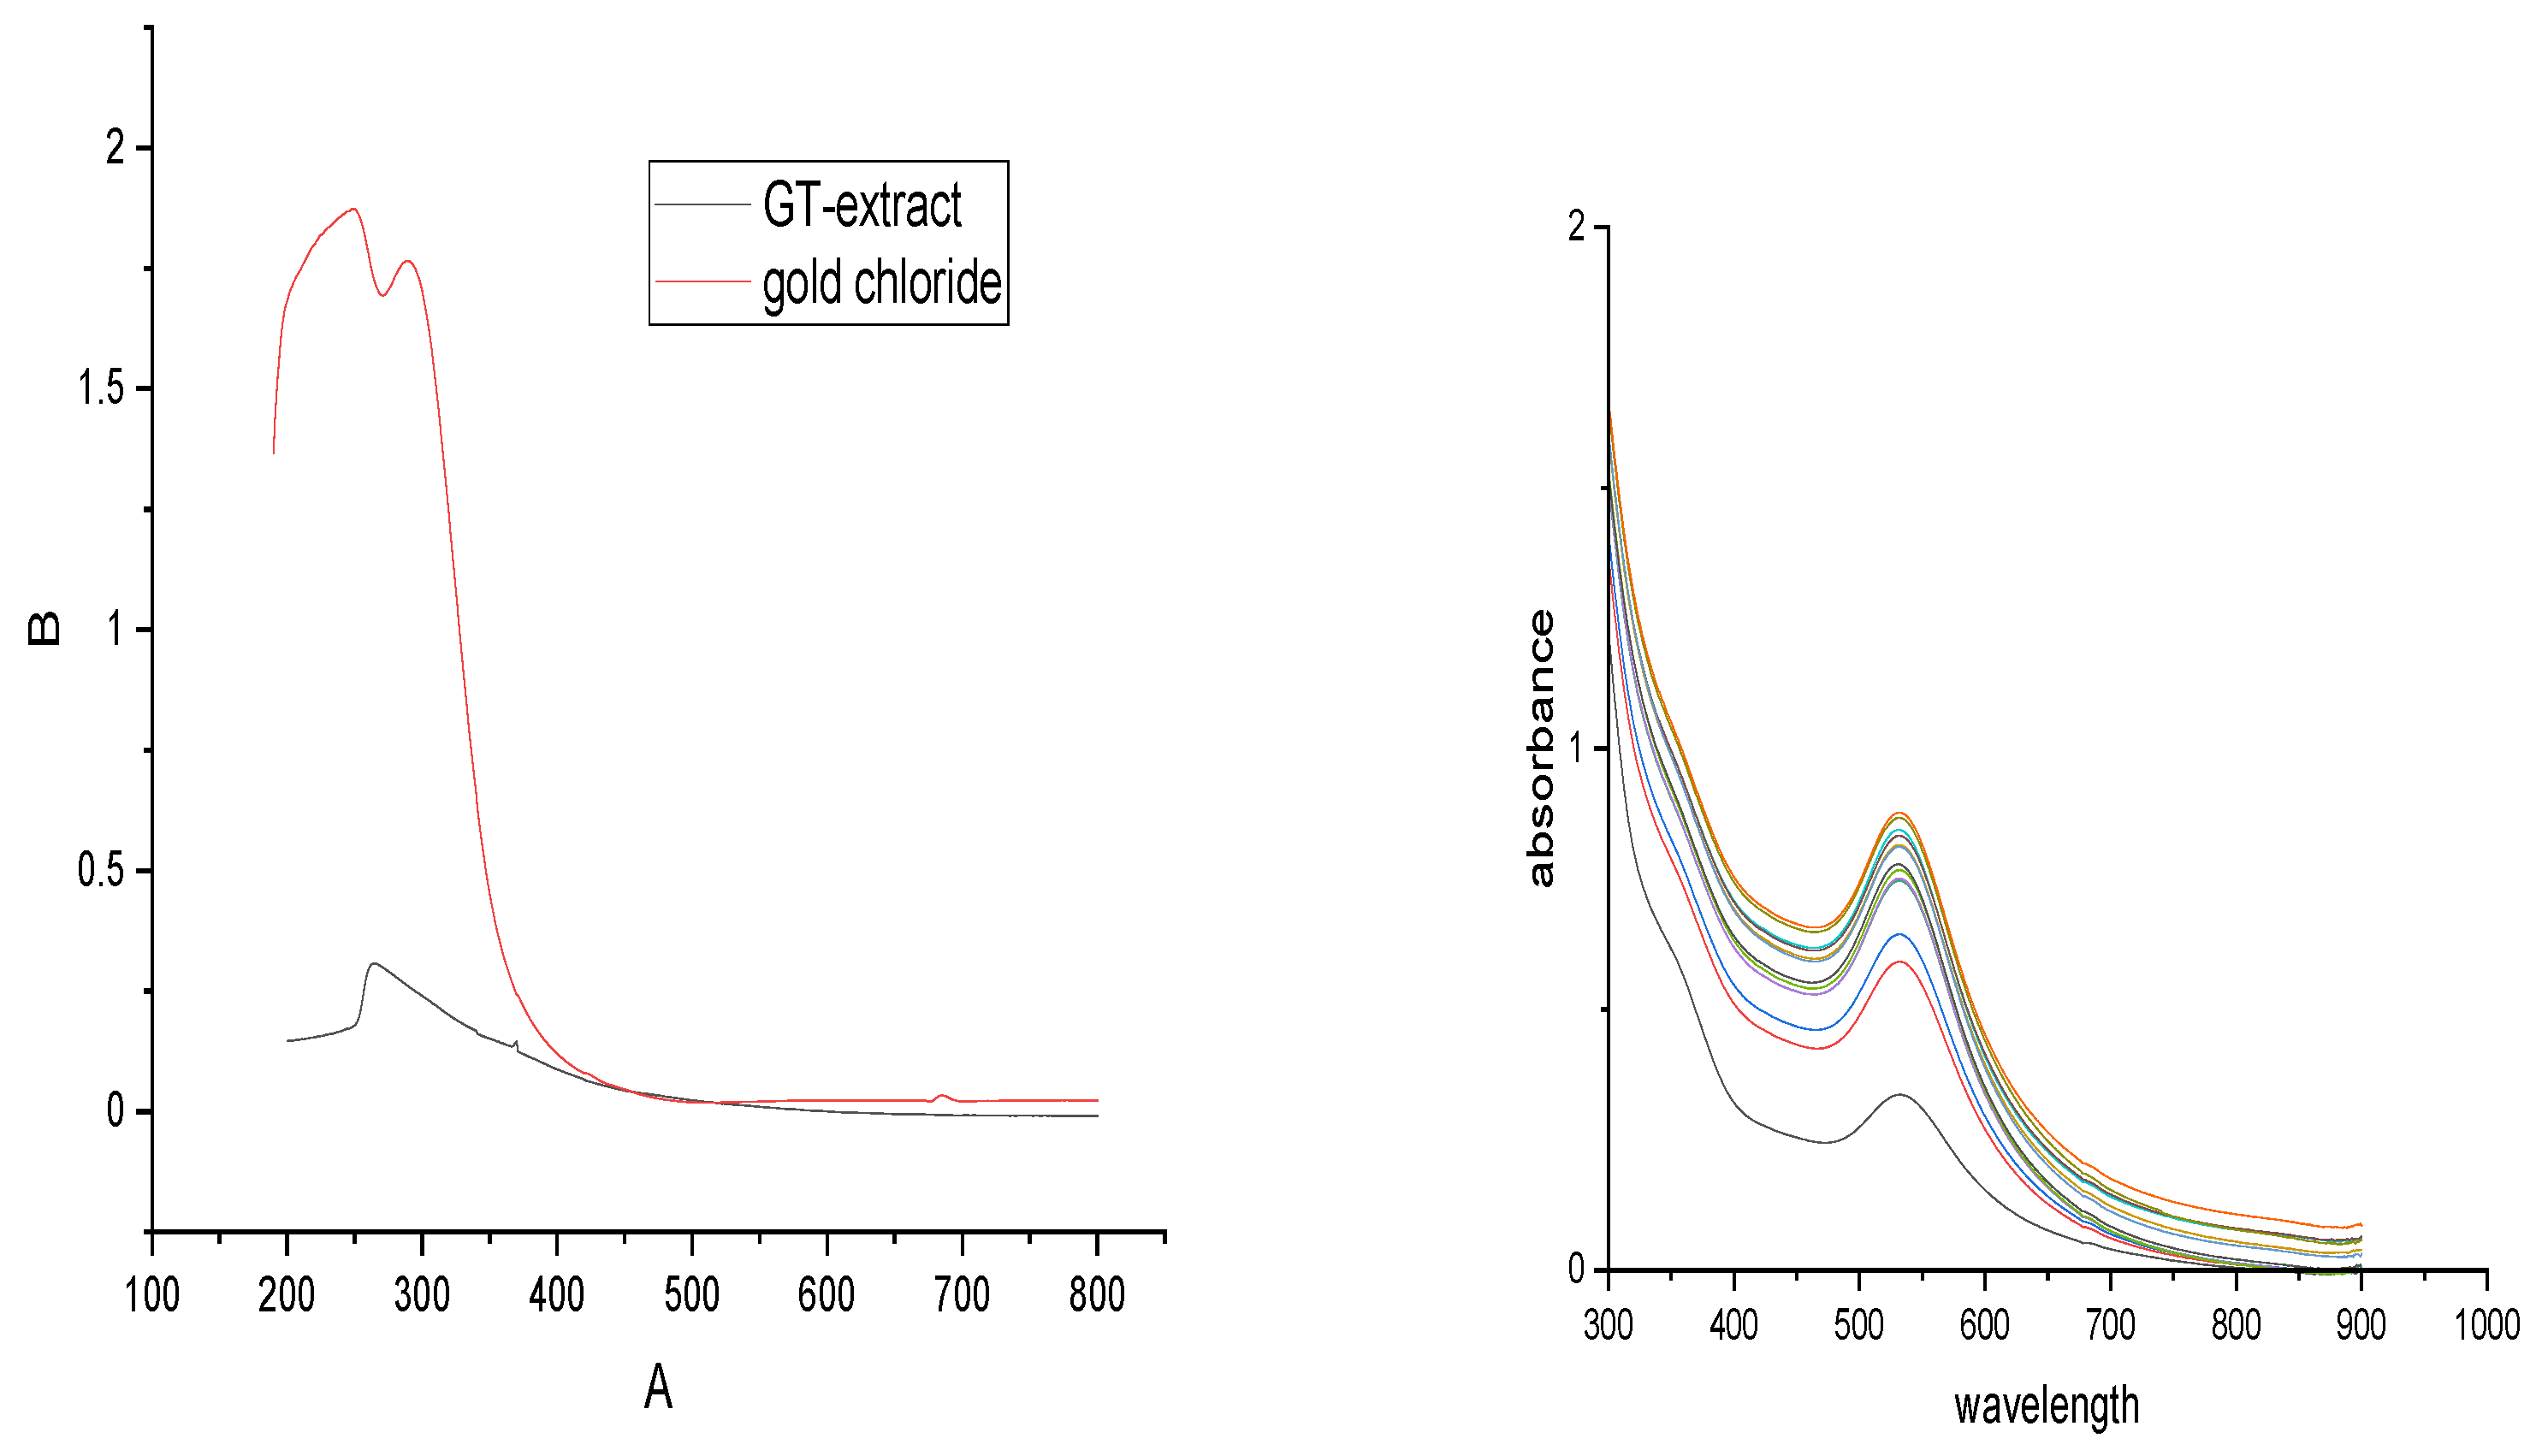
Figure 8.
a)Thermal analysis of GT-AgNPs b)thermal analysis of GT-AuNPs.
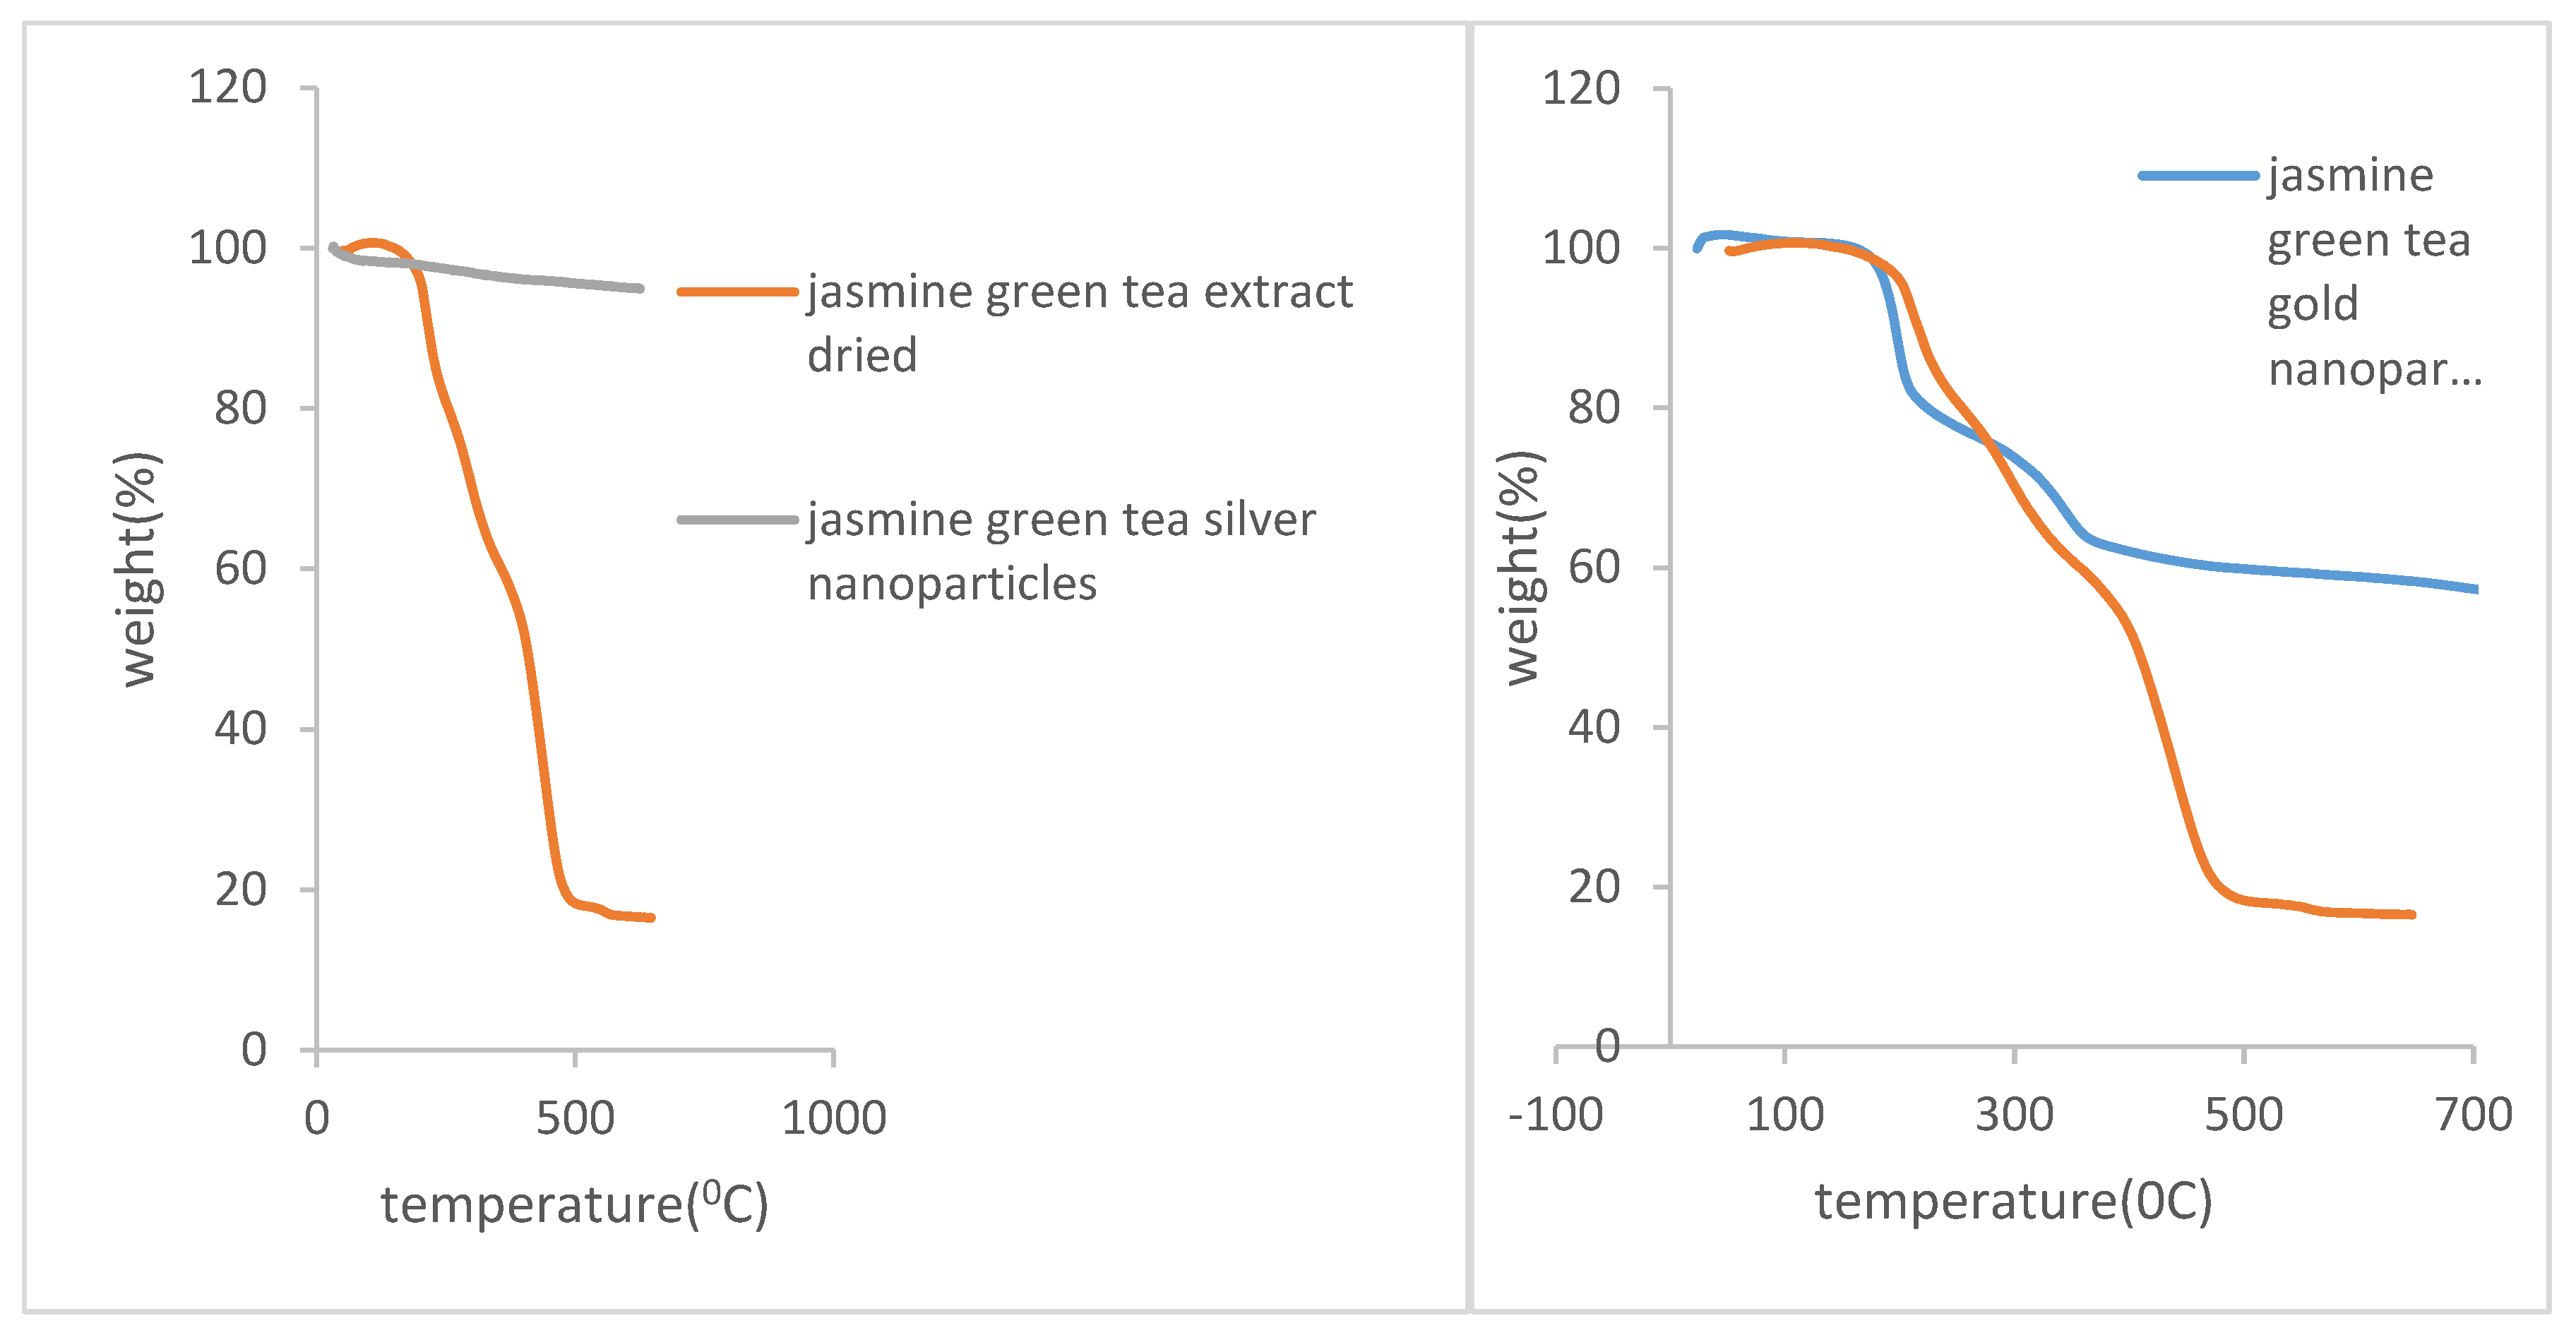
Figure 9.
a) PXRD of dried jasmine green tea (grey line) andGT-AgNPs (orange line) b)GT(red line) and GT-AuNPs~(black line).
Figure 9.
a) PXRD of dried jasmine green tea (grey line) andGT-AgNPs (orange line) b)GT(red line) and GT-AuNPs~(black line).
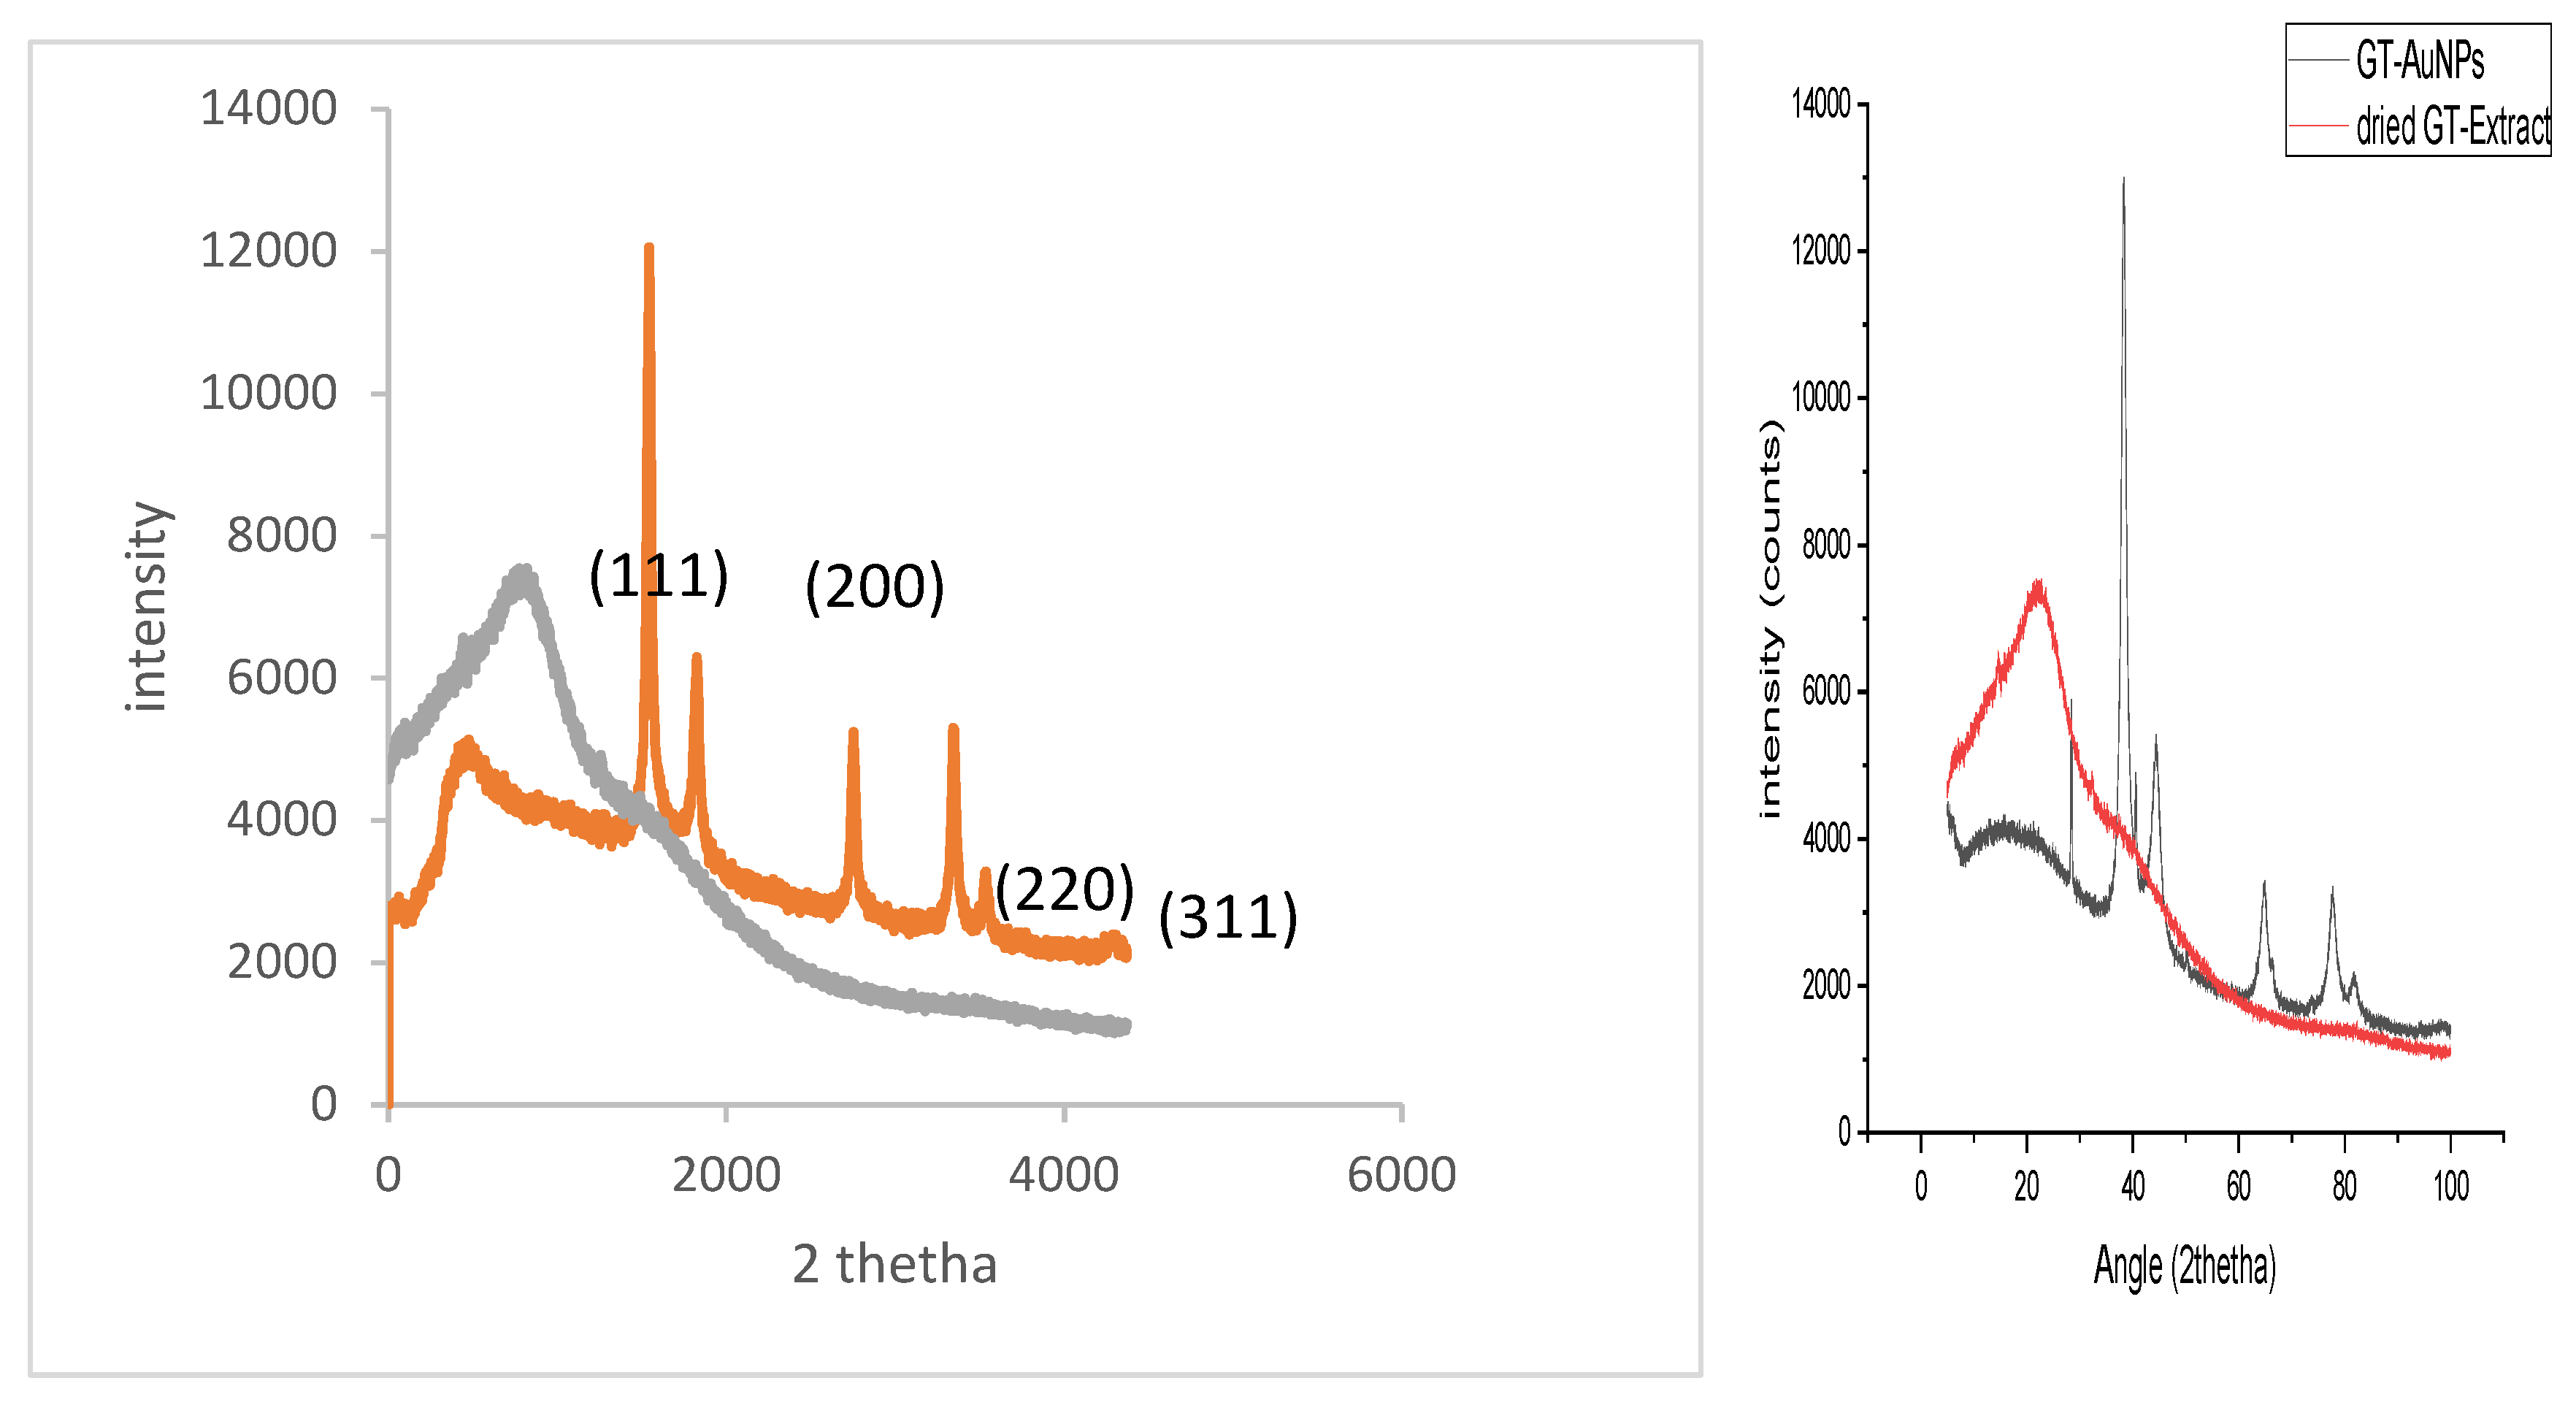
Figure 9.
SEM image of GT-AgNPs.
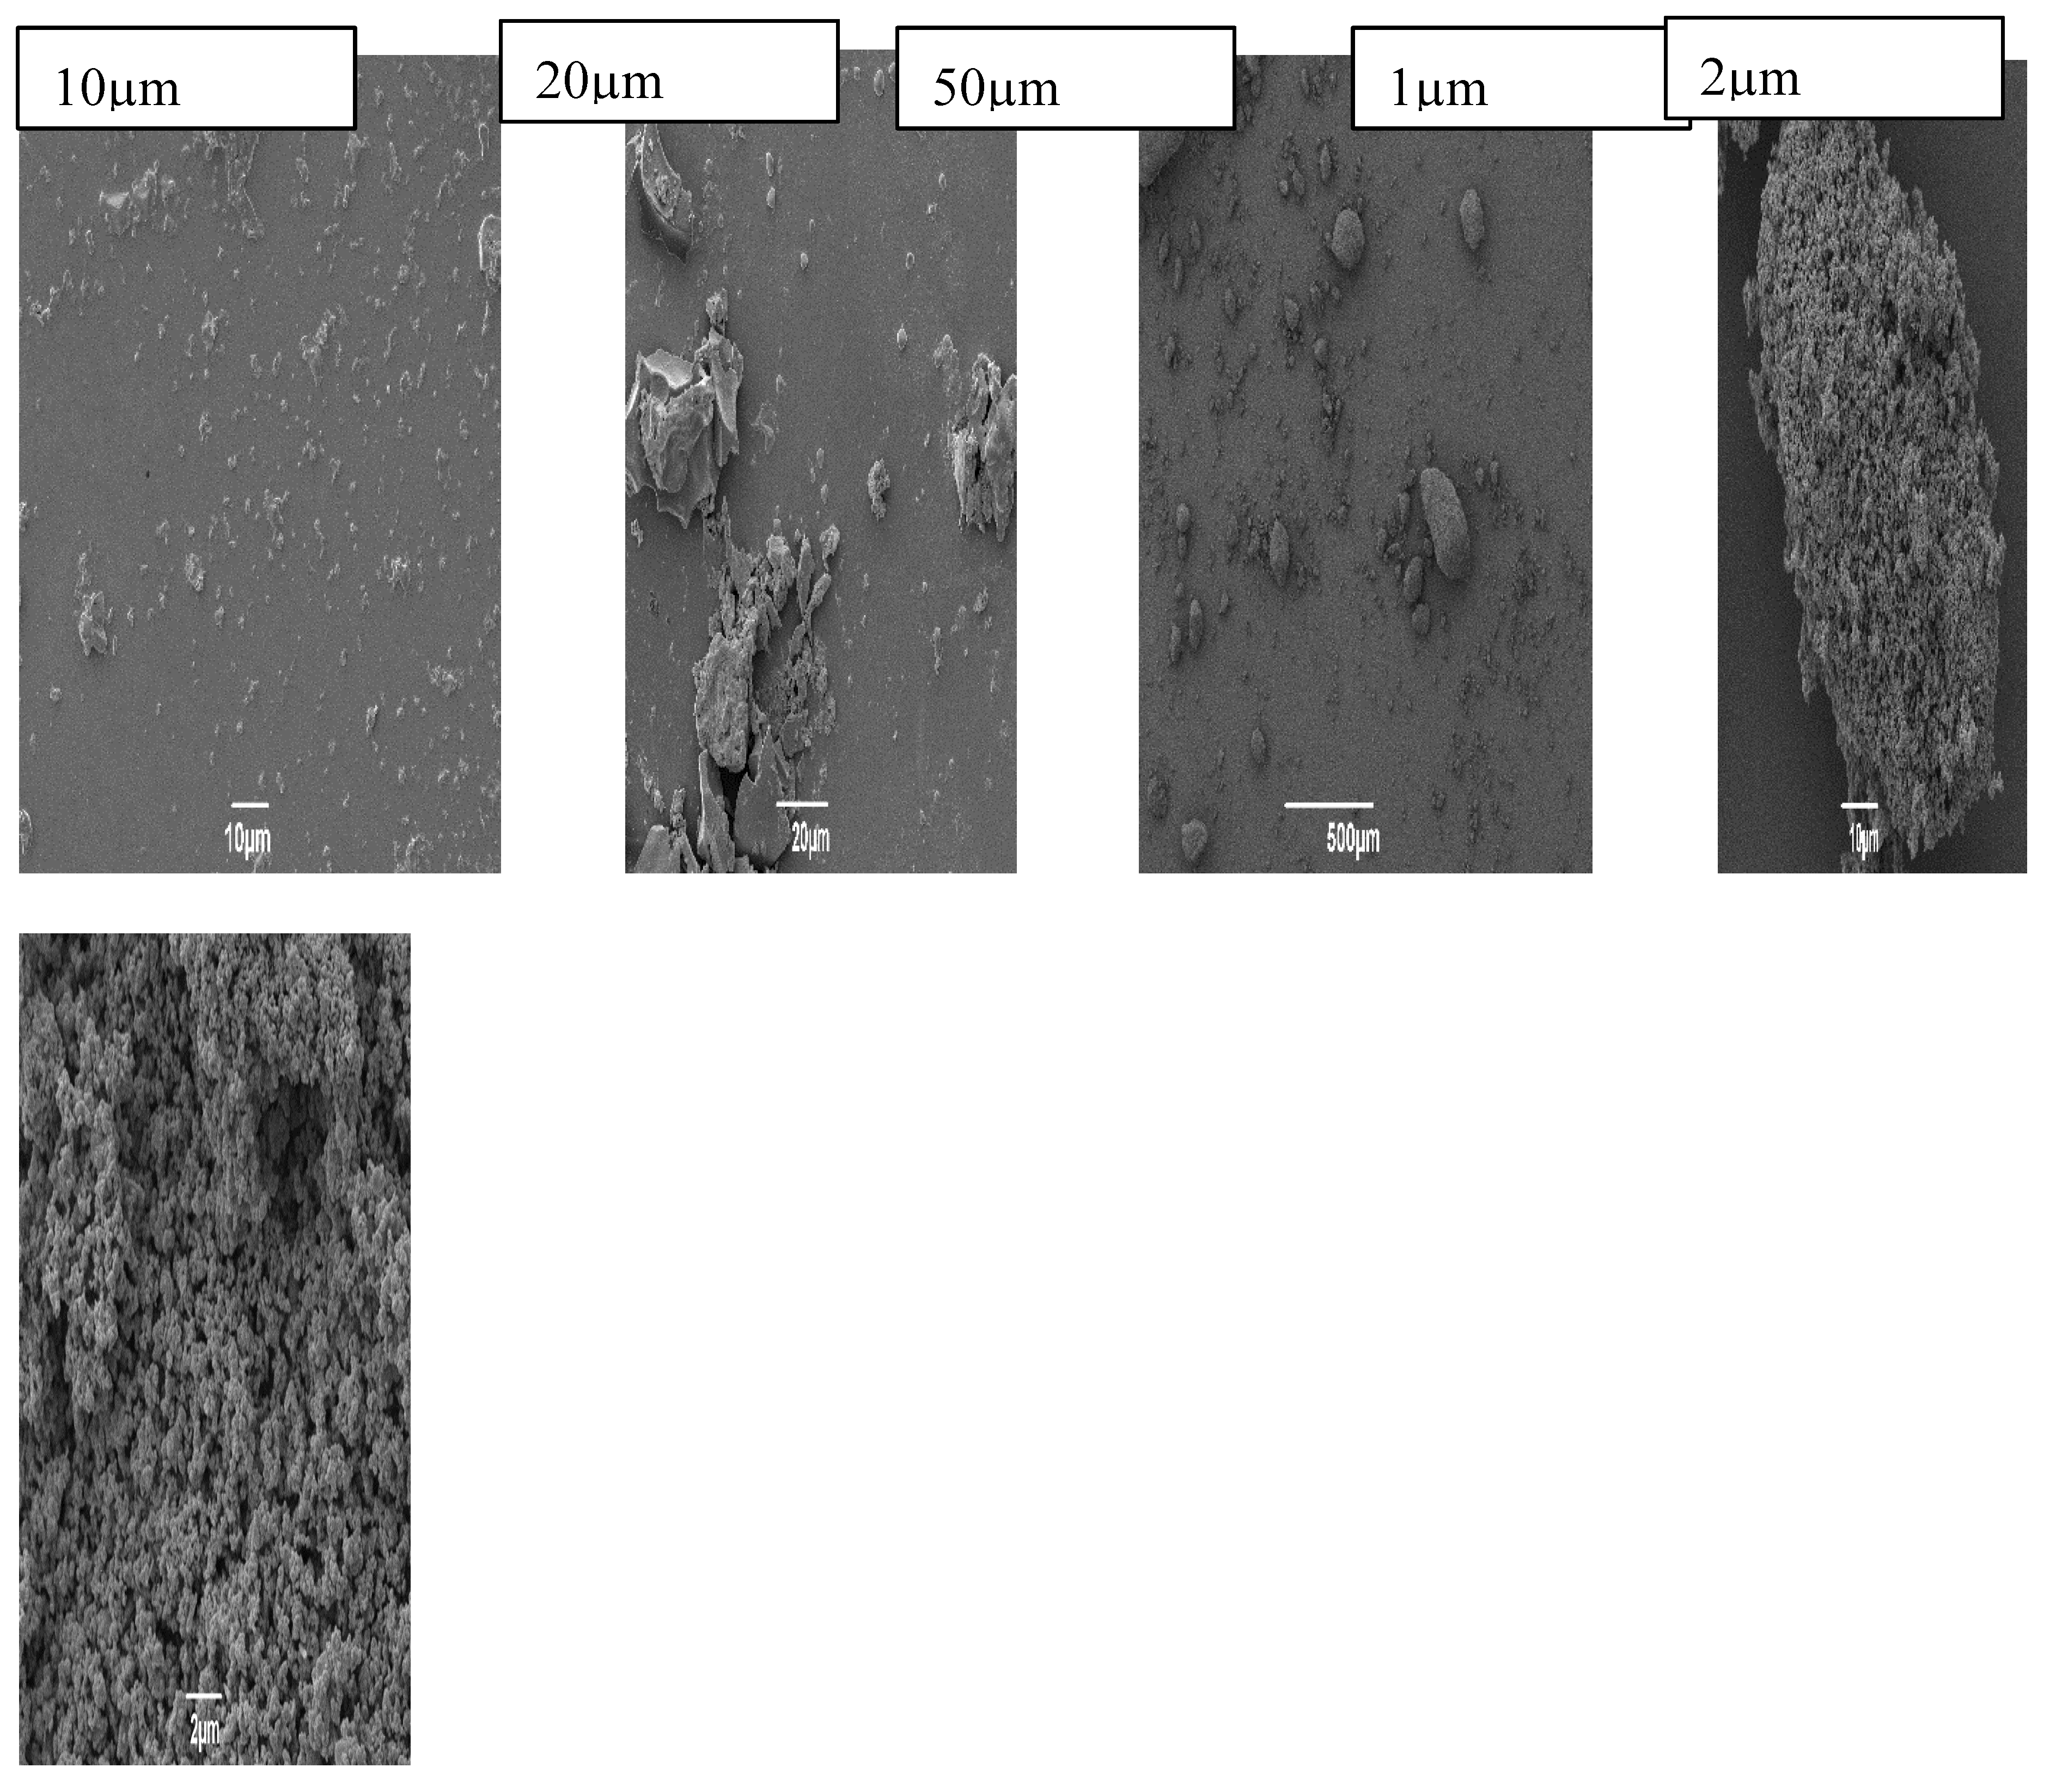
Figure 10.
SEM image of GT-AuNPS.
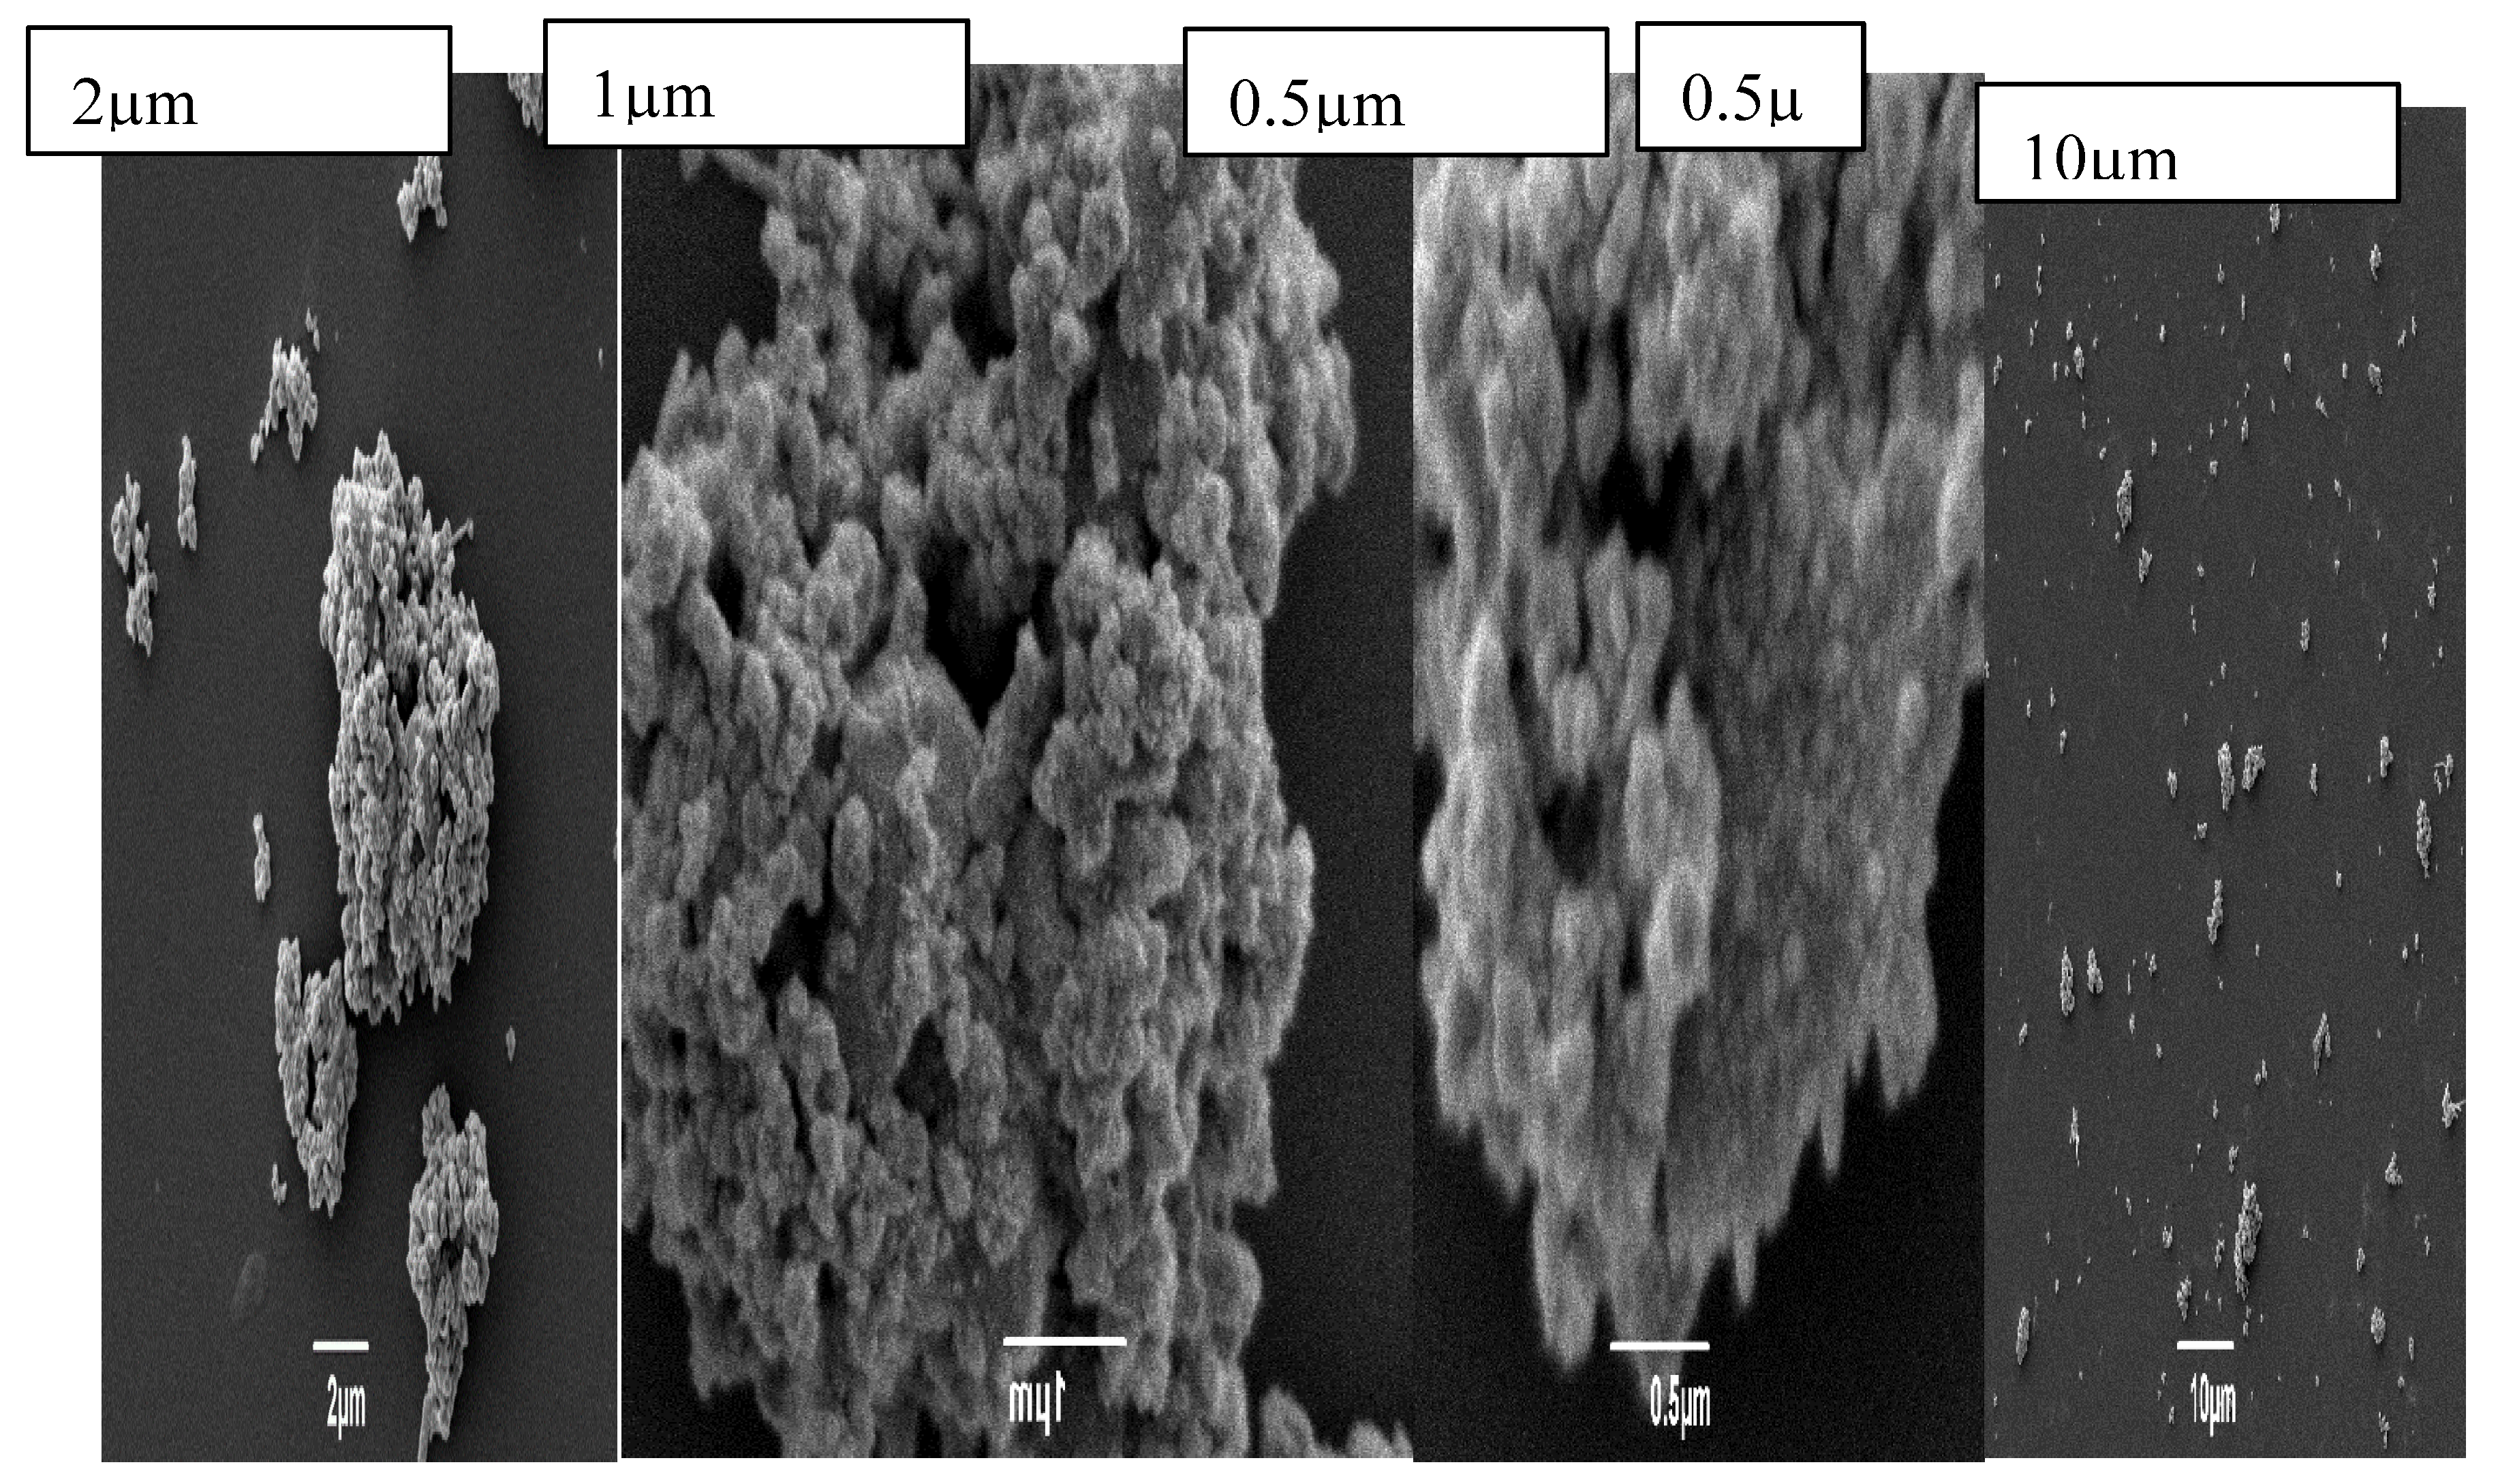
Figure 13.
Uv-visible spectroscopy of GT-AuNPs and nickel(2-20ppm).
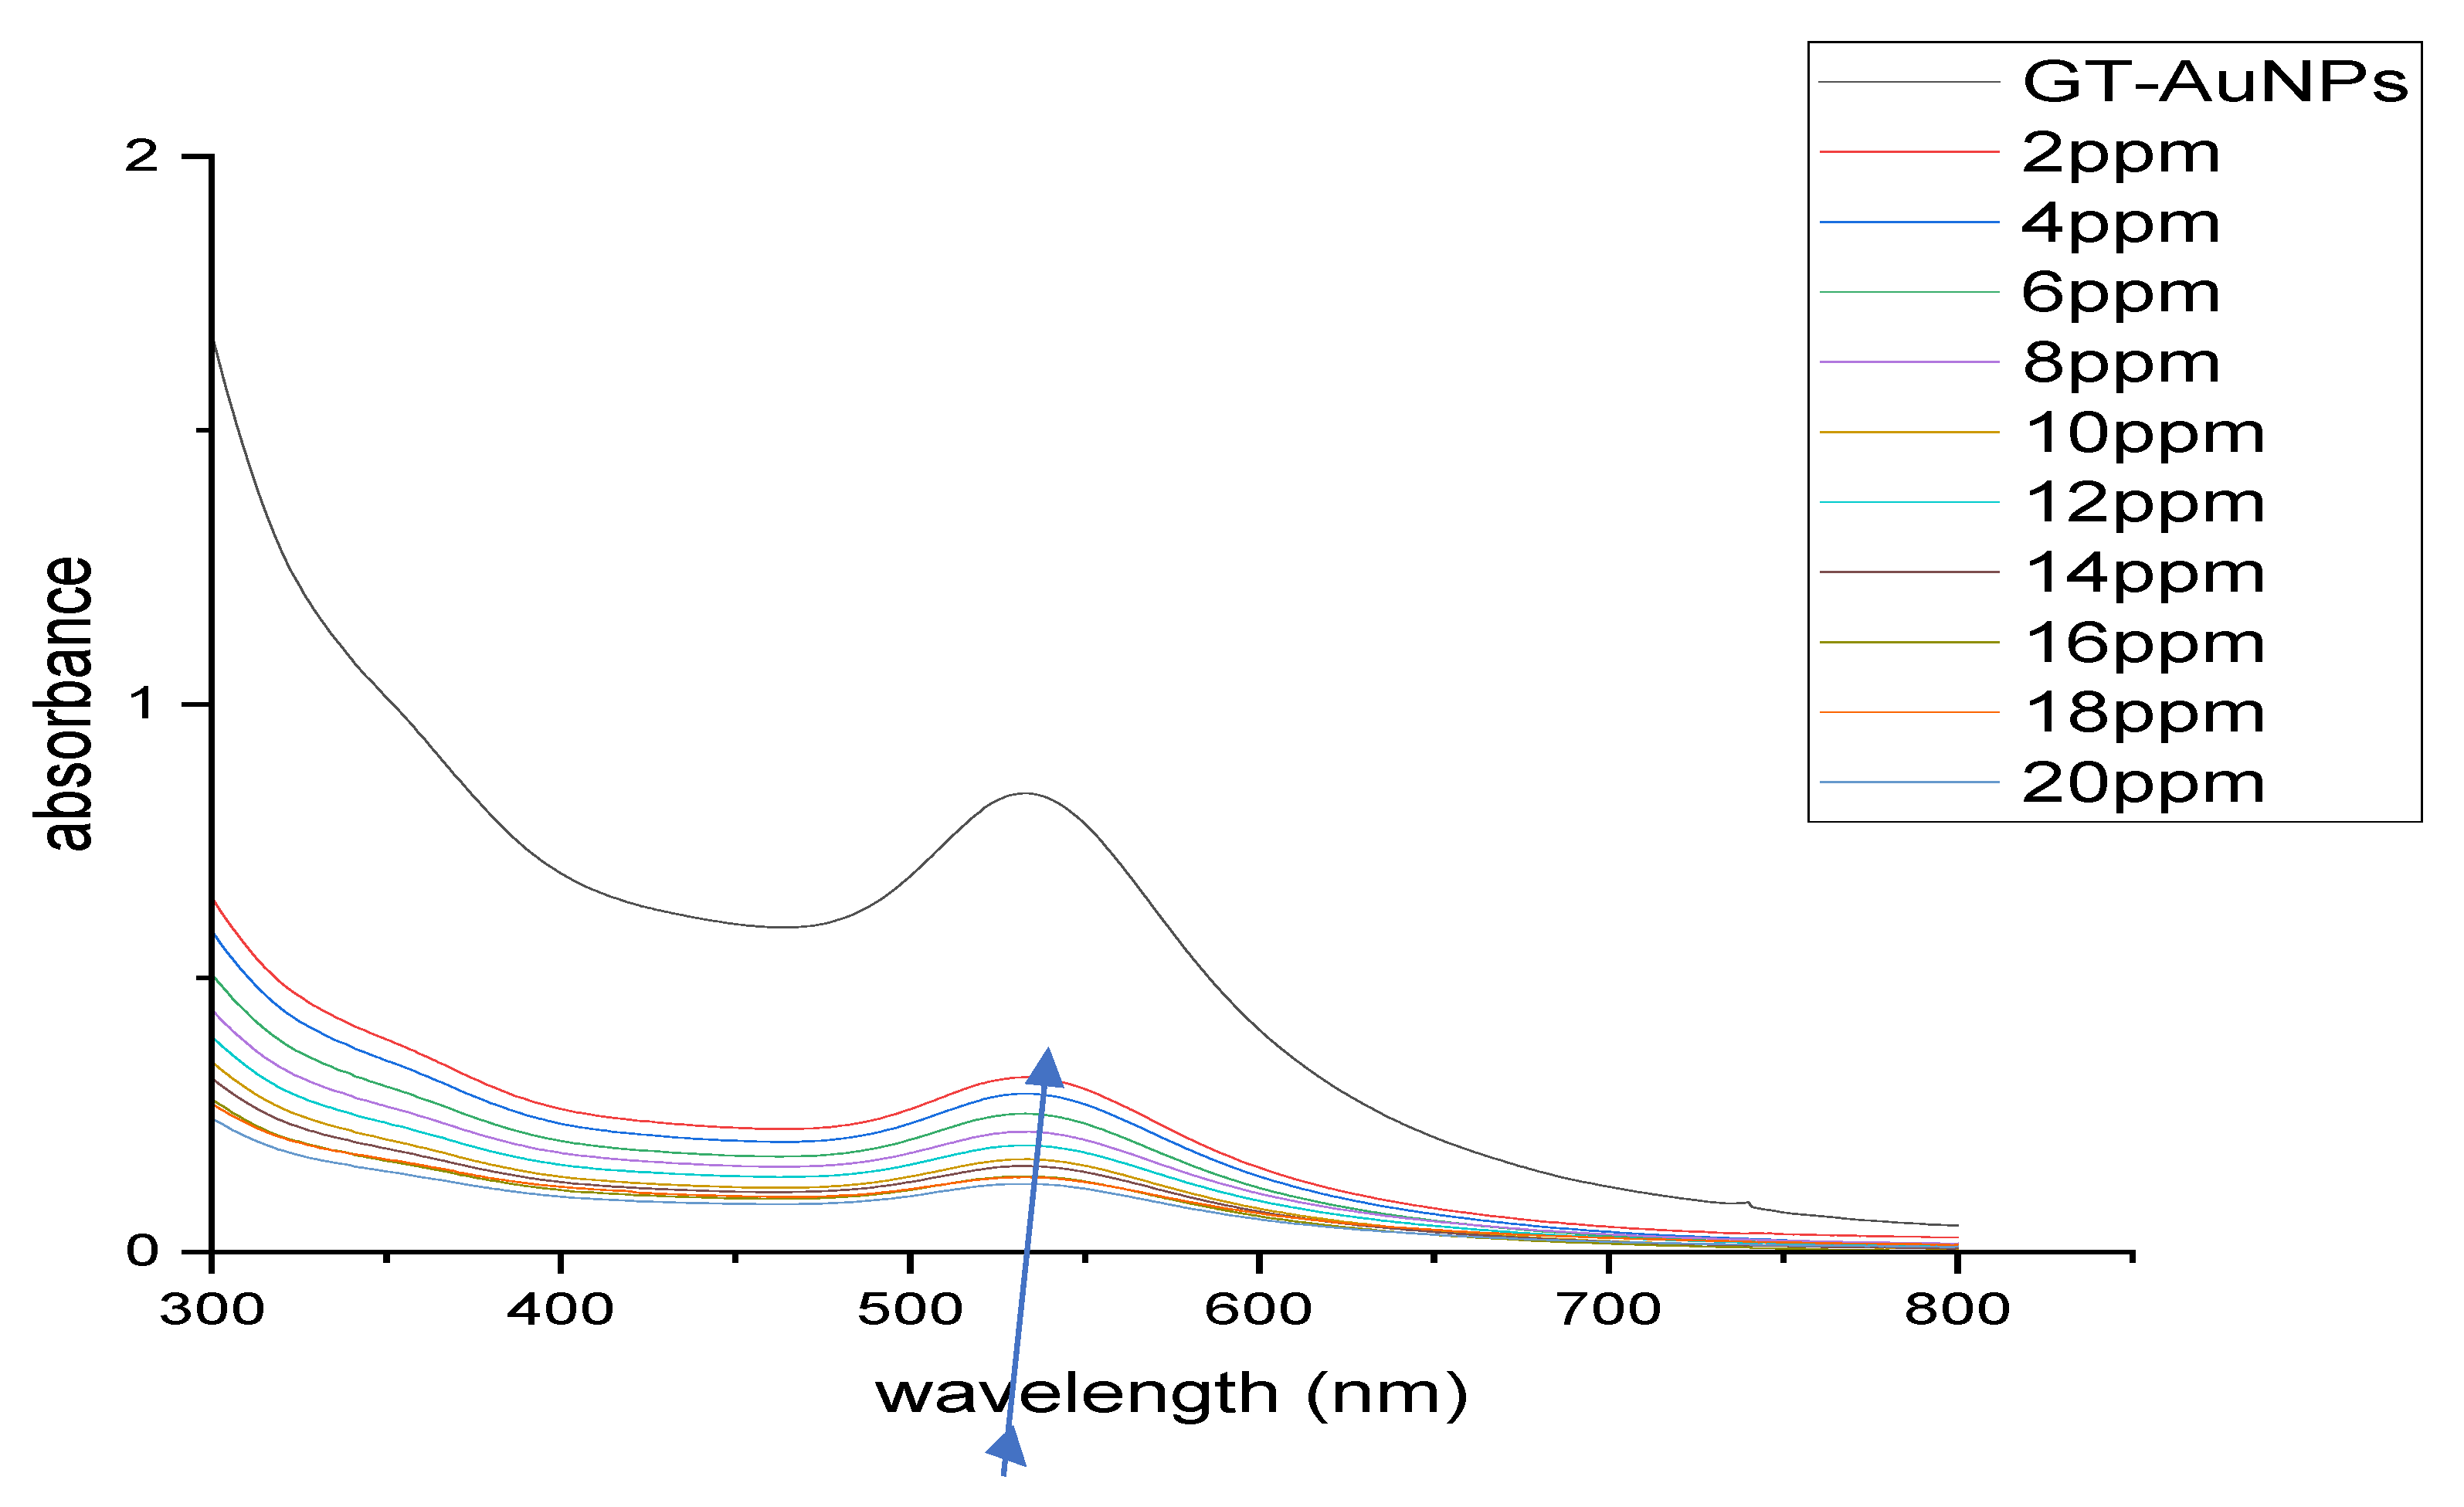
Figure 14.
Uv-visible spectroscopy of detection of nickel (2-20 ppm) by GT-AgNPs.
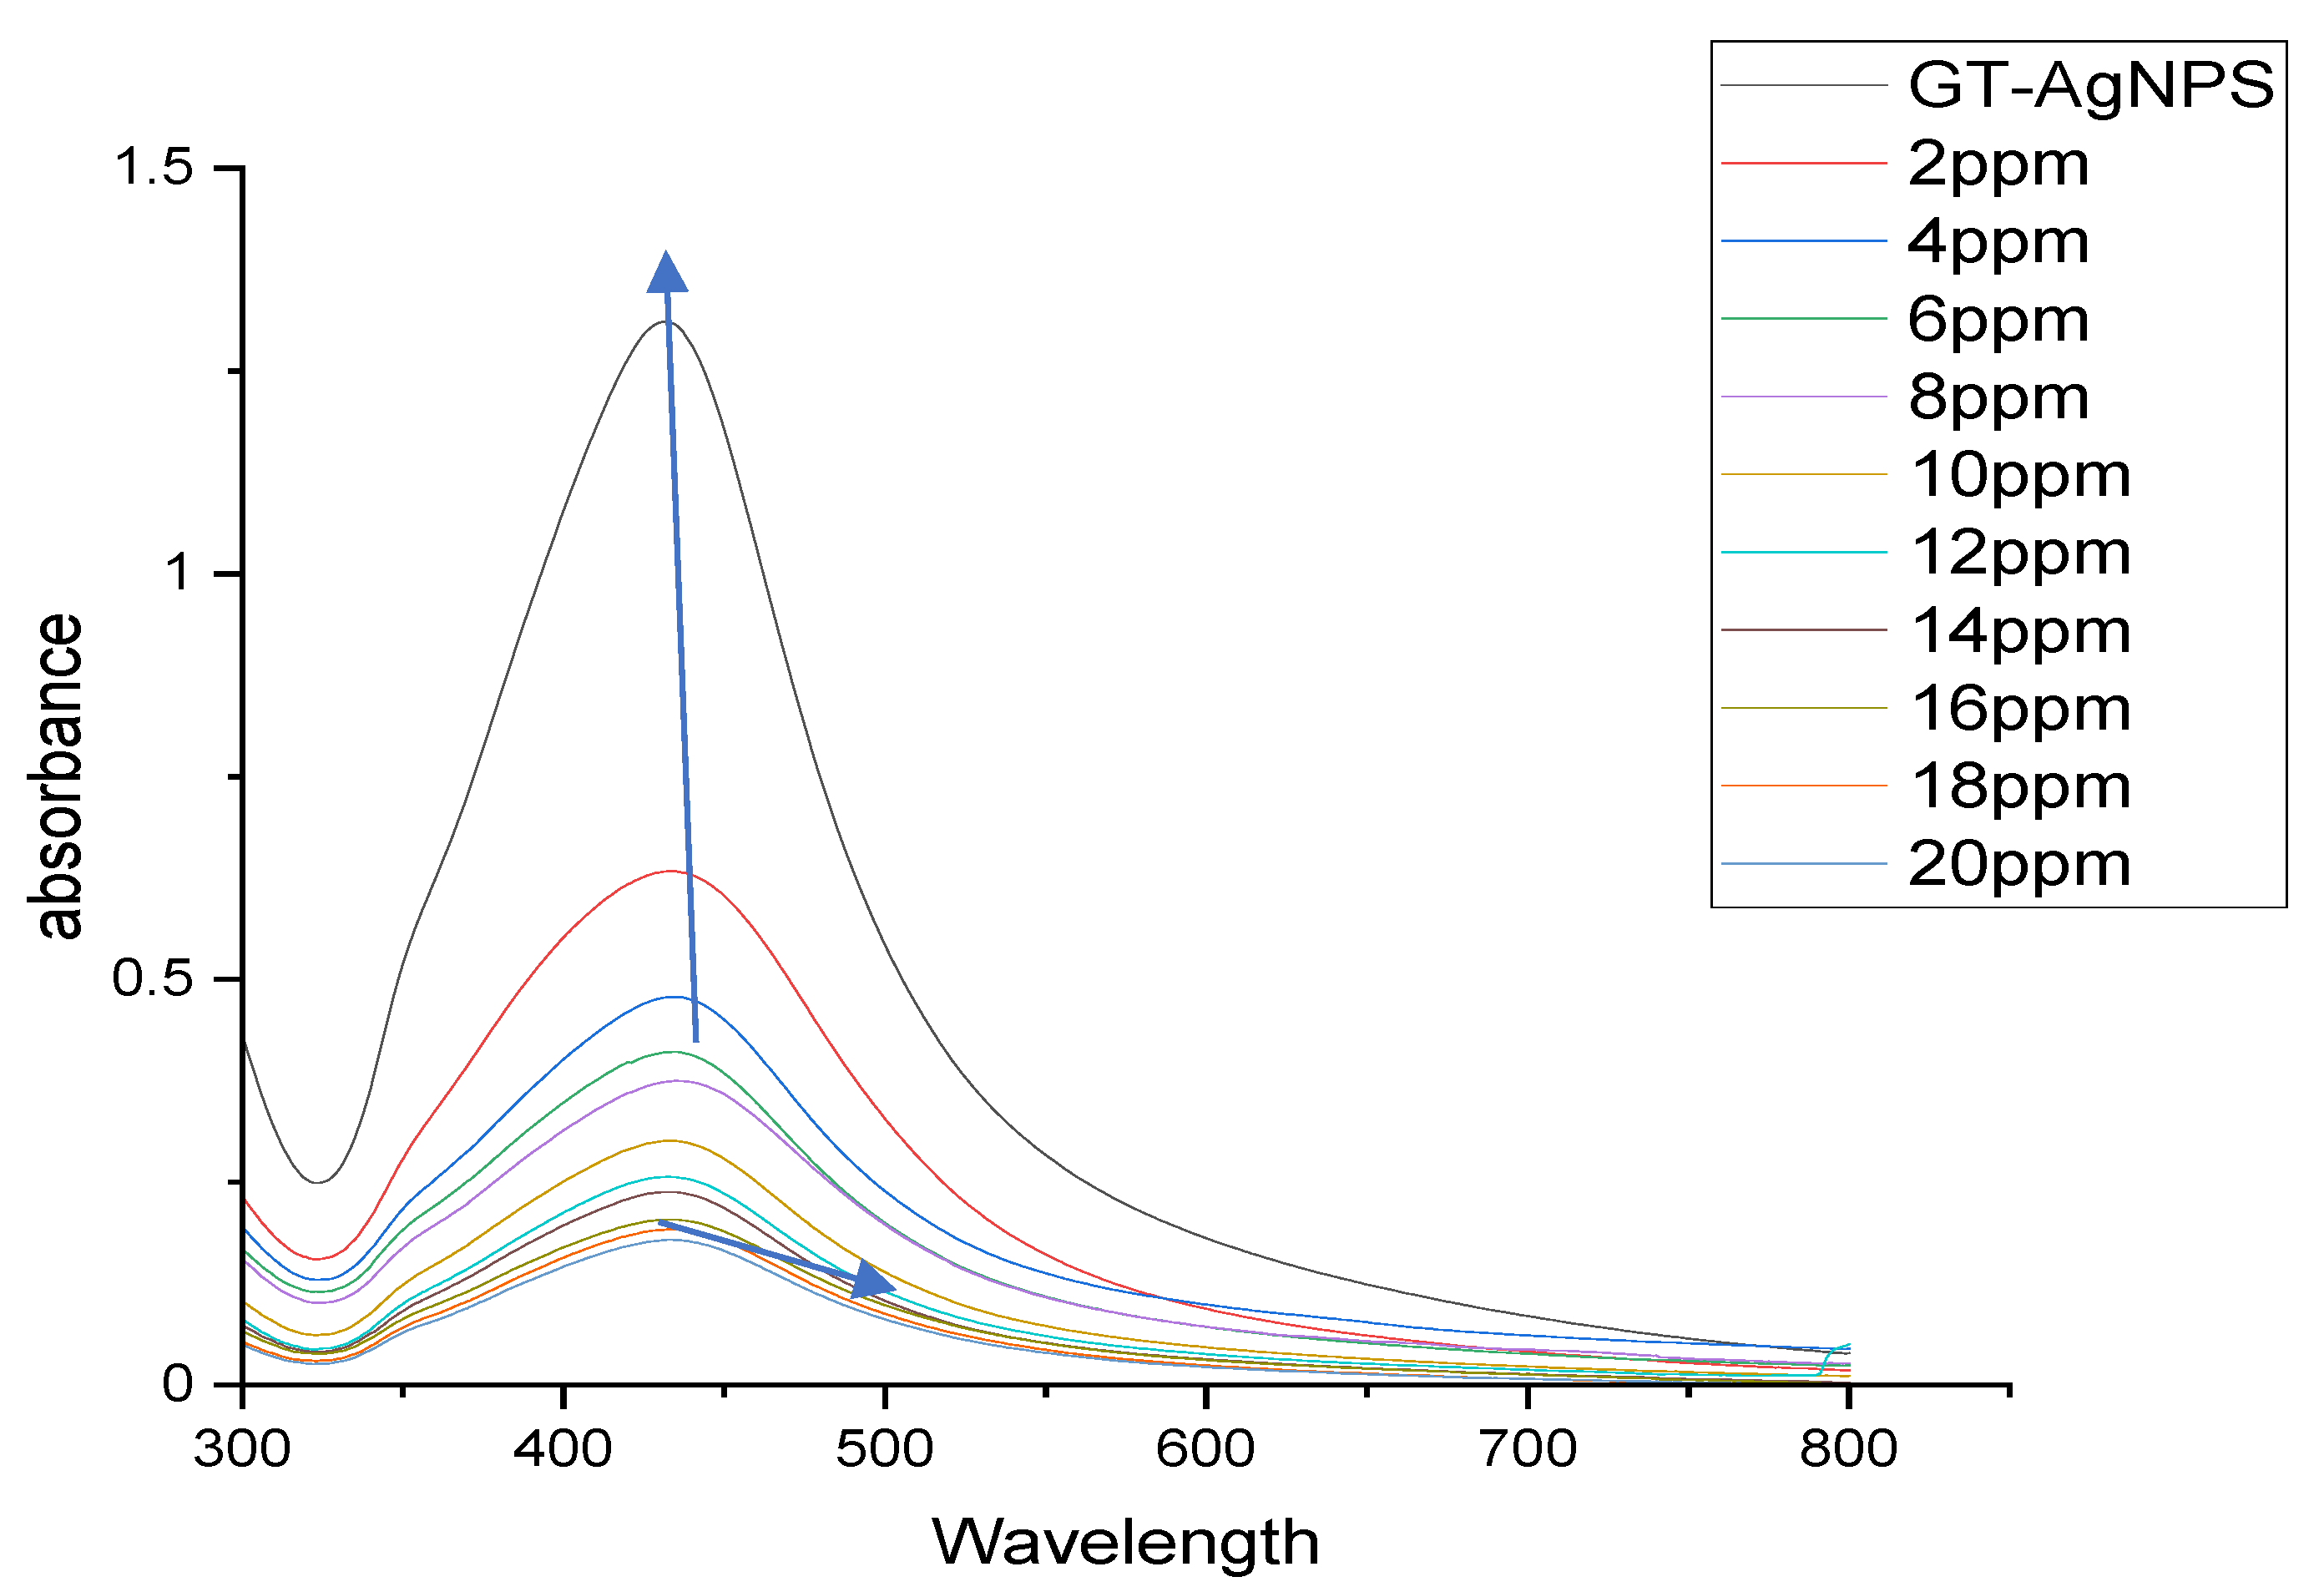
Figure 15.
Uv-visible spectroscopy of detection of gold (2-20ppm) by GT-AgNPs.
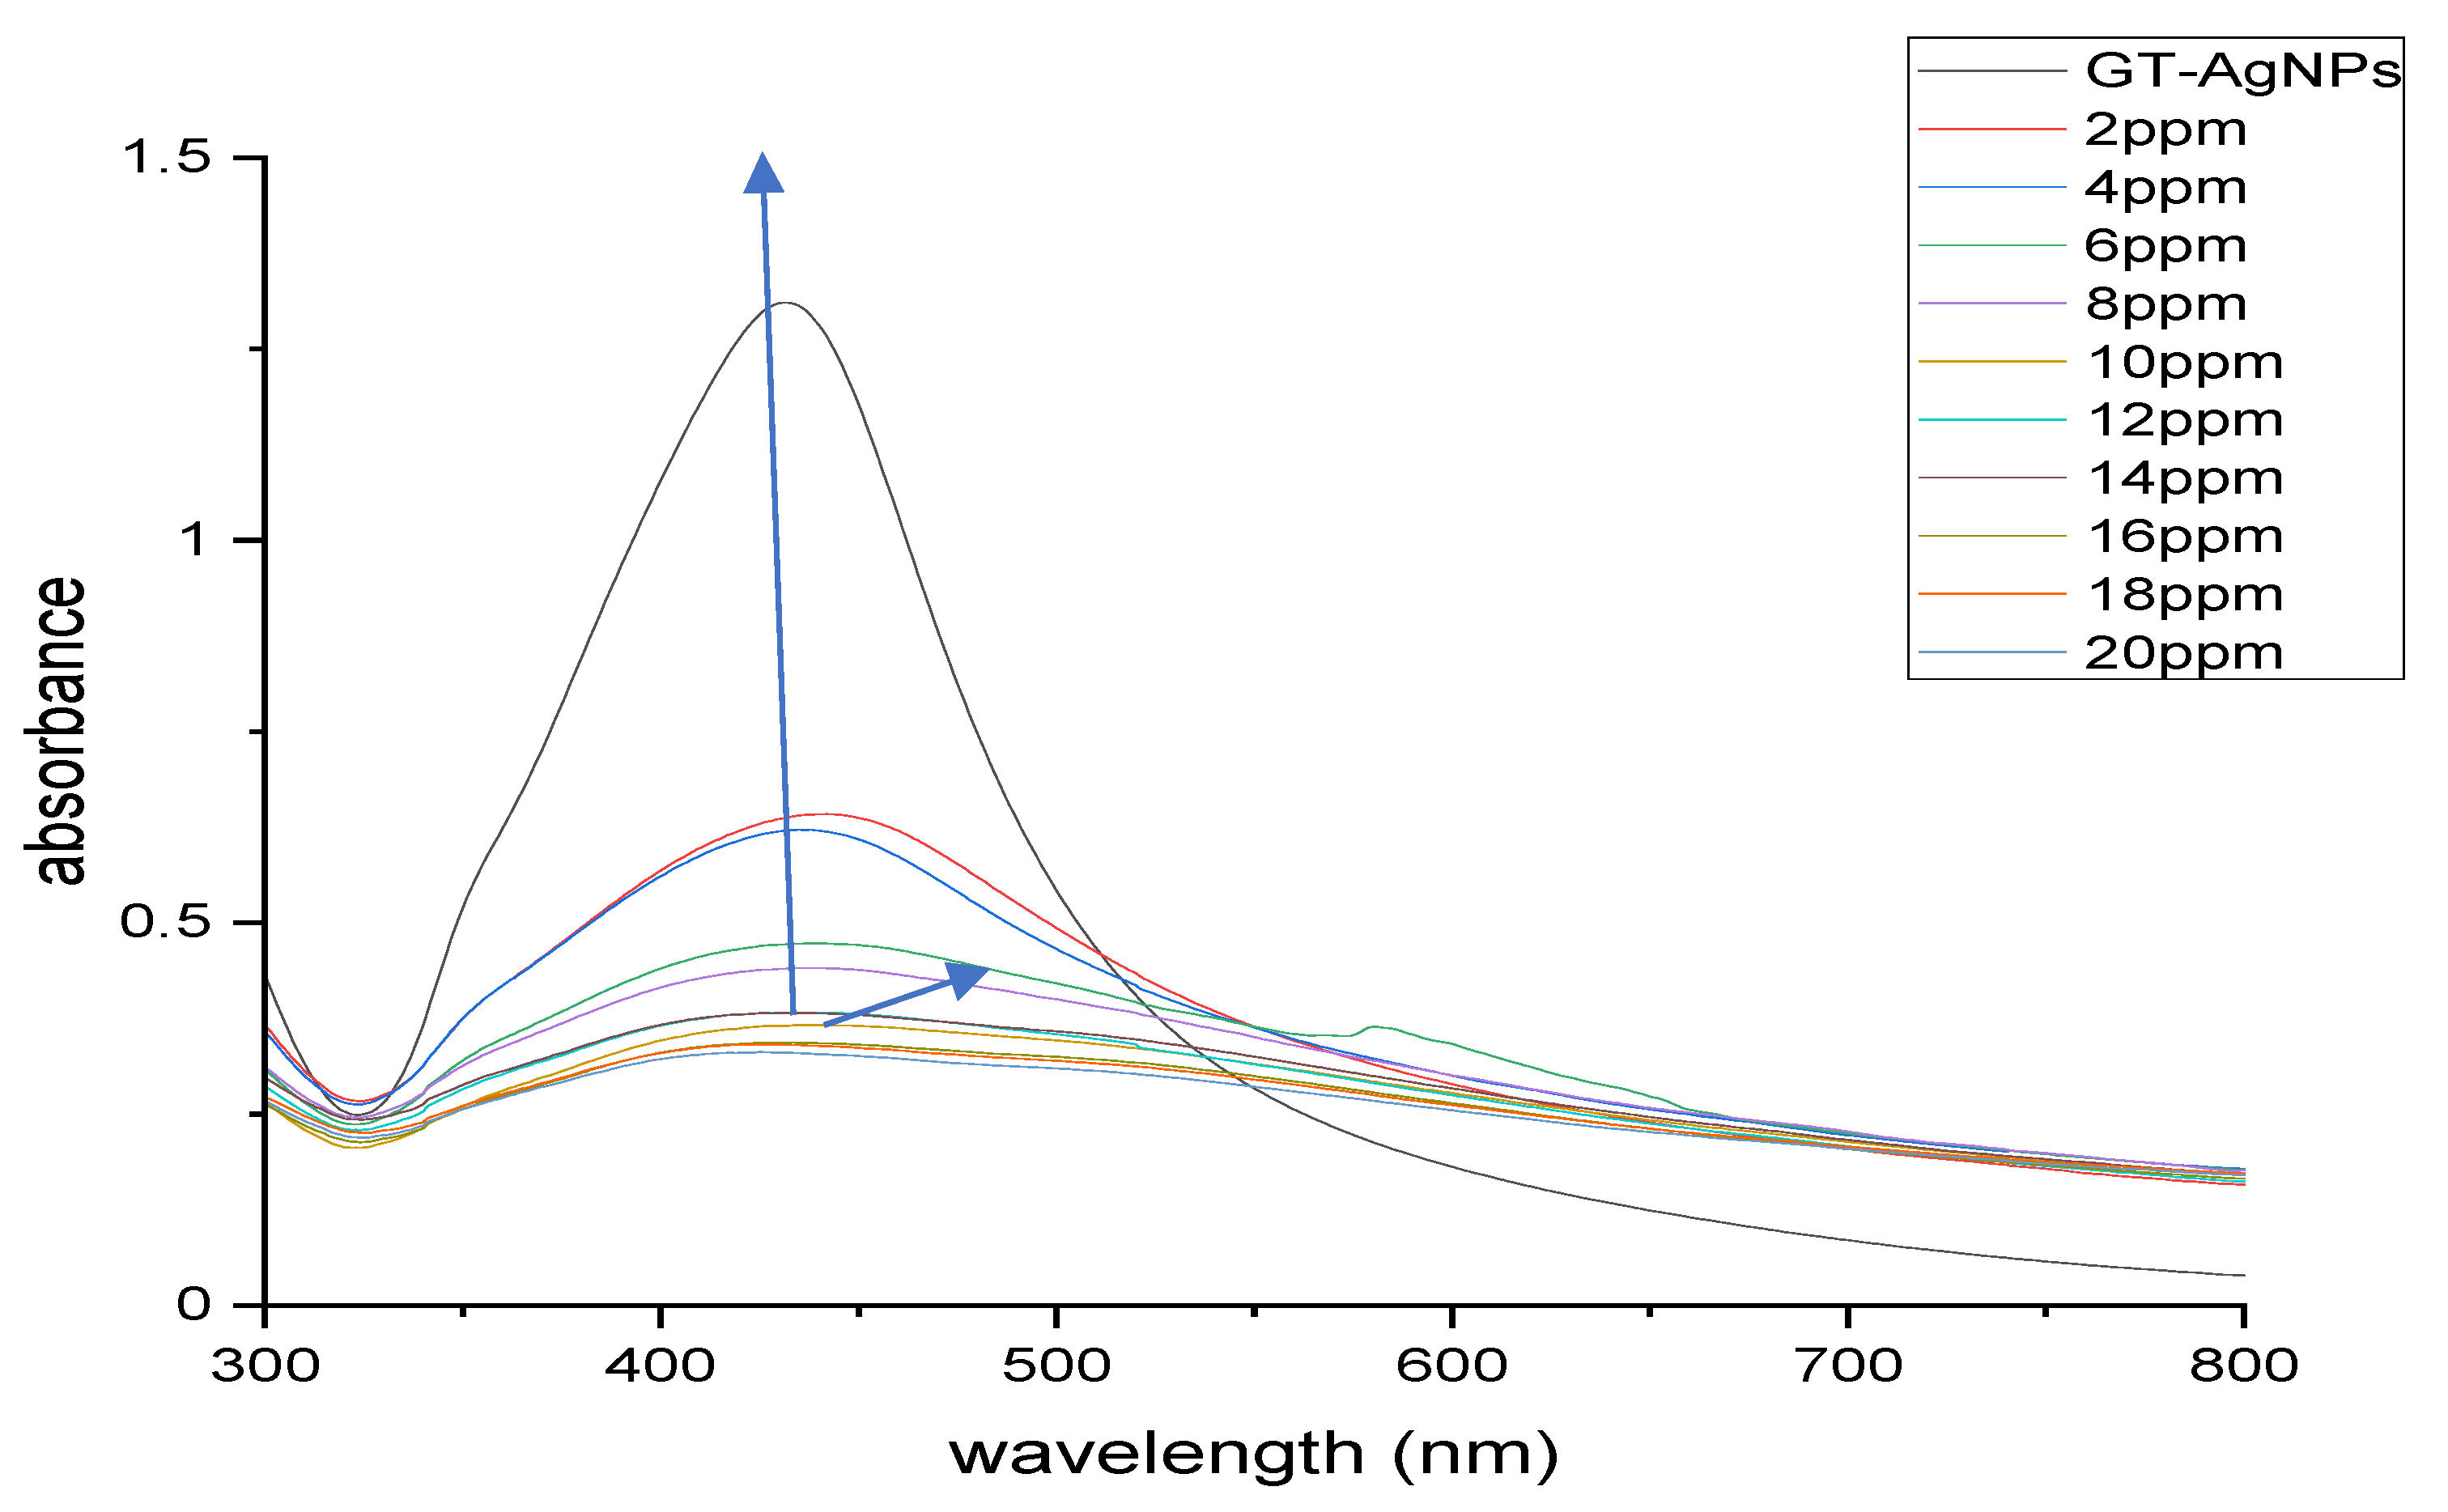
Figure 16.
Uv/visible spectroscopy of Silver and GT-AuNPs.
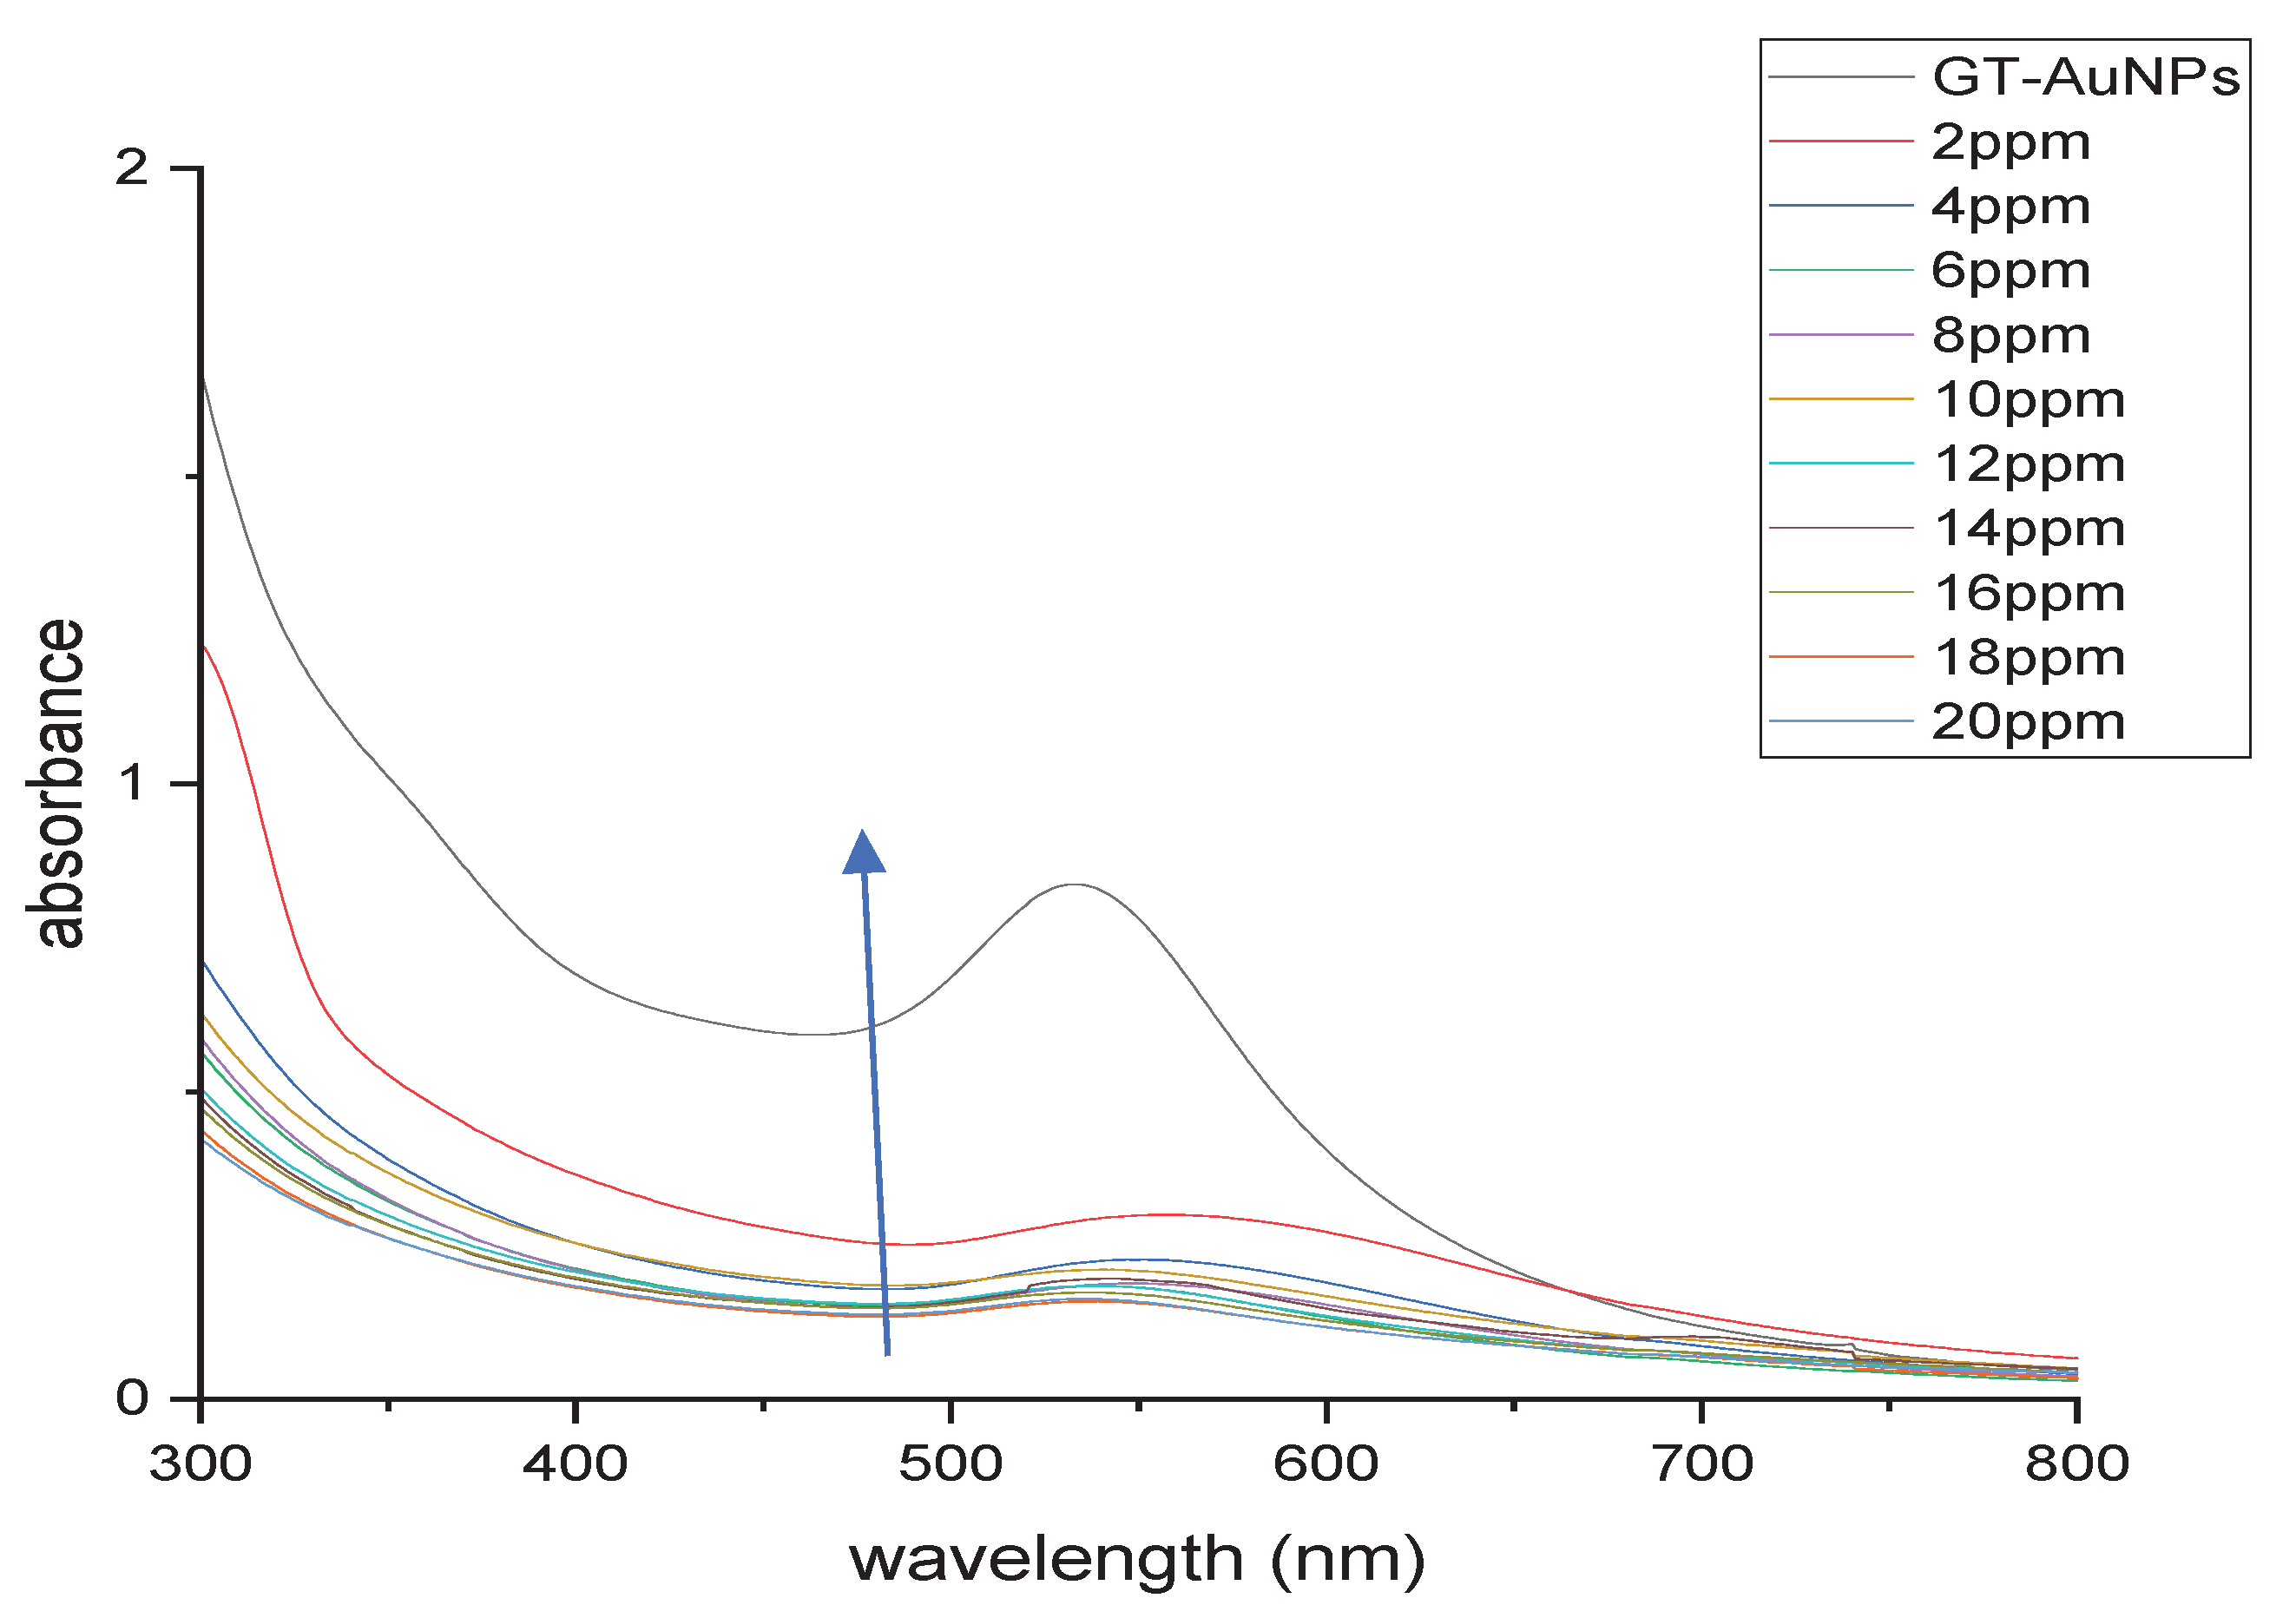
Figure 17.
UV/visible spectra of copper and GT-AuNPs.
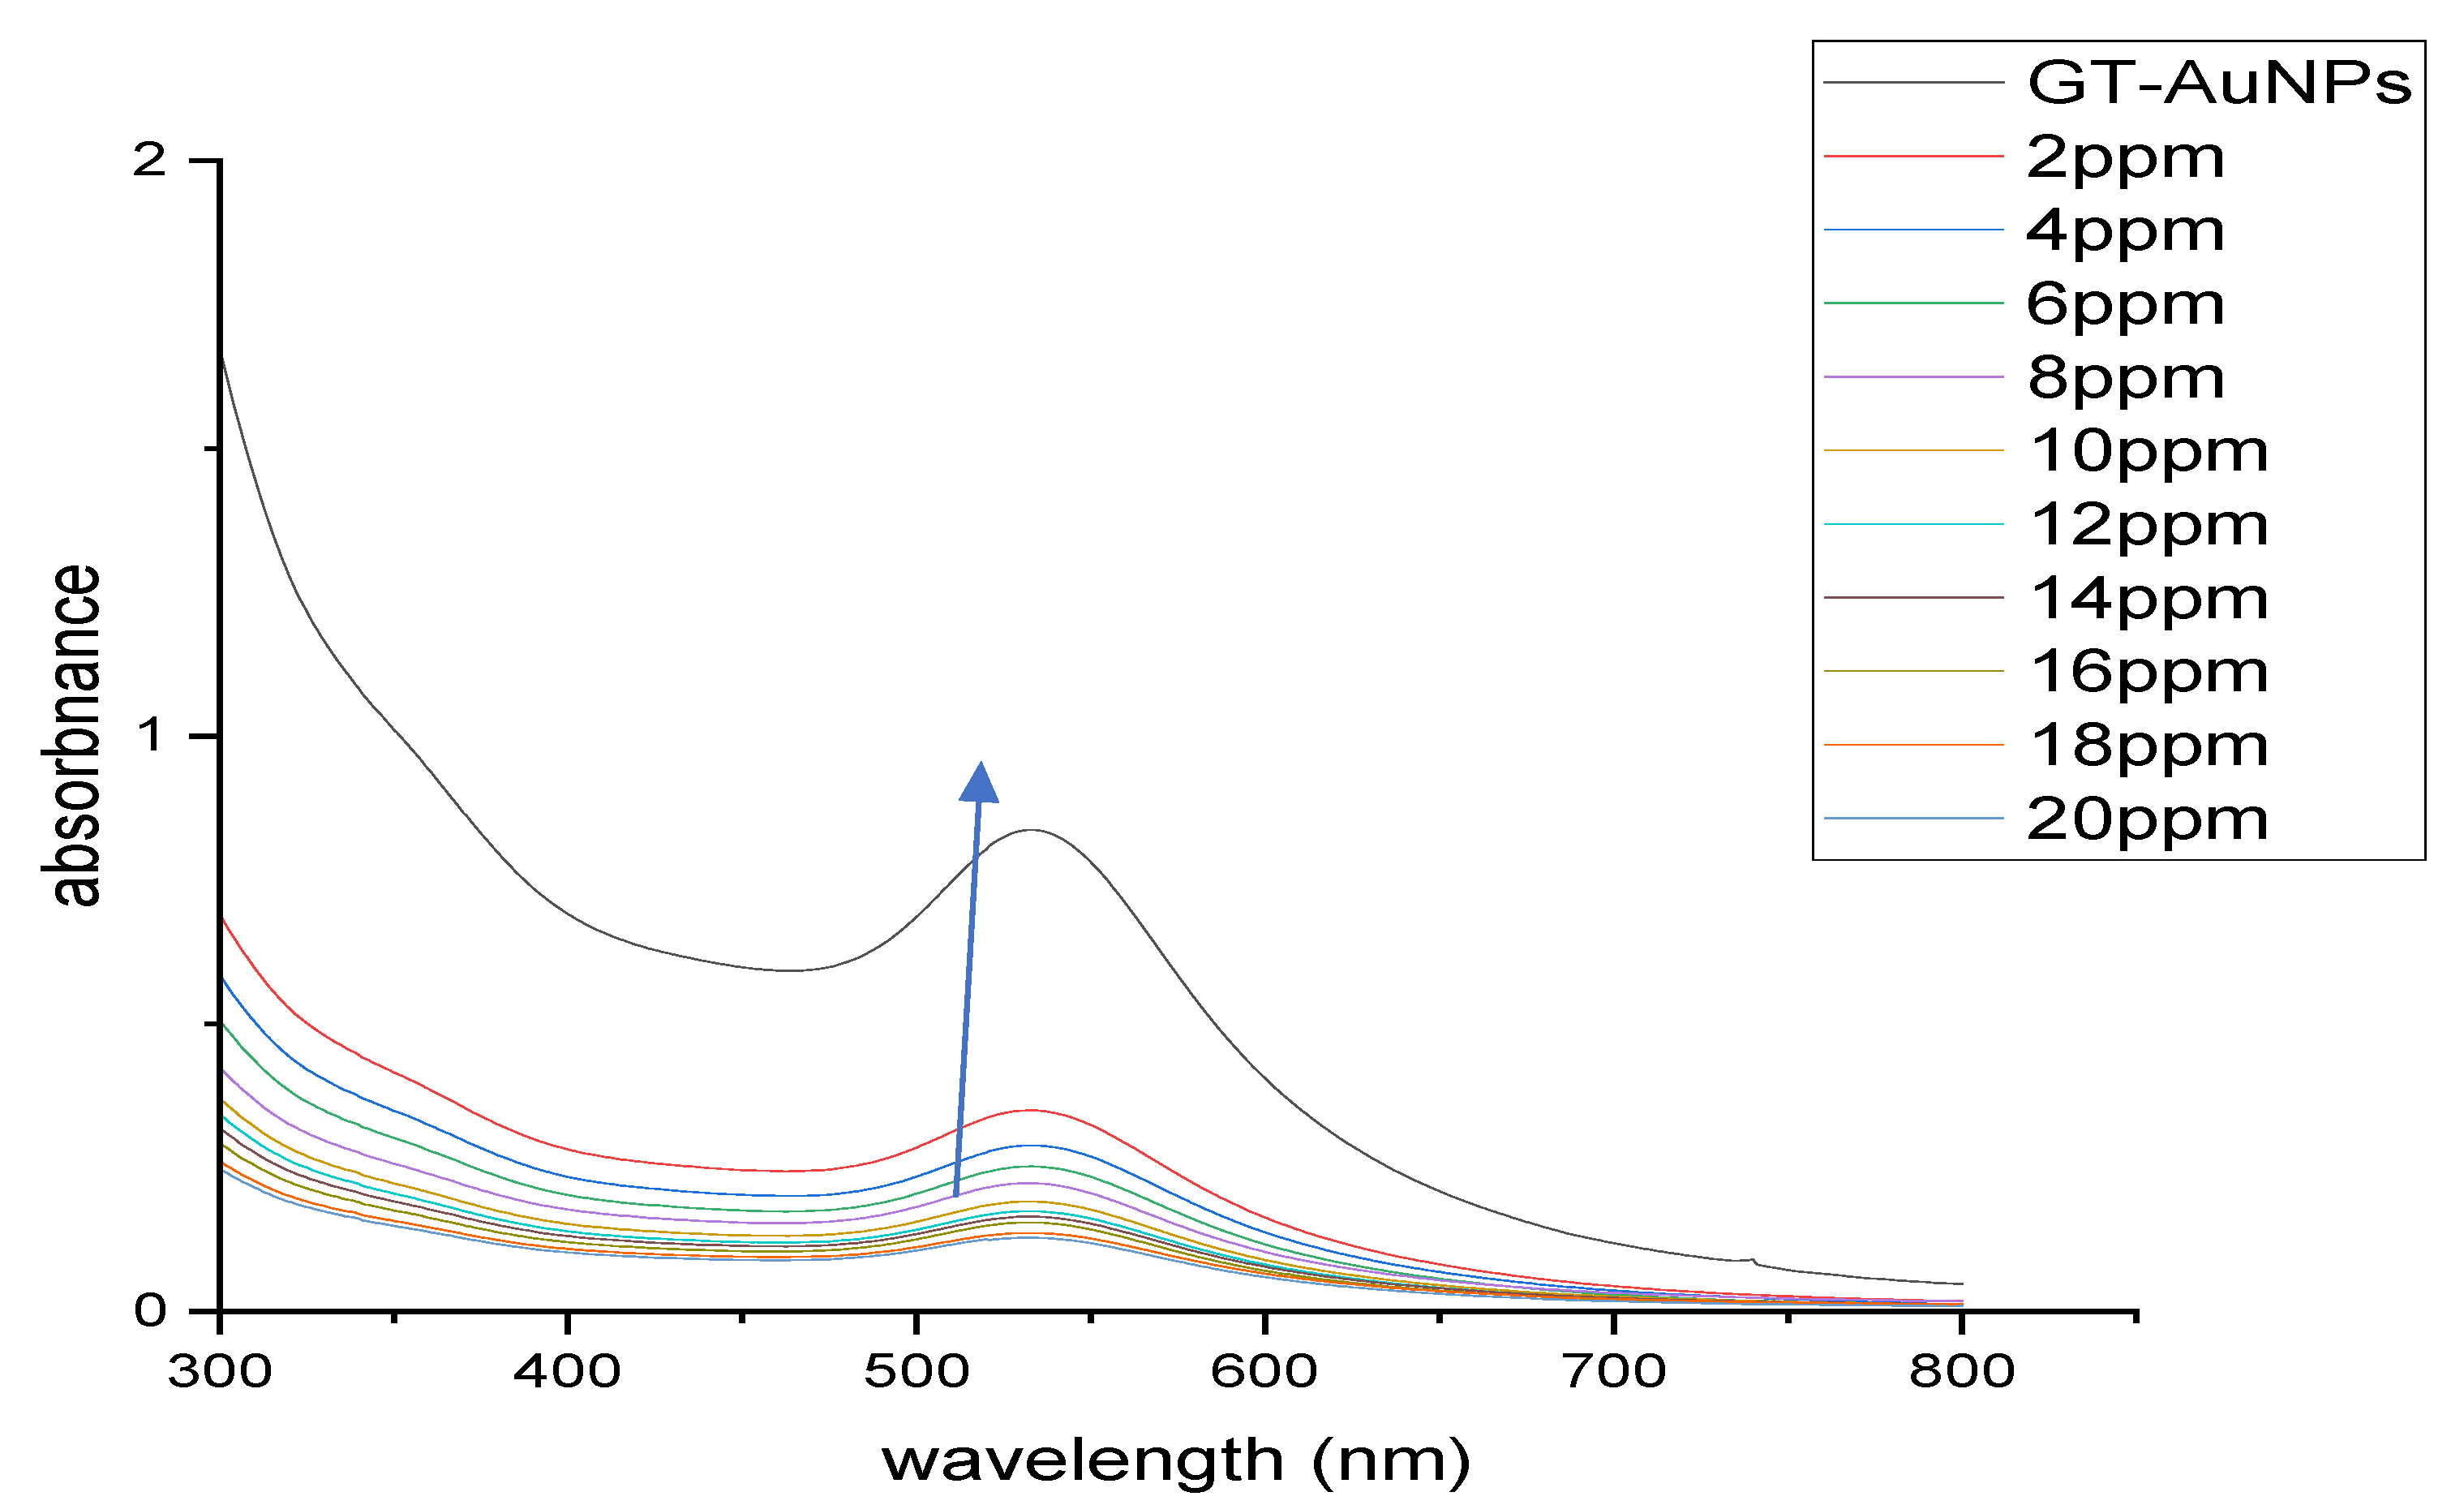
Figure 13.
Effect of initial concentration of Cu(II) by GT-AgNPs.
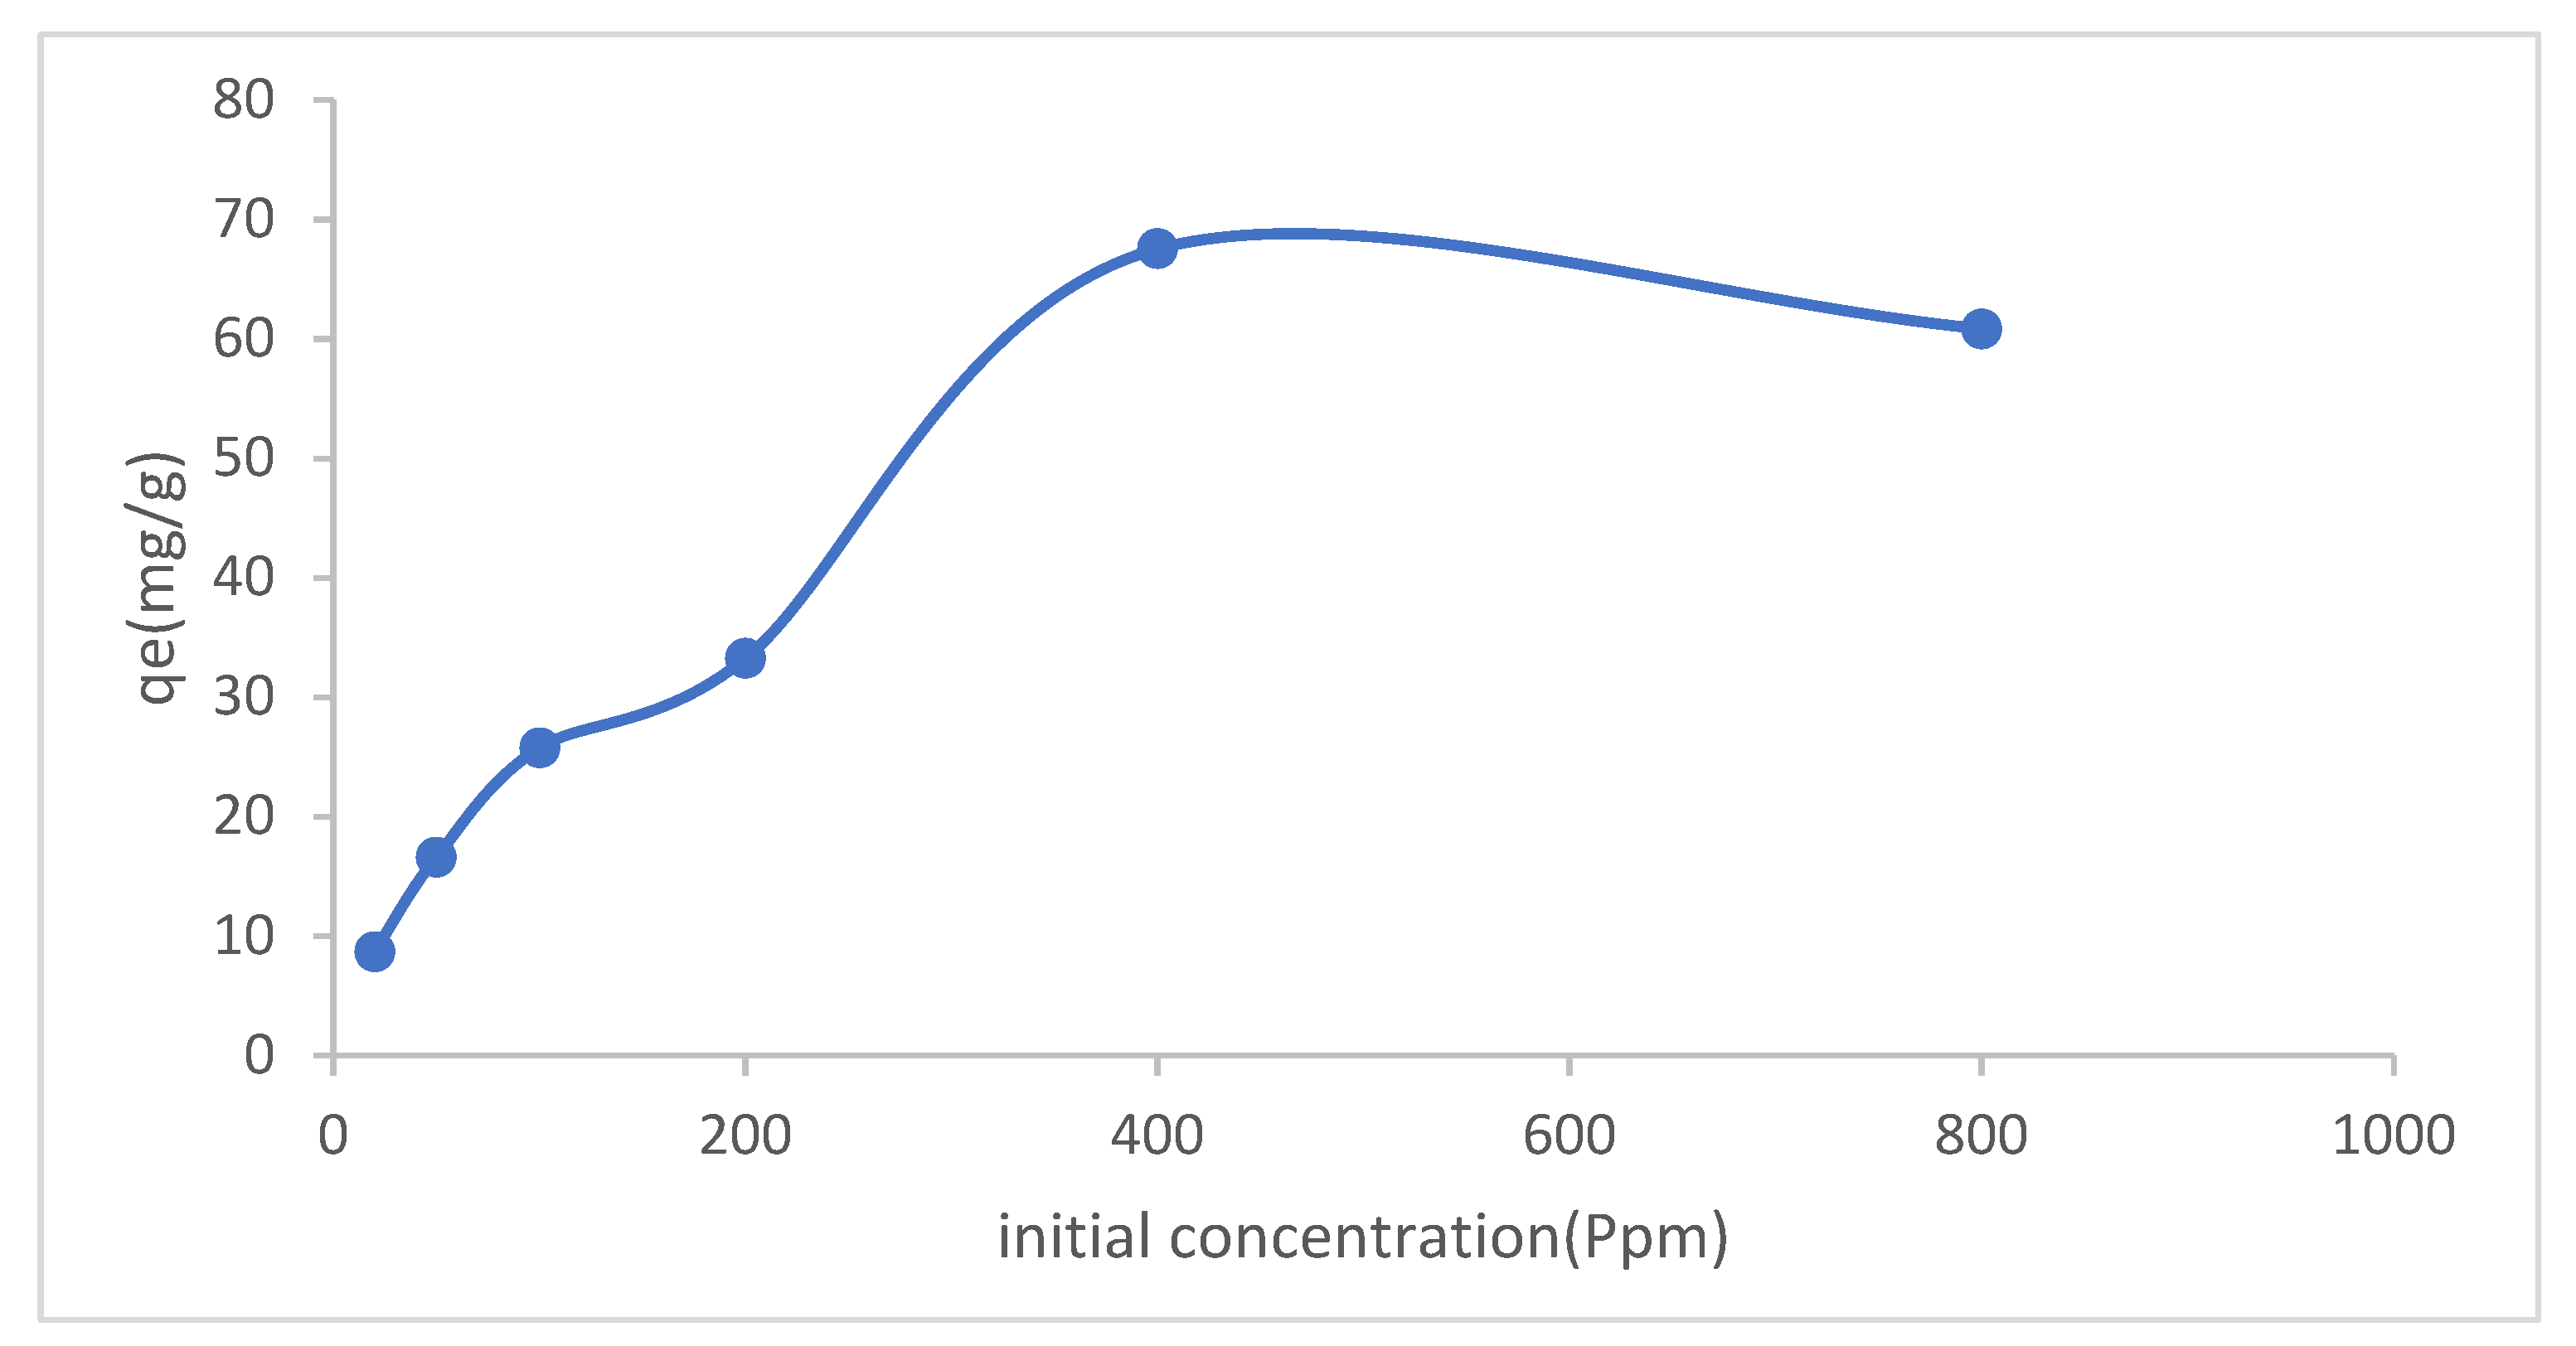
Figure 14.
Effect of contact time of Cu(II) by GT-AgNPs.
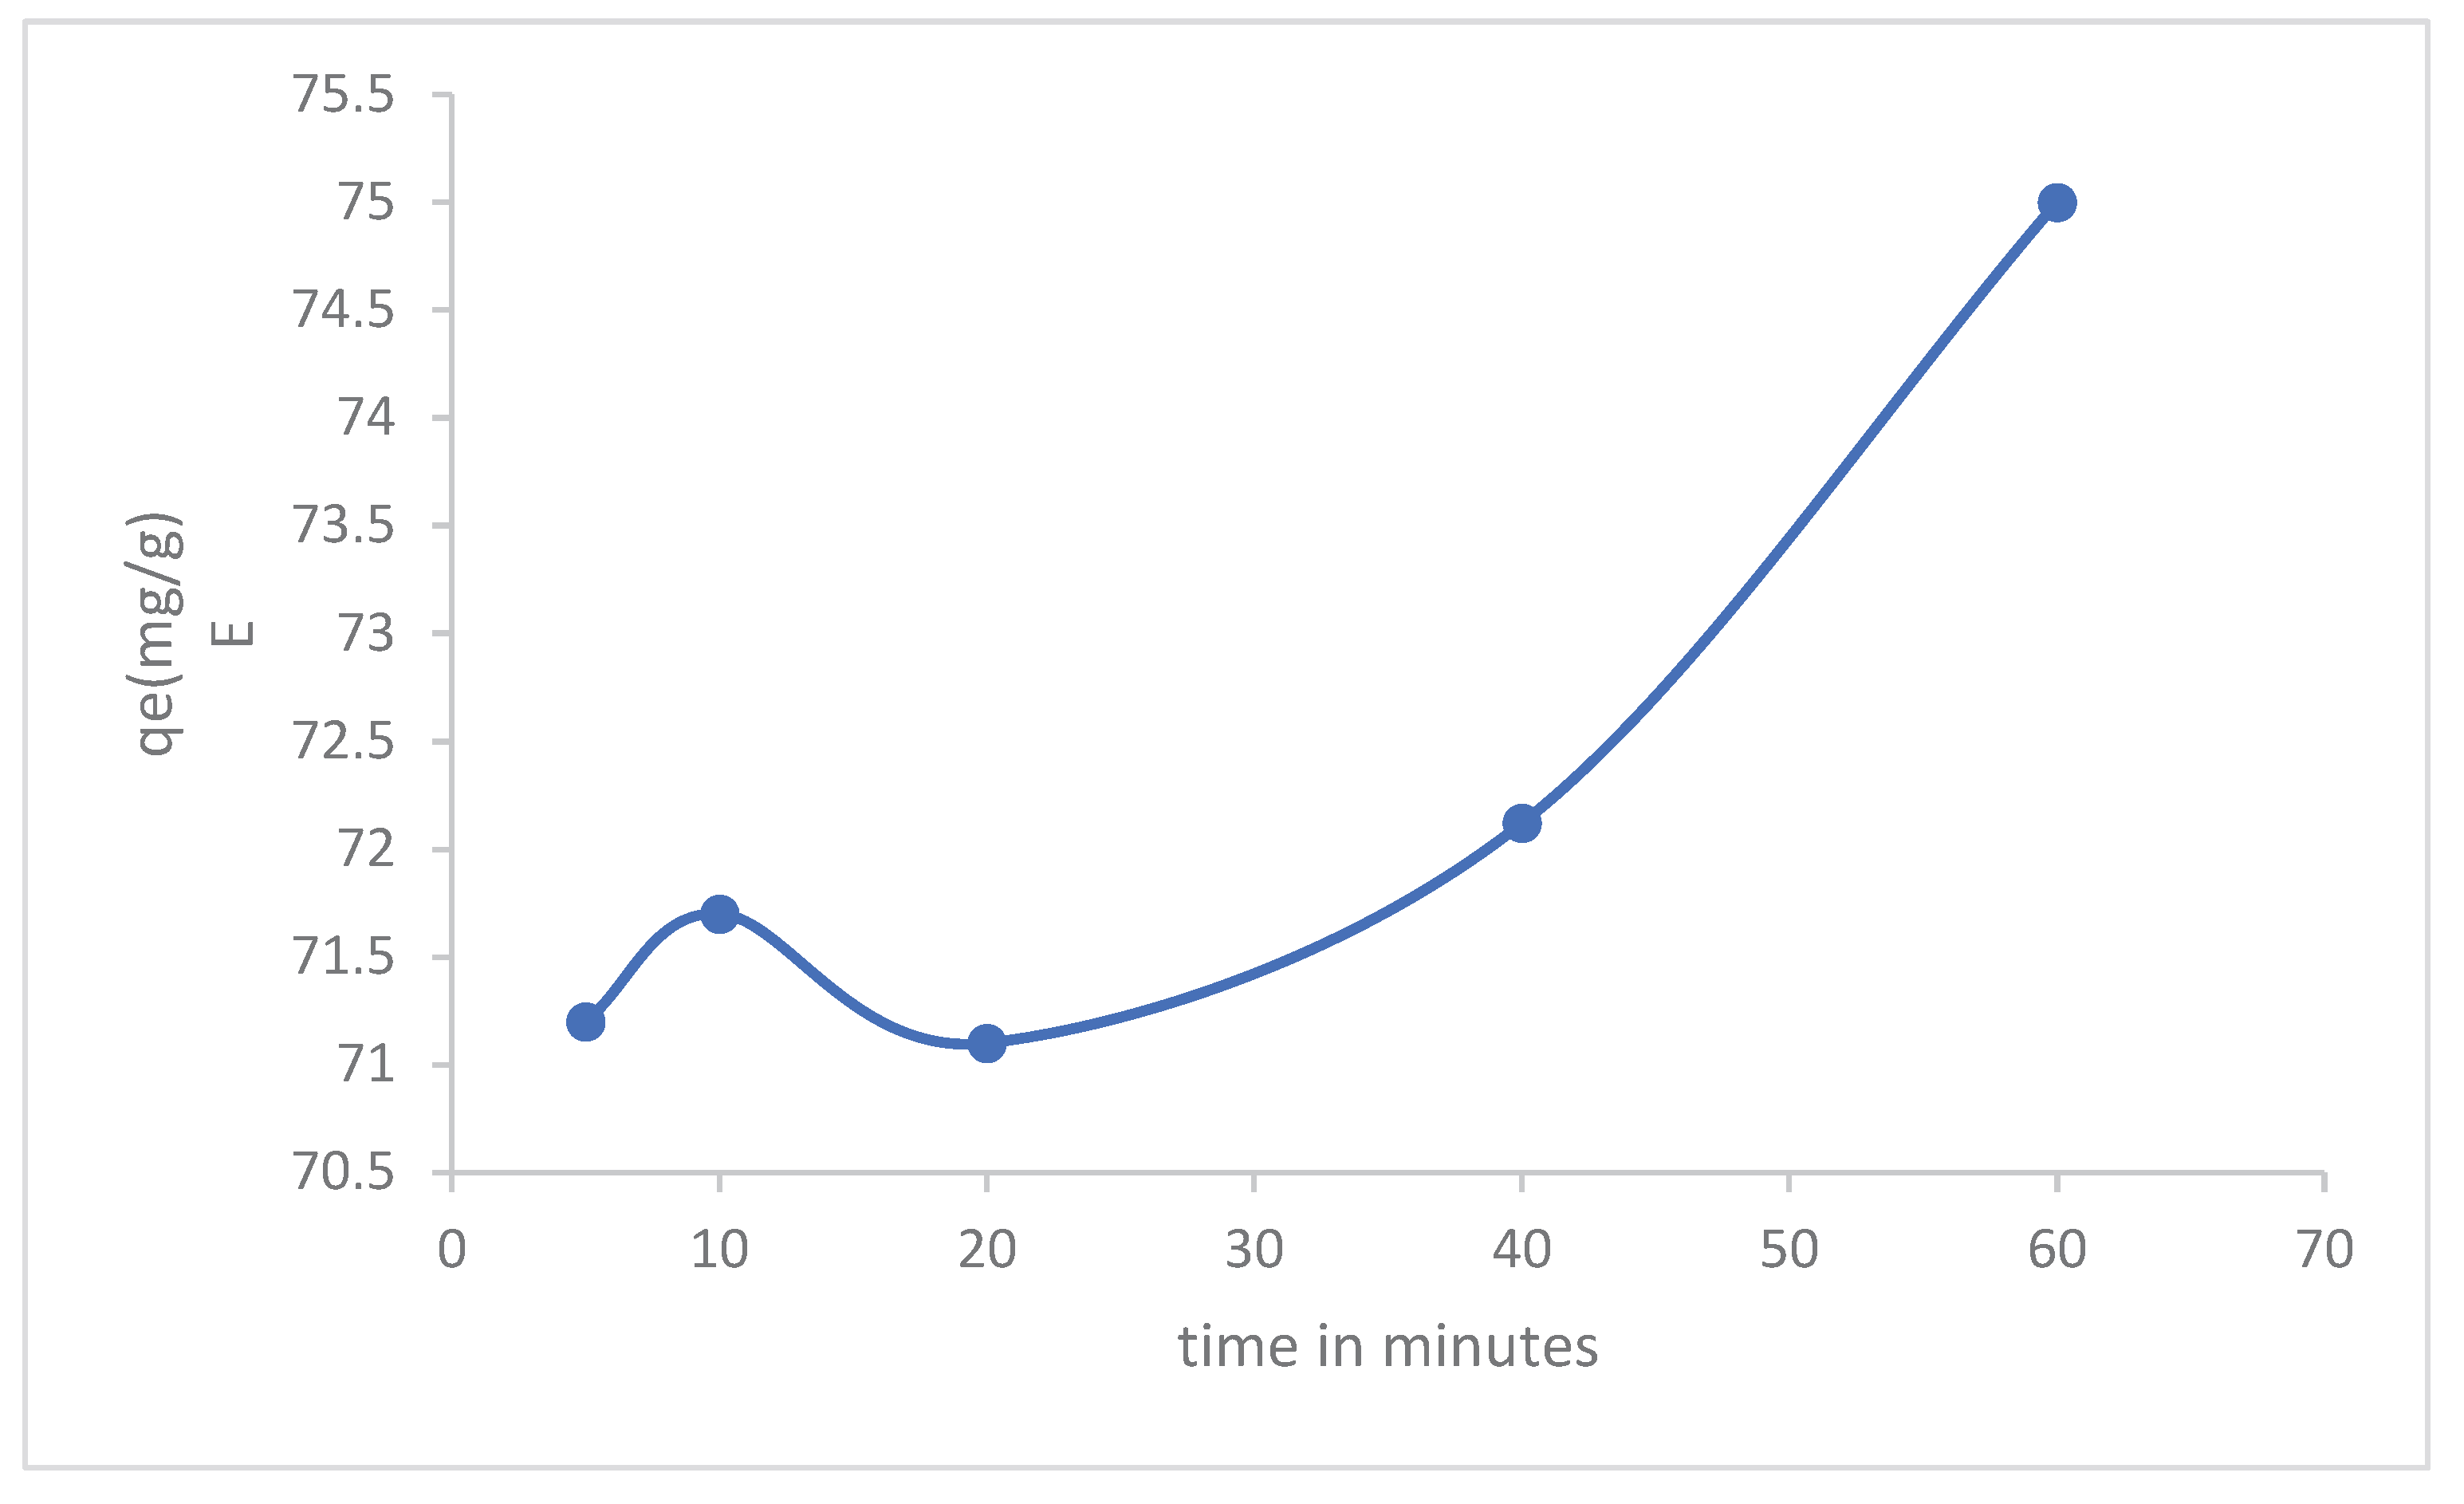
Figure 15.
Effect of dose of Cu (II) by GT-AgNPs.
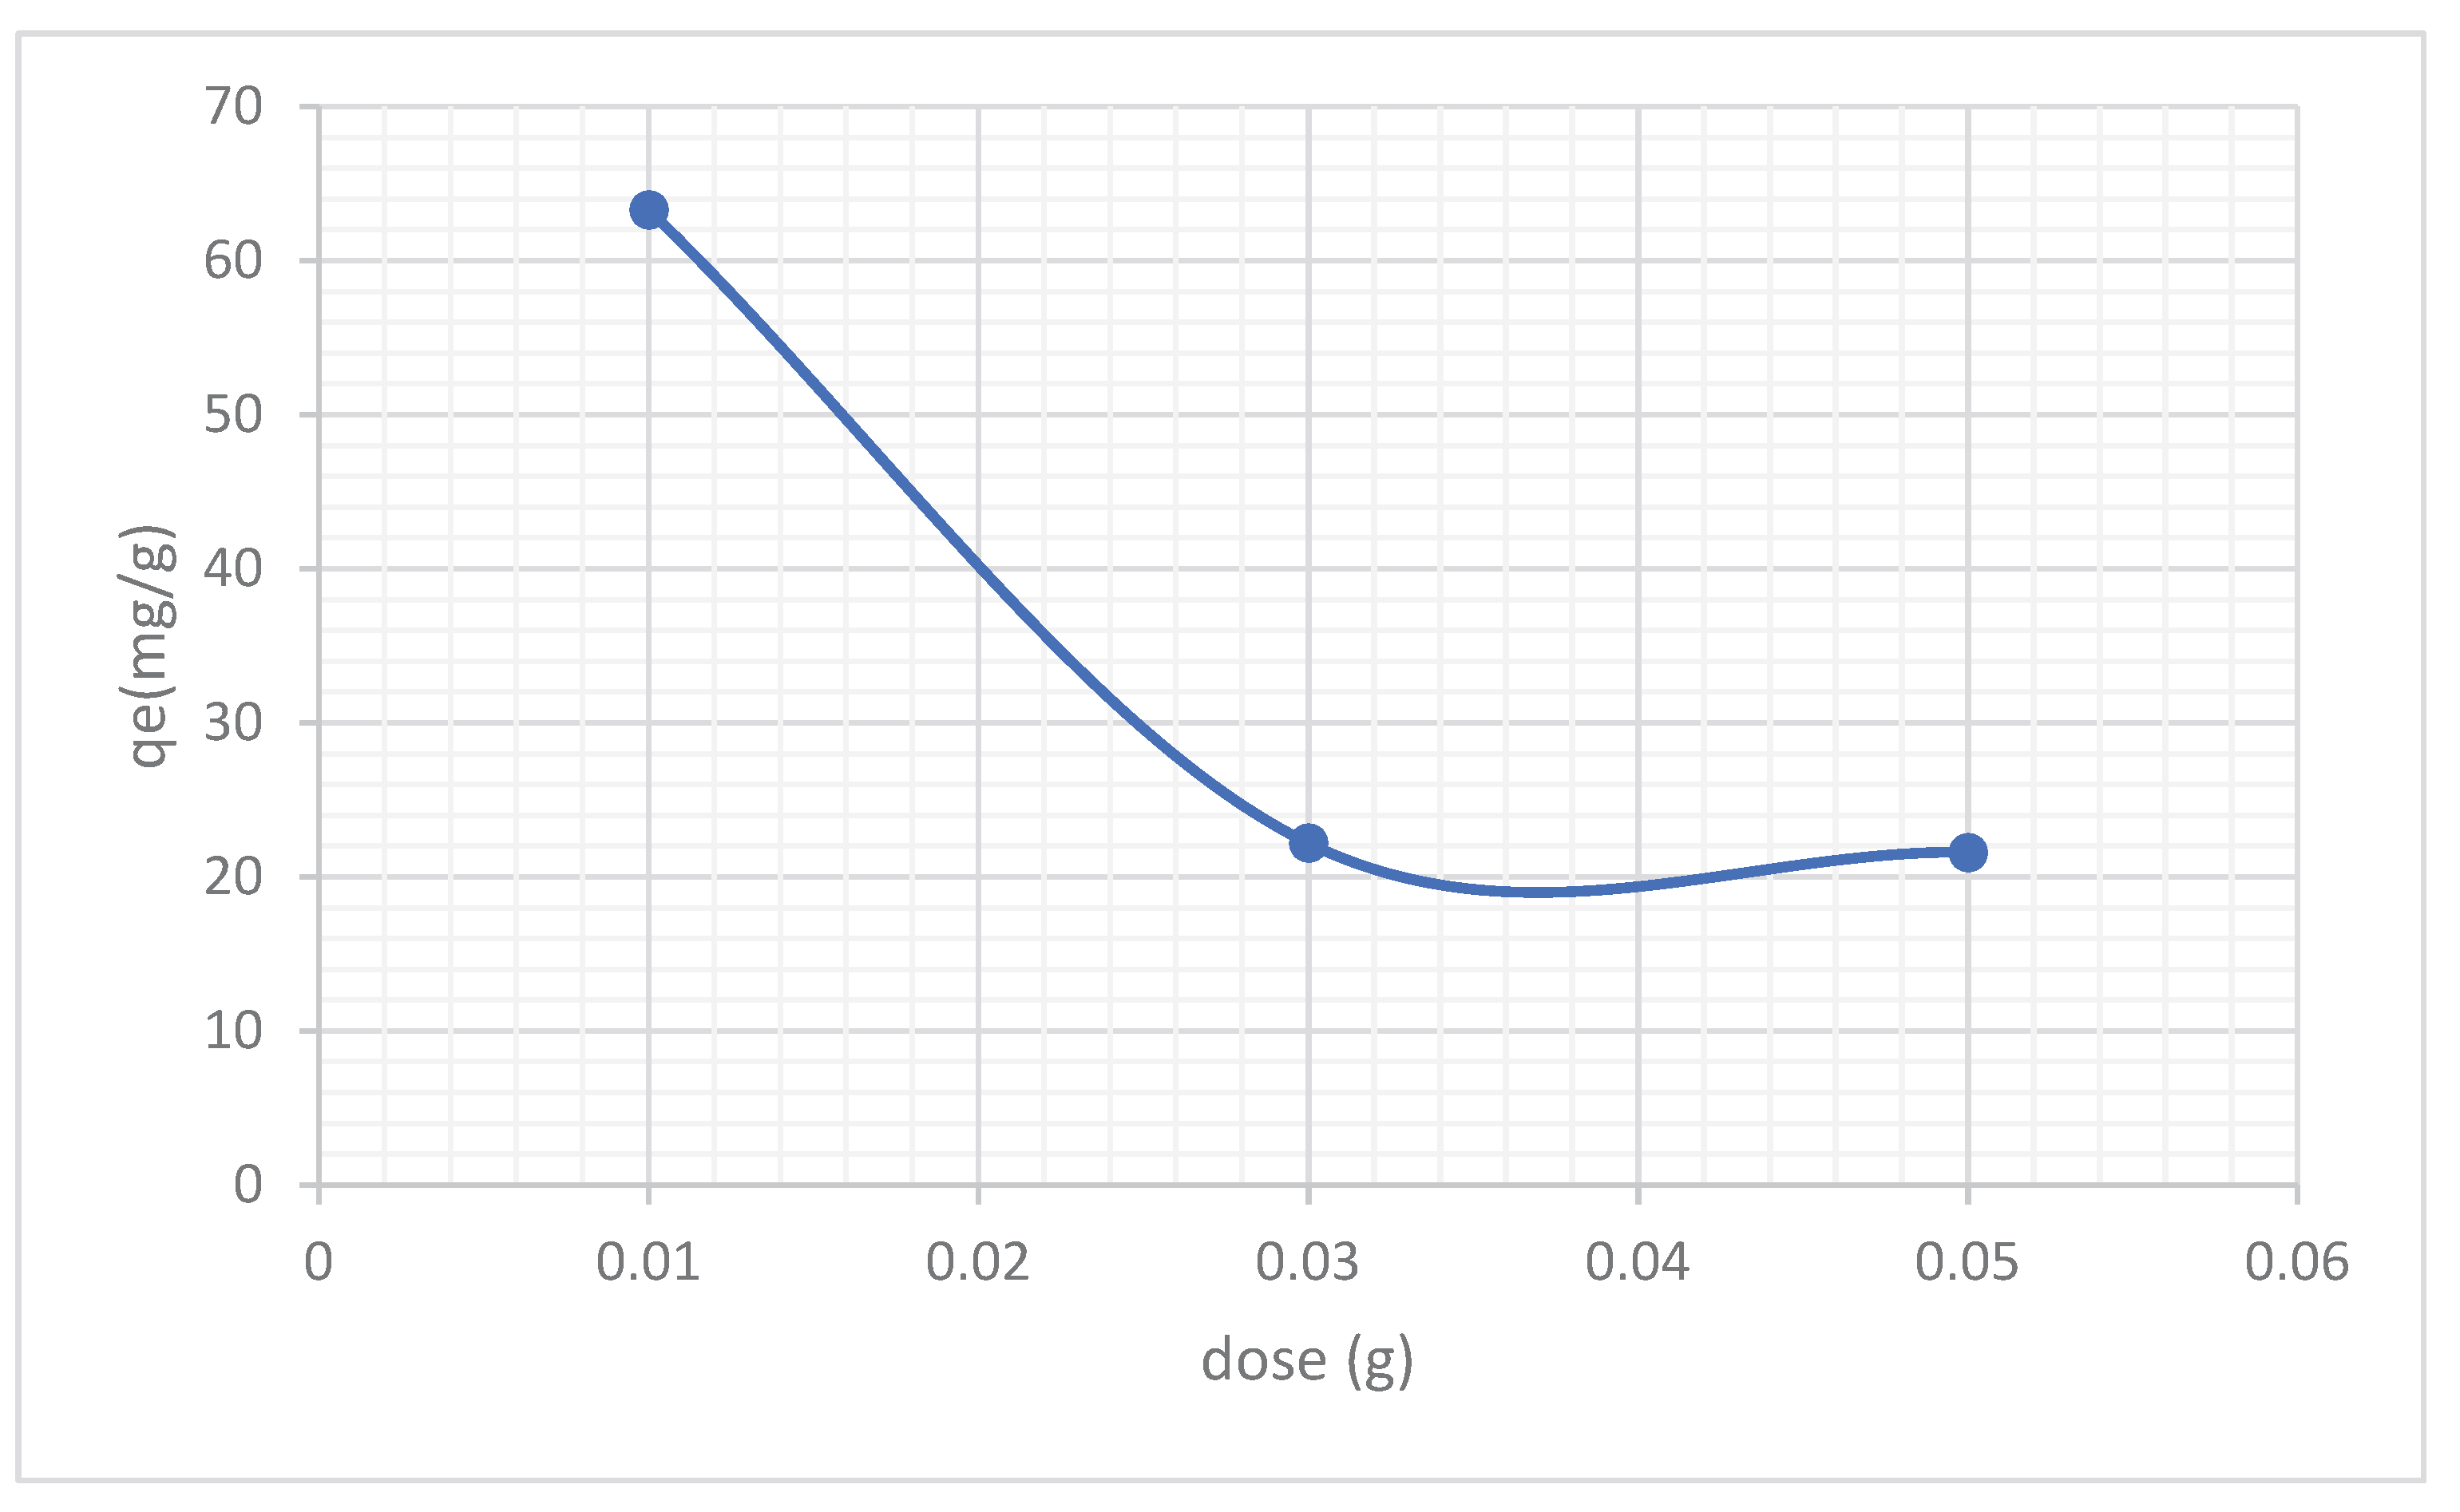
Figure 16.
Effect of pH of Cu II) by GT-AgNPs.
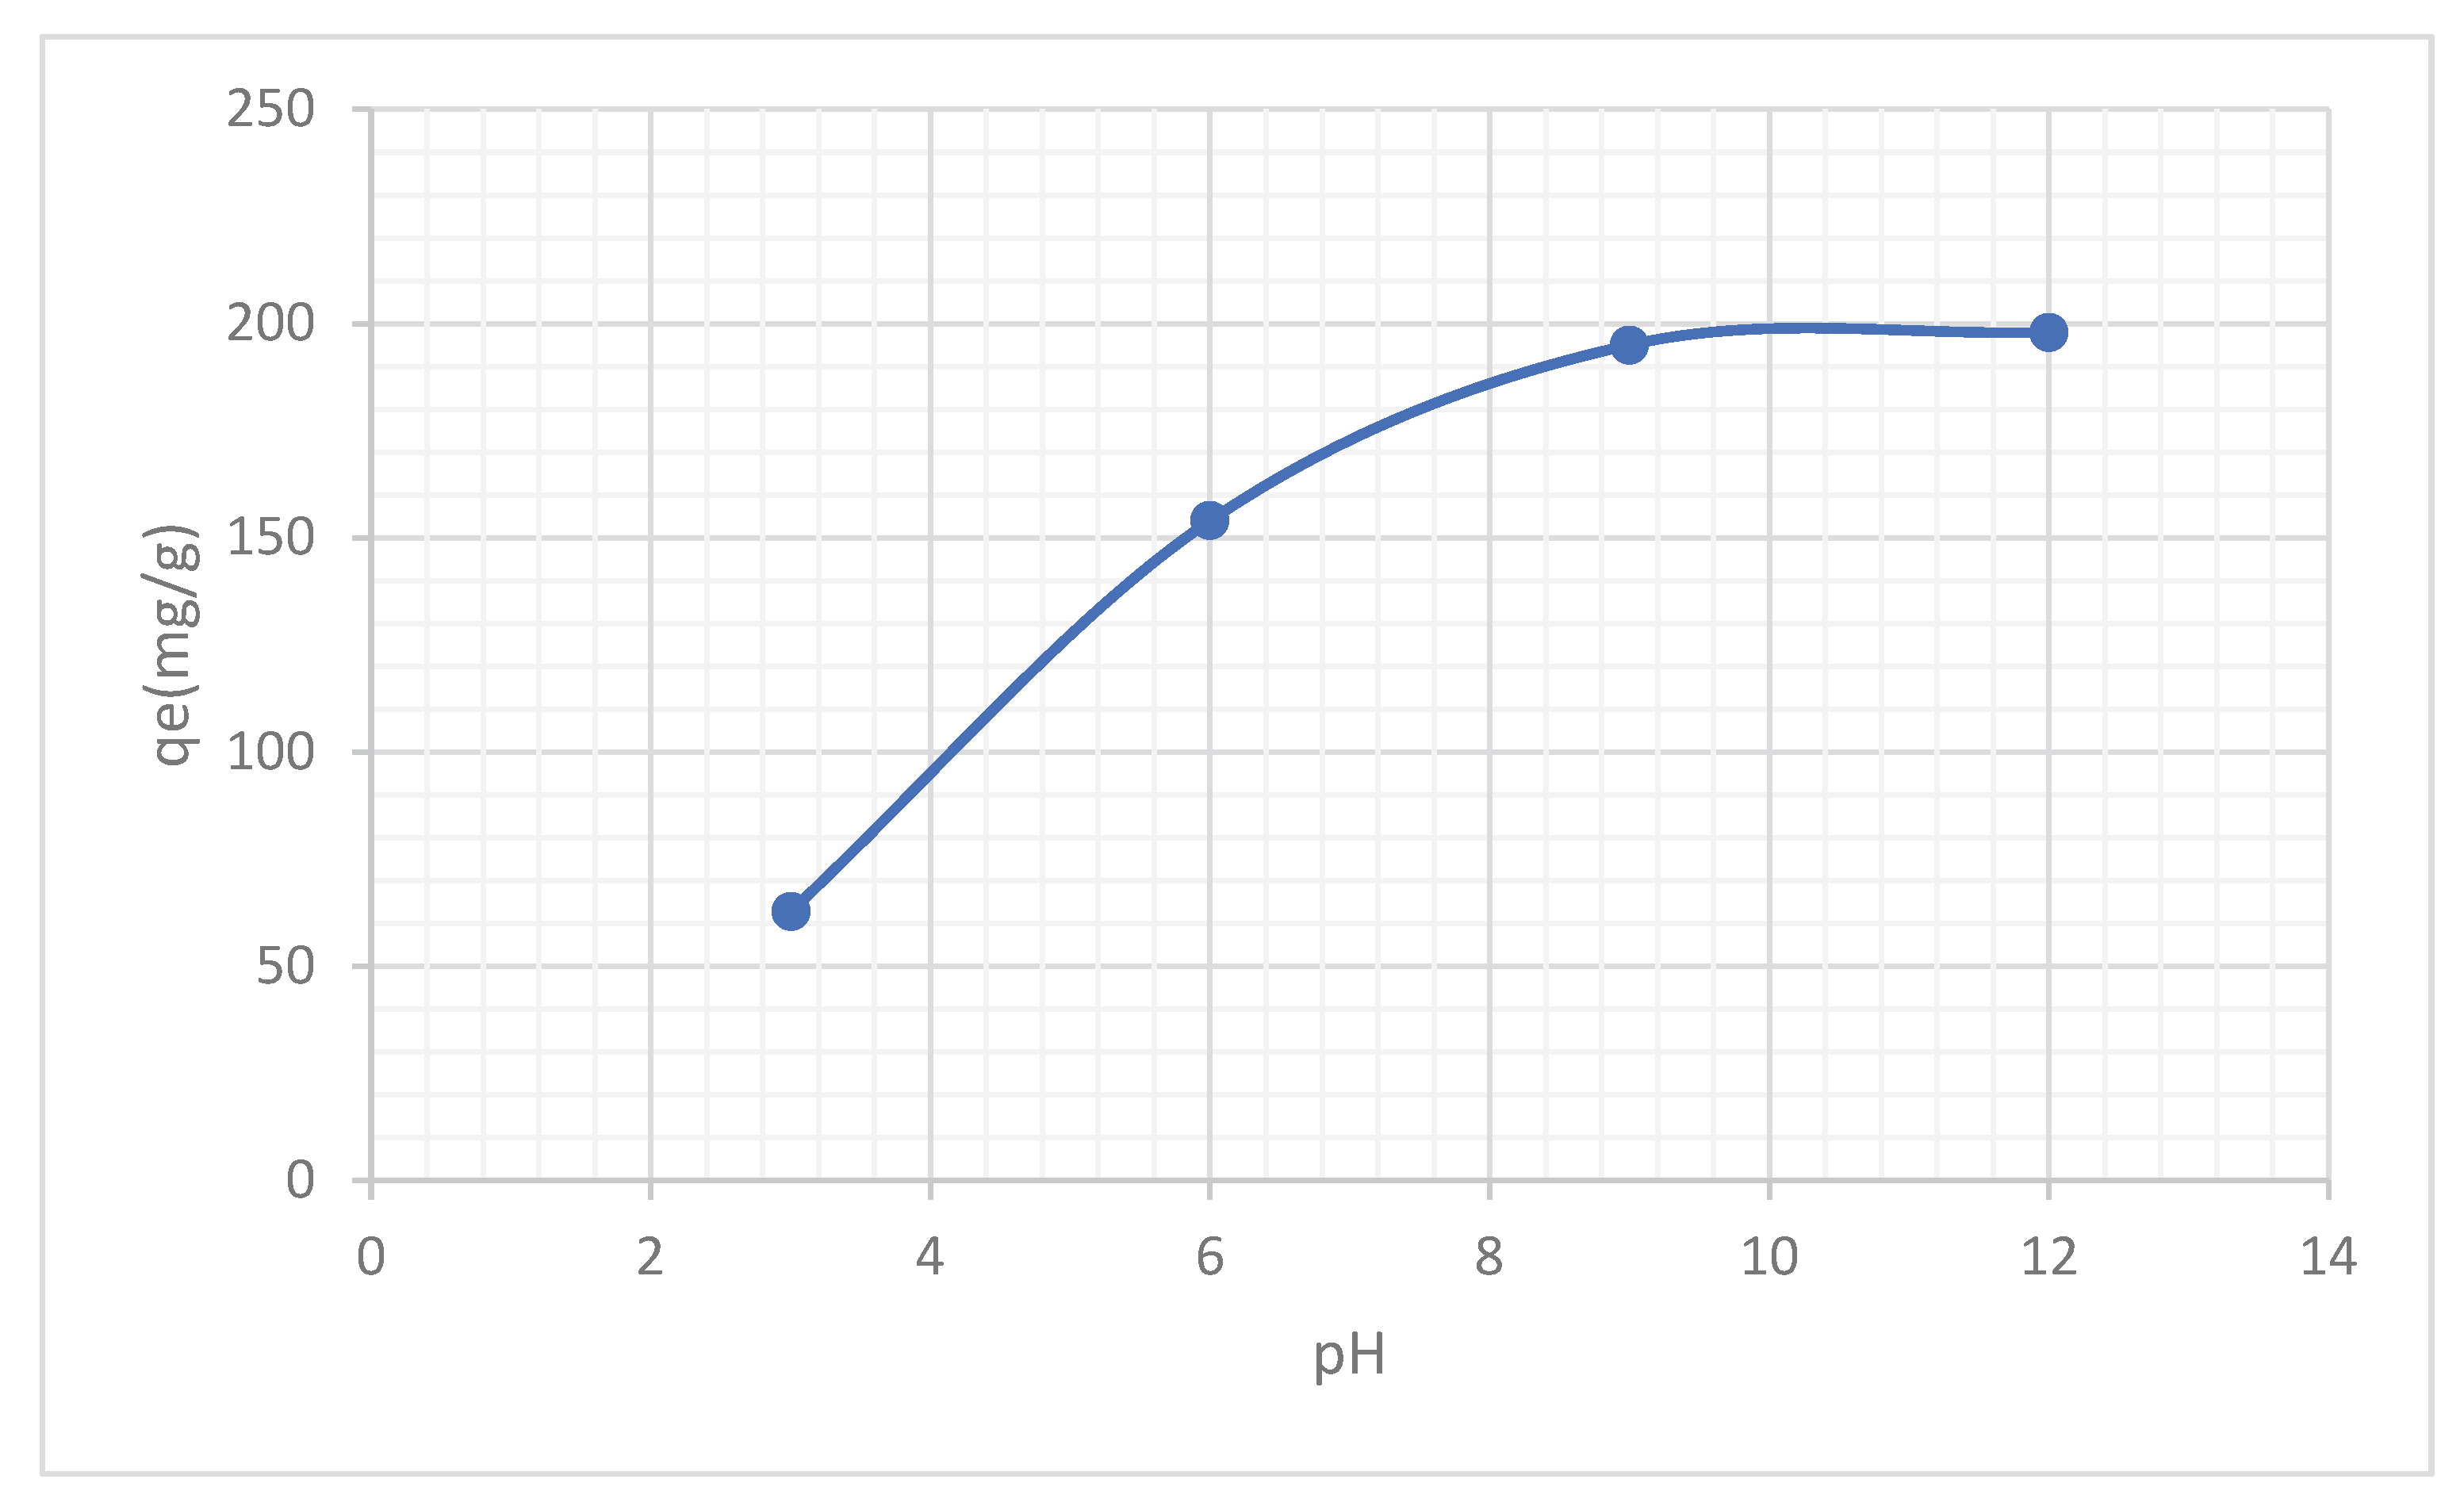
Figure 17.
effect of temperature of Cu (II) by GT-AgNPs.
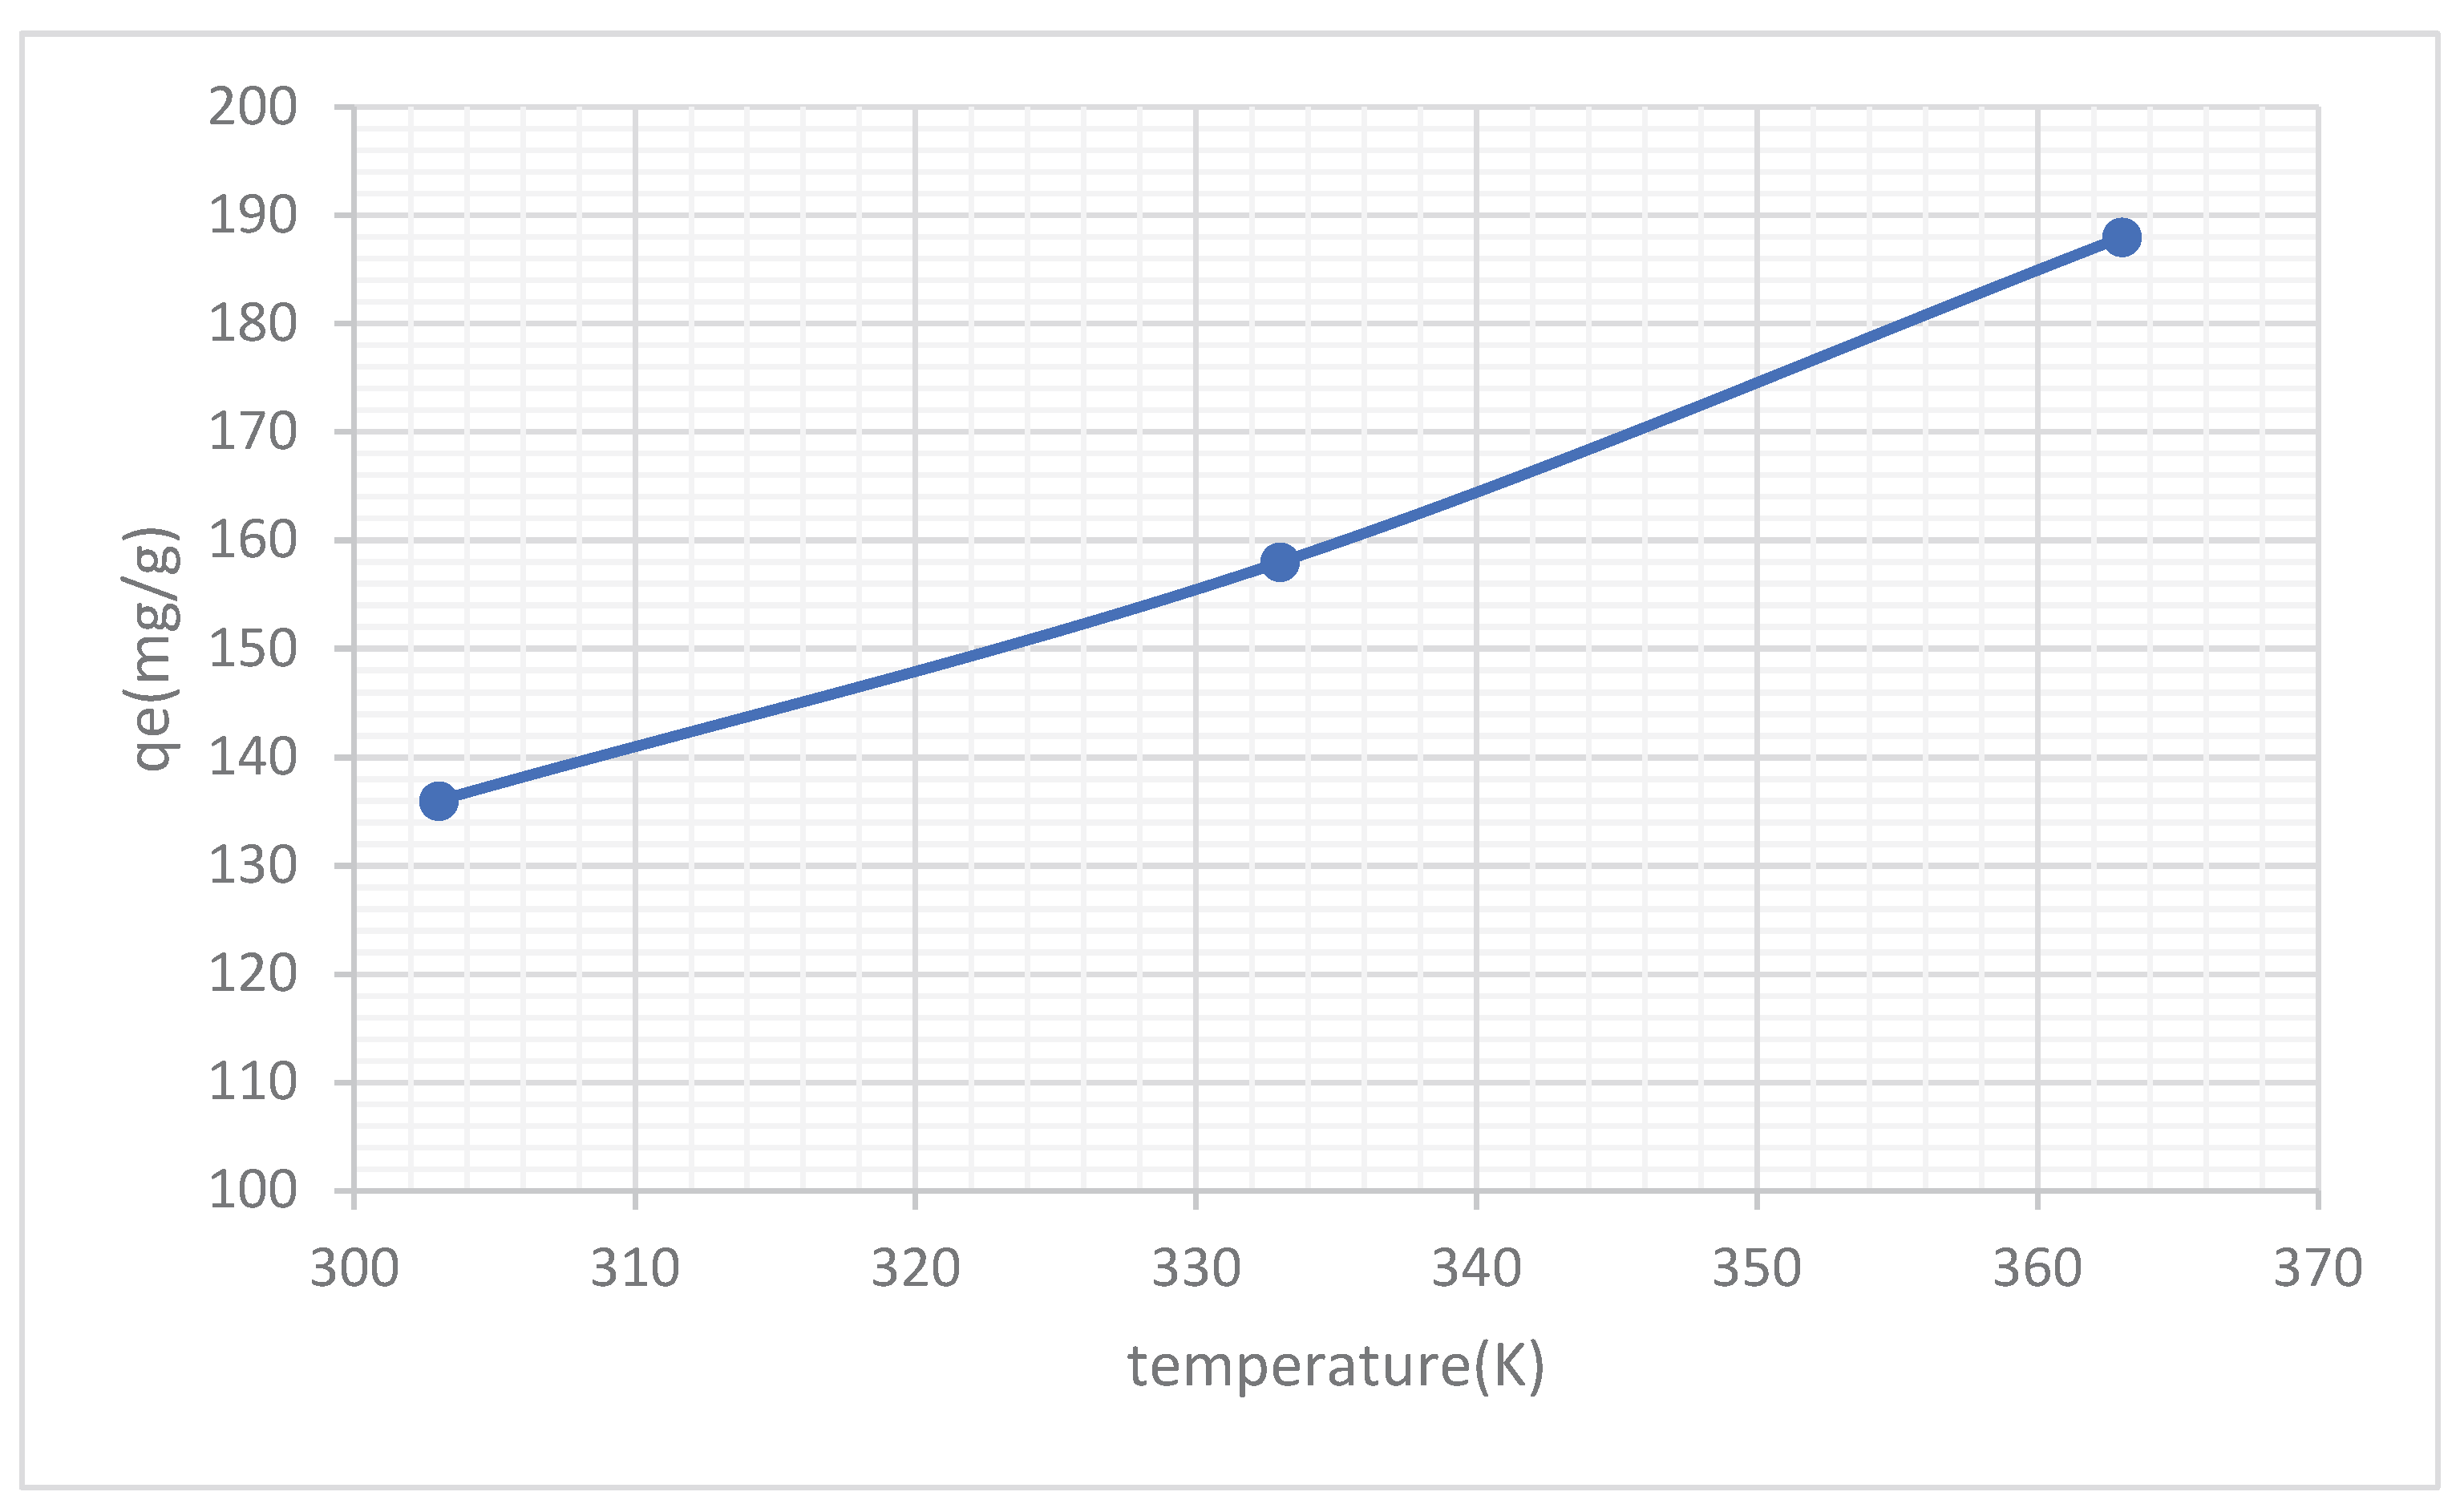
Figure 18.
a) Henry Adsorption Isotherm b) Freundlich adsorption isotherm c) Temkin adsorption Isotherm.
Figure 18.
a) Henry Adsorption Isotherm b) Freundlich adsorption isotherm c) Temkin adsorption Isotherm.
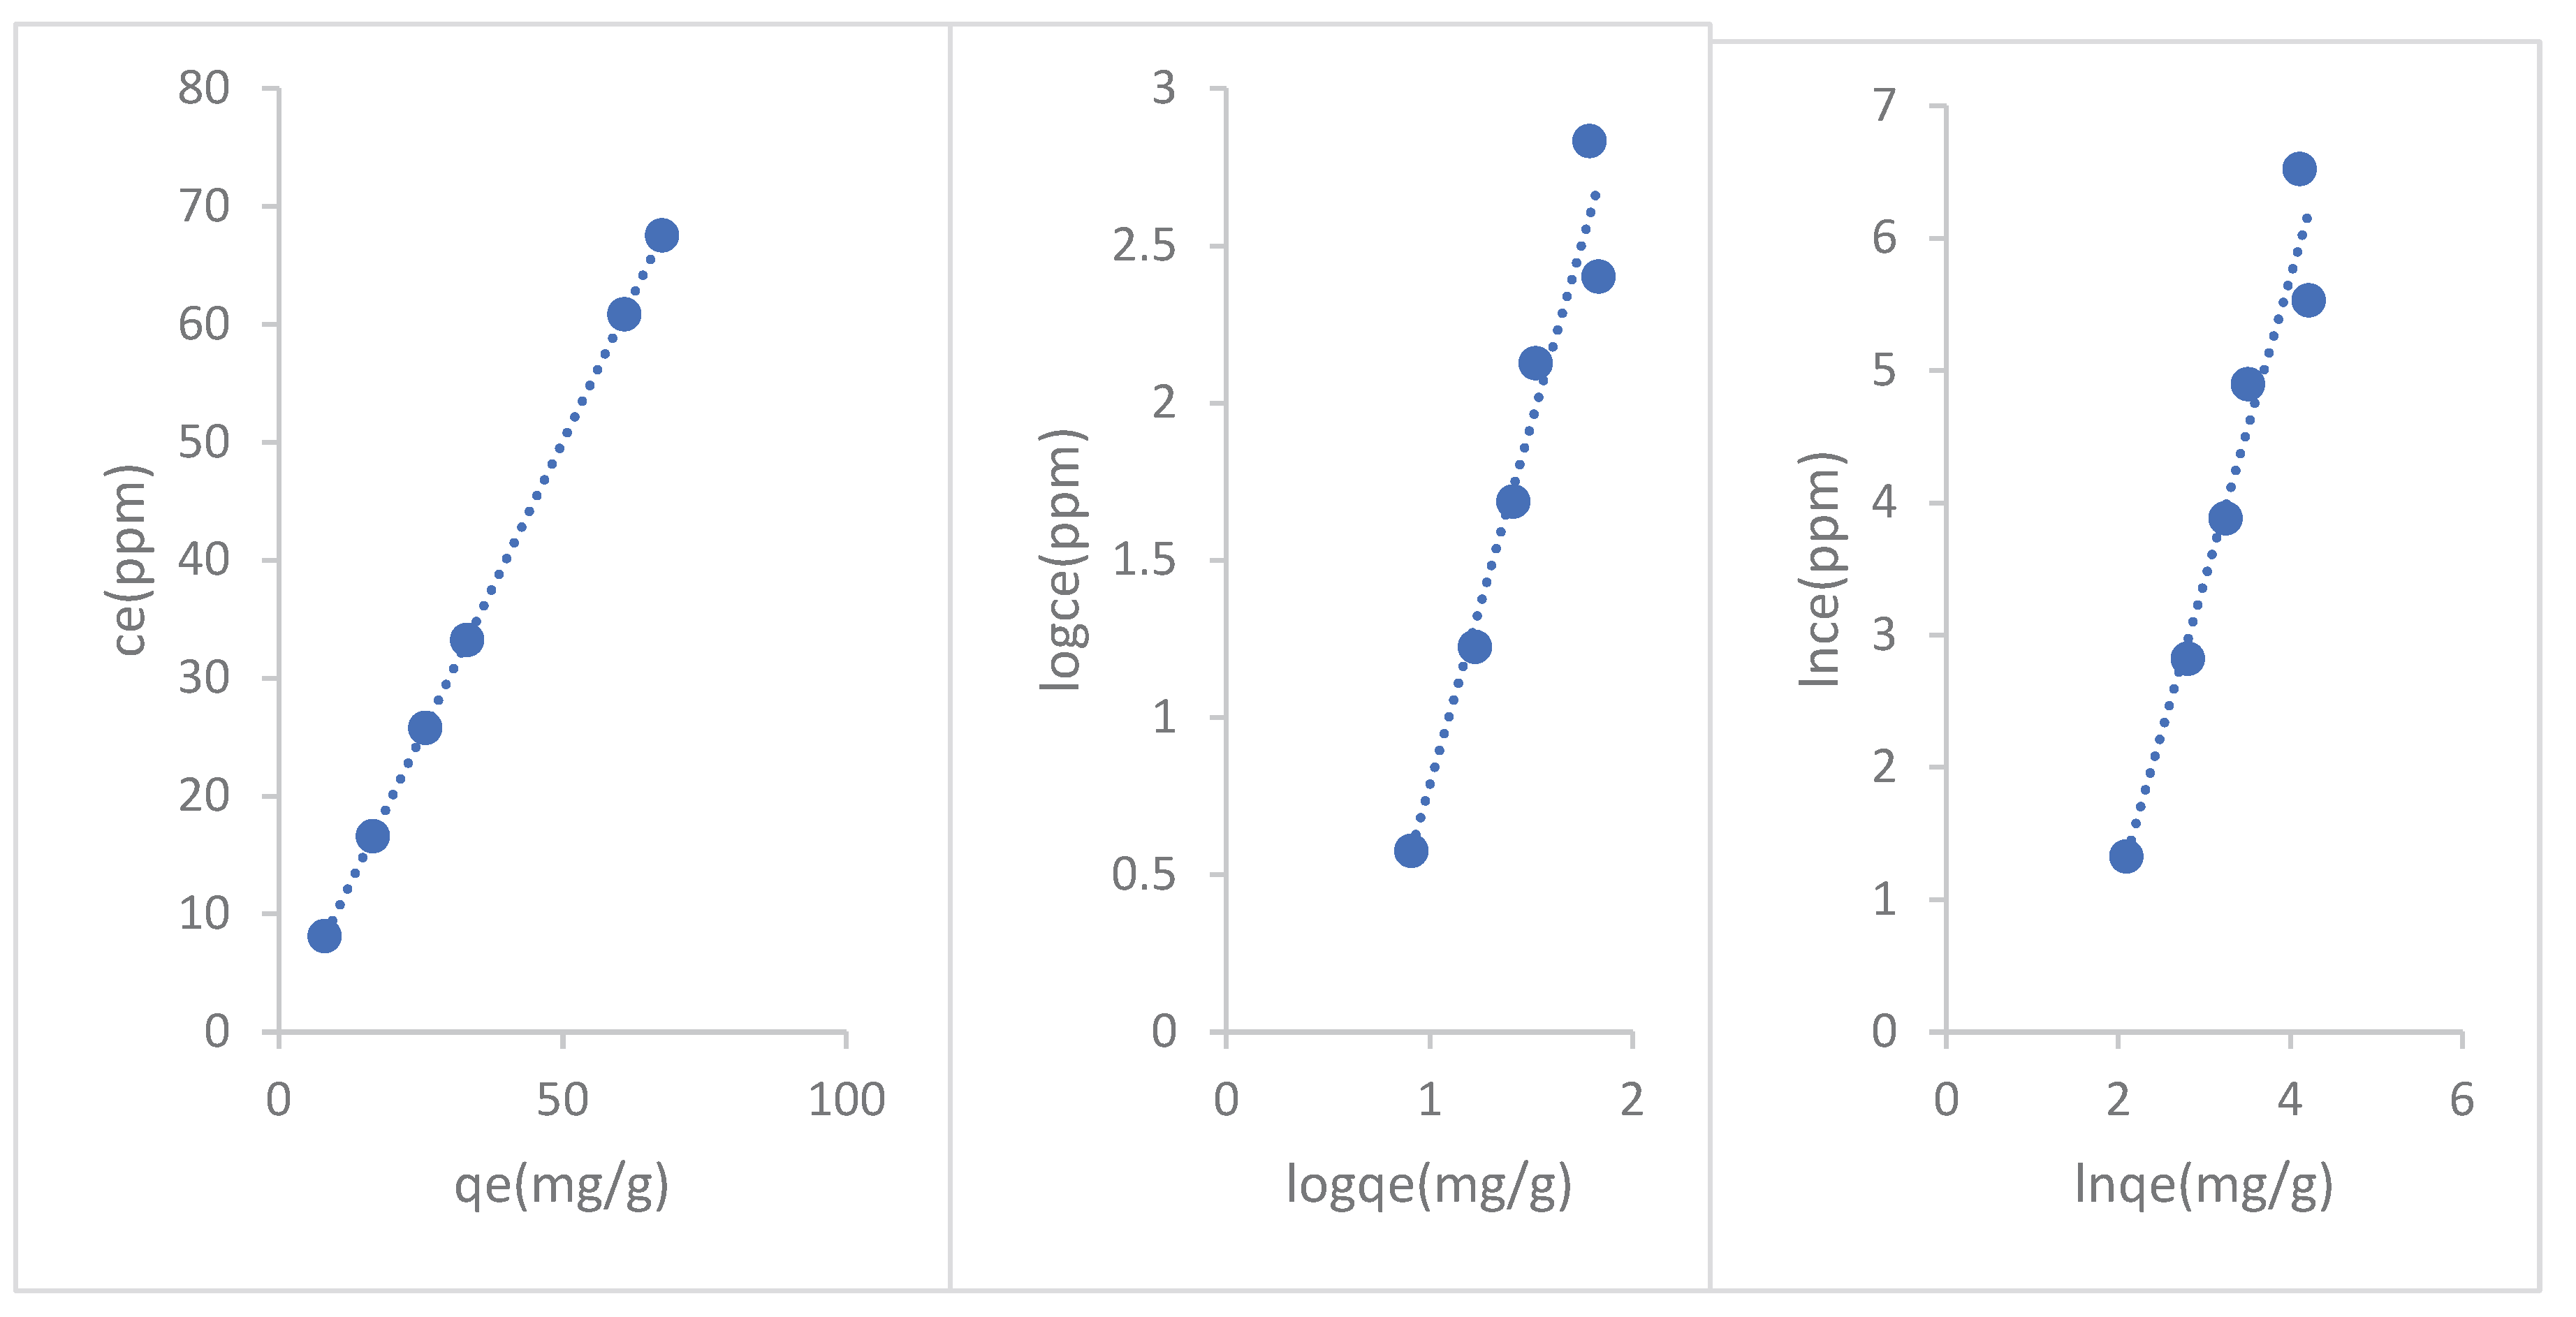
Figure 19.
a) Pseudo second order b) Pseudo first -order plot of Cu (II) adsorption by GT-AgNPs.
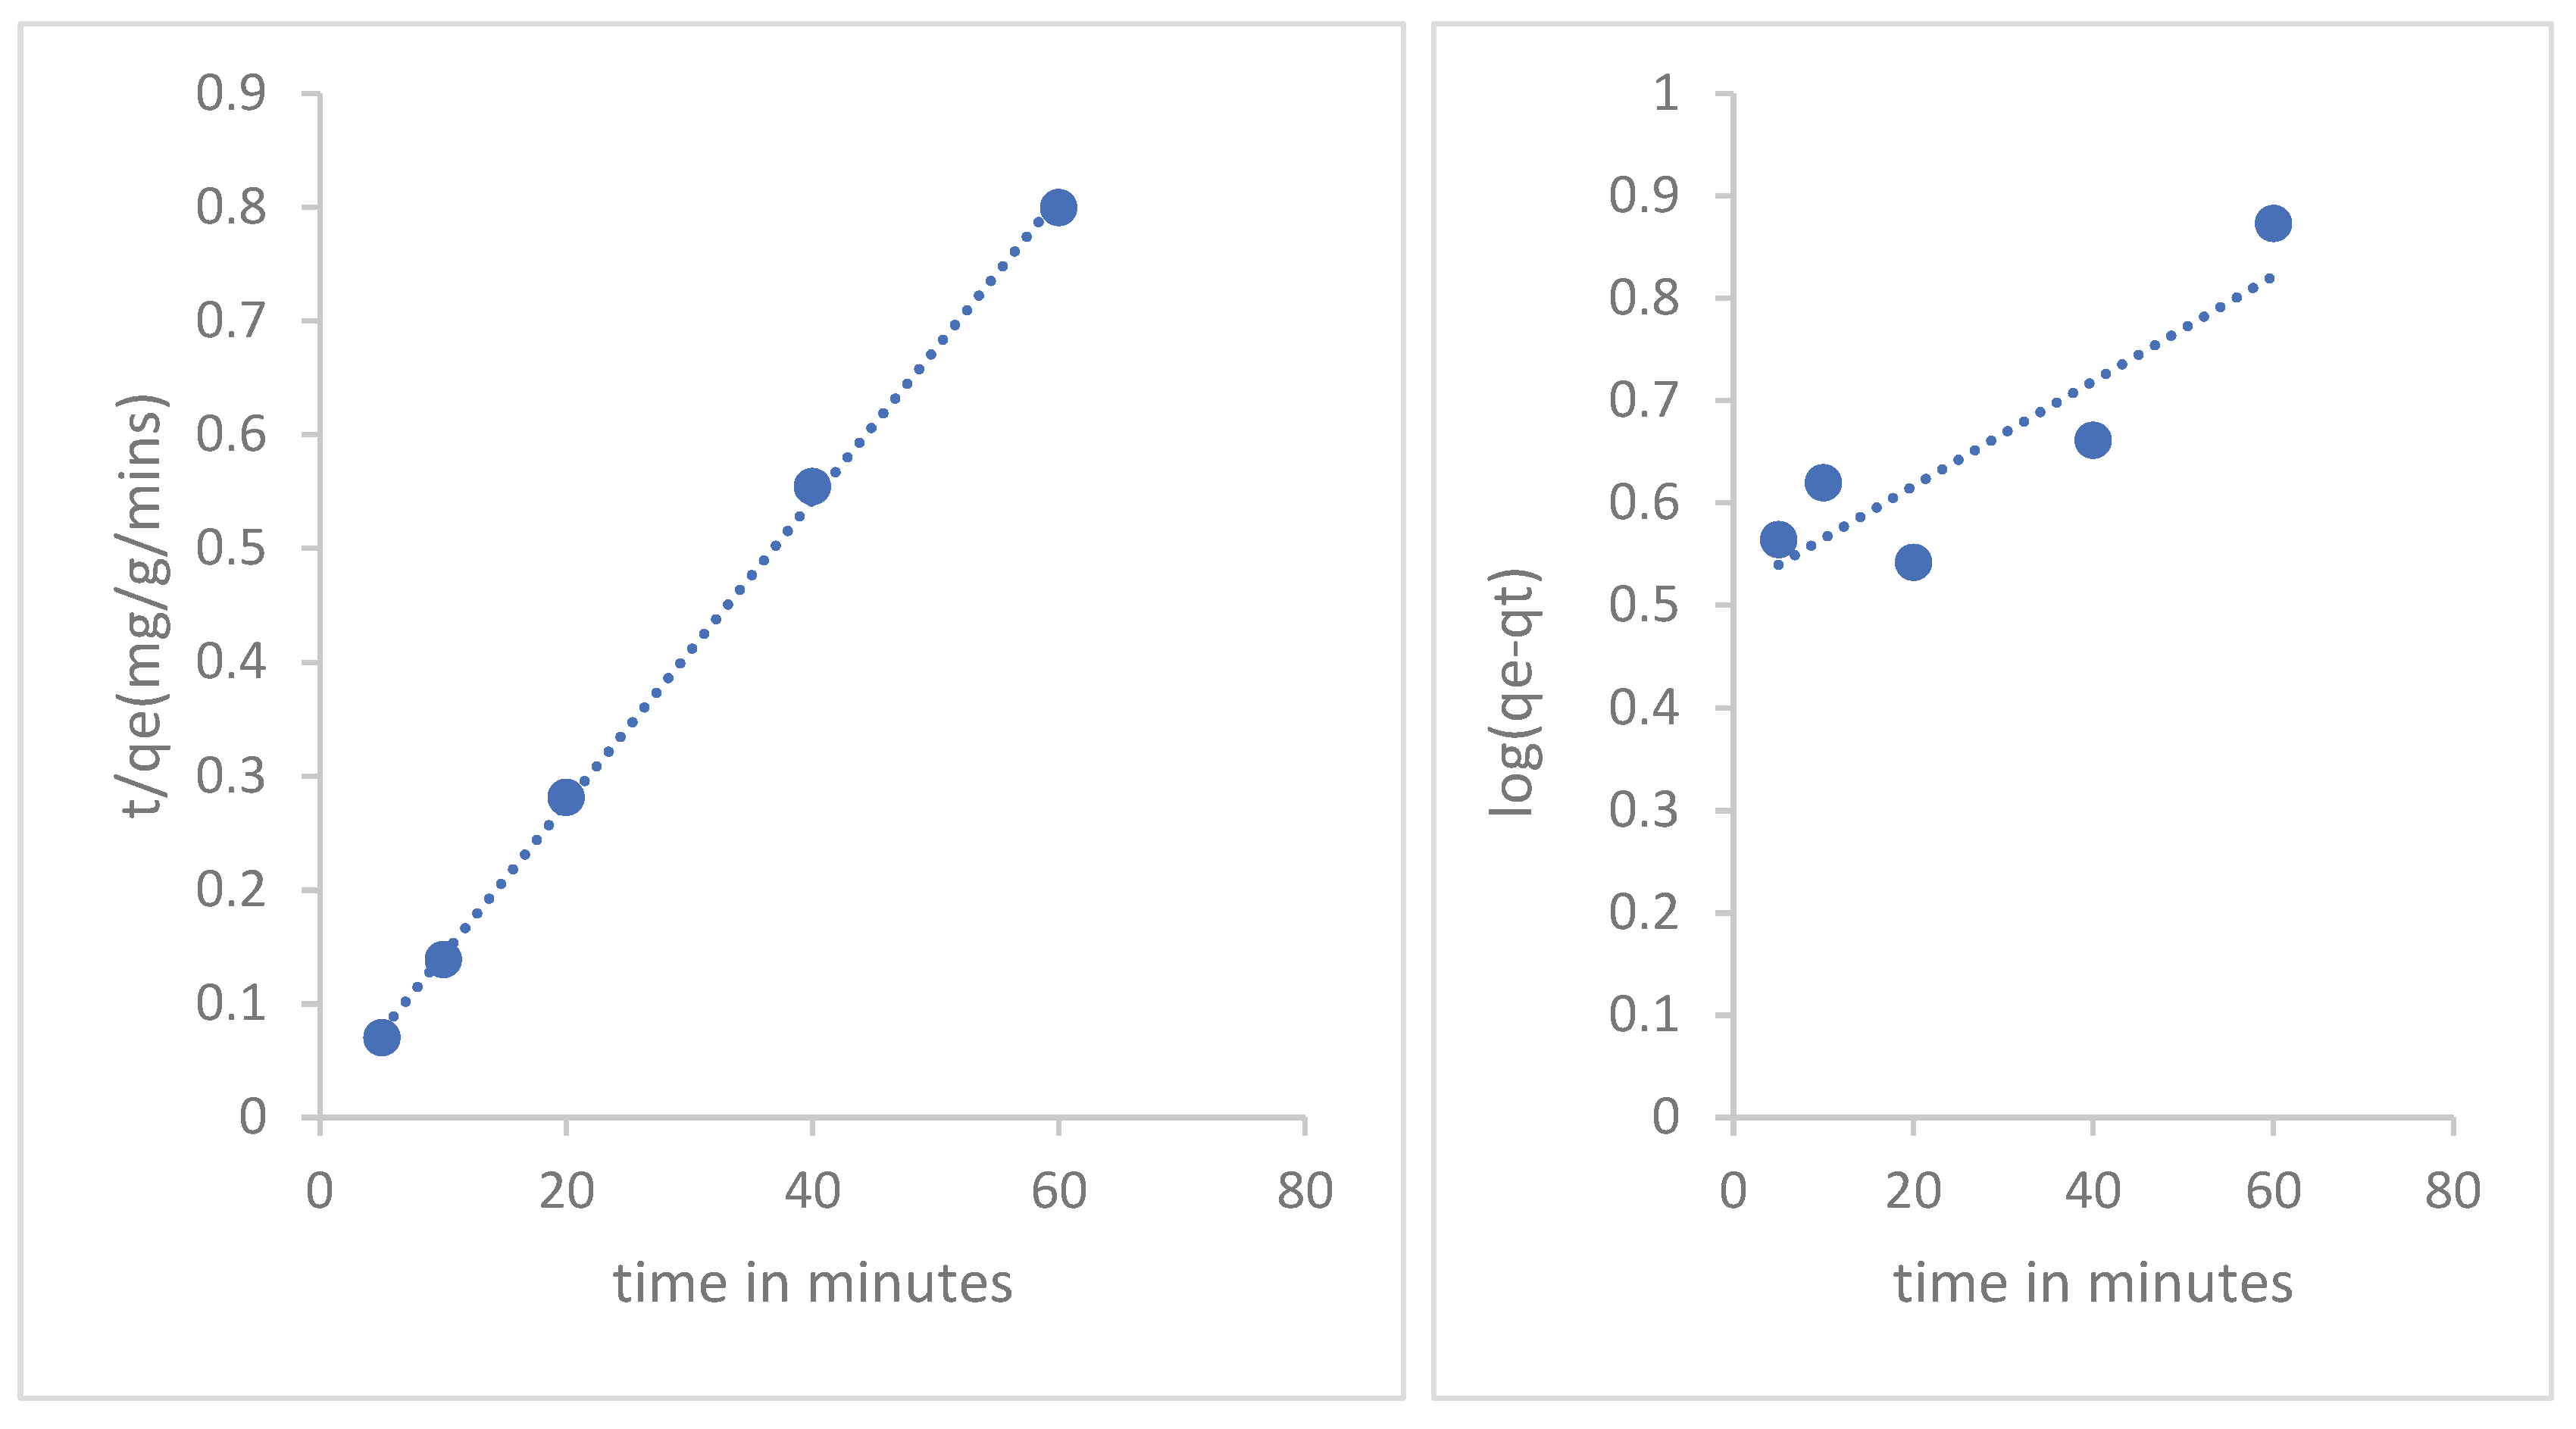
Figure 20.
adsorption thermodynamics of Cu (II) adsorption by GT-AgNPs.
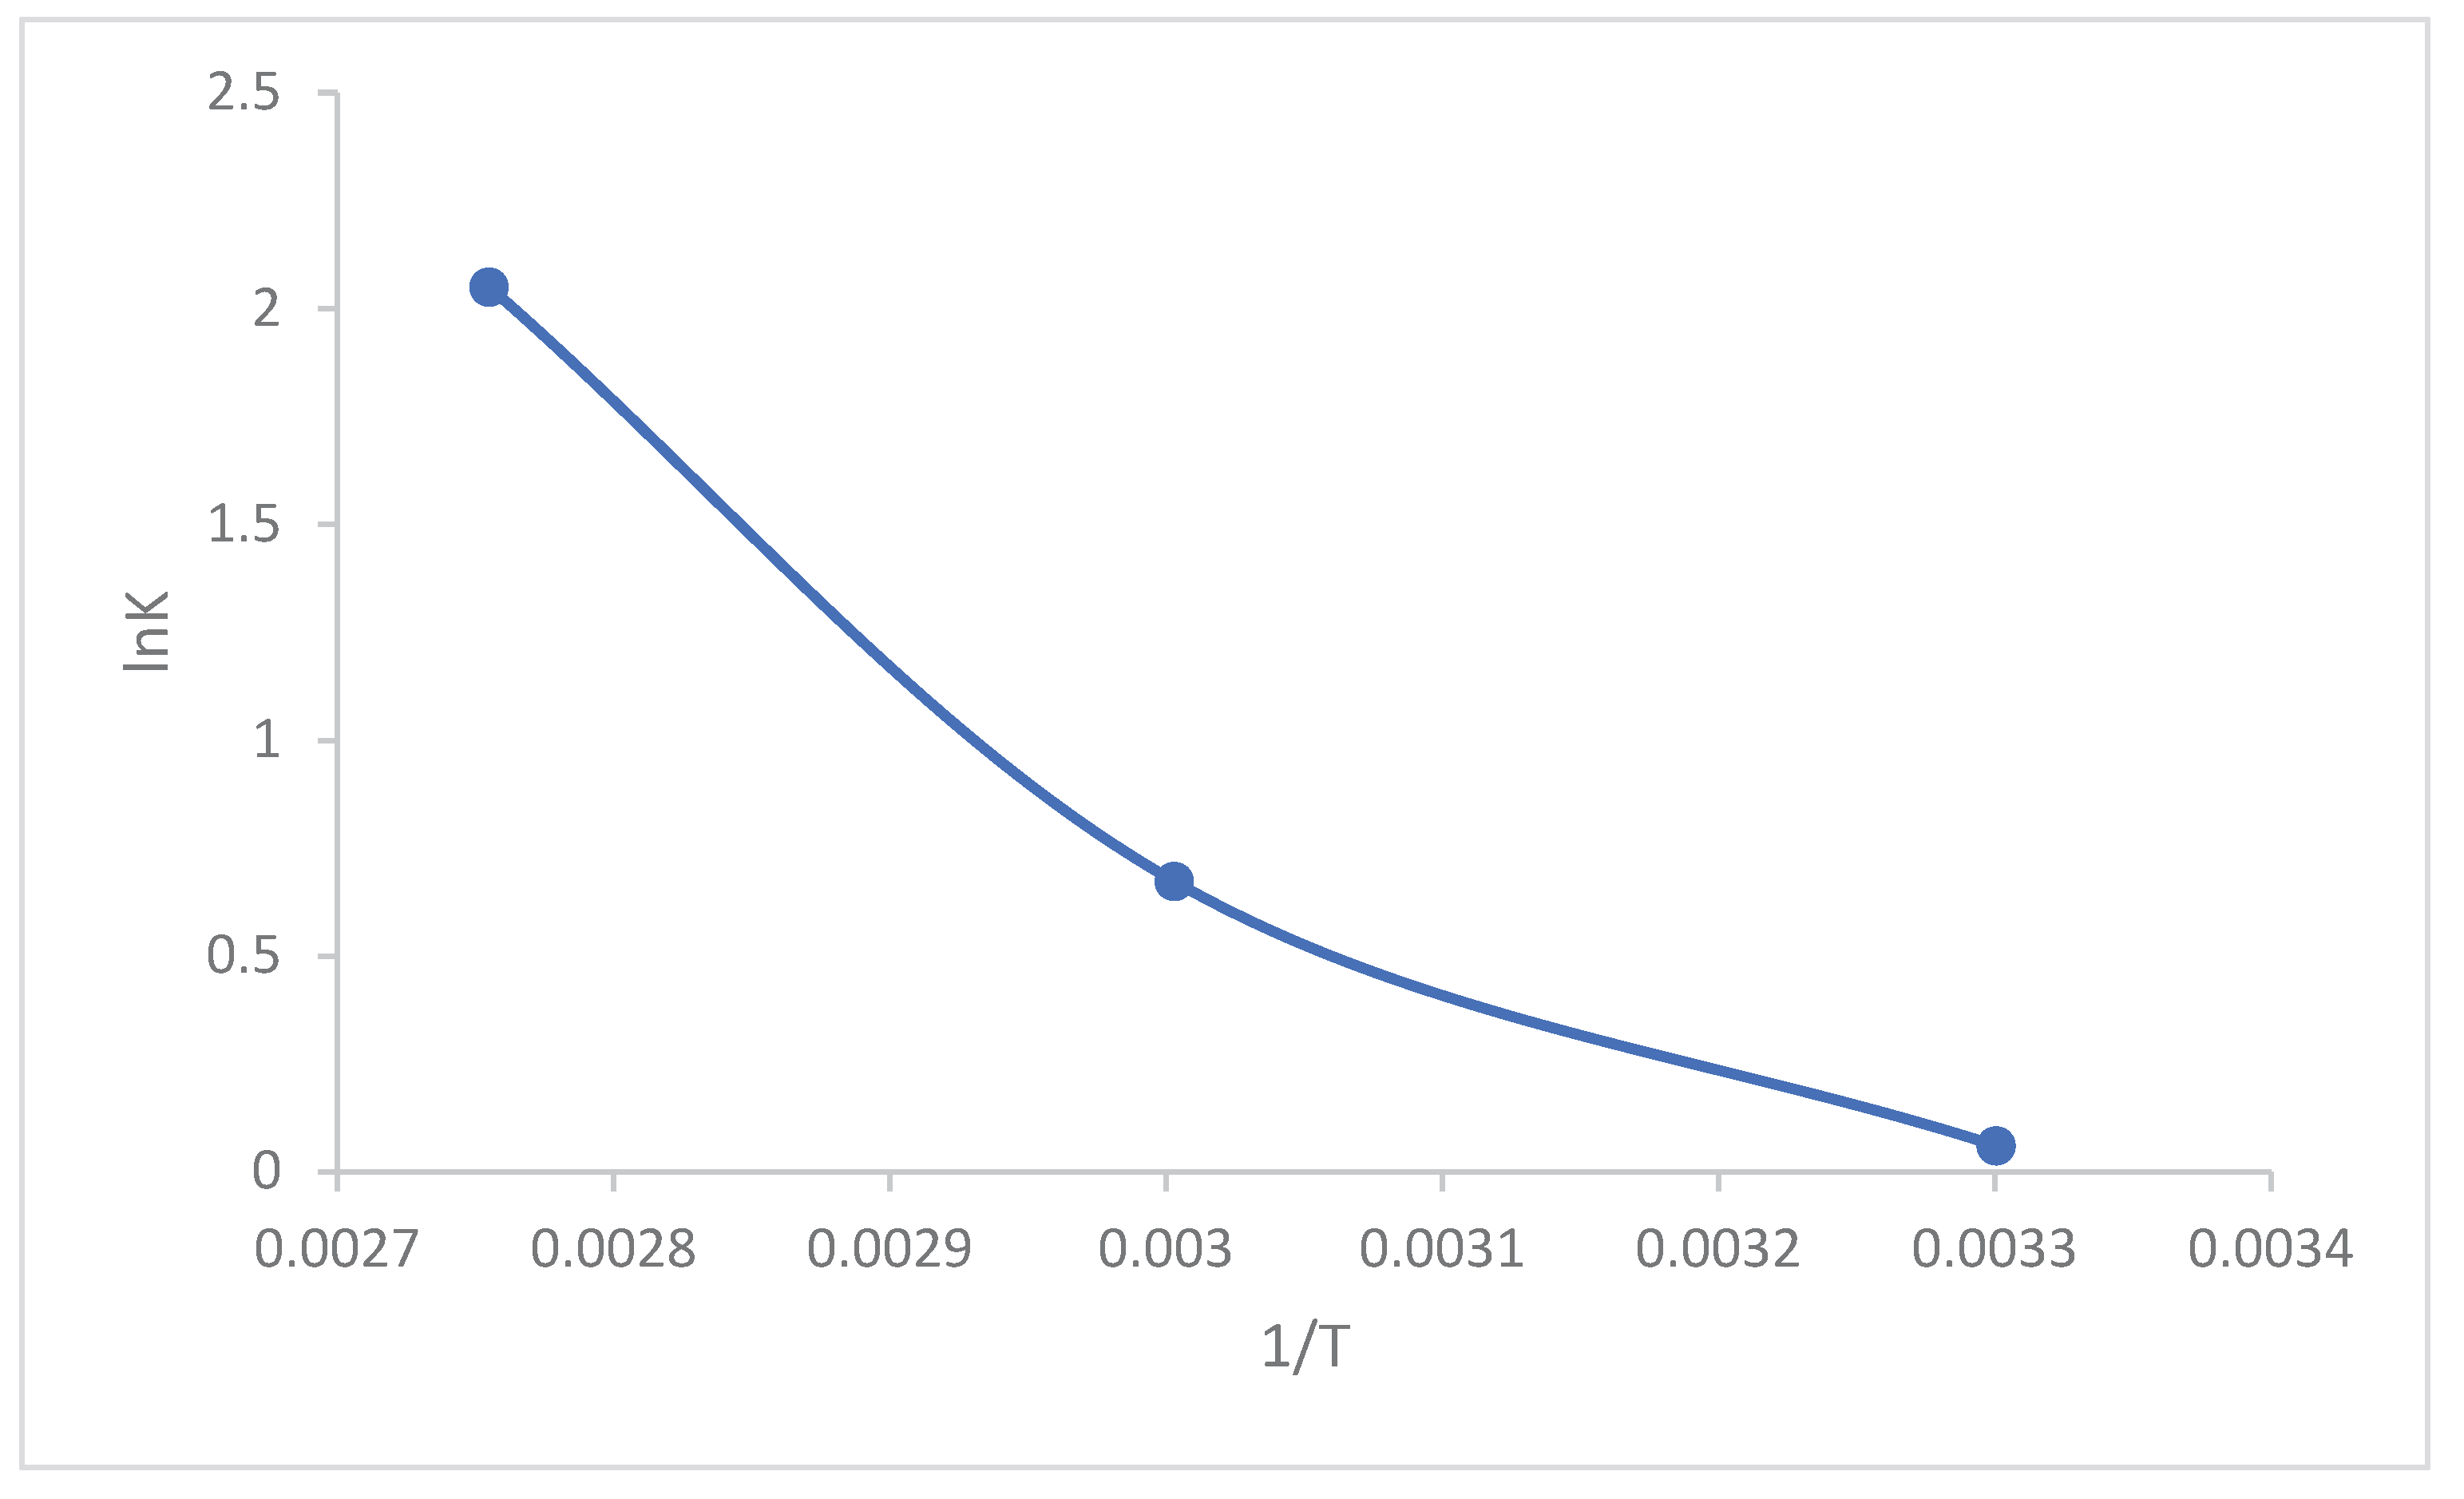

Table 1.
Microanalysis of GT-AgNPs and GT-AuNPs.
| Analysis | Remainder (%) | %C | %H | %N |
|---|---|---|---|---|
| GT-extracts | 53.13 | 42.21 | 4.66 | 0 |
| GT-AgNPs | 84 | 13.85 | 1.2 | 0.65 |
| GT-AuNPs | 66.56 | 29.4 | 2.82 | 1.22 |
Table 2.
Adsorption Isotherm R2 of adsorption of Cu (II) by GT-AgNPs.
| Adsorption isotherm | Langmuir isotherm | Henry Isotherm | Temkin isotherm | D-R isotherm | Freundlich Isotherm |
|---|---|---|---|---|---|
| Cu (II) | 0.5448 | 0.999 | 0.9498 | 0.6011 | 0.9498 |
Disclaimer/Publisher’s Note: The statements, opinions and data contained in all publications are solely those of the individual author(s) and contributor(s) and not of MDPI and/or the editor(s). MDPI and/or the editor(s) disclaim responsibility for any injury to people or property resulting from any ideas, methods, instructions or products referred to in the content. |
© 2026 by the authors. Licensee MDPI, Basel, Switzerland. This article is an open access article distributed under the terms and conditions of the Creative Commons Attribution (CC BY) license (http://creativecommons.org/licenses/by/4.0/).
Copyright: This open access article is published under a Creative Commons CC BY 4.0 license, which permit the free download, distribution, and reuse, provided that the author and preprint are cited in any reuse.


