

Submitted:
14 June 2026
Posted:
16 June 2026
You are already at the latest version
Abstract
The Asian green mussel Perna viridis is expanding across coastal systems of the Americas, creating demand for curated molecular references to support biosecurity, aquaculture monitoring, and comparative invasion studies. Here, we report the first complete mitochondrial genomes of invasive P. viridis from Brazil and the southwestern Atlantic, generated from two specimens collected in Santa Catarina, at the current southern Brazilian invasion front. Long-range PCR, Oxford Nanopore sequencing, read-supported assembly, manual annotation, comparative mitogenomics, nucleotide-diversity analysis, protein-level divergence, and phylogenomic inference were used to generate and evaluate complete mitochondrial references. The two circular assemblies were 16,015 bp and 16,011 bp and contained 38 annotated features, including 13 protein-coding genes, 23 tRNAs, and two rRNAs, all on the H strand, with an identical A+T content of 67.5%. Pairwise comparisons among complete P. viridis mitogenomes showed high overall similarity but retained 20-125 SNPs/mismatches and one to 12 indel events. Gene order was conserved within P. viridis but differed from P. canaliculus and P. perna, and phylogenomics placed the Brazilian assemblies within the P. viridis clade. These curated mitogenomes establish a genomic baseline for molecular surveillance and future invasion-focused studies of P. viridis in the southwestern Atlantic.
Keywords:
Mytilidae
; Oxford Nanopore sequencing
; comparative mitogenomics
; gene order
; molecular surveillance
; marine biosecurity
; aquaculture monitoring
1. Introduction
Biological invasions are a major driver of global environmental change, reshaping biodiversity patterns, community structure, ecosystem functioning, and biogeographic boundaries across aquatic and terrestrial systems [1,2]. In coastal environments, non-indigenous species are strongly facilitated by human-mediated connectivity, including maritime transport, port infrastructure, aquaculture, ballast water, hull fouling, artificial substrates, and recurrent vessel movement among regions [1,3]. Once established, aquatic invasive alien species can modify native communities, disrupt trophic and functional interactions, affect ecosystem services, and impose substantial costs on fisheries, aquaculture, infrastructure, conservation, and coastal management [4]. Because coastal invasions are often detected only after local establishment, accurate taxonomic identification and molecular surveillance have become increasingly important for marine biosecurity and monitoring [3,5,6].
Mytilid mussels are among the most successful marine invaders because their sessile, filter-feeding habit is coupled with efficient substrate colonization, strong byssal attachment, high local biomass, and the capacity to form dense aggregations on natural and artificial surfaces [7,8]. Within this group, the Asian green mussel Perna viridis (Linnaeus, 1758), native to tropical and subtropical Asian coastal waters, has expanded beyond its native range and is now established in multiple coastal regions of the Americas [8,9]. Its invasive performance has been associated with rapid biomass accumulation, tolerance to environmental variation, and frequent occupation of ports, marinas, aquaculture structures, piers, and other submerged anthropogenic substrates [8,9,10,11]. These attributes increase the potential for competition with native and cultivated bivalves, biofouling of coastal infrastructure, contaminant accumulation, and broader ecological and economic impacts in invaded systems [9,12].
In Brazil, P. viridis was first reported in Guanabara Bay, Rio de Janeiro, in 2018, representing the first documented occurrence of the species in the southwestern Atlantic [13]. Subsequent records from Rio de Janeiro, including Arraial do Cabo and additional sites in Guanabara Bay, together with more recent confirmations in São Paulo, Paraná, and Santa Catarina, indicate that the species is expanding along the Brazilian coast rather than remaining restricted to an isolated introduction event [9,14,15,16,17,18,19,20]. This expansion is particularly relevant in southern Brazil, where Santa Catarina represents the currently documented southern invasion front and includes one of the country’s most important mollusk-farming regions. The confirmation of P. viridis in the Itapocoroy Bay farming area is therefore especially significant, because it places the invader in a sector where biofouling pressure, aquaculture activities, and potential interactions with the cultivated mussel Perna perna may converge [19]. Together, these records reinforce the need for integrated taxonomic, ecological, and molecular monitoring of P. viridis along the Brazilian coast.
Molecular confirmation of Brazilian records has relied predominantly on morphology plus partial mitochondrial cytochrome c oxidase subunit I (COI) sequences [9,15,19,20]. COI barcoding remains indispensable for species-level identification, especially when juvenile or fouling specimens are difficult to distinguish morphologically or when closely related mytilids co-occur [19,20,21]. However, a single barcode fragment captures only a limited portion of mitochondrial variation, and marker choice can influence downstream biogeographic interpretation [22]. By itself, COI does not resolve genome architecture, gene order, annotation boundaries, strand distribution, or the location of more variable regions across the mitochondrial genome [23].
Complete mitogenomes therefore offer a broader molecular framework for invasive-range studies of P. viridis. Beyond taxonomic confirmation, they enable comparisons of gene content and order, coding-region boundaries, codon usage, intergenic organization, and spatially heterogeneous variation across the mitochondrial genome, while also improving datasets for phylogenomic placement, marker selection, and future surveillance applications [5,23,24]. Such information is particularly relevant in Mytilidae, where mitochondrial organization can vary substantially among lineages and careful annotation is required for reliable comparative inference [23,24,25].
Despite this value, public mitogenomic resources for Perna remain sparse. A curated NCBI survey recovered only 15 complete records for the genus and only two non-redundant mitogenomes assigned to P. viridis, indicating that the comparative framework currently available for the species is still narrow. This limitation is important because congeneric Perna mitogenomes can differ in organization and annotation, making new complete and carefully curated references from invaded regions necessary for consistent comparison [24,26,27].
In this study, we report the first complete mitochondrial genomes of P. viridis from Brazil, generated from two invasive specimens collected in Santa Catarina. By characterizing their mitogenome architecture and comparing them with the complete Perna mitogenomes currently available in public databases, we aim to establish a curated baseline for molecular monitoring and future comparative studies of P. viridis in the southwestern Atlantic. Given the still-limited mitogenomic sampling available for the species, our objective is not to infer geographic origin, invasion routes, or population structure, but to provide a reference framework for subsequent work on marker development, broader phylogeographic comparison, and population-level investigation.
2. Materials and Methods
2.1. Sample Collection, DNA Extraction, and Long-Range PCR
Muscle tissue from two P. viridis specimens collected in Florianópolis, Santa Catarina, Brazil, in 2025 was used for complete mitochondrial genome sequencing. The specimens were registered as LGM-781 and LGM-885 and originated from two coastal locations in Florianópolis: 27°30′31.0″S, 48°31′10.1″W and 27°44′41.95″S, 48°33′44.31″W, respectively [20]. Approximately 25 mg of muscle tissue from each specimen was used for DNA extraction. Total DNA was extracted using the DNeasy Blood & Tissue Kit (Qiagen, Germany), following the manufacturer’s protocol, and quantified by spectrophotometry at 260/280 nm using a Tecan Infinite M200 microplate reader (Tecan, Switzerland). Only DNA with A260/280 values between 1.8 and 2.0 and a minimum concentration of 20 ng/µL was used for downstream steps.
To obtain a complete mitogenome, the available P. viridis mitochondrial reference sequence (NC_018362.1 [26]) was used to guide the design of two overlapping long-range PCR targets. Primer pairs were developed by the authors using an in-house Python script based on Primer3-assisted primer design [28] and subsequent manual inspection of candidate pairs. The selected primers targeted two mitochondrial fragments centered on the ND4 and ND5 regions, respectively, and were chosen to provide broad mitogenome coverage while maintaining suitable oligonucleotide length, melting temperature, GC content, and low predicted primer-dimer formation. UGENE (v49.1 [29]) was used to visualize primer placement along with the reference sequence. Primer sequences are provided in Table 1. Sample-identifying 5-nt barcodes designed in-house were appended to the 5′ ends of primers to enable multiplex sequencing and post-run demultiplexing.
Long-range PCRs were performed in 25 µL reactions containing 4 µL of DNA template (50 ng), 1× buffer (Thermo Fisher Scientific, USA), 0.2 mM dNTPs (Promega, USA), 0.5 µM of each primer, and 0.25 U of Platinum™ SuperFi II DNA Polymerase (Thermo Fisher Scientific, USA). Thermal cycling was performed on a Kasvi thermocycler (model K33-10TG, Kasvi, Brazil) using the following program: initial denaturation at 98 °C for 50 s; 35 cycles of 98 °C for 15 s, 57 °C for 35 s, and 72 °C for 5 min 30 s; followed by a final extension at 72 °C for 12 min. Amplicons were checked by electrophoresis in 0.8% agarose gel prepared in 1× TAE, using a λ DNA/HindIII molecular marker (Thermo Fisher Scientific, USA), and visualized under UV; gels were documented using EOS Utility (Canon, Japan).

Table 1.
Long-range PCR primers used for two-amplicon amplification of the Perna viridis mitochondrial genome. Both specimens were amplified using the same primer pairs. Primer sequences are reported in the 5′→3′ orientation.
Table 1.
Long-range PCR primers used for two-amplicon amplification of the Perna viridis mitochondrial genome. Both specimens were amplified using the same primer pairs. Primer sequences are reported in the 5′→3′ orientation.
| Amplicon | Primer name | Direction | Sequence (5′→3′) |
|---|---|---|---|
| mtDNA Frag-1 | Pvir_mtDNA_Frag1_F | Forward | GTGTATCAGTTCAAGTGTGTGG |
| mtDNA Frag-1 | Pvir_mtDNA_Frag1_R | Reverse | AACCTCCTGCAACCATAATCTC |
| mtDNA Frag-2 | Pvir_mtDNA_Frag2_F | Forward | TAGTTGAATCGTGGAGGAAGTC |
| mtDNA Frag-2 | Pvir_mtDNA_Frag2_R | Reverse | CACACACCTACAATTAATGGCC |
2.2. Oxford Nanopore Sequencing, Reading Processing, and Mitogenome Assembly
Long-range PCR amplicons were purified using the Wizard® SV Gel and PCR Clean-Up System (Promega, USA) and prepared for Oxford Nanopore sequencing using the Ligation Sequencing Kit SQK-LSK114 (Oxford Nanopore Technologies, UK). End-repair of DNA fragments was performed using enzymes from the Companion Module for Oxford Nanopore Technologies® Ligation Sequencing (New England Biolabs, USA), according to the manufacturer’s protocols. Libraries were loaded onto Flongle flow cells (FLO-FLG114, Oxford Nanopore Technologies, UK) and sequenced on a MinION device (Mk1B, Oxford Nanopore Technologies, UK) running MinKNOW (v25.03.9, Oxford Nanopore Technologies, UK). Basecalling was performed with Dorado (Oxford Nanopore Technologies, UK) in super-accurate mode, applying a minimum read quality threshold of Q ≥ 8, and generating FASTQ files.
FASTQ reads were processed using a custom Python script to demultiplex barcoded libraries based on 5-nt tags appended to the 5′ ends of the amplification primers. Reads were clustered using CD-HIT v4.8.1 [30], aligned with MAFFT v7.520 [31], and consensus sequences were generated using EMBOSS v6.6.0.0 [32].
For each P. viridis specimen, the highest-supported consensus sequence from each mitochondrial fragment was selected for final assembly, resulting in two long-amplicon consensuses per specimen. These consensuses were processed using an in-house Python workflow that identified terminal overlaps using a minimum overlap of 300 bp, ≥95% identity, and ≥50% comparable bases. Fragments were merged by majority rule, with ambiguous positions assigned as N when base support was insufficient. Conflicts in overlapping regions were resolved using the original long reads through a seed-based search with reverse-complement matching, a 15-bp flank, 13-bp seed size, maximum mismatch threshold of 18%, and up to 500 supporting reads per position. The merged assemblies were then compared with available P. viridis mitochondrial references from NCBI using minimum thresholds of 95% identity and 95% coverage. Redundant terminal overlap generated during linear assembly of the circular mitogenome was trimmed using the same overlap criteria, and the curated sequences were retained as complete mitochondrial genome assemblies for downstream analyses.
2.3. Mitogenome Annotation, Diversity Metrics, and Phylogenetic Analysis
Complete mitogenome consensus sequences were validated by similarity searches using BLASTn (NCBI) against the NCBI Core nucleotide database to confirm taxonomic identity [33]. Pairwise comparisons among complete P. viridis mitogenomes were performed with an in-house Python script, calculating identity from comparable A/C/G/T sites and recording SNPs/mismatches and consecutive-gap indel events. Mitogenomes were annotated through reference-assisted nucleotide-level comparison with the P. viridis RefSeq mitogenome NC_018362.1, followed by manual curation of gene boundaries and coding regions; coding sequences were checked using the invertebrate mitochondrial genetic code (translation Table 5). Gene features were extracted to generate annotation tables including gene name, coordinates, length, and strand, covering protein-coding genes, tRNAs, rRNAs, and non-coding regions when present. Circular genome representations were generated with the MitoDraw module of MitoFish [34]. Gene-order organization was represented schematically from GenBank (GBK) annotations by structuring CDS, tRNA, and rRNA features as comparative blocks [24].
Relative synonymous codon usage (RSCU) was computed from the extracted protein-coding genes in PhyloSuite v1.2.3 [35,36,37]. For each mitochondrial protein-coding gene, amino acid sequences were extracted from the complete Perna mitogenomes in the comparative dataset (Supplementary Table S1), aligned separately, and used to calculate mean pairwise amino acid divergence across comparable positions. Genome-wide nucleotide diversity (π) was estimated from an ATP6-anchored alignment of the complete P. viridis mitogenomes analyzed in this study. Sequences were aligned with Clustal Omega (DNA mode; --auto) [38], and sliding-window π was computed with a custom Python script (window = 500 bp; step = 25 bp). For each window, π was calculated from pairwise differences per site after excluding alignment columns with >50% gaps and retaining only positions with valid DNA calls (A/C/G/T) in at least 50% of sequences.
For phylogenetic placement, the 13 mitochondrial protein-coding genes were extracted from each GBK file, concatenated, and aligned for all mitogenomes listed in Supplementary Table S1, using Mytilus galloprovincialis as the outgroup. Phylogenetic inference was performed in MEGA11 v11.0.3 under Maximum Likelihood after model selection [39], using the General Time Reversible model with Gamma-distributed rates plus invariant sites (G+I; five categories); nodal support was evaluated with 1,000 bootstrap replicates [40], and positions containing gaps or missing data were excluded by complete deletion, yielding a final dataset of 15 sequences and 10,767 positions.
2.4. Use of Artificial Intelligence Tools
Artificial intelligence tools (ChatGPT, GPT-5.5 Thinking, OpenAI) were used during manuscript preparation to assist with translation, English-language refinement, editorial organization, and text revision. No artificial intelligence tool was used to generate, alter, or manipulate the original research data, results, analyses, or figures. All content was reviewed and verified by the authors, who take full responsibility for the final manuscript.
3. Results
3.1. Sampling Sites Within the American Invasion Context
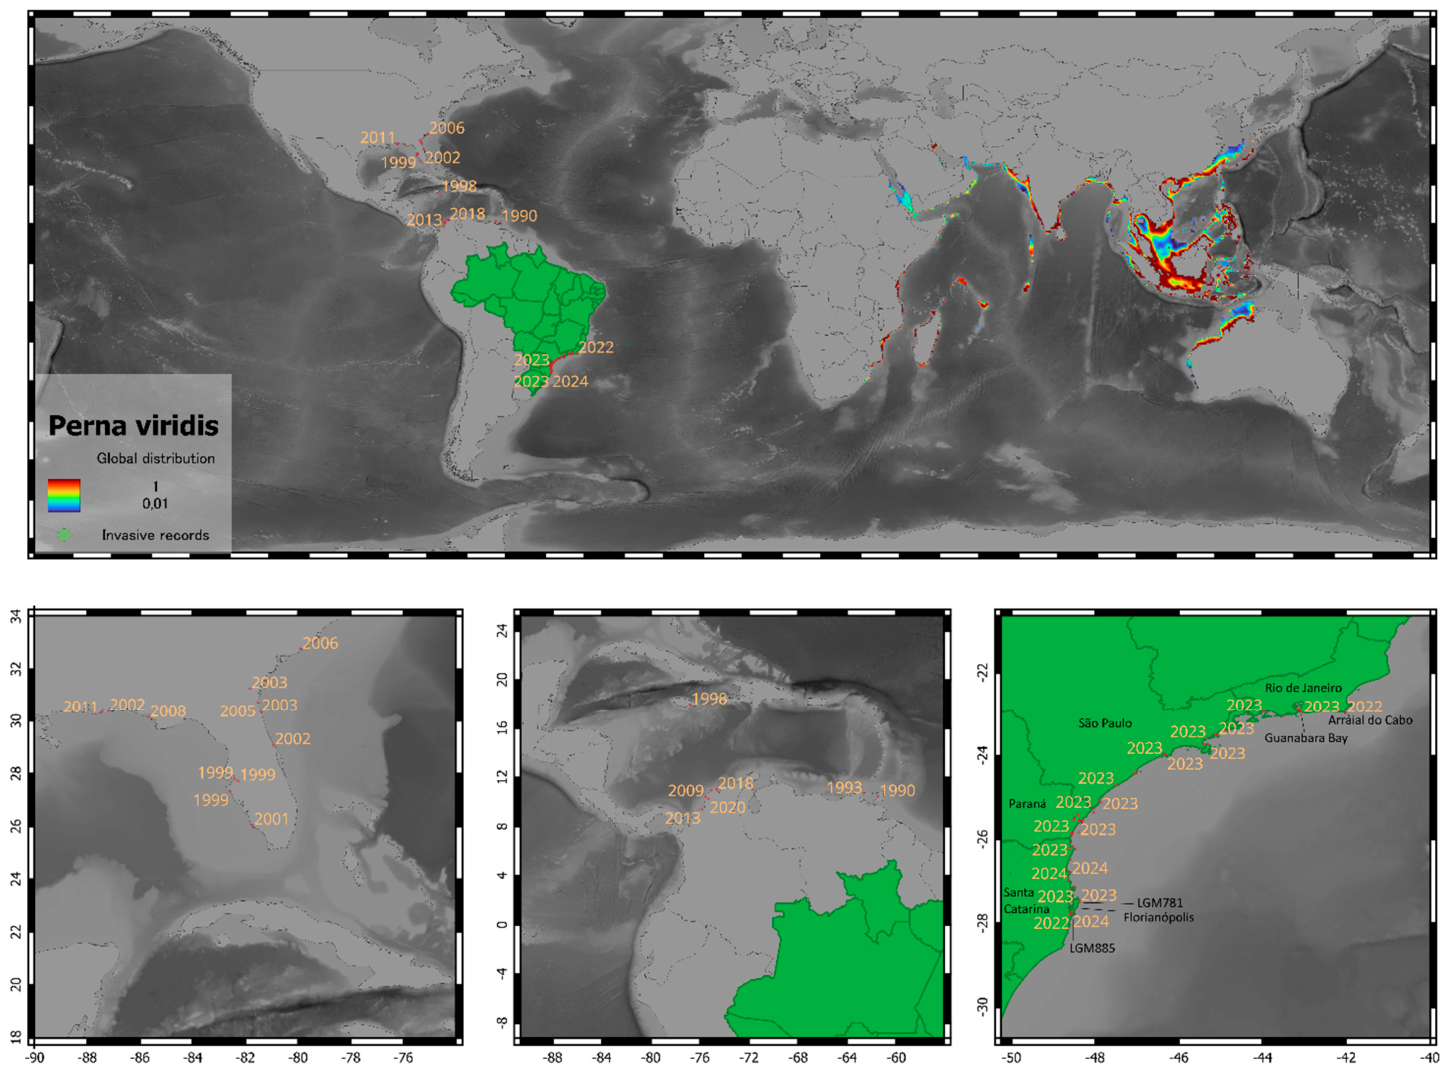
The curated occurrence matrix used to construct Figure 1 included 84 mapped non-native records of P. viridis in the Americas, retained after taxonomic and bibliographic screening of sources available up to May 2026, with occurrence years ranging from 1990 to 2024. Sources and mapped locations are summarized in Supplementary Table S2. The records indicate a broad but discontinuous western Atlantic distribution, with early occurrences in the Caribbean followed by detections along the southeastern United States and Colombian Caribbean, consistent with a regional invasion history shaped by human-mediated coastal connectivity [12,41,42,43,44,45,46,47].
Brazilian records constituted the largest subset of the curated matrix, with 64 mapped occurrences along the southeastern and southern coast. The first Brazilian record was associated with Guanabara Bay, Rio de Janeiro, in 2018, followed by detections in other areas of Rio de Janeiro and, more recently, in São Paulo, Paraná, and Santa Catarina. Most Brazilian records were assigned to 2022-2024, highlighting the recent intensification of documented occurrences along the coastal sector extending from Rio de Janeiro to Santa Catarina [9,14,16,17,18,19,20].
The two specimens sequenced here, LGM-781 and LGM-885, were collected in Florianópolis, Santa Catarina, Brazil, at 27°30′31.0″S, 48°31′10.1″W and 27°44′41.95″S, 48°33′44.31″W, respectively. These sites are within the southern portion of the documented Brazilian invasion range and are of major relevance for mollusk aquaculture and coastal biosecurity. Accordingly, the mitogenomes generated here provide reference data from a monitoring-relevant sector of the invasion front, while the geographic distribution summarized in Figure 1 should be interpreted only as a framework for genomic baseline generation rather than as evidence of source population, invasion route, or number of introduction events.
Figure 1.
Geographic framework of non-native P. viridis occurrence records in the Americas and sampling sites of the Brazilian mitogenomes generated in this study. Red points indicate curated occurrence records retained after taxonomic and bibliographic screening, and labels indicate the year assigned to each record. The upper panel shows the global native/distributional context of P. viridis together with the mapped American records. In contrast, the lower panels provide regional views of North America, Central America/Caribbean, and South America. Brazilian records are concentrated along the southeastern and southern coast, including the Santa Catarina sector from which LGM-781 and LGM-885 were obtained. Coordinates, year-assignment criteria, sources, and confidence notes for all mapped records are provided in Supplementary Table S2. The mapped distribution is intended as a geographic framework for genomic baseline generation and should not be interpreted as evidence of source population, invasion route, or number of introduction events.
Figure 1.
Geographic framework of non-native P. viridis occurrence records in the Americas and sampling sites of the Brazilian mitogenomes generated in this study. Red points indicate curated occurrence records retained after taxonomic and bibliographic screening, and labels indicate the year assigned to each record. The upper panel shows the global native/distributional context of P. viridis together with the mapped American records. In contrast, the lower panels provide regional views of North America, Central America/Caribbean, and South America. Brazilian records are concentrated along the southeastern and southern coast, including the Santa Catarina sector from which LGM-781 and LGM-885 were obtained. Coordinates, year-assignment criteria, sources, and confidence notes for all mapped records are provided in Supplementary Table S2. The mapped distribution is intended as a geographic framework for genomic baseline generation and should not be interpreted as evidence of source population, invasion route, or number of introduction events.
3.2. Sequencing Output, Mitogenome Assembly, and Comparative Validation
The two-primer-pair long-range PCR strategy generated mitochondrial consensus sequences for both P. viridis specimens and target regions. Selected long-amplicon consensuses ranged from 8,459 to 8,659 bp and were supported by 989-4,211 demultiplexed Nanopore reads per fragment (Table 2). The similar length of the amplicons resulted in approximate mean fragment-level read support of ~3,980 reads for LGM-781, and ~1,370 reads for LGM-885. In both specimens, overlapping consensuses enabled complete mitogenome reconstruction; after overlap-based merging, read-supported conflict resolution, and trimming of terminal redundancy generated by circular linearization, final assemblies measured 16,015 bp for LGM-781 and 16,011 bp for LGM-885. The complete mitochondrial genome assemblies were deposited in GenBank under accession numbers SUB16239785 (temporary) for LGM-781 and SUB16239785 (temporary) for LGM-885.
BLASTn validation supported the assignment of both final assemblies to P. viridis, with the highest-scoring matches corresponding to publicly available P. viridis mitochondrial sequences. Detailed BLASTn outputs for LGM-781 and LGM-885 are provided in Supplementary Tables S3A and S3B, and the direct pairwise BLAST comparison between the two Brazilian mitogenomes is provided in Supplementary Table S3C. Full-mitogenome pairwise comparisons among the complete P. viridis records analyzed showed 99.219-99.875% identity across comparable A/C/G/T sites (Table 3).
Despite this high similarity, the comparisons retained 20-125 SNPs/mismatches and 1-12 indel events. LGM-781 and LGM-885 differed by 125 SNPs/mismatches and nine indel events, and each Brazilian mitogenome showed a different closest match among complete public P. viridis accessions. These pairwise patterns were used as a comparative validation framework for the assemblies. Given the limited number of complete P. viridis mitogenomes currently available, the observed relative similarities should not be interpreted as evidence of source population, invasion route, or number of introduction events.
3.3. Mitogenome Architecture and Curated Annotation
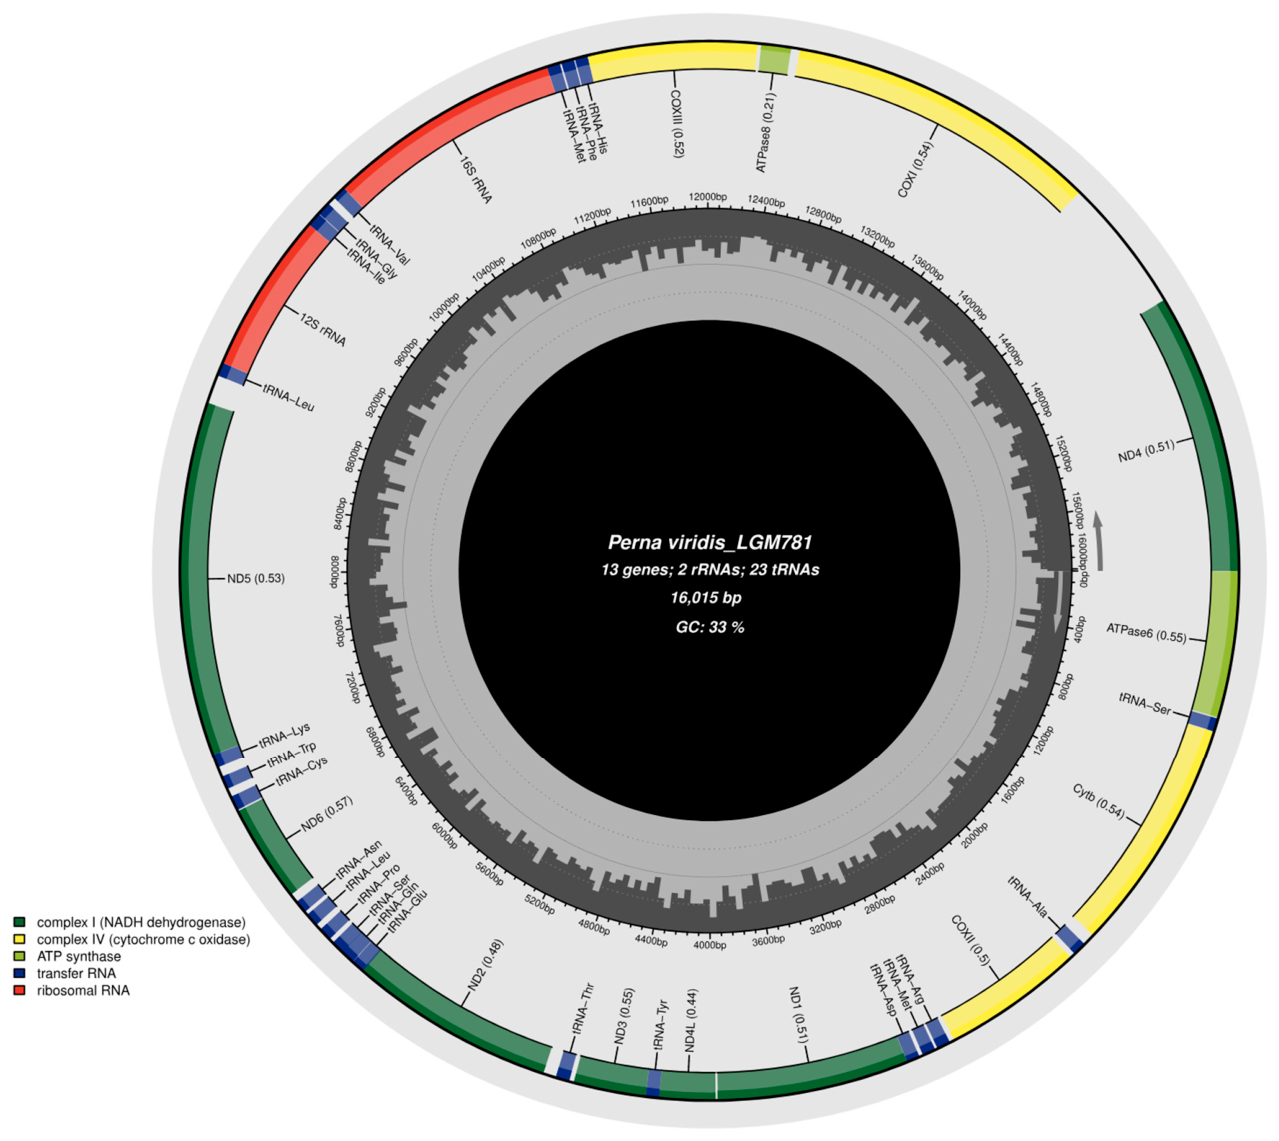
The two Brazilian P. viridis mitogenomes had the same annotated gene complement and overall circular architecture. Each assembly contained 38 mitochondrial features: 13 protein-coding genes, 23 tRNAs, and two rRNAs, all encoded on the H strand under the selected orientation. The assemblies differed by four base pairs in total length but showed identical A+T content (67.5%) and closely matched compositional skew values (Table 4). Because of this architectural similarity, LGM-781 is presented as the representative circular map (Figure 2), whereas Table 4 summarizes the compositional and structural features of both assemblies.
Coordinate-level annotation confirmed the same feature set in both Brazilian specimens, with minor coordinate differences corresponding to the four-base length difference and local indel variation. Complete gene coordinates, feature lengths, initiation and termination codons for protein-coding genes, and strand assignments are provided in Supplementary Tables S4A and S4B. In both mitogenomes, ND4 was annotated as a single origin-spanning protein-coding gene. Under the ATP6-start representation, ND4 crosses the artificial coordinate break and terminates within the first bases of the ATP6 interval; reporting it with split circular coordinates preserves coding-sequence continuity, including its terminal codon, and avoids truncation at the linearized genome boundary [48].
Figure 2.
Circular map of the representative Perna viridis mitochondrial genome LGM-781 (16,015 bp; G+C = 32.5%). The outer ring shows annotated features and orientation along the circular molecule; colors indicate complex I/NADH dehydrogenase genes (dark green), complex IV/cytochrome c oxidase genes (yellow), ATP synthase genes (light green), tRNAs (blue), and rRNAs (red). The inner histogram depicts local nucleotide-composition variation. ND4 is represented as an origin-spanning feature because the coding sequence crosses the artificial coordinate break of the circularized mitogenome and overlaps the ATP6-start interval.
Figure 2.
Circular map of the representative Perna viridis mitochondrial genome LGM-781 (16,015 bp; G+C = 32.5%). The outer ring shows annotated features and orientation along the circular molecule; colors indicate complex I/NADH dehydrogenase genes (dark green), complex IV/cytochrome c oxidase genes (yellow), ATP synthase genes (light green), tRNAs (blue), and rRNAs (red). The inner histogram depicts local nucleotide-composition variation. ND4 is represented as an origin-spanning feature because the coding sequence crosses the artificial coordinate break of the circularized mitogenome and overlaps the ATP6-start interval.
3.4. Gene-Order Conservation Within Brazilian P. viridis and Rearrangement Among Perna
Gene-order comparison showed complete conservation among the two Brazilian P. viridis mitogenomes and the two publicly available complete P. viridis records included in the analysis (Figure 3; Supplementary Table S1).
All four mitogenomes shared the same ATP6-start arrangement, supporting the structural consistency of the Brazilian assemblies within the currently available complete mitogenomic framework for the species. By contrast, comparisons with P. canaliculus and P. perna revealed marked interspecific differences in mitochondrial gene order within Perna, particularly in the relative positions of ND2, ND4, ATP8, COXI, and adjacent tRNA blocks. Thus, although the Brazilian assemblies did not reveal a novel gene-order variant within P. viridis, the genus-level comparison demonstrates that complete mitogenomes capture structural information that cannot be recovered from single-locus markers.
3.5. Codon Usage, Nucleotide Diversity, and Protein-Level Divergence
The relative synonymous codon usage (RSCU) profile of the representative Brazilian mitogenome LGM-781 summarized codon-use composition across the 13 mitochondrial protein-coding genes (Figure 4). Because LGM-781 and LGM-885 had the same annotated gene complement and highly similar mitogenome architecture, a single representative RSCU profile was used to avoid redundant presentation. This profile provides a gene-set-level view of codon-use heterogeneity across mitochondrial amino acid classes and complements the nucleotide-composition metrics reported in Table 4.
Sliding-window analysis of nucleotide diversity across the four complete P. viridis mitogenomes revealed a heterogeneous distribution of variation along the mitochondrial genome rather than a uniform genome-wide signal (Figure 5). Diversity remained low across broad intervals but increased in discrete regions, including portions of the ND6/ND5 region and the COXI-ND4 sector. These variable windows identify mitogenomic regions that may be informative for future marker selection and comparative monitoring, without implying population structure or invasion routes from the current dataset.
Protein-level comparisons across Perna mitogenomes showed a similarly uneven pattern of divergence among mitochondrial protein-coding genes (Figure 6). COX1 and COX2 were among the most conserved proteins, whereas ATP8 and ND6 showed the highest mean amino acid divergence, with additional elevated divergence in ND5, ND2, ND3, ND4L, and ND4. Together, the codon-usage, nucleotide-diversity, and protein-divergence analyses indicate that complete mitogenomes provide complementary perspectives on conserved and variable mitochondrial features relevant to future monitoring and comparative studies.
3.6. Phylogenomic Placement of Brazilian P. viridis Mitogenomes
The phylogenomic reconstruction based on concatenated mitochondrial protein-coding genes recovered LGM-781 and LGM-885 within the P. viridis clade, together with the complete public mitogenomes of the species listed in Supplementary Table S1 (Figure 7). The Brazilian assemblies were clearly separated from P. canaliculus and P. perna, consistent with the BLASTn validation, whole-mitogenome pairwise comparisons, and gene-order conservation reported above. This placement supports the taxonomic identity of LGM-781 and LGM-885 and confirms their suitability as complete Brazilian mitochondrial references for comparative analyses within P. viridis.
The topology also reinforces the usefulness of complete mitogenomes as integrative comparative evidence for distinguishing among Perna species and for placing newly generated invasive-range records within a broader genomic framework. However, because complete P. viridis mitogenomes remain sparsely represented in public databases, the phylogenomic placement of the Brazilian sequences should be interpreted as taxonomic and comparative support rather than as evidence of geographic origin, invasion route, or population connectivity.
4. Discussion
4.1. A Mitogenomic Baseline for P. viridis Bioinvasion Monitoring in the Southwestern Atlantic
The present study expands the molecular reference framework for invasive P. viridis by providing the first complete mitochondrial genomes from Brazilian specimens. This is an important advance because the recent spread of P. viridis along the Brazilian coast has so far been documented mainly through occurrence records, morphology, and partial mitochondrial markers, especially COI [9,13,19,20]. By generating complete, read-supported, and curated mitogenomes from Santa Catarina, the present work extends the available molecular evidence from species confirmation to comparative mitogenomic surveillance.
As summarized in Figure 1 and Supplementary Table S2, the Brazilian sequences are embedded in a broader American invasion context that currently comprises 84 curated non-native records, 64 of them from Brazil. Earlier records from the Caribbean and southeastern United States preceded the more recent expansion observed along the Brazilian coast, where occurrences now extend from Rio de Janeiro to southern Brazil [9,12,13,16,17,18,19,20,41,42,44,45,46]. Santa Catarina is especially relevant in this context because it represents the currently documented southern invasion front in Brazil and includes areas where mollusk farming and coastal biosecurity concerns intersect [20].
The principal contribution of these mitogenomes is therefore to establish curated reference points for future invasion-oriented analyses, not to resolve the geographic origin or route of introduction of P. viridis in Brazil. Complete mitogenomes allow the comparison of full mitochondrial haplotypes, genome architecture, and candidate variable regions, while also strengthening reference libraries for molecular detection and surveillance [5,23]. This broader mitochondrial framework is particularly important in Perna, where public complete mitogenomes remain limited and congeneric species differ in genome organization, annotation boundaries, and structural arrangement [24,26,27]. As broader sampling becomes available from Brazil, other invaded American regions, and native-range populations, the Brazilian sequences reported here will provide a stronger basis for testing recurrent introduction, secondary dispersal, and population connectivity in the southwestern Atlantic.
4.2. Why Complete Mitogenomes Matter Beyond COI-Based Confirmation
Mitochondrial COI has been central to the molecular confirmation of P. viridis in Brazil and remains an appropriate first-line marker for species-level identification, especially when juvenile, fouling-associated, or morphologically ambiguous specimens are encountered [9,19,20]. However, COI represents only a small fraction of the mitochondrial genome and cannot recover information on gene order, coding-region boundaries, codon usage, intergenic regions, structural organization, or the distribution of informative sites across the complete mitochondrial molecule [22,23]. These additional layers of information become increasingly relevant when the objective shifts from occurrence confirmation to the construction of a comparative framework for invasion monitoring.
The pairwise comparisons reported here illustrate that added value. Although the complete P. viridis mitogenomes analyzed were highly similar overall, whole-mitogenome contrasts still retained 20 to 125 SNPs/mismatches and one to 12 indel events across approximately 16 kb (Table 3). In practical terms, this means that differences that appear small at the percentage-identity level still correspond to dozens, and in some comparisons, more than one hundred, informative differences at the scale of the complete mitochondrial molecule. Such a signal is not sufficient, by itself, to infer source populations or invasion routes, but it clearly exceeds the comparative space afforded by a single barcode fragment.
Evidence from other invasive or biosecurity-relevant systems supports the same logic. In invasive Ponto-Caspian amphipods, complete mitogenomes were used to recover SNPs, evaluate genome structure, detect tRNA translocation, and support marker development [49]. In the coconut rhinoceros beetle Oryctes rhinoceros, a complete long-read mitogenome expanded the molecular toolkit available for the invasive CRB-G lineage, including in silico validation of diagnostic PCR-RFLP markers [50]. At a broader geographic scale, complete mitochondrial datasets were used to reconstruct invasion history and demographic processes in Popillia japonica and Lycorma delicatula, showing how the inferential value of whole mitogenomes increases substantially when many individuals and regions are represented [51,52].
Whole mitogenomes are also informative because they expose structural and region-specific features that short markers cannot capture. In invasive salangid fishes, complete mitogenome analyses identified divergence peaks associated with recombinant mitochondrial fragments [53], whereas in the reef-building polychaete Ficopomatus enigmaticus they revealed marked gene-order rearrangement together with cryptic lineages and useful references for future metabarcoding [54]. Similar added resolution has been reported for the tomato leafminer Phthorimaea absoluta, in which draft mitogenomes revealed diversity not evident from partial COI alone [55]. In P. viridis, complete mitogenomes should therefore be viewed as a complementary resource to COI, broadening the molecular basis for future marker selection, haplotype screening, surveillance, and connectivity analyses.
4.3. Read-Supported Assembly and Curated Annotation as Requirements for Reliable Comparative Mitogenomics
The value of a complete mitogenome for surveillance depends not only on obtaining a circular sequence but also on the confidence with which that sequence is assembled and annotated. Long-read ONT-based approaches are increasingly used to recover complete mitogenomes through rapid sequencing, low-coverage mitophylogenomics, overlapping long-amplicon strategies, and fully circular assemblies [56,57,58,59]. In the present study, the selected long-amplicon consensuses were supported by 989 to 4,211 demultiplexed Nanopore reads per fragment (Table 2), providing strong sequence support for both Brazilian specimens and reinforcing their value as comparative resources rather than simple species-confirmation sequences.
That level of curation matters because circular mitochondrial assemblies derived from overlapping long-range PCR fragments must reconcile fragment overlap, terminal redundancy, and local sequence conflicts before the final molecule is represented in linearized form [58]. The issue is especially relevant in compact metazoan mitogenomes, where neighboring genes may overlap, and coding boundaries are not always straightforward to define [60,61,62]. In mollusks and mytilid bivalves, these challenges are compounded by lineage-specific structural patterns, rearranged gene orders, and variable intergenic organization [23,24,25]. For that reason, overlap-aware merging, read-supported conflict resolution, and trimming of terminal redundancy must be treated as quality-control steps, not merely as computational formalities.
Annotation required the same level of care. Mytilid mitogenomes may differ in gene order, strand organization, intergenic structure, and feature boundaries, so automatic annotation or direct transfer from a single reference is often insufficient [23,24]. The reference-assisted nucleotide-level annotation and manual curation adopted here were therefore necessary to assess coding continuity, start and stop codons, indel effects, and the consistency of protein-coding genes under the invertebrate mitochondrial genetic code. This was especially important for ND4, which crosses the artificial coordinate break of the ATP6-start representation and was therefore retained as a single origin-spanning CDS, preserving biological continuity rather than truncating the feature at the linearized boundary [26,48].
The final annotations of LGM-781 and LGM-885 were internally coherent and recovered the same feature set in both specimens, comprising 13 protein-coding genes, 23 tRNAs, two rRNAs, and 38 total mitochondrial features, together with identical A+T content and closely similar intergenic and overlap profiles (Table 4). Agreement between two independently assembled Brazilian specimens is important because comparative work in Mytilidae depends on reliable gene boundaries, strand assignment, and structure-aware annotation, particularly when interspecific rearrangements are present [23,24,27]. In that sense, the technical robustness of these assemblies is itself part of their biological value.
4.4. Structural and Sequence-Level Variation Reveal the Comparative Value of Perna Mitogenomes
The comparison of mitochondrial gene order reinforces the value of complete mitogenomes as structural markers. The two Brazilian assemblies, LGM-781 and LGM-885, shared the same ATP6-start organization observed in the two publicly available complete P. viridis mitogenomes, whereas P. canaliculus and P. perna displayed a distinct arrangement involving, among other regions, ND2, ND4, ATP8, COXI, and adjacent tRNA blocks (Figure 3; Supplementary Table S1). This pattern is consistent with previous comparative work showing that mytilid and Perna mitogenomes can differ substantially in gene order and that these differences are relevant both for evolutionary interpretation and for annotation quality control [23,24,27]. The conservation of organization among the four P. viridis mitogenomes considered here therefore supports the structural coherence of the Brazilian assemblies within the current species-level dataset.
At the nucleotide level, the sliding-window analysis indicates that variation within the currently available complete P. viridis dataset is not evenly distributed along the mitochondrial genome (Figure 5). Diversity remained low across substantial intervals but increased in discrete regions, especially parts of the ND6/ND5 region and the COXI-ND4 sector. Given that only four complete P. viridis mitogenomes are presently available for comparison, these regions should be interpreted as candidate informative intervals rather than as diagnostic population markers. Even so, they provide an explicit starting point for future marker development, targeted haplotype screening, or higher-resolution surveillance assays once broader sampling becomes available.
Protein-level comparisons added a complementary layer because they allowed homologous genes to be compared across Perna independently of whole-genome collinearity. This distinction matters because the sliding-window analysis is restricted to P. viridis, whereas the rearrangements observed among congeneric species make direct position-to-position mitogenome comparisons less straightforward across the genus. In that gene-wise framework, COX1 and COX2 were among the most conserved proteins, whereas ATP8 and ND6 showed the highest mean amino acid divergence, with additional elevated divergence in ND5, ND2, ND3, ND4L, and ND4 (Figure 6). This pattern underscores gene-specific heterogeneity in mitochondrial divergence across Perna, but it should not be overinterpreted as evidence of adaptive divergence in the absence of explicit tests.
Phylogenomic reconstruction integrates these structural and sequence-based results. The two Brazilian mitogenomes clustered within the P. viridis clade and were clearly separated from P. canaliculus and P. perna (Figure 7), in agreement with the BLASTn validation, pairwise whole-mitogenome comparisons, and structural conservation summarized above. This placement supports the taxonomic assignment of LGM-781 and LGM-885 and confirms their usefulness for comparative analyses within P. viridis. The fact that the two Brazilian assemblies showed different closest matches among the few public complete P. viridis mitogenomes is interesting, but at present it should be treated as a hypothesis-generating pattern rather than as a resolved biogeographic signal. Taken together, the gene-order, nucleotide-diversity, protein-level, and phylogenomic results show that complete mitogenomes contribute a multilayered comparative perspective that is not accessible from single-locus confirmation alone.
4.5. Applications, Limitations, and Future Directions for Genomic Surveillance
The mitogenomes generated here have immediate value as reference resources for molecular surveillance of P. viridis in the southwestern Atlantic. In practical monitoring programs, complete and curated mitochondrial references can improve the interpretation of records from ports, marinas, aquaculture facilities, fouling communities, and coastal biodiversity surveys, especially when specimens are juvenile, degraded, morphologically ambiguous, or detected through mixed environmental samples. This is particularly relevant because molecular and metabarcoding-based surveillance are becoming increasingly important for the detection of non-indigenous species in marine and port-associated environments [3,5,6]. In Brazil, the new mitogenomes may strengthen reference libraries for P. viridis and support more consistent comparisons among records from different coastal states.
Beyond their immediate value as references, these mitogenomes can also guide the development of targeted molecular tools. The combination of conserved and more variable regions identified here can inform the choice of alternative mitochondrial targets, multilocus panels, or assay regions for future barcoding, metabarcoding, qPCR, or ddPCR applications. These applications remain prospective rather than demonstrated outcomes of the present study, but the sequence framework necessary to design and evaluate them is now more robust than it was when only partial mitochondrial markers were available from Brazil.
The main limitations are equally clear. Only two Brazilian specimens were sequenced, both from Santa Catarina, and the number of complete public P. viridis mitogenomes available for comparison remains very small. In addition, mitochondrial DNA is a maternally inherited, non-recombining marker and therefore cannot capture the full demographic complexity of an invasion process. Without broader population sampling, nuclear markers, and denser mitogenome representation from native and invaded regions, the current dataset cannot robustly distinguish among recurrent introduction, secondary dispersal, founder effects, or unsampled source diversity.
Future work should therefore expand sampling across the Brazilian coast, other invaded American regions, and the native range of P. viridis, while integrating complete mitogenomes with nuclear SNPs, genome-wide markers, environmental DNA, port-connectivity data, oceanographic information, aquaculture records, and biofouling surveys. Within that broader framework, the Brazilian assemblies reported here provide the first complete mitochondrial baseline for the species in Brazil. They do not substitute for population-scale sampling, but they materially strengthen the genomic foundation on which future surveillance, marker development, and invasion-history analyses in the southwestern Atlantic can be built.
5. Conclusions
This study provides the first complete mitochondrial genomes of invasive P. viridis from Brazil and the southwestern Atlantic, establishing a curated reference baseline from the current southern Brazilian invasion front. The read-supported assemblies and manually curated annotations show that complete mitogenomes extend beyond COI-based confirmation by providing a multilayered record of mitochondrial architecture, gene-order conservation within P. viridis, structural divergence among Perna, localized nucleotide variability, protein-level heterogeneity, and phylogenomic placement. The Brazilian sequences, therefore, strengthen reference libraries for molecular surveillance, taxonomic validation, marker selection, and future comparative studies across the Brazilian coast and the broader American invasion context. However, the limited number of Brazilian specimens and the scarcity of complete public P. viridis mitogenomes mean that these data should be treated as a baseline, not as evidence of source populations, invasion routes, or connectivity. Future work integrating broader native and invaded-range sampling, nuclear or genome-wide markers, environmental DNA, and information on ports, vessel movement, oceanography, aquaculture, and biofouling will be necessary to test the processes shaping the expansion of P. viridis in the southwestern Atlantic.
Supplementary Materials
The following supporting information can be downloaded at the website of this paper posted on Preprints.org. Table S1. GenBank accession numbers, species, sampling localities (country), and source of locality information of mitogenomes included in the phylogenetic dataset. Sequences retrieved from NCBI GenBank/RefSeq are listed below. Table S2. Literature and data sources used to compile the non-native occurrence records of Perna viridis shown in Figure 1. Table S3A. Summary of the 20 highest-ranked NCBI BLASTN hits for the mitochondrial genome sequence of Perna viridis (LGM-781_assembled). Results were obtained using the complete mitochondrial query sequence (16015 bp) against the NCBI nucleotide collection (nt). The table reports hit description, scores, query coverage, E-value, percentage identity, and accession number as presented in the BLAST description table. Hits are shown in the order returned by BLAST. Table S3B. Summary of the 20 highest-ranked NCBI BLASTN hits for the mitochondrial genome sequence of Perna viridis (LGM-885_assembled). Results were obtained using the complete mitochondrial query sequence (16011 bp) against the NCBI nucleotide collection (nt). The table reports hit description, scores, query coverage, E-value, percentage identity, and accession number as presented in the BLAST description table. Hits are shown in the order returned by BLAST. Table S3C. Pairwise BLAST comparison between the mitochondrial genome sequences of Perna viridis LGM-781 and LGM-885. The table summarizes the BLAST 2 sequences alignment ranges detected in the direct pairwise analysis, reporting query and subject coordinates, score, E-value, identities, gaps, and strand orientation. Table S4A. Mitochondrial gene annotation and coordinates for Perna viridis (LGM-781). The table lists all annotated mitochondrial features (13 protein-coding genes, 23 tRNAs, and 2 rRNAs), reporting genomic start and end coordinates, feature length (bp), initiation and termination codons for protein-coding genes, and strand assignment. For non-coding features (tRNAs, rRNAs and control-region features), start/stop codon fields are left blank because these genes are not translated. Strand orientation is indicated as H (heavy strand) or L (light strand). Table S4B. Mitochondrial gene annotation and coordinates for Perna viridis (LGM-885). The table lists all annotated mitochondrial features (13 protein-coding genes, 23 tRNAs, and 2 rRNAs), reporting genomic start and end coordinates, feature length (bp), initiation and termination codons for protein-coding genes, and strand assignment. For non-coding features (tRNAs, rRNAs and control-region features), start/stop codon fields are left blank because these genes are not translated. Strand orientation is indicated as H (heavy strand) or L (light strand).
Author Contributions
“Conceptualization, A.O. S.L. and M.C.B.; methodology, A.O. S.L.; validation, A.O. S.L.; formal analysis, A.O. S.L. and R.S.; investigation, A.O. S.L., R.S., G.S.D., G.C.M., and M.C.B.; resources, A.O. S.L.; writing—original draft preparation, A.O. S.L., R.S., and M.C.B.; writing—review and editing, A.O. S.L., R.S., G.S.D., G.C.M., and M.C.B.; project administration, A.O. S.L. and M.C.B.; funding acquisition, A.O. S.L. All authors have read and agreed to the published version of the manuscript.”.
Funding
The authors acknowledge financial support from the Foundation for Research and Innovation Support of the State of Santa Catarina (FAPESC; Grant No. 2024TR001605) and from the National Council for Scientific and Technological Development (CNPq) through the Brazilian National Institute of Science and Technology – INCT-Mar COI (Process No. 400551/2014-4).
Institutional Review Board Statement
Not applicable.
Informed Consent Statement
Not applicable.
Data Availability Statement
Data will be made available upon reasonable request.
Acknowledgments
The authors acknowledge the institutional support provided by the Aquatic Community Ecology Laboratory, the Mariculture Laboratory, and the Molecular Genetics Laboratory at the Universidade do Vale do Itajaí (UNIVALI), which contributed to field sampling and laboratory infrastructure.
Conflicts of Interest
The authors declare that they have no known competing financial interests or personal relationships that could have appeared to influence the work reported in this paper.
References
- Pyšek, P.; Hulme, P.E.; Simberloff, D.; Bacher, S.; Blackburn, T.M.; Carlton, J.T.; Dawson, W.; Essl, F.; Foxcroft, L.C.; Genovesi, P.; Jeschke, J.M.; Kühn, I.; Liebhold, A.M.; Mandrak, N.E.; Meyerson, L.A.; Pauchard, A.; Pergl, J.; Roy, H.E.; Seebens, H.; van Kleunen, M.; Vilà, M.; Wingfield, M.J.; Richardson, D.M. Scientists’ warning on invasive alien species. Biol. Rev. Camb. Philos. Soc. 2020, 95, 1511–1534. [CrossRef]
- Seebens, H.; Meyerson, L.A.; Richardson, D.M.; Lenzner, B.; Tricarico, E.; Courchamp, F.; Aleksanyan, A.; Keskin, E.; Saeedi, H.; Akite, P.; et al. Biological invasions: A global assessment of geographic distributions, long-term trends, and data gaps. Biol. Rev. Camb. Philos. Soc. 2025, 100, 2542–2583. [CrossRef]
- Zarcero, J.; Antich, A.; Rius, M.; Wangensteen, O.S.; Turon, X. A new sampling device for metabarcoding surveillance of port communities and detection of non-indigenous species. iScience 2024, 27, 108588. [CrossRef]
- Cuthbert, R.N.; Pattison, Z.; Taylor, N.G.; Verbrugge, L.; Diagne, C.; Ahmed, D.A.; Leroy, B.; Angulo, E.; Briski, E.; Capinha, C.; Catford, J.A.; Dalu, T.; Essl, F.; Gozlan, R.E.; Haubrock, P.J.; Kourantidou, M.; Kramer, A.M.; Renault, D.; Wasserman, R.J.; Courchamp, F.; Global economic costs of aquatic invasive alien species. Sci. Total Environ. 2021, 775, 145238. [CrossRef]
- Duarte, S.; Vieira, P.E.; Lavrador, A.S.; Costa, F.O. Status and prospects of marine NIS detection and monitoring through (e)DNA metabarcoding. Sci. Total Environ. 2021, 751, 141729. [CrossRef]
- Lavrador, A.S.; Amaral, F.G.; Moutinho, J.; Vieira, P.E.; Costa, F.O.; Duarte, S. Comprehensive DNA metabarcoding-based detection of non-indigenous invertebrates in recreational marinas through a multi-substrate approach. Mar. Environ. Res. 2024, 200, 106660. [CrossRef]
- McCartney, M.A. Structure, function and parallel evolution of the bivalve byssus, with insights from proteomes and the zebra mussel genome. Philos. Trans. R. Soc. Lond. B Biol. Sci. 2021, 376, 20200155. [CrossRef]
- Inoue, K.; Yoshioka, Y.; Tanaka, H.; Kinjo, A.; Sassa, M.; Ueda, I.; Shinzato, C.; Toyoda, A.; Itoh, T. Genomics and transcriptomics of the green mussel explain the durability of its byssus. Sci. Rep. 2021, 11, 5992. [CrossRef]
- de Messano, L.V.R.; Gonçalves, J.E.A.; Kassuga, A.D.; da Silva, A.R.; Masi, B.P.; Messano, H.F.; Fardin, D.; Coutinho, R. Updated range distribution of the non-native Asian green mussel Perna viridis (Linnaeus, 1758) at Guanabara Bay, Rio de Janeiro, Brazil. PeerJ 2024, 12, e18649. [CrossRef]
- Lenz, M.; da Gama, B.A.P.; Gerner, N.V.; Gobin, J.; Gröner, F.; Harry, A.; Jenkins, S.R.; Kraufvelin, P.; Mummelthei, C.; Sareyka, J.; Xavier, E.A.; Wahl, M. Non-native marine invertebrates are more tolerant towards environmental stress than taxonomically related native species: Results from a globally replicated study. Environ. Res. 2011, 111, 943–952. [CrossRef]
- Urian, A.G.; Hatle, J.D.; Gilg, M.R. Thermal constraints for range expansion of the invasive green mussel, Perna viridis, in the southeastern United States. J. Exp. Zool. A Ecol. Genet. Physiol. 2011, 315, 12–21. [CrossRef]
- Ucros-Rodríguez, S.; Araque-Romany, F.; Montero-Mendoza, L.; Sarmiento-Nater, V.C.; Calvo-Carrillo, O.M.; Johnson-Restrepo, B.; Gallego, J.L.; Romero-Murillo, P. Analysis of pollutant accumulation in the invasive bivalve Perna viridis: Current status in the Colombian Caribbean 2020-2023. Toxics 2025, 13, 77. [CrossRef]
- de Messano, L.V.R.; Gonçalves, J.E.A.; Messano, H.F.; Campos, S.H.C.; Coutinho, R. First report of the Asian green mussel Perna viridis (Linnaeus, 1758) in Rio de Janeiro, Brazil: A new record for the southern Atlantic Ocean. BioInvasions Rec. 2019, 8, 653–660. [CrossRef]
- dos Santos, H.S.; Bertollo, J.C.; Creed, J.C. Range extension of the Asian green mussel Perna viridis (Linnaeus, 1758) into a marine extractive reserve in Brazil. BioInvasions Rec. 2023, 12, 208–222. [CrossRef]
- Weber, L.I.; Búrigo, Z.G.; Tardelli, R.M.; Thomasi, S.A.; Vianna, T.P.; Oliveira, M.M.; Moreira, N.L. New records of Perna viridis in Brazil represent main COI haplotypes of Indo-West Pacific. Bull. Mar. Sci. 2025, 101, 1–14. [CrossRef]
- Stefanelli-Silva, G.; Ramalho, D.C.F.; Molina, J.M.B.; Pontes, K.; Campos, M.C.C.; Cardoso, S.M.; Gelli, V.C.; de Azevedo, V.G. Range expansion of the Asian green mussel Perna viridis (Linnaeus, 1758) to São Paulo, Brazil. BioInvasions Rec. 2025, 14, 223–231. [CrossRef]
- Barbieri, E.; Castro, Í.B.; Cavallari, D.C.; Marques, R.C.; Olivera, E.B. Green mussel Perna viridis (L.) on the Brazilian coast: A fast-spreading invasive species reaching protected areas. Mar. Biol. 2025, 172, 58. [CrossRef]
- Belz, C.E.; Molina, J.R.A.; Maccari, J.M.; Huergo, L.F.; Gernet, M.V.; Abilhoa, V.; Adelir-Alves, J.; Chicora, V.; Soares, G.C.B.; Vieira, N.S.; Guilherme, P.D.B.; Silveira Júnior, N.; Manzoni, G.; da Silva, F.C.; Freitas, M.O.; Metri, R.; Suplicy, F.M.; Domingos, F.M.C.B. Assessing the fast geographic range expansion of the Asian green mussel, Perna viridis (Bivalvia: Mytilidae), in the Brazilian coastal waters. Zoologia 2025, 42, e24064. [CrossRef]
- Beltrão, M.C.; da Cunha, N.J.R.; Laaf, Y.O.; Diehl, F.L.; dos Santos, T.D. Molecular methods confirm the first report of the non-indigenous Perna viridis Linnaeus, 1758 (Mytilida, Mytilidae) in southern Brazil. Check List 2024, 20, 859–867. [CrossRef]
- Beltrão, M.C.; Manzoni, G.C.; Laaf, Y.O.; Delabary, G.S.; Lima, A.O.S. Expansion of the invasive green mussel (Perna viridis) in Brazilian mollusk farming: A new southern frontier. Pap. Avulsos Zool. 2026, 66, e202666003. [CrossRef]
- Marescaux, J.; Van Doninck, K. Using DNA barcoding to differentiate invasive Dreissena species (Mollusca, Bivalvia). ZooKeys 2013, 365, 235–244. [CrossRef]
- Fuhrmann, N.; Kaiser, T.S. The importance of DNA barcode choice in biogeographic analyses: A case study on marine midges of the genus Clunio. Genome 2021, 64, 242–252. [CrossRef]
- Xu, M.; Gu, Z.; Huang, J.; Guo, B.; Jiang, L.; Xu, K.; Ye, Y.; Li, J. The complete mitochondrial genome of Mytilisepta virgata (Mollusca: Bivalvia), novel gene rearrangements, and the phylogenetic relationships of Mytilidae. Genes 2023, 14, 910. [CrossRef]
- Cunha, R.L.; Nicastro, K.R.; Zardi, G.I.; Madeira, C.; McQuaid, C.D.; Cox, C.J.; Castilho, R. Comparative mitogenomic analyses and gene rearrangements reject the alleged polyphyly of a bivalve genus. PeerJ 2022, 10, e13953. [CrossRef]
- Ghiselli, F.; Gomes-dos-Santos, A.; Adema, C.M.; Lopes-Lima, M.; Sharbrough, J.; Boore, J.L. Molluscan mitochondrial genomes break the rules. Philos. Trans. R. Soc. Lond. B Biol. Sci. 2021, 376, 20200159. [CrossRef]
- Li, X.; Wu, X.; Yu, Z. Complete mitochondrial genome of the Asian green mussel Perna viridis (Bivalvia, Mytilidae). Mitochondrial DNA 2012, 23, 358–360. [CrossRef]
- Ranjard, L.; Wong, T.K.F.; Külheim, C.; Rodrigo, A.G.; Ragg, N.L.C.; Patel, S.; Dunphy, B.J.; Latché, A.; Pochon, X.; Strugnell, J.M.; et al. Complete mitochondrial genome of the green-lipped mussel, Perna canaliculus (Mollusca: Mytiloidea), from long nanopore sequencing reads. Mitochondrial DNA B Resour. 2018, 3, 175–176. [CrossRef]
- Untergasser, A.; Cutcutache, I.; Koressaar, T.; Ye, J.; Faircloth, B.C.; Remm, M.; Rozen, S.G. Primer3—new capabilities and interfaces. Nucleic Acids Res. 2012, 40, e115. [CrossRef]
- Okonechnikov, K.; Golosova, O.; Fursov, M.; UGENE Team. Unipro UGENE: A unified bioinformatics toolkit. Bioinformatics 2012, 28, 1166–1167. [CrossRef]
- Fu, L.; Niu, B.; Zhu, Z.; Wu, S.; Li, W. CD-HIT: Accelerated for clustering the next-generation sequencing data. Bioinformatics 2012, 28, 3150–3152. [CrossRef]
- Katoh, K.; Standley, D.M. MAFFT multiple sequence alignment software version 7: Improvements in performance and usability. Mol. Biol. Evol. 2013, 30, 772–780. [CrossRef]
- Rice, P.; Longden, I.; Bleasby, A. EMBOSS: The European Molecular Biology Open Software Suite. Trends Genet. 2000, 16, 276–277. [CrossRef]
- Altschul, S.F.; Gish, W.; Miller, W.; Myers, E.W.; Lipman, D.J. Basic local alignment search tool. J. Mol. Biol. 1990, 215, 403–410. [CrossRef]
- Iwasaki, W.; Fukunaga, T.; Isagozawa, R.; Yamada, K.; Maeda, Y.; Satoh, T.P.; Sado, T.; Mabuchi, K.; Takeshima, H.; Miya, M.; Nishida, M. MitoFish and MitoAnnotator: A mitochondrial genome database of fish with an accurate and automatic annotation pipeline. Mol. Biol. Evol. 2013, 30, 2531–2540. [CrossRef]
- Sharp, P.M.; Li, W.-H. The codon Adaptation Index—a measure of directional synonymous codon usage bias, and its potential applications. Nucleic Acids Res. 1987, 15, 1281–1295. [CrossRef]
- Zhang, D.; Gao, F.; Jakovlić, I.; Zou, H.; Zhang, J.; Li, W.X.; Wang, G.T. PhyloSuite: An integrated and scalable desktop platform for streamlined molecular sequence data management and evolutionary phylogenetics studies. Mol. Ecol. Resour. 2020, 20, 348–355. [CrossRef]
- Xiang, C-Y., Gao, F., Jakovlić, I., Lei, H-P., Hu, Y., Zhang, H., Zou, H., Wang, G-T., Zhang, D. Using PhyloSuite for molecular phylogeny and tree-based analyses. iMeta 2023, 2, e87. [CrossRef]
- Sievers, F.; Wilm, A.; Dineen, D.; Gibson, T.J.; Karplus, K.; Li, W.; Lopez, R.; McWilliam, H.; Remmert, M.; Söding, J.; Thompson, J.D.; Higgins, D.G. Fast, scalable generation of high-quality protein multiple sequence alignments using Clustal Omega. Mol. Syst. Biol. 2011, 7, 539. [CrossRef]
- Tamura, K.; Stecher, G.; Kumar, S. MEGA11: Molecular Evolutionary Genetics Analysis version 11. Mol. Biol. Evol. 2021, 38, 3022-3027. [CrossRef]
- Felsenstein, J. Confidence limits on phylogenies: An approach using the bootstrap. Evolution 1985, 39, 783–791. [CrossRef]
- Agard, J.B.R.; Kishore, R.; Bayne, B.L. Perna viridis (Linnaeus, 1758): First record of the Indo-Pacific green mussel (Mollusca: Bivalvia) in the Caribbean. Caribb. Mar. Stud. 1992, 3, 59–60.
- Rylander, K.; Perez, J.; Gomez, J.A. Status of the green mussel, Perna viridis (Linnaeus, 1758) (Mollusca: Mytilidae), in north-eastern Venezuela. Caribb. Mar. Stud. 1996, 5, 86–87.
- Buddo, D.S.A.; Steele, R.D.; D’Oyen, E.R. Distribution of the invasive Indo-Pacific green mussel, Perna viridis, in Kingston Harbour, Jamaica. Bull. Mar. Sci. 2003, 73, 433–441.
- Benson, A.J.; Marelli, D.C.; Frischer, M.E.; Danforth, J.M.; Williams, J.D. Establishment of the green mussel, Perna viridis (Linnaeus 1758) (Mollusca: Mytilidae), on the west coast of Florida. J. Shellfish Res. 2001, 20, 21–29.
- Baker, P.; Fajans, J.S.; Arnold, W.S.; Ingrao, D.A.; Marelli, D.C.; Baker, S.M. Range and dispersal of a tropical marine invader, the Asian green mussel, Perna viridis, in subtropical waters of the southeastern United States. J. Shellfish Res. 2007, 26, 345–355. [CrossRef]
- Gracia, A.; Rangel-Buitrago, N. The invasive species Perna viridis (Linnaeus, 1758 - Bivalvia: Mytilidae) on artificial substrates: A baseline assessment for the Colombian Caribbean Sea. Mar. Pollut. Bull. 2020, 152, 110926. [CrossRef]
- Fofonoff, P.W.; Ruiz, G.M.; Steves, B.; Simkanin, C.; Carlton, J.T. National Exotic Marine and Estuarine Species Information System (NEMESIS). Smithsonian Environmental Research Center. Available online: https://invasions.si.edu/nemesis/ (accessed on 21 May 2026).
- Bolleman, J.T.; Mungall, C.J.; Strozzi, F.; Baran, J.; Dumontier, M.; Bonnal, R.J.P.; Buels, R.; Hoehndorf, R.; Fujisawa, T.; Katayama, T.; et al. FALDO: A semantic standard for describing the location of nucleotide and protein feature annotation. J. Biomed. Semantics 2016, 7, 39. [CrossRef]
- Mamos, T.; Grabowski, M.; Rewicz, T.; Bojko, J.; Strapagiel, D.; Burzyński, A. Mitochondrial genomes, phylogenetic associations, and SNP recovery for the key invasive Ponto-Caspian amphipods in Europe. Int. J. Mol. Sci. 2021, 22, 10300. [CrossRef]
- Filipović, I.; Hereward, J.P.; Rasic, G.; Devine, G.J.; Furlong, M.J.; Etebari, K. The complete mitochondrial genome sequence of Oryctes rhinoceros (Coleoptera: Scarabaeidae) based on long-read nanopore sequencing. PeerJ 2021, 9, e10552. [CrossRef]
- Nardi, F.; Boschi, S.; Funari, R.; Cucini, C.; Cardaioli, E.; Potter, D.; Asano, S.-I.; Toubarro, D.; Meier, M.; Paoli, F.; et al. The direction, timing and demography of Popillia japonica (Coleoptera) invasion reconstructed using complete mitochondrial genomes. Sci. Rep. 2024, 14, 7120. [CrossRef]
- Du, Z.; Wu, Y.; Chen, Z.; Cao, L.-M.; Ishikawa, T.; Kamitani, S.; Sota, T.; Song, F.; Tian, L.; Cai, W.; et al. Global phylogeography and invasion history of the spotted lanternfly revealed by mitochondrial phylogenomics. Evol. Appl. 2021, 14, 915–930. [CrossRef]
- Balakirev, E.S. Recombinant mitochondrial genomes reveal recent interspecific hybridization between invasive salangid fishes. Life 2022, 12, 661. [CrossRef]
- Kobayashi, G.; Itoh, H.; Nakajima, N. First report of the mitogenome of the invasive reef-building polychaete Ficopomatus enigmaticus (Annelida: Serpulidae) and a cryptic lineage from the Japanese Archipelago. Mol. Biol. Rep. 2023, 50, 7183–7196. [CrossRef]
- Magalhaes, V.S.; Czepak, C.; van Niekerk, M.; Du Plessis, H.; Court, L.; Tay, W.T. Phthorimaea absoluta (Meyrick) (Lepidoptera: Gelechiidae) draft mitogenomes and insecticide resistance gene characterisation support multiple maternal lineages in invasive African, Asian, and European populations. Bull. Entomol. Res. 2025, 115, 437–451. [CrossRef]
- Baeza, J.A.; García-De León, F.J. Are we there yet? Benchmarking low-coverage nanopore long-read sequencing for the assembling of mitochondrial genomes using the vulnerable silky shark Carcharhinus falciformis. BMC Genomics 2022, 23, 320. [CrossRef]
- De Vivo, M.; Lee, H.-H.; Huang, Y.-S.; Dreyer, N.; Fong, C.-L.; de Mattos, F.M.G.; Jain, D.; Wen, Y.-H.V.; Mwihaki, J.K.; Wang, T.-Y.; et al. Utilisation of Oxford Nanopore sequencing to generate six complete gastropod mitochondrial genomes as part of a biodiversity curriculum. Sci. Rep. 2022, 12, 9973. [CrossRef]
- Furuta, Y.; Kakita, M.; Tanaka, H. MitoCOMON: Whole mitochondrial DNA sequencing by primer design and long overlapping amplicon assembly. BMC Genomics 2025, 26, 787. [CrossRef]
- Baeza, J.A.; Minish, J.J.; Michael, T.P. Assembly of mitochondrial genomes using nanopore long-read technology in three sea chubs (Teleostei: Kyphosidae). Mol. Ecol. Resour. 2025, 25, e14034. [CrossRef]
- Bernt, M.; Donath, A.; Jühling, F.; Externbrink, F.; Florentz, C.; Fritzsch, G.; Pütz, J.; Middendorf, M.; Stadler, P.F. MITOS: Improved de novo metazoan mitochondrial genome annotation. Mol. Phylogenet. Evol. 2013, 69, 313–319. [CrossRef]
- Doublet, V.; Ubrig, E.; Alioua, A.; Bouchon, D.; Marcadé, I.; Maréchal-Drouard, L. Large gene overlaps and tRNA processing in the compact mitochondrial genome of the crustacean Armadillidium vulgare. RNA Biol. 2015, 12, 1159–1168. [CrossRef]
- Donath, A.; Jühling, F.; Al-Arab, M.; Bernhart, S.H.; Reinhardt, F.; Stadler, P.F.; Middendorf, M.; Bernt, M. Improved annotation of protein-coding gene boundaries in metazoan mitochondrial genomes. Nucleic Acids Res. 2019, 47, 10543–10552. [CrossRef]
Figure 3.
Schematic representation of mitochondrial gene order among selected mitogenomes of P. viridis, Perna canaliculus, and Perna perna. Labels on the left show taxon names and public GenBank/NCBI accession codes and local or user-defined sample identifiers. Gene names are shown inside each block. White boxes represent tRNA genes, whereas colored boxes represent protein-coding genes and ribosomal RNA genes (12S and 16S). All records are shown using an ATP6-start representation for direct comparison. Block widths are schematic and were adjusted to improve readability; therefore, they are not proportional to gene length or genomic distance.
Figure 3.
Schematic representation of mitochondrial gene order among selected mitogenomes of P. viridis, Perna canaliculus, and Perna perna. Labels on the left show taxon names and public GenBank/NCBI accession codes and local or user-defined sample identifiers. Gene names are shown inside each block. White boxes represent tRNA genes, whereas colored boxes represent protein-coding genes and ribosomal RNA genes (12S and 16S). All records are shown using an ATP6-start representation for direct comparison. Block widths are schematic and were adjusted to improve readability; therefore, they are not proportional to gene length or genomic distance.
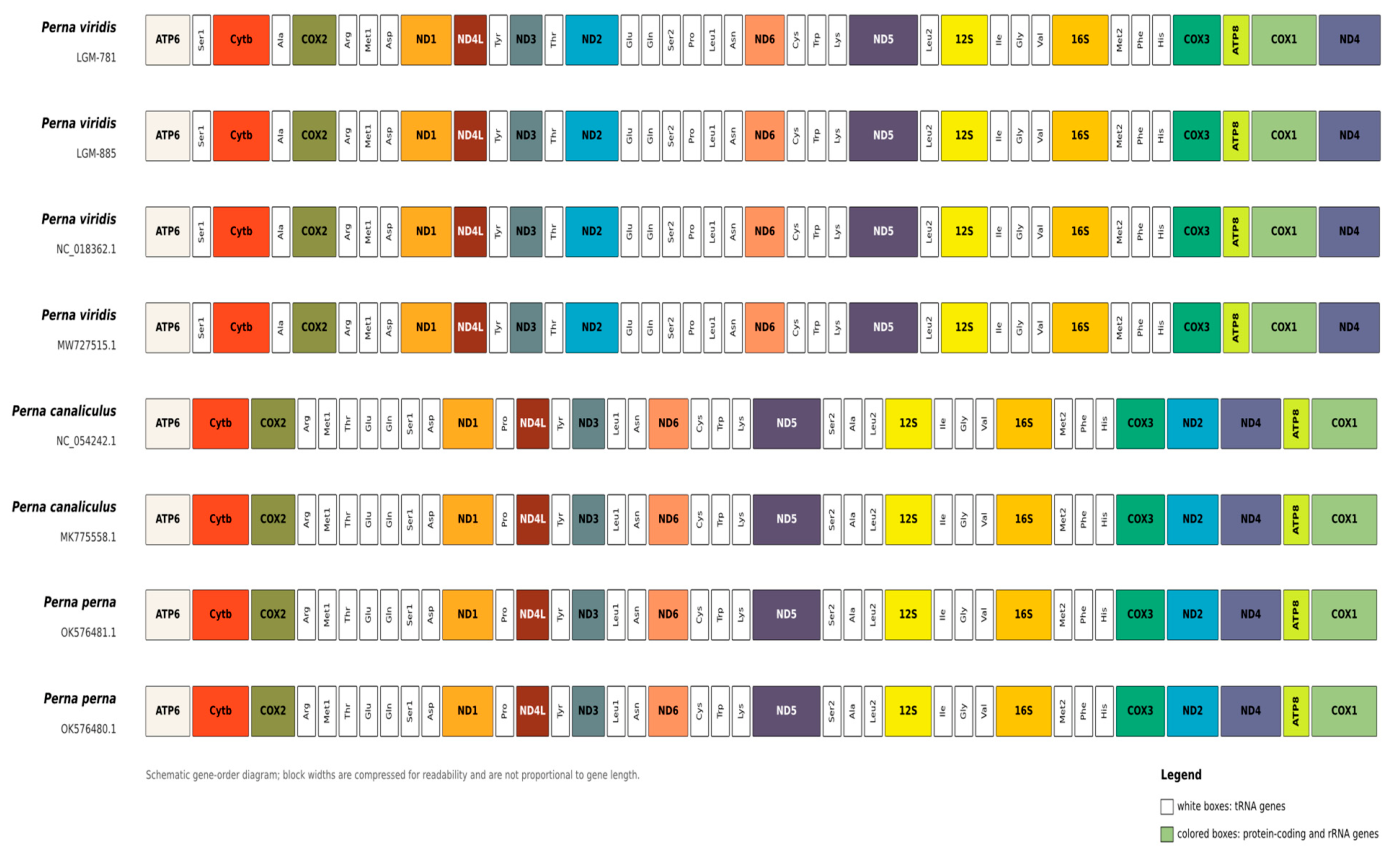
Figure 4.
Relative synonymous codon usage (RSCU) profile of the representative Brazilian Perna viridis mitogenome LGM-781. The analysis was based on the 13 annotated mitochondrial protein-coding genes. Stacked bars summarize codon usage within each amino acid class, and codon labels are shown below the corresponding bars.
Figure 4.
Relative synonymous codon usage (RSCU) profile of the representative Brazilian Perna viridis mitogenome LGM-781. The analysis was based on the 13 annotated mitochondrial protein-coding genes. Stacked bars summarize codon usage within each amino acid class, and codon labels are shown below the corresponding bars.
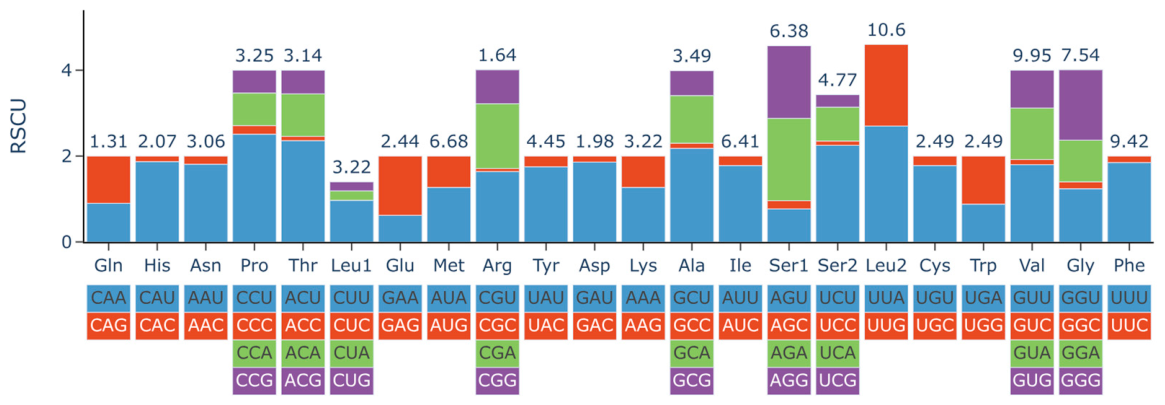
Figure 5.
Sliding-window nucleotide diversity (pi) across complete Perna viridis mitochondrial genomes. The analysis included the two Brazilian assemblies generated in this study and the two publicly available complete P. viridis mitogenomes listed in Supplementary Table S1. Diversity was calculated using a 500-bp window and a 25-bp step along the ATP6-start mitogenome alignment. Gene labels provide positional landmarks along the mitochondrial genome.
Figure 5.
Sliding-window nucleotide diversity (pi) across complete Perna viridis mitochondrial genomes. The analysis included the two Brazilian assemblies generated in this study and the two publicly available complete P. viridis mitogenomes listed in Supplementary Table S1. Diversity was calculated using a 500-bp window and a 25-bp step along the ATP6-start mitogenome alignment. Gene labels provide positional landmarks along the mitochondrial genome.
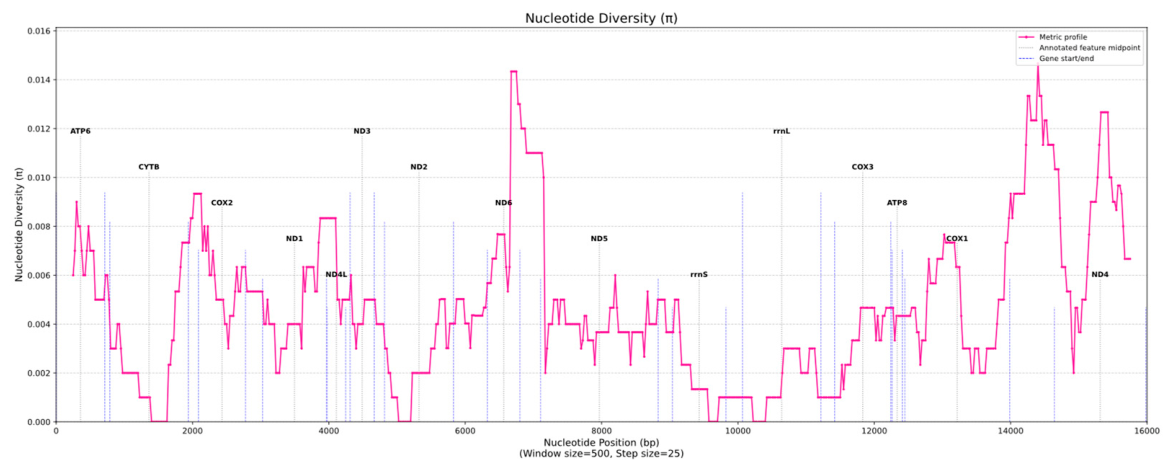
Figure 6.
Mean amino acid divergence by mitochondrial protein-coding gene across Perna mitogenomes. Amino acid sequences were extracted from the annotated mitochondrial protein-coding genes, aligned by gene, and compared across the Perna mitogenomes listed in Supplementary Table S1. Lower values indicate more conserved proteins, whereas higher values indicate greater protein-level divergence across comparable amino acid positions.
Figure 6.
Mean amino acid divergence by mitochondrial protein-coding gene across Perna mitogenomes. Amino acid sequences were extracted from the annotated mitochondrial protein-coding genes, aligned by gene, and compared across the Perna mitogenomes listed in Supplementary Table S1. Lower values indicate more conserved proteins, whereas higher values indicate greater protein-level divergence across comparable amino acid positions.
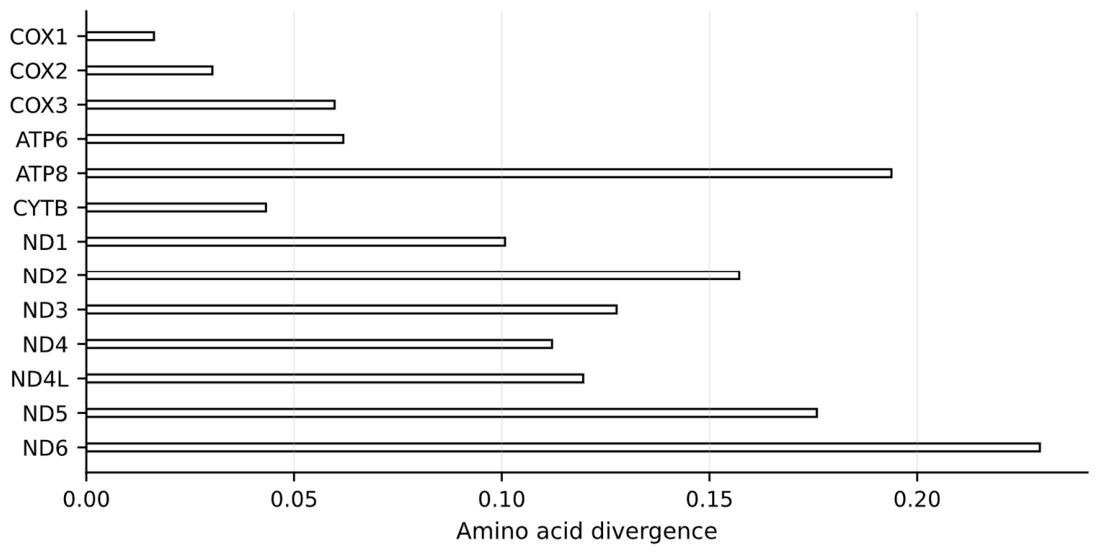
Figure 7.
Phylogenomic placement of the Brazilian Perna viridis mitogenomes generated in this study. The Maximum Likelihood tree was inferred from a concatenated alignment of 13 mitochondrial protein-coding genes from complete mitogenomes of Perna and the outgroup Mytilus galloprovincialis listed in Supplementary Table S1. The final alignment comprised 15 sequences and 10,767 positions. Node values indicate bootstrap support from 1,000 replicates. The Brazilian assemblies LGM-781 and LGM-885 cluster within P. viridis and are separated from P. canaliculus and P. perna, supporting their taxonomic assignment and comparative use as complete mitogenomic references from the Brazilian invasive range.
Figure 7.
Phylogenomic placement of the Brazilian Perna viridis mitogenomes generated in this study. The Maximum Likelihood tree was inferred from a concatenated alignment of 13 mitochondrial protein-coding genes from complete mitogenomes of Perna and the outgroup Mytilus galloprovincialis listed in Supplementary Table S1. The final alignment comprised 15 sequences and 10,767 positions. Node values indicate bootstrap support from 1,000 replicates. The Brazilian assemblies LGM-781 and LGM-885 cluster within P. viridis and are separated from P. canaliculus and P. perna, supporting their taxonomic assignment and comparative use as complete mitogenomic references from the Brazilian invasive range.
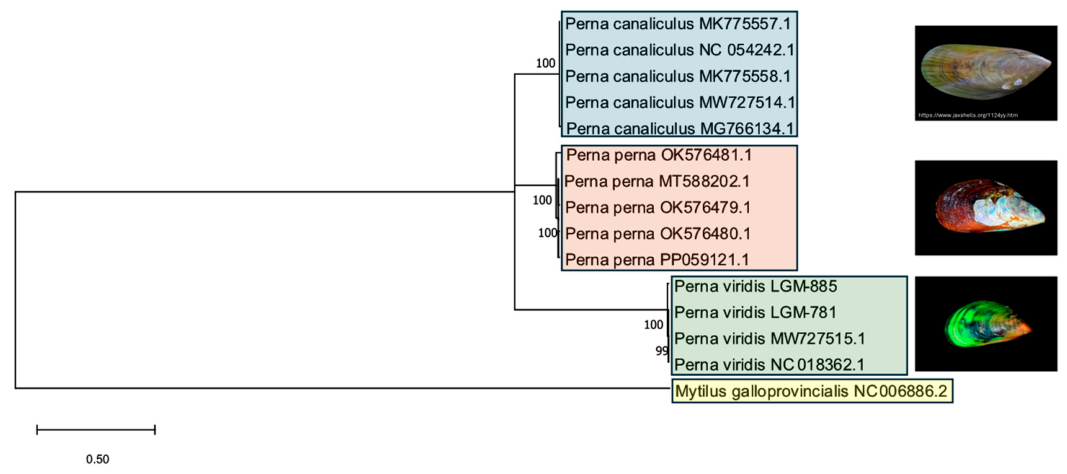
Table 2.
Oxford Nanopore read support and consensus length for each long-range PCR amplicon. Read counts correspond to demultiplexed reads supporting each consensus sequence; consensus length is reported in base pairs (bp).
Table 2.
Oxford Nanopore read support and consensus length for each long-range PCR amplicon. Read counts correspond to demultiplexed reads supporting each consensus sequence; consensus length is reported in base pairs (bp).
| Sample ID | Amplicon | Reads (n) | Consensus length (bp) |
|---|---|---|---|
| LGM781 | Pvir_mtDNA_Frag-1.1 | 3,747 | 8,463 |
| LGM781 | Pvir_mtDNA_Frag-2.1 | 4,211 | 8,658 |
| LGM885 | Pvir_mtDNA_Frag-1.2 | 1,752 | 8,459 |
| LGM885 | Pvir_mtDNA_Frag-2.2 | 989 | 8,659 |
Table 3.
Compact pairwise comparison among complete mitochondrial genomes included in the analysis. Pairwise identity was estimated from comparable A/C/G/T sites, and consecutive gaps were treated as indel events.
Table 3.
Compact pairwise comparison among complete mitochondrial genomes included in the analysis. Pairwise identity was estimated from comparable A/C/G/T sites, and consecutive gaps were treated as indel events.
| Comparison | Identity (%) |
SNPs/ mismatches |
Indel events |
Indel bases |
Comparable sites |
|---|---|---|---|---|---|
| NC_018362.1 vs MW727515.1 | 99.875 | 20 | 1 | 1 | 16,012 |
| LGM-781_v1 vs MW727515.1 | 99.8 | 32 | 3 | 6 | 16,011 |
| LGM-781_v1 vs NC_018362.1 | 99.7 | 48 | 4 | 7 | 16,010 |
| LGM-885_v1 vs NC_018362.1 | 99.319 | 109 | 12 | 17 | 16,003 |
| LGM-885_v1 vs MW727515.1 | 99.256 | 119 | 11 | 16 | 16,004 |
| LGM-781_v1 vs LGM-885_v1 | 99.219 | 125 | 9 | 12 | 16,007 |
Table 4.
Genome composition and architectural features of the Brazilian Perna viridis mitochondrial genomes analyzed in this study.
Table 4.
Genome composition and architectural features of the Brazilian Perna viridis mitochondrial genomes analyzed in this study.
| Parameter | LGM-781 | LGM-885 |
|---|---|---|
| Species | Perna viridis | Perna viridis |
| Genome size (bp) | 16015 | 16011 |
| PCGs | 13 | 13 |
| tRNAs | 23 | 23 |
| rRNAs | 2 | 2 |
| Total annotated features | 38 | 38 |
| Strand distribution | 38 H; 0 L | 38 H; 0 L |
| A (%) | 27.3 | 27.4 |
| T (%) | 40.2 | 40.1 |
| C (%) | 9.9 | 9.9 |
| G (%) | 22.6 | 22.5 |
| A+T (%) | 67.5 | 67.5 |
| G+C (%) | 32.5 | 32.5 |
| AT-skew | -0.191 | -0.189 |
| GC-skew | 0.391 | 0.387 |
| Total PCG length (bp) | 11221 | 11218 |
| Total tRNA length (bp) | 1522 | 1523 |
| Total rRNA length (bp) | 1935 | 1934 |
| Intergenic regions | 26 | 26 |
| Total intergenic length (bp) | 1356 | 1355 |
| Largest intergenic region | 661 bp (COXI–ND4) | 660 bp (COXI–ND4) |
| Overlaps | 5 | 5 |
| Total overlap length (bp) | 19 | 19 |
| Largest overlap | 7 bp (ND4–ATP6; ND2–tRNA-Glu) | 7 bp (ND4–ATP6; ND2–tRNA-Glu) |
| Origin-spanning gene(s) | ND4 | ND4 |
| Gene density (features/kb) | 2.373 | 2.373 |
| Mean bp per feature | 421.4 | 421.3 |
Note: PCGs = protein-coding genes. Intergenic and overlapping regions were computed using circular coordinates, with origin-spanning features treated as continuous across the circular junction. Gene density is shown as features/kb.
Disclaimer/Publisher’s Note: The statements, opinions and data contained in all publications are solely those of the individual author(s) and contributor(s) and not of MDPI and/or the editor(s). MDPI and/or the editor(s) disclaim responsibility for any injury to people or property resulting from any ideas, methods, instructions or products referred to in the content. |
© 2026 by the authors. Licensee MDPI, Basel, Switzerland. This article is an open access article distributed under the terms and conditions of the Creative Commons Attribution (CC BY) license (http://creativecommons.org/licenses/by/4.0/).
Copyright: This open access article is published under a Creative Commons CC BY 4.0 license, which permit the free download, distribution, and reuse, provided that the author and preprint are cited in any reuse.