

Submitted:
11 June 2026
Posted:
12 June 2026
You are already at the latest version
Abstract
Understanding the genetic basis of adaptation traits including chilling requirements, flowering and fruiting is essential for developing apricot cultivars adapted to changing climatic conditions and for extending the apricot production calendar. In this study, two biparental populations (‘Bergeron’ × ‘Currot’ and ‘Goldrich’ × ‘Currot’) were genotyped using genotyping-by-sequencing (GBS) to construct high-density linkage maps and perform QTL analysis for key traits, including chilling requirement (CR), blooming date (BD), fruit development period (FDP), and ripening time (RT). Phenotypic evaluation over eight years revealed wide variability across genotypes and strong correlations between CR and BD, particularly when using Chill Portions as a metric. Genome-wide association and QTL mapping consistently identified major loci on linkage group (LG) 1 for BD and CR, and on LG4 for FDP and RT, explaining up to 59% of phenotypic variance. Candidate gene analysis revealed the involvement of epigenetic regulators, cold-responsive proteins, and transcription factors, offering plausible functional links between genotype and phenotype. These findings provide novel insights into the genetic control of dormancy and phenological traits in apricot and represent a valuable genomic resource for marker-assisted breeding programs aimed at improving climatic resilience and extending the harvest calendar.
Keywords:
chilling requirements
; dormancy
; GBS
; PLS
; phenology
; Prunus armeniaca L.
; SNP
1. Introduction
Apricot (Prunus armeniaca L.) is a fruit species native to China, valued for its economic importance, which stems from its nutritional and industrial value, providing health benefits, along with its appealing aroma and flavor appreciated by consumers. Widely cultivated in temperate regions worldwide, the species is noted for its high fruit quality and broad genetic variability [1]. Adaptation traits greatly influence flowering and fruit maturation periods and vary depending on geographic location and climatic conditions, which are mainly determined by chilling requirements (CR) and the length of the fruit development period of each cultivar. In the Northern Hemisphere, such as in Spain or Turkey—two major apricot-producing countries—flowering typically occurs between March and April, with fruit maturing from May to July. Conversely, in Southern Hemisphere regions like Chile, flowering usually begins in September, and fruit is harvested from November to January [2] (Figure 1).
Deciduous fruit trees native to temperate regions undergo a period of dormancy during the winter, which enables them to withstand adverse climatic conditions [3,4]. Exiting this dormant state and achieving uniform and optimal flowering in spring requires each cultivar to accumulate a specific amount of CR, which is genetically determined. Therefore, the strategic selection of cultivars suited to local climates—where they can reliably satisfy their CR annually—has become essential for maintaining consistent yields and economic viability in fruit production systems [5].
Historically, the CR of Rosaceae species such as apricot, peach, sweet cherry, almond, apple, and pear has been determined using the traditional “forcing method”. This technique involves the weekly collection of shoots during the dormant period, followed by their exposure to standardized conditions in growth chambers for a predetermined duration [6,7]. Despite its accuracy, this method is labor-intensive, time-consuming, and limits large-scale genotype screening.
To overcome these limitations, statistical approaches that integrate long-term phenological records and temperature data have been proposed. In particular, Partial Least Squares (PLS) regression has emerged as a widely used method to identify the effective chilling accumulation period and to quantify genotype-specific chilling requirements with reasonable accuracy [8,9,10].
Temperate fruit tree breeding programs typically pursue two main objectives depending on the cultivation area. In mild-winter regions, the focus is on breeding and selecting low-chill (i.e., early-flowering) genotypes that can reliably meet their chilling requirements every year. In contrast, in colder regions, breeders aim to reduce the risk of frost damage during flowering by selecting high-chill (i.e., late-flowering) genotypes [11,12,13]. An accurate knowledge of these chilling needs can be used to determine the most suitable planting locations by correlating them with the specific agroclimatic conditions of a given region, particularly in the context of climate change, which is altering traditional patterns of chill accumulation and frost occurrence [14]. Additionally, extending the fruit harvest season—through the development of both early- and late-maturing cultivars—is essential for supporting market growth. Achieving these goals could be facilitated by the implementation of molecular markers, which are developed from the identification of highly significant quantitative trait loci (QTLs), as described in other fruit trees [15].
Genotyping-by-Sequencing (GBS) is a cost-effective, high-throughput technique that enables the identification of single nucleotide polymorphisms (SNPs). Its high marker density has greatly enhanced the resolution of genetic linkage maps, making it a powerful tool for identifying QTLs and uncovering marker-trait associations in segregating populations—applications that are critical for plant breeding programs [16]. Within the Prunus genus, GBS has been widely applied in species such as Prunus armeniaca (apricot) [17], P. domestica (European plum) [18], P. persica (peach) [19], P. avium (sweet cherry) [20], P. dulcis (almond) [21], and P. salicina (Japanese plum) [22].
Advances in linkage mapping and QTL analysis have considerably enhanced the understanding of trait inheritance, thereby facilitating the discovery of genes associated with agronomically relevant characteristics. In particular, flowering time in apricot and peach has been demonstrated to follow a quantitative pattern of inheritance [23]. Using an apricot cross progeny, a QTL for flowering time was identified on linkage group (LG) 5 and was consistently detected across three consecutive years of evaluation [24]. In a backcross population between peach and Prunus davidiana, two QTLs for blooming date were mapped on LG1 and LG2 over two years, whereas additional QTLs on LG5 and LG6 were observed only in a single year [25]. In peach, a flowering time QTL on LG4 was found to be stable across a five-year period [26]. Moreover, two major QTLs for blooming date were mapped on LG1 and LG7, and these were shown to co-localize with major QTLs associated with chilling requirement, indicating a possible genetic relationship between the two traits [27]. More recently, flowering and maturity dates were evaluated in five progenies derived from peach, apricot, and sweet cherry over periods ranging from three to eight years [28]. For flowering date, major QTLs were consistently detected on LG4 in apricot and sweet cherry and on LG6 in peach, while additional QTLs were mapped on LG2, LG3, LG4, and LG7 across the three species. With respect to ripening date, a major QTL was consistently identified on LG4 in all three species, highlighting its central role in the genetic control of this trait.
Therefore, the objective of this study is to detect and finely identify marker−trait associations linked to key phenological traits including chilling requirements in apricot, using an R-based workflow developed with agroclimatic functions. On the other hand, high-density genetic linkage maps developed from two biparental populations ‘Bergeron’ × ‘Currot’ (‘B×C’) and ‘Goldrich’ × ‘Currot’ (‘G×C’) were used. Additionally, candidate genes located within these highly significant genomic regions will be identified. The outcomes of this research are expected to support the development of molecular markers for use in apricot breeding programs, thereby enabling marker-assisted selection and promoting a faster development of cultivars well-adapted to current agronomic and climatic challenges.
2. Results
2.1. Phenotypic Data Analysis
The analysis of phenotypic distributions showed broad variability for BD, RT, and FDP across genotypes in both ‘BxC’ and ‘GxC’ populations (Figure S1). In ‘BxC’, BD ranged from 49 to 93 Julian days, RT from 146 to 188, and FDP from 66 to 116. Similarly, in ‘GxC’, BD spanned from 44 to 88, RT from 130 to 180, and FDP from 57 to 113. On the other hand, CP (chill portions) values range approximately from 37 to 84 in both populations. When separating the two periods (2012−2014 vs. 2021−2025), these values range from 45 to 84 (2012−2014) and from 37 to 73 (2021−2025), indicating lower chill portions in the most recent years. These ranges reflect the wide phenological diversity present within the segregating populations, with the ‘G×C’ population clearly exhibiting earlier ripening times. To explore more in depth the relationship between chilling requirements and flowering time, Pearson correlation analyses were performed between BD (BD12 to BD25) and three chilling models: CH (chill hours), UCU (Utah chill units), and CP (Figure S2).
In both populations, a clear pattern emerged: later blooming dates (e.g., BD25) were positively correlated with higher chilling accumulation, particularly under the Chill Portions model, which showed correlation coefficients as high as 0.87 in ‘BxC’ and 0.80 in ‘GxC’. This suggests that genotypes requiring more chilling tend to bloom later in the season. In contrast, the opposite effect showed weak or low-magnitude negative correlations.
2.2. Marker-Trait Association Analysis
The SNP dataset obtained from previous apricot GBS studies was used to establish marker–phenology associations with the phenotypic dataset in the apricot populations, focusing on the most prominent associations for each trait and population.
In the ‘BxC’ population, the Manhattan plot for BD25 revealed a moderate but clear association signal on chromosome 1, with several SNPs surpassing the genome-wide significance threshold. The most significant marker, S1_11466196, showed a -log10(P-value) of 6.459 and an R2 of 0.162, indicating a moderate contribution to phenotypic variance. The violin plot for this SNP showed a progressive increase in flowering time (Julian days) from genotype CC to TT, supporting a genotypic effect on bloom timing (Figure 2).
In terms of CP25 in the same population, the strongest association also mapped to chromosome 1, with SNP S1_989069 reaching a -log10(P-value) of 5.897 and R2 = 0.161. Several nearby SNPs displayed similar significance levels. The violin plot showed increasing chilling requirements from CC to TT genotypes, suggesting additive effects of alleles on chill accumulation level (Figure 3).
As for ‘GxC’ population, the marker–trait association for CP25 detected a highly significant region on chromosome 1, with a sharp peak centered at S1_38853551, showing a -log10(P-value) of 17.487 and an R2 of 0.345. This region was also supported by other closely linked SNPs. According to the violin plot, the CT genotype displayed a higher median chilling requirement than CC, highlighting a clear genotypic differentiation (Figure 4).
Regarding BD24, a strong and sharp association was also identified on chromosome 1, overlapping with the region associated with CP25. The most significant marker, S1_38853551, showed a -log10(P-value) of 24.449 and explained 43.5% of the phenotypic variance (R2 = 0.435). The violin plot illustrated that the CT genotype was associated with a markedly later blooming date compared to CC, confirming the major effect of this locus (Figure 5).
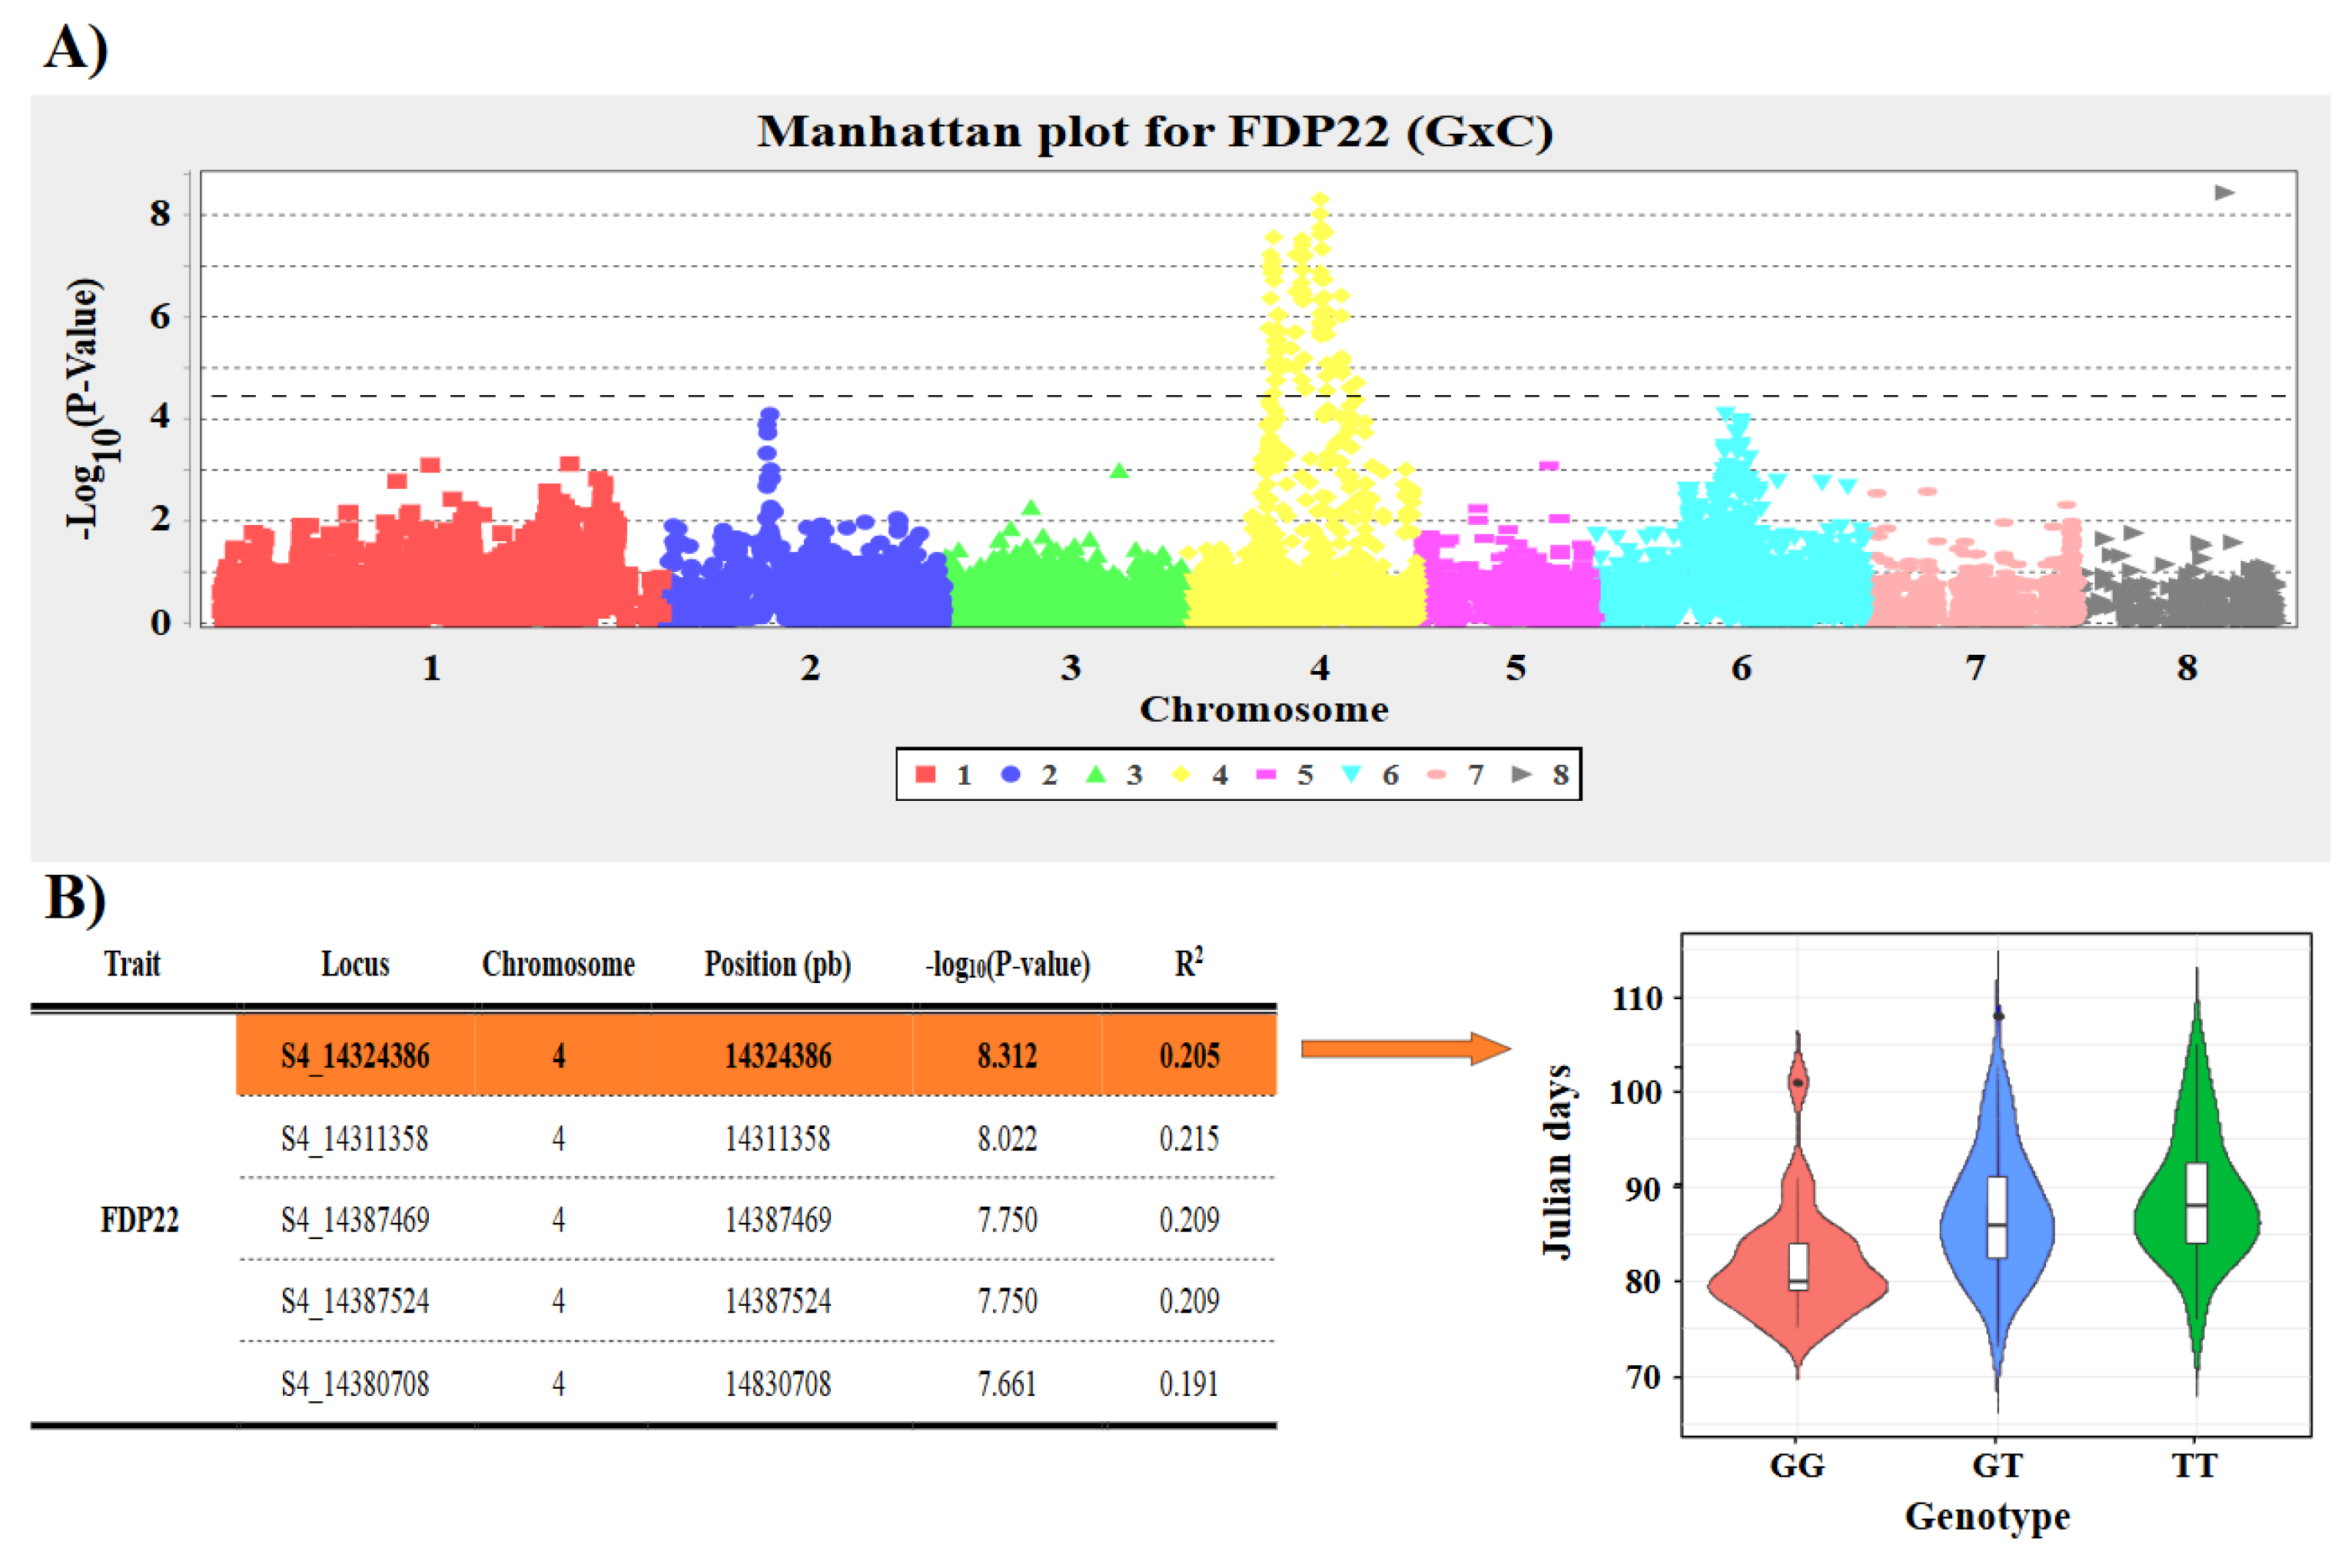
Additionally, significant associations were found for FDP22 on chromosome 4, with the leading SNP, S4_14324386, showing a -log10(P-value) of 8.312 and an R2 of 0.205. Other markers within the same region showed similar signals. The violin plot revealed a trend where TT genotypes were associated with longer fruit development periods, suggesting a genotype-dependent extension of the FDP trait (Figure 5).
Figure 6.
A) Manhattan plot of genome-wide association analysis for FDP in ‘GxC’ population. B) Table of the most significant SNPs and trait distribution by SNP genotype in violin plot.
Figure 6.
A) Manhattan plot of genome-wide association analysis for FDP in ‘GxC’ population. B) Table of the most significant SNPs and trait distribution by SNP genotype in violin plot.
Finally, in the analysis of RT13, a well-defined peak was observed on chromosome 4, with S4_12608918 reaching a -log10(P-value) of 18.429 and R2 = 0.312. Several flanking SNPs supported the signal. The violin plot showed that TT genotypes matured earlier (lower Julian days) compared to CC, indicating a significant effect of this region on ripening time (Figure 7).
2.3. QTL Mapping
The QTL analysis revealed several significant loci associated with key phenological traits: BD, RT, FDP, and chilling requirements (i.e., CH, UCU and CP). The detection threshold was determined using permutation tests for each trait and year. The most consistent and relevant QTLs are summarized below, with their positions mapped across parental linkage maps for the ‘BxC’ (Figure S3 and Figure S4) and ‘GxC’ populations (Figure S5 and Figure S6).
2.3.1. ‘BxC’ Population
In the ‘Bergeron’ parent, multiple QTLs for BD were distributed across LG1, LG4, and LG7 (Table 1). A stable QTL on LG1 at 21.014 cM (marker S1_9890869) was consistently detected across three years (BD21, BD24, BD25), with LOD values up to 7.3 and explaining up to 23.1% of phenotypic variance, indicating a strong genetic control over flowering time.
For RT and FDP, a cluster of robust QTLs was identified on LG4 at ~48.8 cM, particularly at marker S4_12380084, significantly associated with both RT and FDP across multiple years. This locus reached LOD values of 9.4 for RT and 9.0 for FDP, explaining up to 27.8% and 26.7% of phenotypic variance, respectively. Regarding chilling requirements, notable QTLs were detected on LG1 (S1_9890869) for CH and CP (CH24, CH25, CP24, CP25), with LOD values up to 10.4, especially for CP25, which explained 31.6% of variance, confirming this region as a key regulator of endodormancy release.
For the ‘Currot’ parent in this population, QTLs for BD were primarily located on LG1 and LG7, with a consistent QTL at 46.784 cM on LG1 (S1_9928286) across three years, showing LOD scores of up to 6.9 and explaining 21.9% of variance (Table 2). A strong and stable QTL region for RT was found on LG4 around 54.8 cM, with marker S4_14749428 significantly associated across multiple years (RT12 to RT23), with LOD values up to 7.3 and PEVs near 22%.
For FDP, the most robust signals were located on LG4 at 48.669 cM (S4_12421090), consistently detected across five years (FDP12 to FDP25), reaching LOD scores up to 15.6 and explaining as much as 43.9% of trait variance. Regarding chilling requirement, QTLs were found on LG1 (S1_13528605 and S1_9928286), with CP25 showing the highest effect (LOD 9.1, 28.3% of variance).
2.3.2. ‘GxC’ Population
In the ‘Goldrich’ parent, QTLs for BD were mainly located on LG1 (88–93 cM) and LG4 (~47–51 cM) (Table 3). A particularly stable locus on LG1 at 88.221 cM (S1_38997919) was identified across multiple years (BD22, BD25), with the highest LOD value of 20.9 and explaining 45.4% of variance. Similarly, strong QTLs for RT and FDP were concentrated on LG4 at ~40–50 cM, with S4_11831218 being consistently associated with RT (LOD up to 20.2, 44.7% PEV) and FDP (LOD up to 19.3, 43.0% PEV). For chilling requirement, the same region on LG1 (S1_38997919 and S1_39663110) was linked to CH, UCU, and CP, with CP25 presenting a particularly high LOD of 15.0 and explaining 35.7% of variance.
In the ‘Currot’ parent of the ‘GxC’ population, consistent QTLs for BD were also identified on LG4 (55.715 cM, S4_14369731) and LG1 (112.712 cM, S1_40573005), with BD25 reaching a LOD of 23.0 and explaining 48.6% of the trait variance (Table 4). For RT, QTLs were concentrated on LG4 between 51–59 cM, with the most significant peak at S4_12863010 (RT13), reaching a LOD of 30.8 and explaining 59.3% of variation. FDP QTLs overlapped with RT loci, particularly at S4_12695425, with consistent effects over several years and a maximum LOD of 19.4 (FDP12), accounting for 43.2% of the variance. The chilling requirement QTLs were again mapped to LG1 (S1_40573005), shared across CH, UCU, and CP, with CP25 showing the strongest signal (LOD 16.0, 37.6% PEV), confirming this region’s involvement in dormancy release mechanisms.
2.4. Genes Linked to Major QTLs
Based on the preliminary marker–trait association analyses, which largely coincided with the QTL analysis, the most significant SNPs for each trait were classified according to whether they were located in genic or intergenic regions (Table S5). In the ‘G×C’ population, SNPs associated with RT, FDP, BD, and CP were either linked to genes or not linked to genes. Specifically, RT included 18 linked and 12 unlinked SNPs, FDP 17 linked and 13 unlinked, BD 12 linked and 18 unlinked, and CP 12 linked and 18 unlinked.
In the ‘B×C’ population, BD comprised 11 SNPs linked to genes and 19 not linked, whereas CP comprised 16 linked and 14 unlinked SNPs. Regarding, BD Prupe.1G435100 (COLD REGULATED PROTEIN 27) was found in ‘G×C’. Conversely, in ‘B×C’ BD, Prupe.1G101500 (histone-lysine N-methyltransferase, ASHR3/SDG) together with Prupe.1G109800 (DNA cytosine-5 methyltransferase) were identified. As for CP in ‘B×C’, the search revealed Prupe.1G101500 (histone-lysine N-methyltransferase) as well as Prupe.1G130400 (RNA polymerase II–associated protein 3).
In terms of RT in ‘G×C’, several candidate genes were identified, including Prupe.4G190000 (B3 domain transcription factor, VAL1-related), Prupe.4G176600 (PRA1 family protein 2), Prupe.4G191600 (vesicle-associated protein), Prupe.4G234600 (CCCH zinc finger), and Prupe.4G216900 (dihydrolipoamide succinyltransferase). Finally, for FDP in ‘G×C’, the identified genes comprised Prupe.4G190000 (B3 transcription factor, VAL1-related), Prupe.4G234600 (CCCH zinc finger), Prupe.4G176600 (PRA1 family protein 2), Prupe.4G154800 (2-oxoglutarate/Fe(II)-dependent dioxygenase), and Prupe.4G216900 (dihydrolipoamide succinyltransferase).
3. Discussion
An accurate phenological characterization is fundamental in breeding programs [29], as this information enables the development of cultivars capable of extending the current market window and thereby meeting increasing consumer demand. However, these traits are mechanistically complex, requiring the establishment of highly specific criteria for data collection [30]. Uncertainty in phenotyping methodologies [7] can introduce background noise due to the lack of consensus on selection standards, a challenge further exacerbated by the wide genetic variability among cultivars, genotype-by-environment interactions, and rapidly changing environmental conditions driven by climate change. In this context, it is noteworthy that, in some cases, such as BD12-BD14, early flowering exhibited weak or even negative correlations with chilling accumulation. This pattern suggests that additional factors—such as real-time thermal exposure or inherent genotypic differences—may exert a stronger influence on the regulation of early flowering. Collectively, these findings underscore a robust association between chilling requirements and flowering time at later phases of the dormancy-to-bloom transition, thereby reinforcing the predictive accuracy of the Chill Portions model in capturing genotype-dependent chilling sensitivity in apricot [31].
The construction of genetic linkage maps is a suitable method for identifying genomic regions that control both qualitative and quantitative traits [32]. In previous work, linkage maps were constructed by combining SSR and SNP markers in apricot, using 87 markers in the ‘B×C’ population and 89 markers in the ‘G×C’ population [33]. The results revealed high variability and segregation in both populations, which were evaluated over three consecutive years. In that study, QTLs associated with BD, RT, and FDP were consistently detected across years in all LGs except LG8. Among them, major QTLs for BD, RT, and FDP were identified on LG4, particularly in the ‘G×C’ population. In the present study, the development of high-resolution linkage maps enabled the precise localization of QTLs for key phenological traits in apricot. For example, multi-locus QTLs for BD were detected on LG1 and LG7 in the ‘B×C’ population, and on LG1 and LG4 in the ‘G×C’ population. Additionally, stable QTLs were identified on LG1 for CR, and on LG4 for both RT and FDP. Consistent with our findings, several QTLs associated with flowering and maturity dates demonstrated remarkable stability across years of evaluation, suggesting that their expression was largely unaffected by interannual climatic variation [34].
Comparative studies across Prunus species have revealed conserved genomic regions associated with key agronomic traits, such as flowering time and the interval between bloom and harvest [35]. In peach, QTLs for both flowering and fruit development have been localized to LG4 and LG6 [36], while in sweet cherry, QTLs for chilling requirement and flowering date have also been detected on LG4 [37]. These concordant results suggest that common chromosomal regions are central to the regulation of phenological traits within the genus.
In addition, numerous candidate genes have been linked to flowering control, including transcription factors and regulators of hormonal or light perception pathways [38]. Genes such as APETALA1 and members of the MADS-box family [39], SOC1 [40], and TFL1 [41] contribute to floral transition and meristem identity, while photoreceptors like PHY A, PHY B and PHY E mediate environmental cues [42]. DAM genes, particularly DAM5 and DAM6, have also been implicated in dormancy release (i.e., chilling requirements determination) and flowering regulation [43,44], reinforcing the idea of a highly conserved yet complex genetic network across Prunus species.
Consistently, in the low-chilling sweet cherry Spanish cultivar ‘Cristobalina’), a QTL on LG1 co-localized with DAM genes, echoing results from peach and supporting their role as major determinants of chilling requirement. Within these regions, additional candidates involved in chromatin remodeling (ARP4, EMF2, PIE1) and gibberellin metabolism (KS, GA2ox) were also detected [45], suggesting an interplay between epigenetic regulation and hormonal pathways in dormancy release. Similarly, in almond, genes associated with gibberellin metabolism have also been recently identified [46]. Moreover, studies in peach have highlighted genes such as ppLFL (a LEAFY/FLORICAULA homolog) as potential regulators of floral induction [47].
In agreement with these studies, we identified Prupe.1G435100, encoding COLD REGULATED PROTEIN 27, as a strong candidate for BD, consistent with the role of canonical COR/CBF proteins in cold response and dormancy regulation [48,49,50]. In addition, epigenetic regulators emerged as key players: Prupe.1G101500 (histone-lysine N-methyltransferase, ASHR3/SDG), which may modulate dormancy genes through histone methylation, and Prupe.1G109800 (DNA cytosine-5 methyltransferase), implicated in DNA methylation processes underlying vernalization and dormancy control [51]. Notably, Prupe.1G101500 was also detected for chilling requirement, further supporting the pivotal role of histone methylation in the regulation of dormancy transitions.
Integration of the FDP and RT results revealed a convergent set of candidate genes, emphasizing the common genetic determinants that regulate these interrelated phenological processes. Among them, Prupe.4G190000 (a B3-domain transcription factor related to VAL1) and Prupe.4G234600 (a CCCH-type zinc finger protein) show medium to high plausibility for contributing to developmental timing in both FDP and RT [52,53,54,55]. Vesicular trafficking components, particularly Prupe.4G176600 (PRA1 family protein 2), suggest that intracellular transport mechanisms may contribute to hormone distribution or cell wall materials critical during both fruit growth and the ripening phase. Additional genes such as Prupe.4G216900 (dihydrolipoamide succinyltransferase) appear with moderate relevance, likely reflecting more general metabolic or bioenergetic roles rather than ripening-specific regulation. Together, these results indicate that while FDP and RT are phenologically distinct, much of their genetic basis overlaps, particularly in transcriptional regulators.
However, for peach, a maturity date locus (qMD4.1) on LG4 was fine-mapped to a ~220 kb region, where two NAC transcription factors; ppa007577m and ppa008301m, were identified as strong candidates. Among these, ppa008301m was found to carry a 9-bp in-frame insertion in its last exon that co-segregated with early maturity alleles in both studied populations [56]. Similarly, ANAC072 has been proposed as a candidate gene within LG4 QTLs for maturity date and mapped traits in peach germplasm [57]. These NAC genes are especially interesting because NAC family transcription factors are known to regulate diverse aspects of fruit ripening, including cell wall modification, ethylene signaling, and developmental timing [58]. The repeated identification of NAC transcription factors as candidate genes, particularly those co-localized within major QTLs that explain a substantial proportion of phenotypic variance, strongly supports their role as central regulators of fruit maturation and developmental transitions. In line with our findings—where additional transcriptional regulators such as B3 domain proteins and CCCH zinc finger proteins were also implicated in both FDP and RT—it is plausible that conserved or orthologous regulatory pathways operate across Prunus species. Notably, the presence of NAC genes within the corresponding QTL region has also been confirmed in the available apricot genome (NCBI), specifically at loci CURHAP_LOCUS27365 and CURHAP_LOCUS27368, further reinforcing their candidacy in the genetic control of these phenological traits.
Future work should focus on validating the expression profiles of these candidate genes across developmental stages and assessing whether polymorphisms (such as frame insertions/deletions or regulatory variants) in these transcription factors correlate with phenotypic variation in FDP/RT in apricot. Notably, many of the significant SNPs detected are located in intergenic regions, which may play a crucial role as they could correspond to promoter sequences or other regulatory elements controlling genes involved in these phenological traits. Therefore, further investigations are required to unravel the regulatory mechanisms underlying these regions of interest and their contribution to phenological variation.
4. Materials and Methods
4.1. Plant Material and Experimental Site
The plant material included two F1 apricot populations: ‘Bergeron’ × ‘Currot’ (‘B×C’, n = 134) and ‘Goldrich’ × ‘Currot’ (‘G×C’, n = 159). Both populations were established in 2009 at the experimental orchard of CEBAS-CSIC, located in Cieza-Calasparra, Murcia, Spain (37°N, 1°W, 450 m above sea level). ‘Bergeron’ is a self-compatible French cultivar characterized by a high chilling requirement (approximately 65 Chill Portions) [6], late blooming, and late fruit maturity. In contrast, ‘Goldrich’ is a self-incompatible cultivar with a medium-high chilling requirement (around 58 Chill Portions) [59], mid-to-late blooming, and mid-season fruit maturity. ‘Currot’, a traditional Spanish cultivar serving as the common male parent in both crosses, has a low chilling requirement (approximately 38 Chill Portions) [60], and is noted for its very early blooming and very early fruit ripening [61].
4.2. Phenotyping and Analysis of Phenological Traits
Phenotyping encompassed the assessment of chilling requirements as well as several key phenological traits, including blooming date (BD), fruit development period (FDP), and ripening time (RT). These measurements were conducted in both F1 populations across non-consecutive eight growing seasons (2012, 2013, 2014, 2021, 2022, 2023, 2024, and 2025) (Table S1). Since all years fall within the 2000s, phenotypic records are identified using the last two digits of the year. Blooming and ripening assessments were carried out under field conditions and expressed in Julian days (day of the year). BD was recorded when approximately 50% of the flowers were open (F50) [62], whereas RT was determined based on the attainment of commercial maturity, identified by the characteristic skin color change and fruit firmness. FDP was calculated as the number of days between blooming and ripening. Chilling requirements were estimated following a recently published standardized workflow for determining agroclimatic requirements in biparental populations with a large number of individuals [63]. The three most commonly used models in fruit research also showing increasing complexity in the mathematical structure of the model were applied: chill hours [64], Utah chill units [65], and chill portions [66,67,68] (Table S2).
4.3. Marker-Trait Association and QTL Mapping
Associations between SNPs and phenotypic traits were analyzed using the software TASSEL v5 [69]. A General Linear Model (GLM) was applied, integrating phenotypic measurements with genotypic data, and accounting for population structure through principal component analysis (PCA) (Table S3 and Table S4). To visualize the genomic distribution and significance of marker-trait associations, Manhattan plots were generated for the most informative traits across different years.
For QTL detection, both parametric and non-parametric mapping strategies were employed using MAPQTL v7. Interval mapping was conducted to estimate the genomic positions of putative QTLs, along with their confidence intervals. Additionally, the Kruskal–Wallis test—a distribution-free method—was used to confirm marker-trait associations independently of normality assumptions. The significance of QTL peaks was determined by calculating LOD (logarithm of odds) score thresholds, based on 1,000 permutation tests performed with the built-in “Permutation Test” function. Genetic maps for both populations were developed in the previous research work [70].
4.4. Identification of Candidate Genes Associated with Major QTLs
Candidate gene identification was carried out focusing on the main QTL regions associated with key phenological traits: BD, CR, FDP, and RT. As ‘Currot’ is the common male parent in both F1 populations and its reference genome is available in the NCBI database [71], this cultivar was used as the genomic reference. For each significant SNP, the surrounding sequences were extracted and aligned against the Prunus persica v2.1 reference genome using the Phytozome platform (https://phytozome-next.jgi.doe.gov/). This approach enabled the identification of gene models located within the QTL intervals and the functional annotation of candidate genes potentially involved in the regulation of these phenological traits.
4.5. Data Analysis
All analyses and figure preparation related to genetic linkage maps and QTL visualization were performed using the R software environment (version 4.3.2; RStudio team). Genetic linkage maps were rendered using the packages LinkageMapView, which also served for the graphical representation of QTL results. For the calculation of chill requirements the chillR package [72] for R was used using the workflow modified [63]. In addition, ggplot2 was employed to generate violin plots.
5. Conclusions
This study provides a comprehensive dissection of the genetic architecture underlying apricot phenology and chilling requirements. By combining multi-year phenotypic evaluations with GBS-derived high-density genetic maps, we identified robust and stable QTLs on LG1 for blooming date and chilling requirement, and on LG4 for fruit development period and ripening time. These loci explained a substantial proportion of trait variance, confirming their central role in the regulation of dormancy release and growth developmental timing. Epigenetic control elements, cold-regulated proteins, and key transcription factors emerged from candidate gene analysis as likely contributors to the genetic regulation of phenology, linking genotype to phenotype.
The integration of marker−trait association and linkage mapping approaches enhanced the resolution and reliability of trait–marker associations, establishing a strong foundation for developing molecular markers in apricot. These findings not only contribute to understanding the genetic mechanisms of dormancy and phenology in Prunus but also provide evidence that could be used to guide marker-assisted selection strategies. Ultimately, this work supports the development of new apricot cultivars with desired chilling requirements and flowering times, better adapted to the challenges of climate change and capable of extending the commercial harvest season.
Supplementary Materials
The following supporting information can be downloaded at: Preprints.org, Figure S1: Distribution of phenotypic data for the traits BD, CP, RT, and FDP in both populations.; Figure S2: Pearson correlation coefficients between flowering time and various chilling requirement traits in both populations.; Figure S3: QTL analysis for the ‘Bergeron’ parent in ‘B×C’ across the entire genetic map for phenology traits.; Figure S4: QTL analysis for the ‘Currot’ parent in ‘B×C’ across the entire genetic map for phenology traits.; Figure S5: QTL analysis for the ‘Goldrich’ parent in ‘G×C’ across the entire genetic map for phenology traits.; Figure S6: QTL analysis for the ‘Currot’ parent in ‘G×C’ across the entire genetic map for phenology traits.; Table S1: Phenology data in ‘B×C’ and ‘G×C’ apricot populations.; Table S2: Chilling requirements data in ‘B×C’ and ‘G×C’ apricot populations.; Table S3: Summary of GWAS results for phenology traits in ‘B×C’ and ‘G×C’ apricot populations using TASSEL.; Table S4: Summary of GWAS results for chilling requirements traits in ‘B×C’ and ‘G×C’ apricot populations using TASSEL.; Table S5: Annotated genes located within the most significant genomic regions associated with BD, CP, RT, and FDP in apricot.
Author Contributions
Conceptualization, J.A.S. and P.M.G.; methodology, G.O.H., A.D, and J.A.S.; data curation, G.O.H. and A.D.; formal analysis, G.O.H. and M.M.A.; writing—original draft preparation, G.O.H.; writing—review and editing, G.O.H. J.A.S., and M.M.A.; supervision and review, D.R., J.A.S., and P.M.G.; resources, D.R. and J.A.S. All authors have read and agreed to the published version of the manuscript.
Funding
This research was supported by the Ministry of Science and Innovation (Spain) through the “Apricot Breeding” project (PID2022-137392OB-100) and the Research Consolidation Project (CNS2024-154620). It was also supported by the project “Stone fruit breeding for emerging challenges using new phenomic, genomic and modelling approaches” (23051/GERM/25), funded by Fundación Séneca de la Región de Murcia – Ayudas Fundación Séneca a los Grupos de Excelencia de la Región de Murcia.
Institutional Review Board Statement
Not applicable.
Informed Consent Statement
Not applicable.
Data Availability Statement
The datasets generated and/or analyzed during the current study are included in this published article and its Supplementary Information files. Additional information is available from the corresponding author upon reasonable request.
Acknowledgments
G.O.H. for its support through the predoctoral fellowship (FPU21/03563).
Conflicts of Interest
The authors declare no conflicts of interest.
References
- Hormaza, J.I.; Yamane, H.; Apricot, R.J. Fruits and Nuts; Kole, C., Ed.; Springer: Berlin, Heidelberg, 2007; pp. 171–187. [Google Scholar]
- Moustafa, K.; Cross, J. Production, pomological and nutraceutical properties of apricot. J. Food Sci. Technol. 2019, 56, 12–23. [Google Scholar] [CrossRef]
- Faust, M.; Erez, A.; Rowland, L.J.; Wang, S.Y.; Norman, H.A. Bud dormancy in perennial fruit trees: physiological basis for dormancy induction, maintenance, and release. HortScience 1997, 32, 623–629. [Google Scholar] [CrossRef]
- Campoy, J.A.; Ruiz, D.; Egea, J. Dormancy in temperate fruit trees in a global warming context: a review. Sci. Hortic. 2011, 130, 357–372. [Google Scholar] [CrossRef]
- Fadón, E.; Herrera, S.; Guerrero, B.I.; Guerra, M.E.; Rodrigo, J. Chilling and heat requirements of temperate stone fruit trees (Prunus sp.). Agronomy 2020, 10, 409. [Google Scholar] [CrossRef]
- Ruiz, D.; Campoy, J.A.; Egea, J. Chilling and heat requirements of apricot cultivars for flowering. Environ. Exp. Bot. 2007, 61, 254–263. [Google Scholar] [CrossRef]
- Delgado, A.; Egea, J.A.; Fernandez, E.; Campoy, J.A.; Egea, J.; Dicenta, F.; Ruiz, D. Discrepancies in methodologies to determine chill requirements in temperate fruit trees constrain guidelines for future plantings in a global warming context. Agric. For. Meteorol. 2024, 349, 109970. [Google Scholar] [CrossRef]
- Luedeling, E.; Gassner, A. Partial least squares regression for analyzing walnut phenology in California. Agric. For. Meteorol. 2012, 158, 43–52. [Google Scholar] [CrossRef]
- Martínez-Lüscher, J.; Hadley, P.; Ordidge, M.; Xu, X.; Luedeling, E. Delayed chilling appears to counteract flowering advances of apricot in southern UK. Agric. For. Meteorol. 2017, 237, 209–218. [Google Scholar] [CrossRef]
- Delgado, A.; Dapena, E.; Fernandez, E.; Luedeling, E. Climatic requirements during dormancy in apple trees from northwestern Spain–Global warming may threaten the cultivation of high-chill cultivars. Eur. J. Agron. 2021, 130, 126374. [Google Scholar] [CrossRef]
- Ledbetter, C. Apricot breeding in North America: Current status and future prospects. Acta Hortic. 2010, 862, 85–92. [Google Scholar] [CrossRef]
- Sun, H.Y.; Zhang, J.H.; Yang, L.; Jiang, F.C.; Wang, Y.Z. An overview of apricot breeding in China. Acta Hortic. 2015, 1214, 211–216. [Google Scholar] [CrossRef]
- Al-Suwaid, I.; Stănică, F.; Butcaru, A.; Mihai, C.; Al-Ghasheem, N. An overview of apricot breeding programs focused on production improvement, field resistance and high-quality fruits. Sci. Pap. Ser. B Hortic. 2022, 66. [Google Scholar]
- Delgado, A.; Egea, J.A.; Luedeling, E.; Dapena, E. Agroclimatic requirements and phenological responses to climate change of local apple cultivars in northwestern Spain. Sci. Hortic. 2021, 283, 110093. [Google Scholar] [CrossRef]
- De Mori, G.; Cipriani, G. Marker-assisted selection in breeding for fruit trait improvement: A review. Int. J. Mol. Sci. 2023, 24, 8984. [Google Scholar] [CrossRef] [PubMed]
- He, J.; Zhao, X.; Laroche, A.; Lu, Z.-X.; Liu, H.; Li, Z. Genotyping-by-sequencing (GBS), an ultimate marker-assisted selection (MAS) tool to accelerate plant breeding. Front. Plant Sci. 2014, 5, 484. [Google Scholar] [CrossRef] [PubMed]
- Gürcan, K.; Teber, S.; Ercisli, S.; Yilmaz, K.U. Genotyping by sequencing (GBS) in apricots and genetic diversity assessment with GBS-derived single-nucleotide polymorphisms (SNPs). Biochem. Genet. 2016, 54, 854–885. [Google Scholar] [CrossRef]
- Zhebentyayeva, T.; Shankar, V.; Scorza, R.; Callahan, A.; Ravelonandro, M.; Castro, S.; DeJong, T.; Saski, C.A.; Dardick, C. Genetic characterization of worldwide Prunus domestica (plum) germplasm using sequence-based genotyping. Hortic. Res. 2019, 6. [Google Scholar] [CrossRef]
- Bielenberg, D.G.; Rauh, B.; Fan, S.; Gasic, K.; Abbott, A.G.; Reighard, G.L.; Okie, W.R.; Wells, C.E. Genotyping by sequencing for SNP-based linkage map construction and QTL analysis of chilling requirement and bloom date in peach [Prunus persica (L.) Batsch]. PLoS ONE 2015, 10, e0139406. [Google Scholar] [CrossRef]
- Guajardo, V.; Solís, S.; Sagredo, B.; Gainza, F.; Muñoz, C.; Gasic, K.; Hinrichsen, P. Construction of high density sweet cherry (Prunus avium L.) linkage maps using microsatellite markers and SNPs detected by genotyping-by-sequencing (GBS). PLoS ONE 2015, 10, e0127750. [Google Scholar] [CrossRef]
- Khojand, S.; Zeinalabedini, M.; Azizinezhad, R.; Imani, A.; Ghaffari, M.R. Genomic exploration of Iranian almond (Prunus dulcis) germplasm: decoding diversity, population structure, and linkage disequilibrium through genotyping-by-sequencing analysis. BMC Genom. 2024, 25, 1101. [Google Scholar] [CrossRef]
- Salazar, J.A.; Pacheco, I.; Shinya, P.; Zapata, P.; Silva, C.; Aradhya, M.; Velasco, D.; Ruiz, D.; Martínez-Gómez, P.; Infante, R. Genotyping by sequencing for SNP-based linkage analysis and identification of QTLs linked to fruit quality traits in Japanese plum (Prunus salicina Lindl.). Front. Plant Sci. 2017, 8, 476. [Google Scholar] [CrossRef]
- Socquet-Juglard, D.; Christen, D.; Devènes, G.; Gessler, C.; Duffy, B.; Patocchi, A. Mapping architectural, phenological, and fruit quality QTLs in apricot. Plant Mol. Biol. Report. 2013, 31, 387–397. [Google Scholar] [CrossRef]
- Campoy, J.A.; Ruiz, D.; Egea, J.; Rees, D.J.G.; Celton, J.M.; Martínez-Gómez, P. Inheritance of flowering time in apricot (Prunus armeniaca L.) and analysis of linked quantitative trait loci (QTLs) using simple sequence repeat (SSR) markers. Plant Mol. Biol. Report. 2011, 29, 404–410. [Google Scholar] [CrossRef]
- Quilot, B.; Wu, B.H.; Kervella, J.; Génard, M.; Foulongne, M.; Moreau, K. QTL analysis of quality traits in an advanced backcross between Prunus persica cultivars and the wild relative species P. davidiana. Theor. Appl. Genet. 2004, 109, 884–897. [Google Scholar] [CrossRef] [PubMed]
- Verde, I.; Quarta, R.; Cedrola, C.; Dettori, M. QTL analysis of agronomic traits in a BC1 peach population. Acta Hortic. 2001, 592, 291–297. [Google Scholar] [CrossRef]
- Fan, S.; Bielenberg, D.G.; Zhebentyayeva, T.N.; Reighard, G.L.; Okie, W.R.; Holland, D.; Abbott, A.G. Mapping quantitative trait loci associated with chilling requirement, heat requirement and bloom date in peach (Prunus persica). New Phytol. 2010, 185, 917–930. [Google Scholar] [CrossRef]
- Dirlewanger, E.; Quero-Garcia, J.; Le Dantec, L.; Lambert, P.; Ruiz, D.; Dondini, L.; Illa, E.; Quilot-Turion, B.; Audergon, J.M.; Tartarini, S.; Letourmy, P.; Arús, P. Comparison of the genetic determinism of two key phenological traits, flowering and maturity dates, in three Prunus species: peach, apricot and sweet cherry. Heredity 2012, 109, 280–292. [Google Scholar] [CrossRef]
- Laurens, F.; Aranzana, M.J.; Arús, P.; Bassi, D.; Bonany, J.; Corelli, L.; Durel, C.E.; Mes, J.; Pascal, T.; Patocchi, A.; Peil, A.; Quilot, B.; Salvi, S.; Tartarini, S.; Troggio, M.; Vecchietti, A.; Velasco, R.; van de Weg, E. Review of fruit genetics and breeding programmes and a new European initiative to increase fruit breeding efficiency. Acta Hortic. 2010, 929, 95–102. [Google Scholar] [CrossRef]
- Ledbetter, C.; Gómez, E.; Burgos, L.; Peterson, S. Evaluation of fruit quality of apricot cultivars and selections. J. Tree Fruit. Prod. 1996, 1, 73–86. [Google Scholar] [CrossRef]
- Delgado, A.; Egea, J.A.; Lopez-Alcolea, J.; Campoy, J.A.; Ruiz, D. The timing and pattern of chill and heat exposure affect the estimation of agroclimatic requirements and adaptability potential in Prunus cultivars. Sci. Hortic. 2025, 339, 113910. [Google Scholar] [CrossRef]
- Ogundiwin, E.A.; Peace, C.P.; Gradziel, T.M.; Parfitt, D.E.; Bliss, F.A.; Crisosto, C.H. A fruit quality gene map of Prunus. BMC Genom. 2009, 10, 587. [Google Scholar] [CrossRef]
- Salazar, J.A.; Ruiz, D.; Campoy, J.A.; Tartarini, S.; Dondini, L.; Martínez-Gómez, P. Inheritance of reproductive phenology traits and related QTL identification in apricot. Tree Genet. Genomes 2016, 12, 71. [Google Scholar] [CrossRef]
- Rawandoozi, Z.J.; Hartmann, T.P.; Carpenedo, S.; Gasic, K.; da Silva Linge, C.; Cai, L.; van de Weg, E.; Byrne, D.H. Mapping and characterization QTLs for phenological traits in seven pedigree-connected peach families. BMC Genom. 2021, 22, 187. [Google Scholar] [CrossRef]
- Aranzana, M.J.; Decroocq, V.; Dirlewanger, E.; Eduardo, I.; Gao, Z.S.; Gasic, K.; Iezzoni, A.; Jung, S.; Peace, C.; Prieto, H.; Tao, R.; Verde, I.; Abbott, A.G.; Arús, P. Prunus genetics and applications after de novo genome sequencing: achievements and prospects. Hortic. Res. 2019, 6, 58. [Google Scholar] [CrossRef]
- Hernández Mora, J.R.; Micheletti, D.; Bink, M.; Van de Weg, E.; Cantín, C.; Nazzicari, N.; Caprera, A.; Dettori, M.T.; Micali, S.; Banchi, E.; Campoy, J.A.; Dirlewanger, E.; Lambert, P.; Pascal, T.; Troggio, M.; Bassi, D.; Rossini, L.; Verde, I.; Quilot-Turion, B.; Laurens, F.; Arús, P.; Aranzana, M.J. Integrated QTL detection for key breeding traits in multiple peach progenies. BMC Genom. 2017, 18, 404. [Google Scholar] [CrossRef]
- Castède, S.; Campoy, J.A.; García, J.Q.; Le Dantec, L.; Lafargue, M.; Barreneche, T.; Wenden, B.; Dirlewanger, E. Genetic determinism of phenological traits highly affected by climate change in Prunus avium: flowering date dissected into chilling and heat requirements. New Phytol. 2014, 202, 703–715. [Google Scholar] [CrossRef]
- Sánchez-Pérez, R.; Del Cueto, J.; Dicenta, F.; Martínez-Gómez, P. Recent advancements to study flowering time in almond and other Prunus species. Front. Plant Sci. 2014, 5, 334. [Google Scholar] [CrossRef]
- Silva, C.; García-Mas, J.; Sánchez, A.M.; Arús, P.; Oliveira, M.M. Looking into flowering time in almond (Prunus dulcis (Mill) DA Webb): the candidate gene approach. Theor. Appl. Genet. 2005, 110, 959–968. [Google Scholar] [CrossRef] [PubMed]
- Trainin, T.; Bar-Ya’akov, I.; Holland, D. ParSOC1, a MADS-box gene closely related to Arabidopsis AGL20/SOC1, is expressed in apricot leaves in a diurnal manner and is linked with chilling requirements for dormancy break. Tree Genet. Genomes 2013, 9, 753–766. [Google Scholar] [CrossRef]
- Liang, H.; Zhebentyayeva, T.; Olukolu, B.; Wilde, D.; Reighard, G.; Abbott, A. Comparison of gene order in the chromosome region containing a TERMINAL FLOWER 1 homolog in apricot and peach reveals microsynteny across angiosperms. Plant Sci. 2010, 179, 390–398. [Google Scholar] [CrossRef]
- Soriano, J.M.; Vilanova, S.; Romero, C.; Llácer, G.; Badenes, M.L. Characterization and mapping of NBS-LRR resistance gene analogs in apricot (Prunus armeniaca L.). Theor. Appl. Genet. 2005, 110, 980–989. [Google Scholar] [CrossRef]
- Bielenberg, D.G.; Wang, Y.; Li, Z.; Zhebentyayeva, T.; Fan, S.; Reighard, G.L.; Scorza, R.; Abbott, A.G. Sequencing and annotation of the evergrowing locus in peach [Prunus persica (L.) Batsch] reveals a cluster of six MADS-box transcription factors as candidate genes for regulation of terminal bud formation. Tree Genet. Genomes 2008, 4, 495–507. [Google Scholar] [CrossRef]
- Yamane, H.; Tao, R.; Ooka, T.; Jotatsu, H.; Sasaki, R.; Yonemori, K. Comparative analyses of dormancy-associated MADS-box genes, PpDAM5 and PpDAM6, in low-and high-chill peaches (Prunus persica L.). J. Jpn. Soc. Hortic. Sci. 2011, 80, 276–283. [Google Scholar] [CrossRef]
- Calle, A.; Cai, L.; Iezzoni, A.; Wünsch, A. Genetic dissection of bloom time in low chilling sweet cherry (Prunus avium L.) using a multi-family QTL approach. Front. Plant Sci. 2020, 10, 1647. [Google Scholar] [CrossRef]
- Mas-Gómez, J.; Gómez-López, F.J.; Rubio, M.; Gómez-Abajo, M.; Dicenta, F.; Martínez-García, P.J. Integration of linkage mapping, QTL analysis, RNA-Seq data, and Genome-Wide Association Studies (GWAS) to explore relative flowering traits in almond. Hortic. Plant J. 2025. [Google Scholar] [CrossRef]
- An, L.; Lei, H.; Shen, X.; Li, T. Identification and Characterization of PpLFL, a Homolog of FLORICAULA/LEAFY in Peach (Prunus persica). Plant Mol. Biol. Report. 2012, 30, 1488–1495. [Google Scholar] [CrossRef]
- Artlip, T.S.; Wisniewski, M.E.; Arora, R.; Norelli, J.L. An apple rootstock overexpressing a peach CBF gene alters growth and flowering in the scion but does not impact cold hardiness or dormancy. Hortic. Res. 2016, 3, 16006. [Google Scholar] [CrossRef] [PubMed]
- Liu, J.; Sherif, S.M. Hormonal Orchestration of Bud Dormancy Cycle in Deciduous Woody Perennials. Front. Plant Sci. 2019, 10, 2019. [Google Scholar] [CrossRef]
- Zhu, W.; Zhou, H.; Lin, F.; Zhao, X.; Jiang, Y.; Xu, D.; Deng, X.W. COLD-REGULATED GENE27 Integrates Signals from Light and the Circadian Clock to Promote Hypocotyl Growth in Arabidopsis. Plant Cell 2020, 32, 3155–3169. [Google Scholar] [CrossRef]
- Gangwar, H.; Kumari, P.; Gahlaut, V.; Jaiswal, V. Unveiling the Role of Cytosine-5 DNA Methyltransferase Under Heat Stress in Rose (Rosa chinensis). J. Plant Growth Regul. 2025, 44, 1664–1677. [Google Scholar] [CrossRef]
- Peng, F.Y.; Weselake, R.J. Genome-wide identification and analysis of the B3 superfamily of transcription factors in Brassicaceae and major crop plants. Theor. Appl. Genet. 2013, 126, 1305–1319. [Google Scholar] [CrossRef] [PubMed]
- Cao, Y.; Feng, X.; Ding, B.; Huo, H.; Abdullah, M.; Hong, J.; Jiang, L.; Wang, H.; Li, R.; Cai, Y.; Li, X.; Xia, Z.; Varshney, R.K.; Hu, H.; Lin, M.; Shen, F. Gap-free genome assemblies of two Pyrus bretschneideri cultivars and GWAS analyses identify a CCCH zinc finger protein as a key regulator of stone cell formation in pear fruit. Plant Comm. 2025, 6. [Google Scholar] [CrossRef] [PubMed]
- Li, C.; Yu, Q.; Si, Y.; Liang, Y.; Lin, S.; Yang, G.; Liu, W.; Ji, Y.; Wang, A. Melatonin suppresses ethylene biosynthesis by inhibiting transcription factor MdREM10 during apple fruit ripening. Hortic. Res. 2025, 12, uhaf020. [Google Scholar] [CrossRef]
- Yang, Z.; Jiang, W.; Wang, L.; Lin, D. Genome-wide analysis of the CCCH zinc finger gene family in pineapple (Ananas comosus L.) and their involvement in fruit development and translucency. BMC Plant Biol. 2025, 25, 902. [Google Scholar] [CrossRef]
- Pirona, R.; Eduardo, I.; Pacheco, I.; da Silva Linge, C.; Miculan, M.; Verde, I.; Tartarini, S.; Dondini, L.; Pea, G.; Bassi, D.; Rossini, L. Fine mapping and identification of a candidate gene for a major locus controlling maturity date in peach. BMC Plant Biol. 2013, 13, 166. [Google Scholar] [CrossRef] [PubMed]
- Pietrella, M.; Ferrari, L.; Dondini, L.; Alessandri, S.; Pondini, L.; Tasini, F.; Brandi, F.; Sirri, S.; Giuliano, G.; Eduardo, I.; Tartarini, S.; Giovannini, D. A palindromic sequence on chromosome 4 of peach (Prunus persica L. Batsch) is flanking a large deletion related to a Slow Ripening Phenotype. Sci. Hortic. 2025, 353, 114494. [Google Scholar] [CrossRef]
- Ortuño-Hernández, G.; Sandoval-Belmar, P.; Ruiz, D.; Martínez-Gómez, P.; Meneses, C.; Salazar, J.A. Insights into the Molecular Basis of Fruit Development in Prunus Species. Plant Mol. Biol. Report. 2025, 43, 1397–1413. [Google Scholar] [CrossRef]
- Viti, R.; Andreini, L.; Ruiz, D.; Egea, J.; Bartolini, S.; Iacona, C.; Campoy, J.A. Effect of climatic conditions on the overcoming of dormancy in apricot flower buds in two Mediterranean areas: Murcia (Spain) and Tuscany (Italy). Sci. Hortic. 2010, 124, 217–224. [Google Scholar] [CrossRef]
- Campoy, J.A.; Ruiz, D.; Allderman, L.; Cook, N.; Egea, J. The fulfilment of chilling requirements and the adaptation of apricot (Prunus armeniaca L.) in warm winter climates: an approach in Murcia (Spain) and the Western Cape (South Africa). Eur. J. Agron. 2012, 37, 43–55. [Google Scholar] [CrossRef]
- Ortuño-Hernández, G.; Silva, M.; Toledo, R.; Ramos, H.; Reis-Mendes, A.; Ruiz, D.; Martínez-Gómez, P.; Ferreira, I.M.P.L.V.O.; Salazar, J.A. Nutraceutical Profile Characterization in Apricot (Prunus armeniaca L.) Fruits. Plants 2025, 14, 1000. [Google Scholar] [CrossRef] [PubMed]
- Baggiolini, M. Les stades repérés des arbres fruitiers à noyau. Rev. Romande Agric. Vitic. Arboric. 1952, 8, 3–4. [Google Scholar]
- Muñoz-Morales, A.M.; Ortuño-Hernández, G.; Salazar, J.A.; Martínez-Gómez, P.; Egea, J.A.; Ruiz, D.; Delgado, A. R-based workflow to estimate chilling requirements in multiple fruit tree genotypes using Partial Least Squares regression: Prunus armeniaca L. case. MethodsX 2025, 15, 103686. [Google Scholar] [CrossRef]
- Weinberger, J.H. Chilling requirements of peach varieties; 1950. [Google Scholar]
- Richardson, E.A.; Seeley, S.D.; Walker, D.R. A model for estimating the completion of rest for ‘redhaven’and ‘elberta’peach trees1. HortScience 1974, 9, 331–332. [Google Scholar] [CrossRef]
- Fishman, S.; Erez, A.; Couvillon, G. The temperature dependence of dormancy breaking in plants: computer simulation of processes studied under controlled temperatures. J. Theor. Biol. 1987, 126, 309–321. [Google Scholar] [CrossRef]
- Fishman, S.; Erez, A.; Couvillon, G. The temperature dependence of dormancy breaking in plants: mathematical analysis of a two-step model involving a cooperative transition. J. Theor. Biol. 1987, 124, 473–483. [Google Scholar] [CrossRef]
- Erez, A.; Fishman, S.; Linsley-Noakes, G.; Allan, P. The dynamic model for rest completion in peach buds; 1989; pp. 165–174. [Google Scholar]
- Bradbury, P.J.; Zhang, Z.; Kroon, D.E.; Casstevens, T.M.; Ramdoss, Y.; Buckler, E.S. TASSEL: software for association mapping of complex traits in diverse samples. Bioinformatics 2007, 23, 2633–2635. [Google Scholar] [CrossRef]
- Salazar, J.A.; Ortuño-Hernández, G.; Rubio, M.; Martínez-Gómez, P.; Ruiz, D. GBS-based marker–trait association and genetic mapping for enhanced QTL significance in apricot progenies (Prunus armeniaca L.). Fruit. Res. 2026, 6, e002. [Google Scholar] [CrossRef]
- Campoy, J.A.; Sun, H.; Goel, M.; Jiao, W.-B.; Folz-Donahue, K.; Wang, N.; Rubio, M.; Liu, C.; Kukat, C.; Ruiz, D.; Huettel, B.; Schneeberger, K. Gamete binning: chromosome-level and haplotype-resolved genome assembly enabled by high-throughput single-cell sequencing of gamete genomes. Genome Biol. 2020, 21, 306. [Google Scholar] [CrossRef]
- Luedeling, E.; Caspersen, L.; Fernandez, E. chillR: statistical methods for phenology analysis in temperate fruit trees. R package version 075; 2023. [Google Scholar]
Figure 1.
Schematic representation of adaptation traits in the apricot flowering and fruiting.
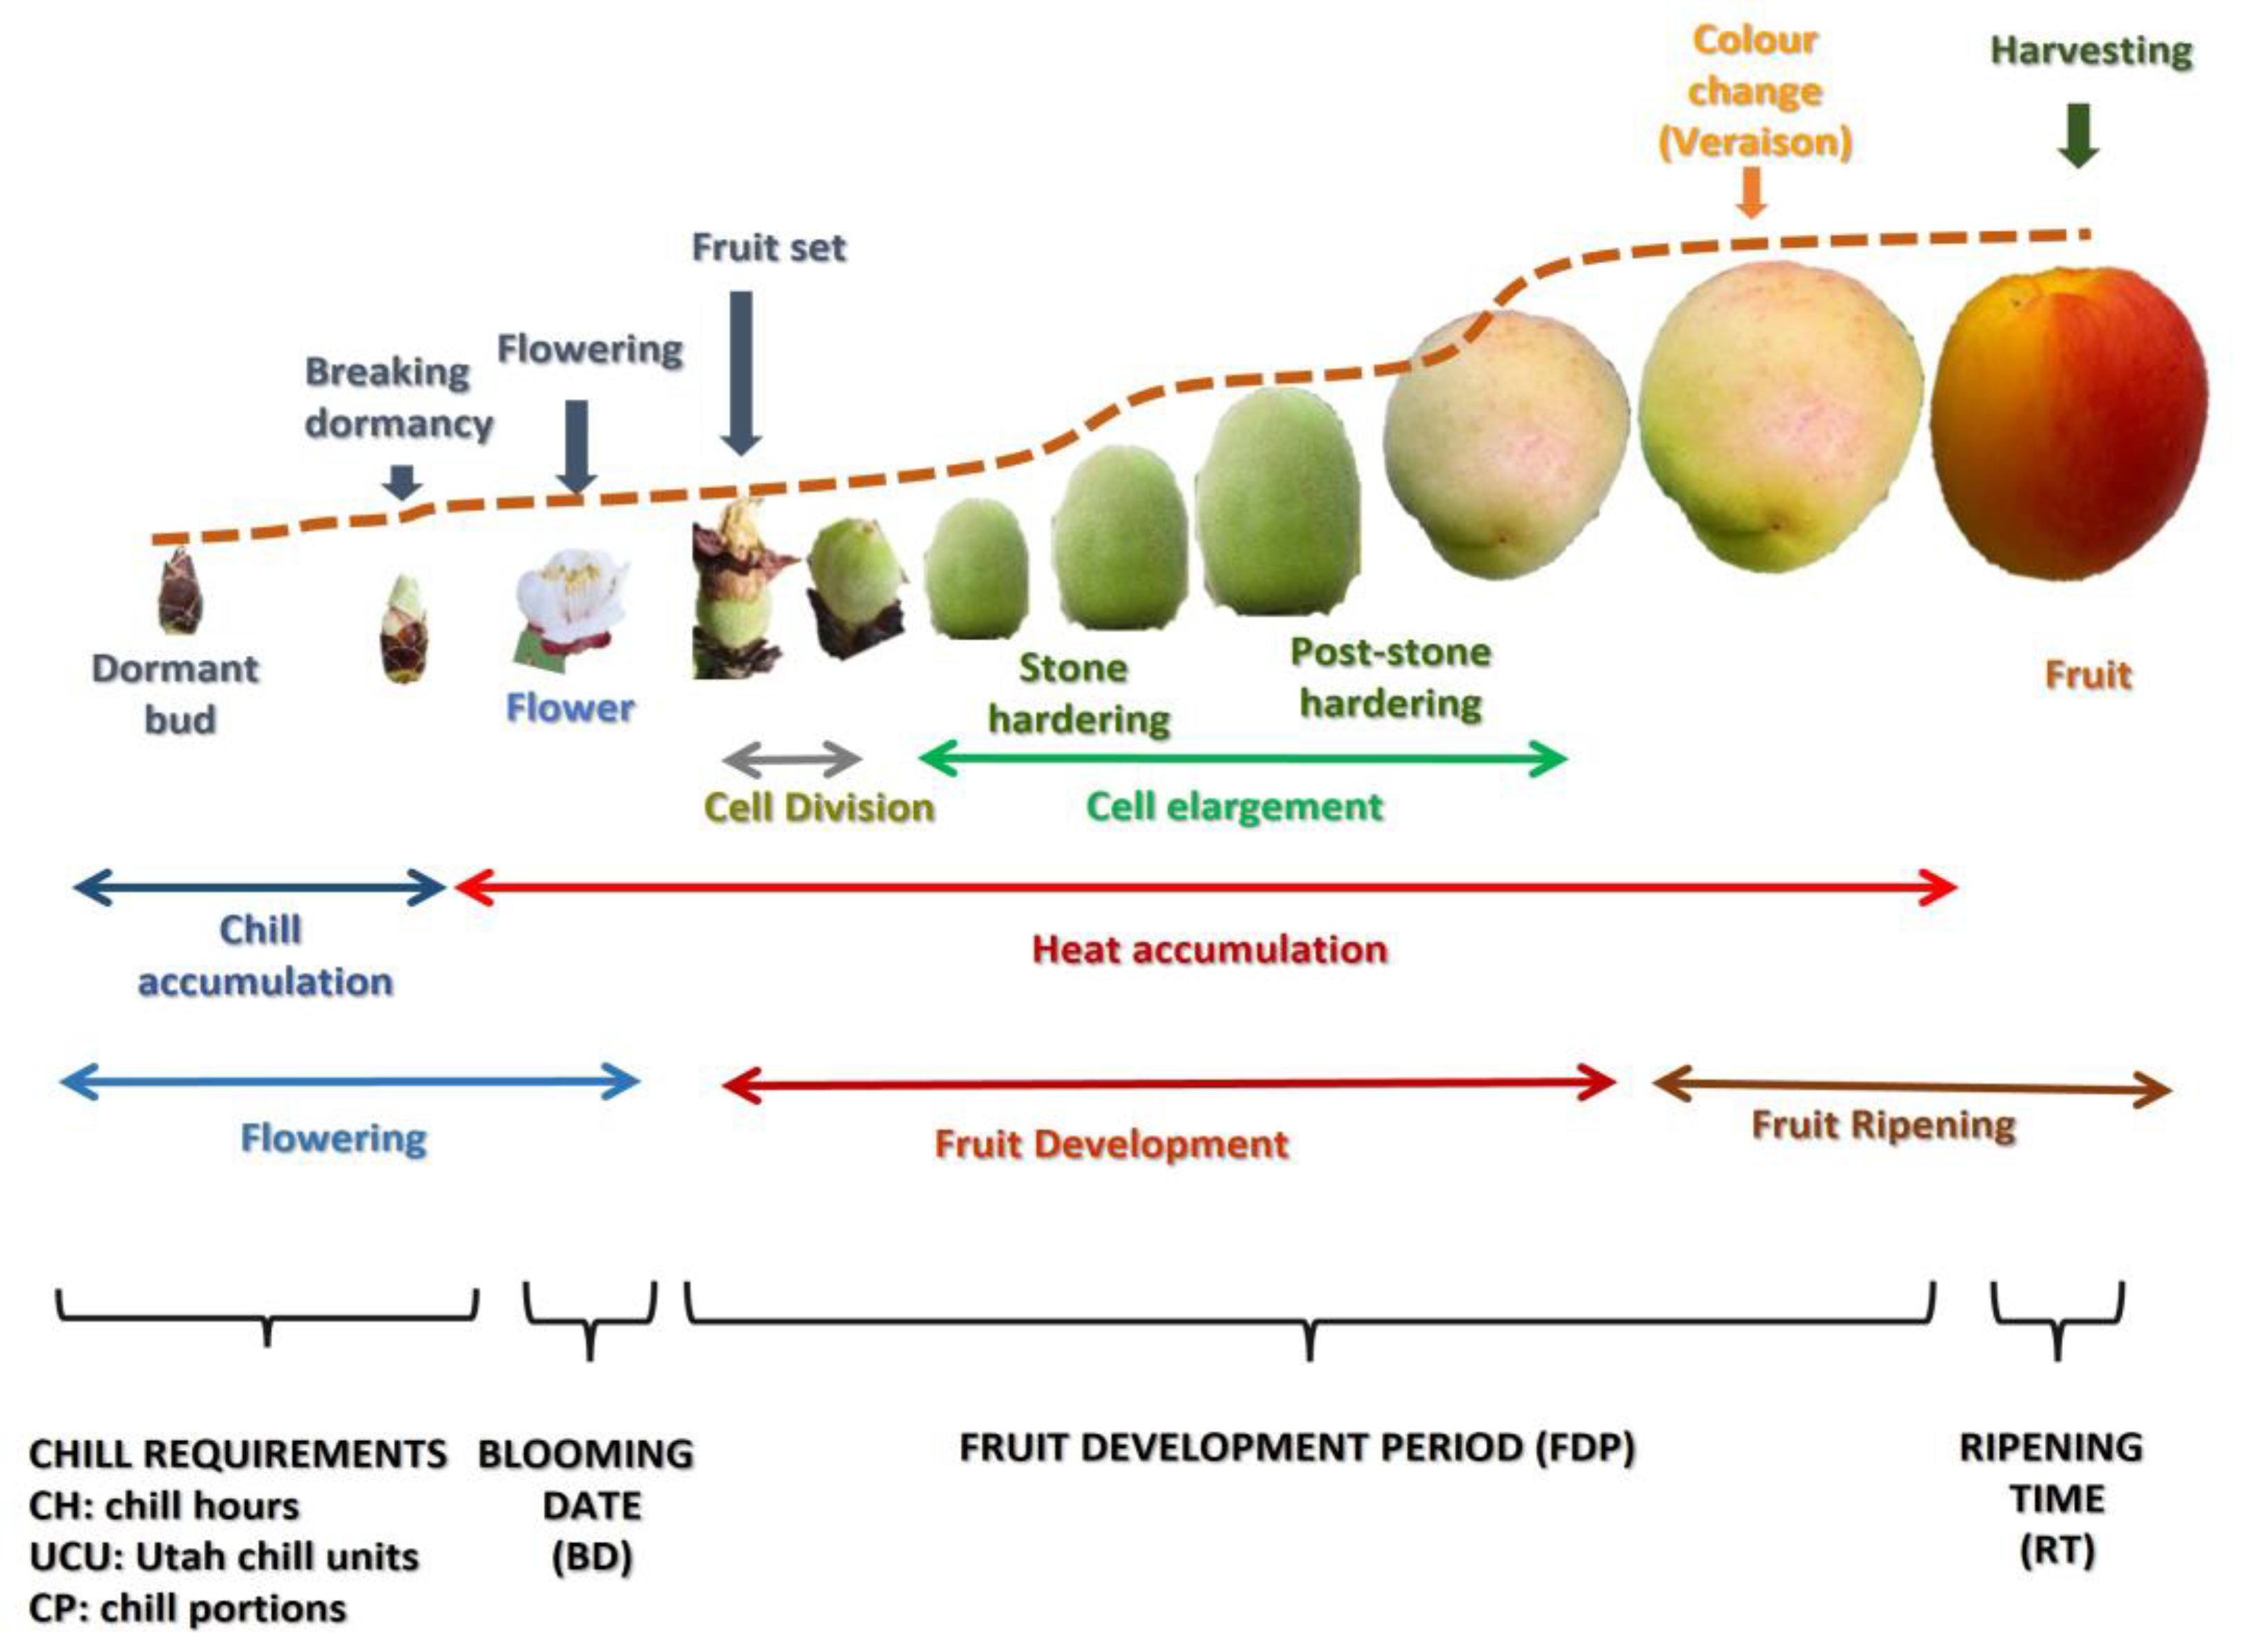
Figure 2.
A) Manhattan plot of genome-wide association analysis for BD in ‘BxC’ population. B) Table of the most significant SNPs and trait distribution by SNP genotype in violin plot.
Figure 2.
A) Manhattan plot of genome-wide association analysis for BD in ‘BxC’ population. B) Table of the most significant SNPs and trait distribution by SNP genotype in violin plot.
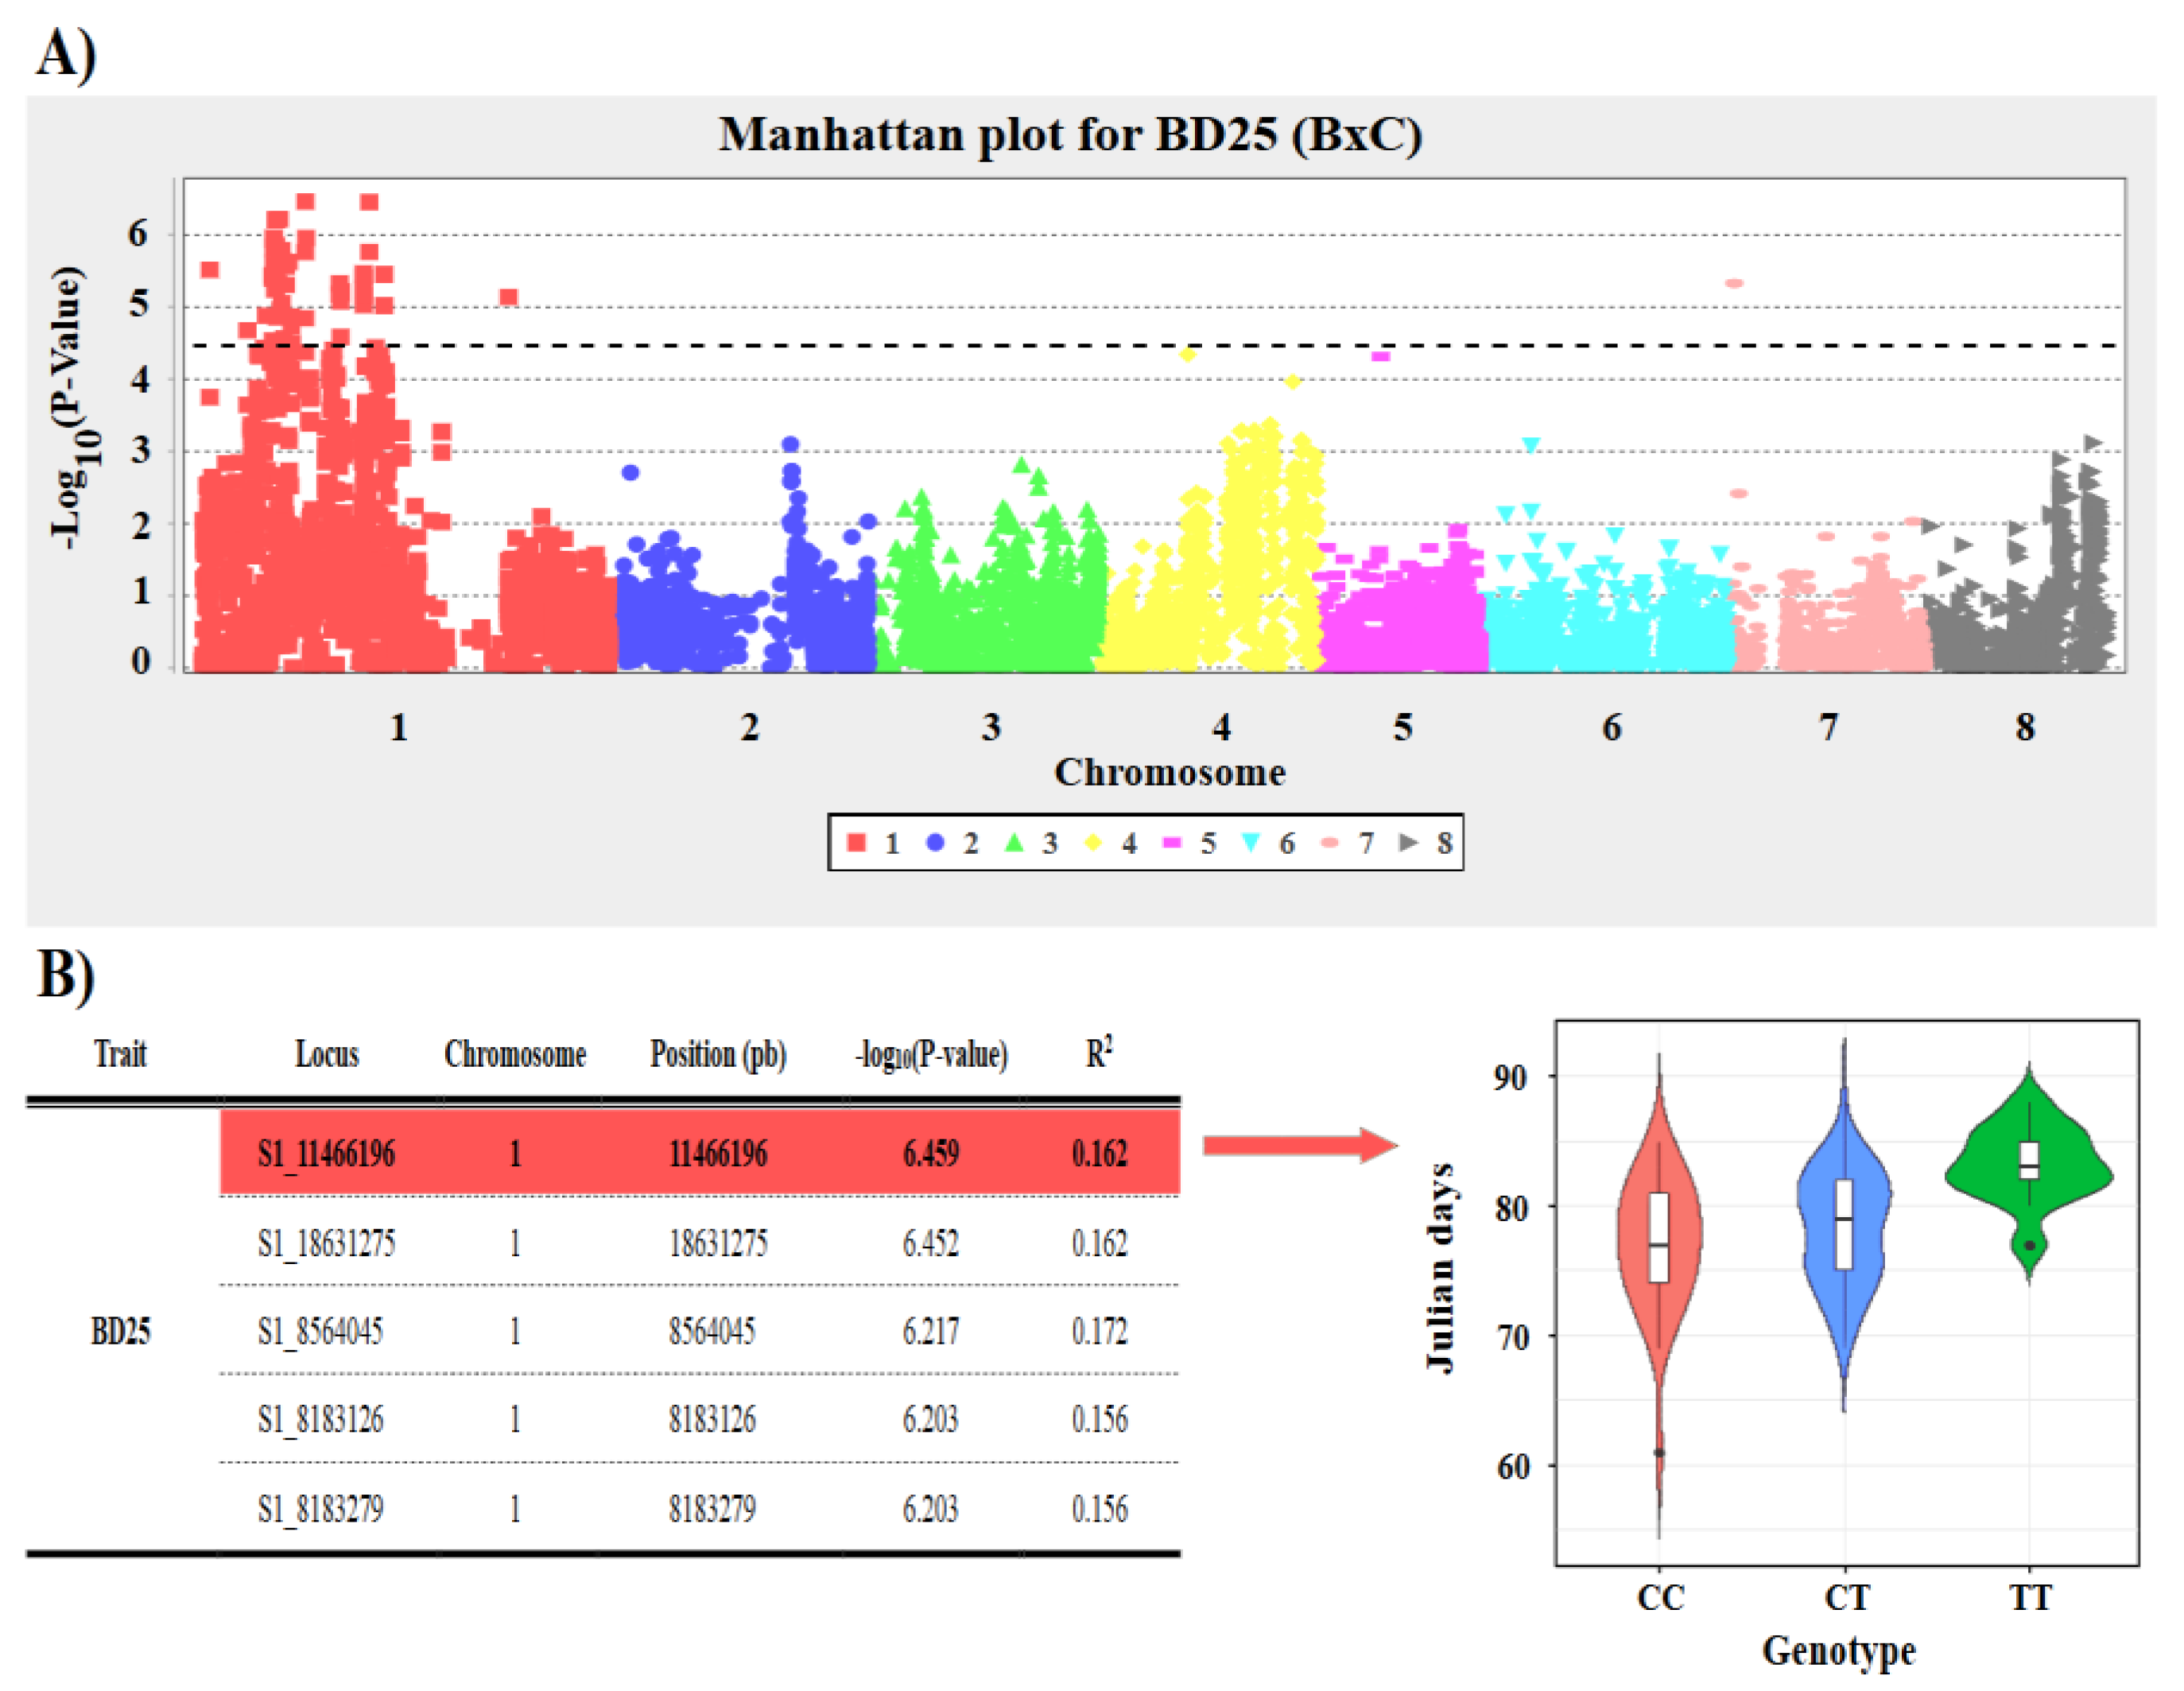
Figure 3.
A) Manhattan plot of genome-wide association analysis for CP in ‘BxC’ population. B) Table of the most significant SNPs and trait distribution by SNP genotype in violin plot.
Figure 3.
A) Manhattan plot of genome-wide association analysis for CP in ‘BxC’ population. B) Table of the most significant SNPs and trait distribution by SNP genotype in violin plot.
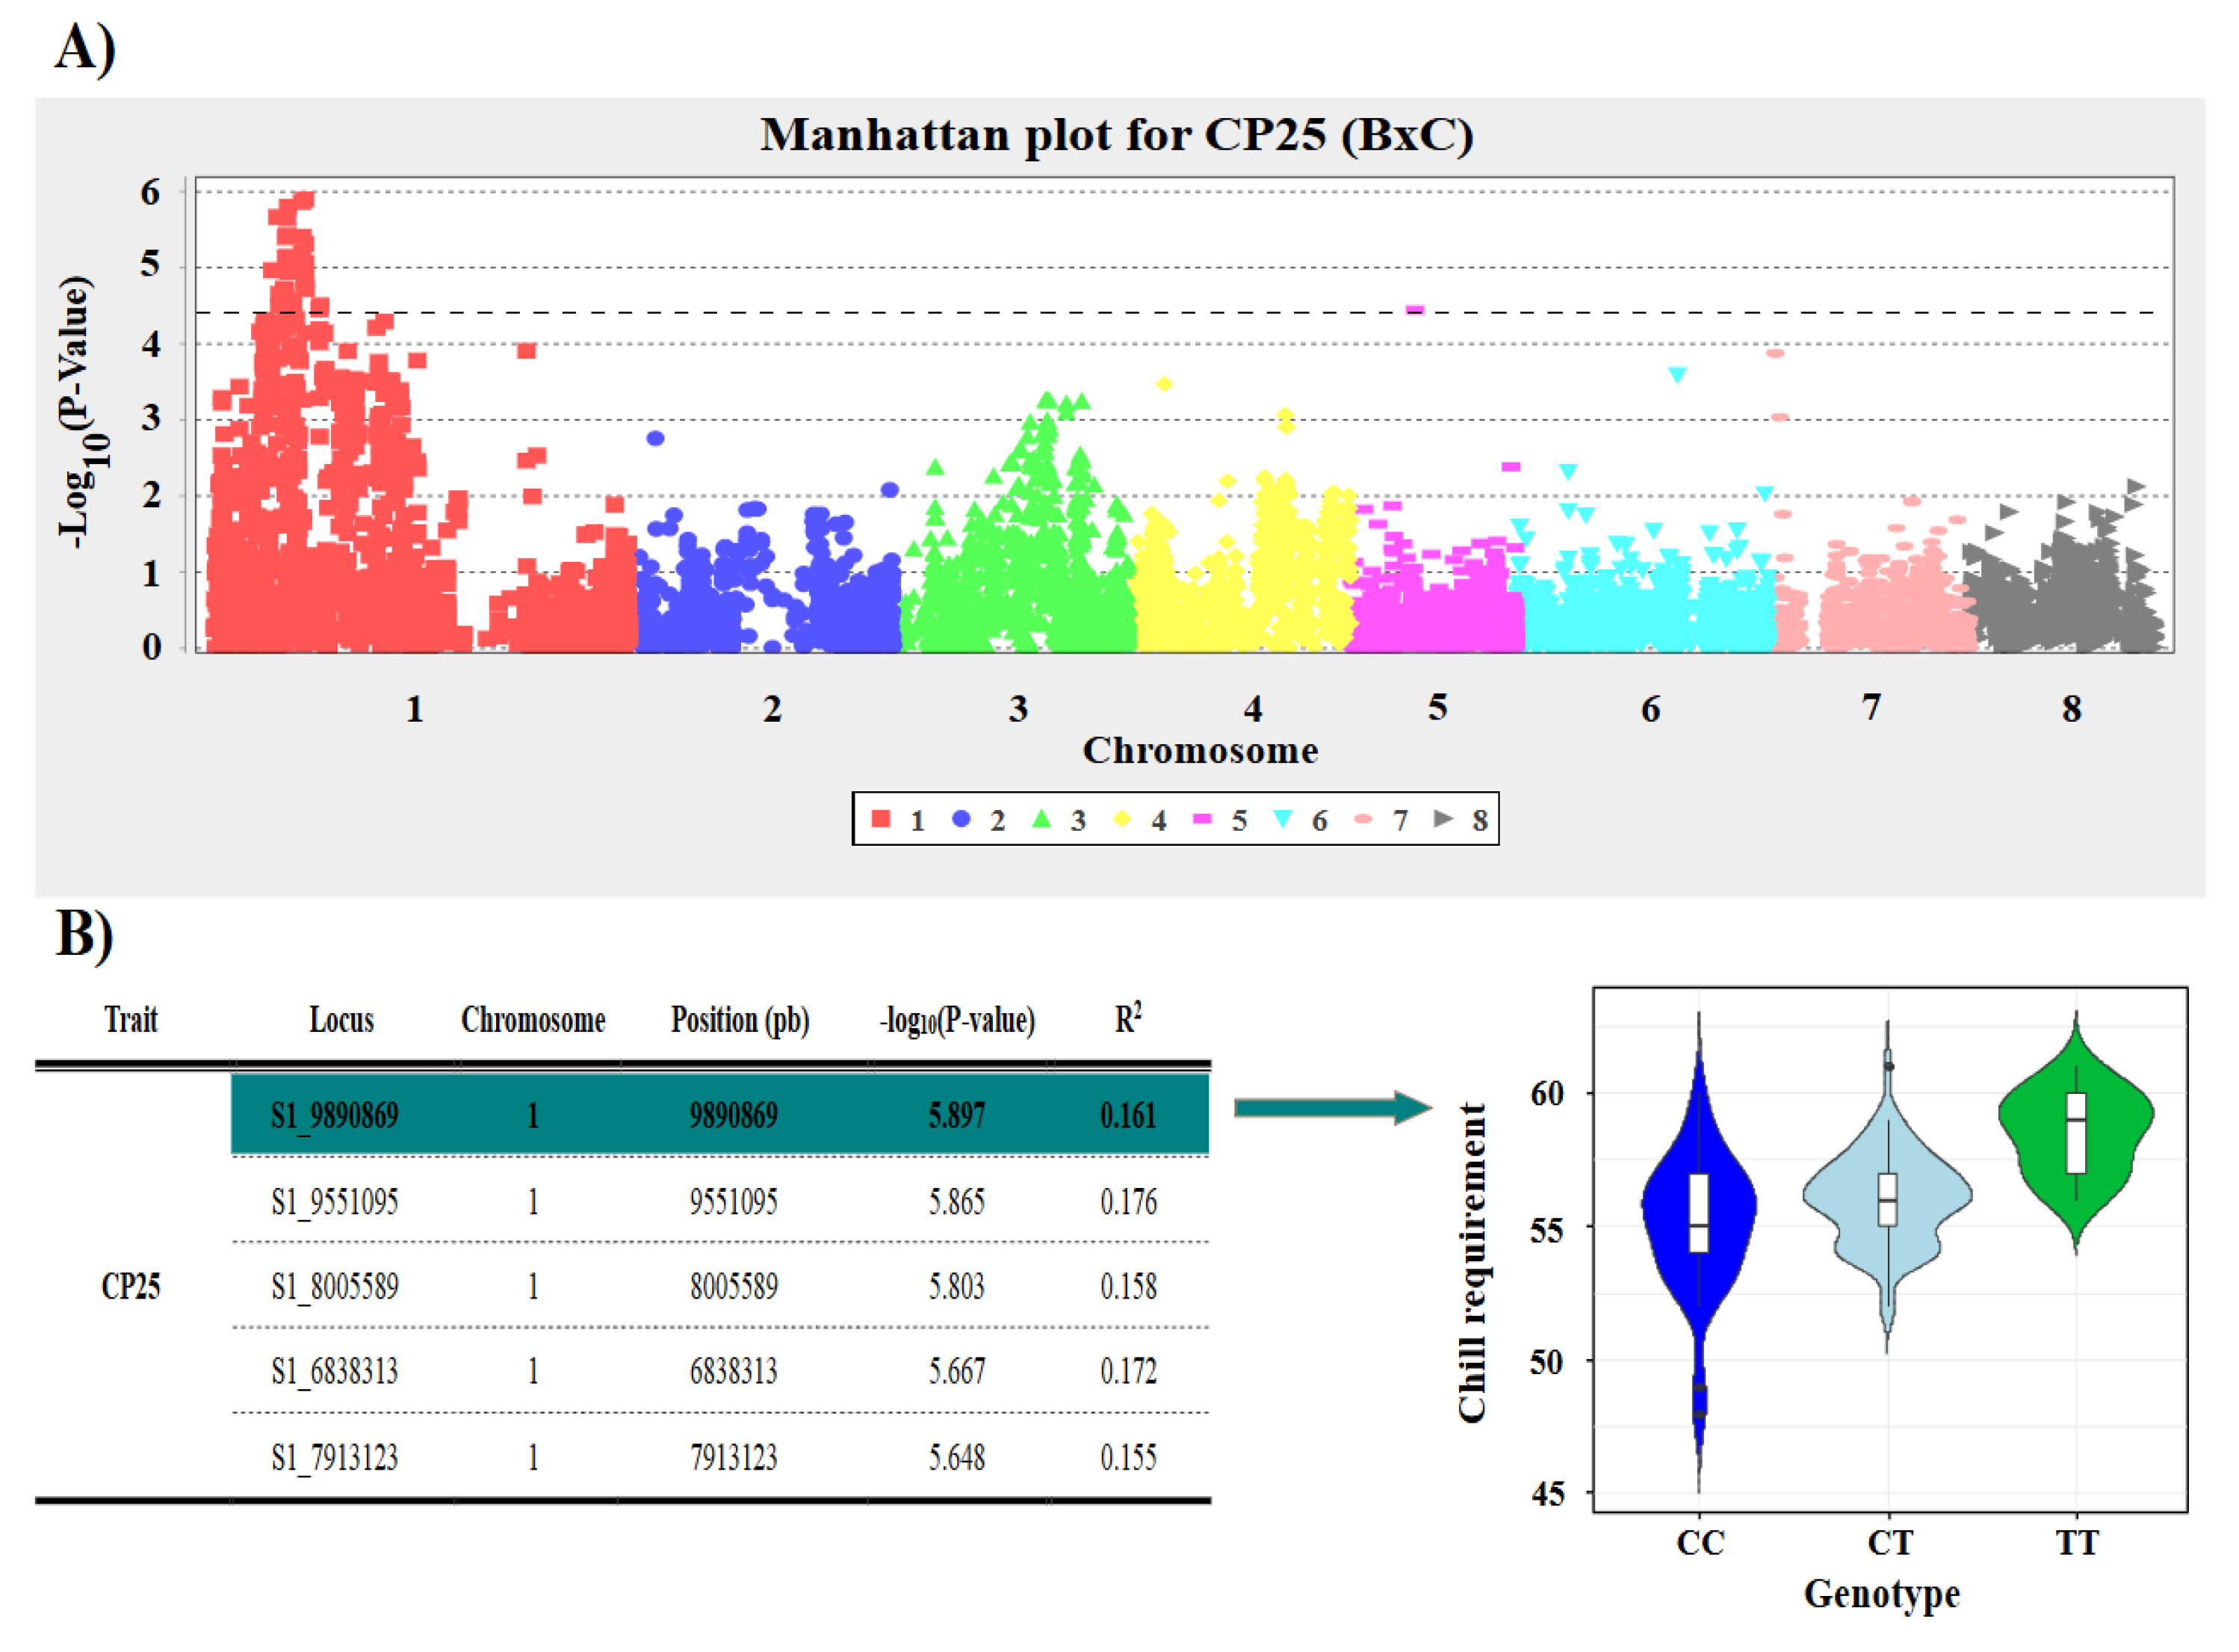
Figure 4.
A) Manhattan plot of genome-wide association analysis for CP in ‘GxC’ population. B) Table of the most significant SNPs and trait distribution by SNP genotype in violin plot.
Figure 4.
A) Manhattan plot of genome-wide association analysis for CP in ‘GxC’ population. B) Table of the most significant SNPs and trait distribution by SNP genotype in violin plot.
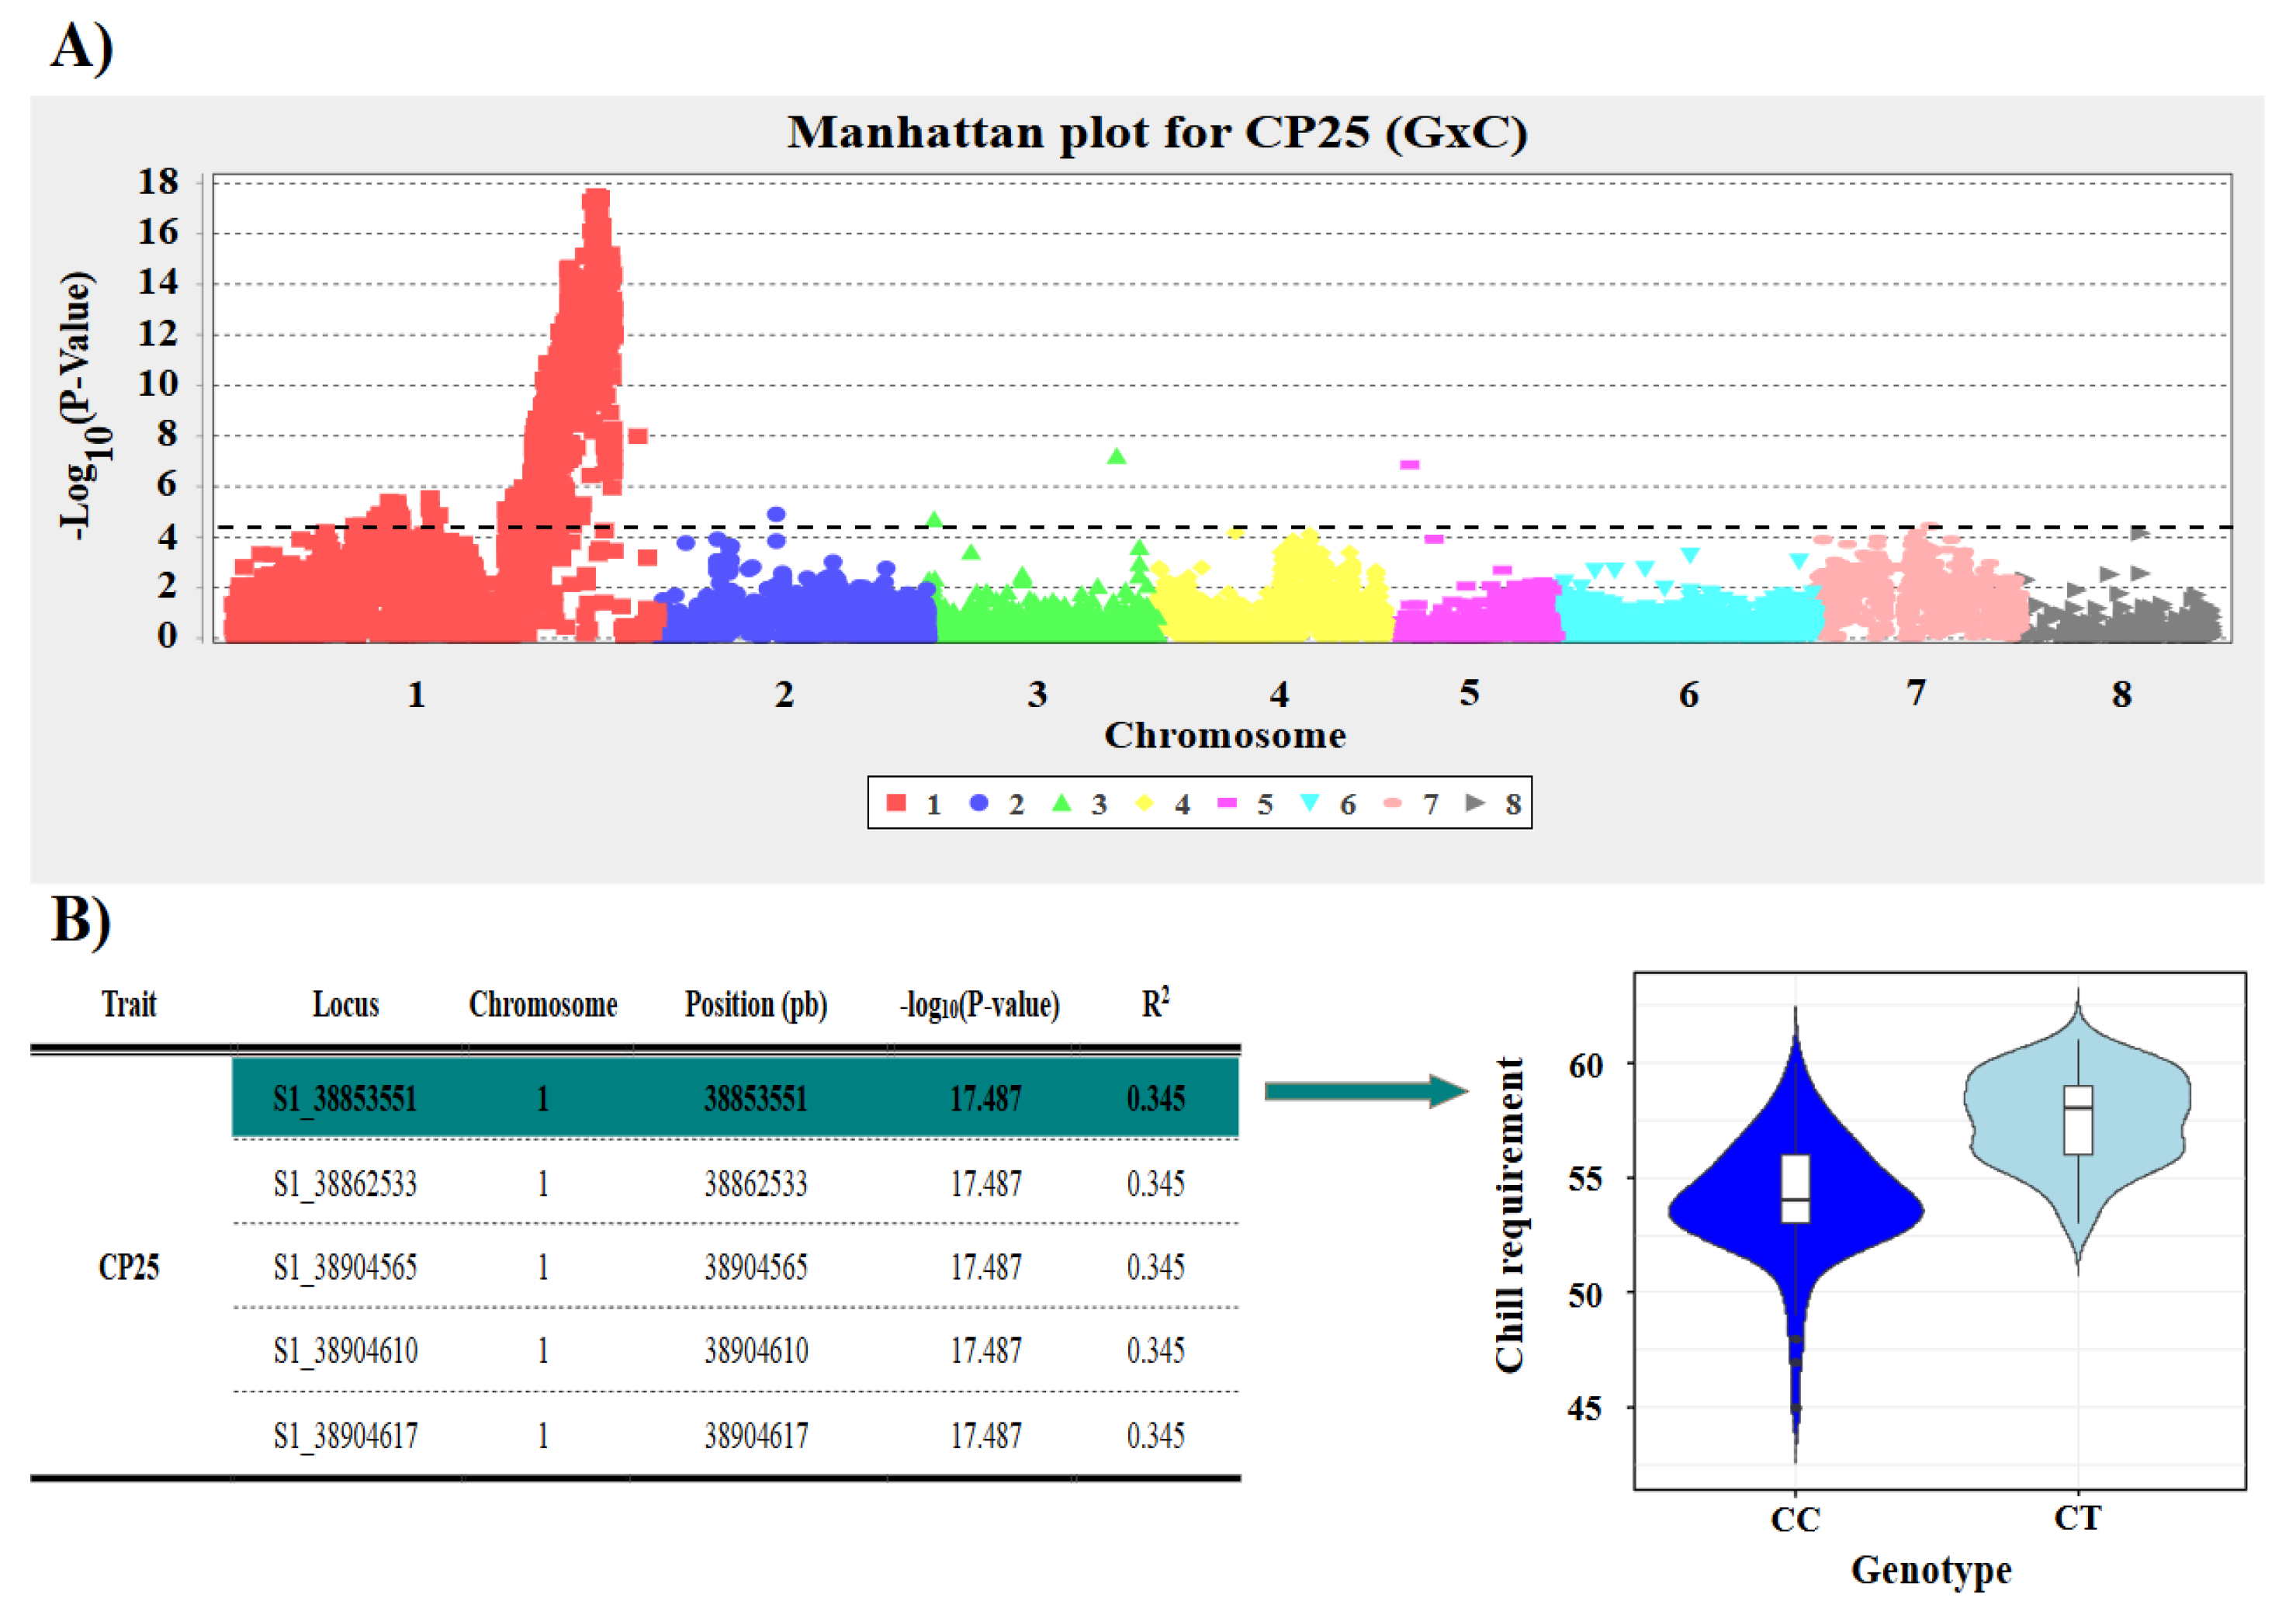
Figure 5.
A) Manhattan plot of genome-wide association analysis for BD in ‘GxC’ population. B) Table of the most significant SNPs and trait distribution by SNP genotype in violin plot.
Figure 5.
A) Manhattan plot of genome-wide association analysis for BD in ‘GxC’ population. B) Table of the most significant SNPs and trait distribution by SNP genotype in violin plot.
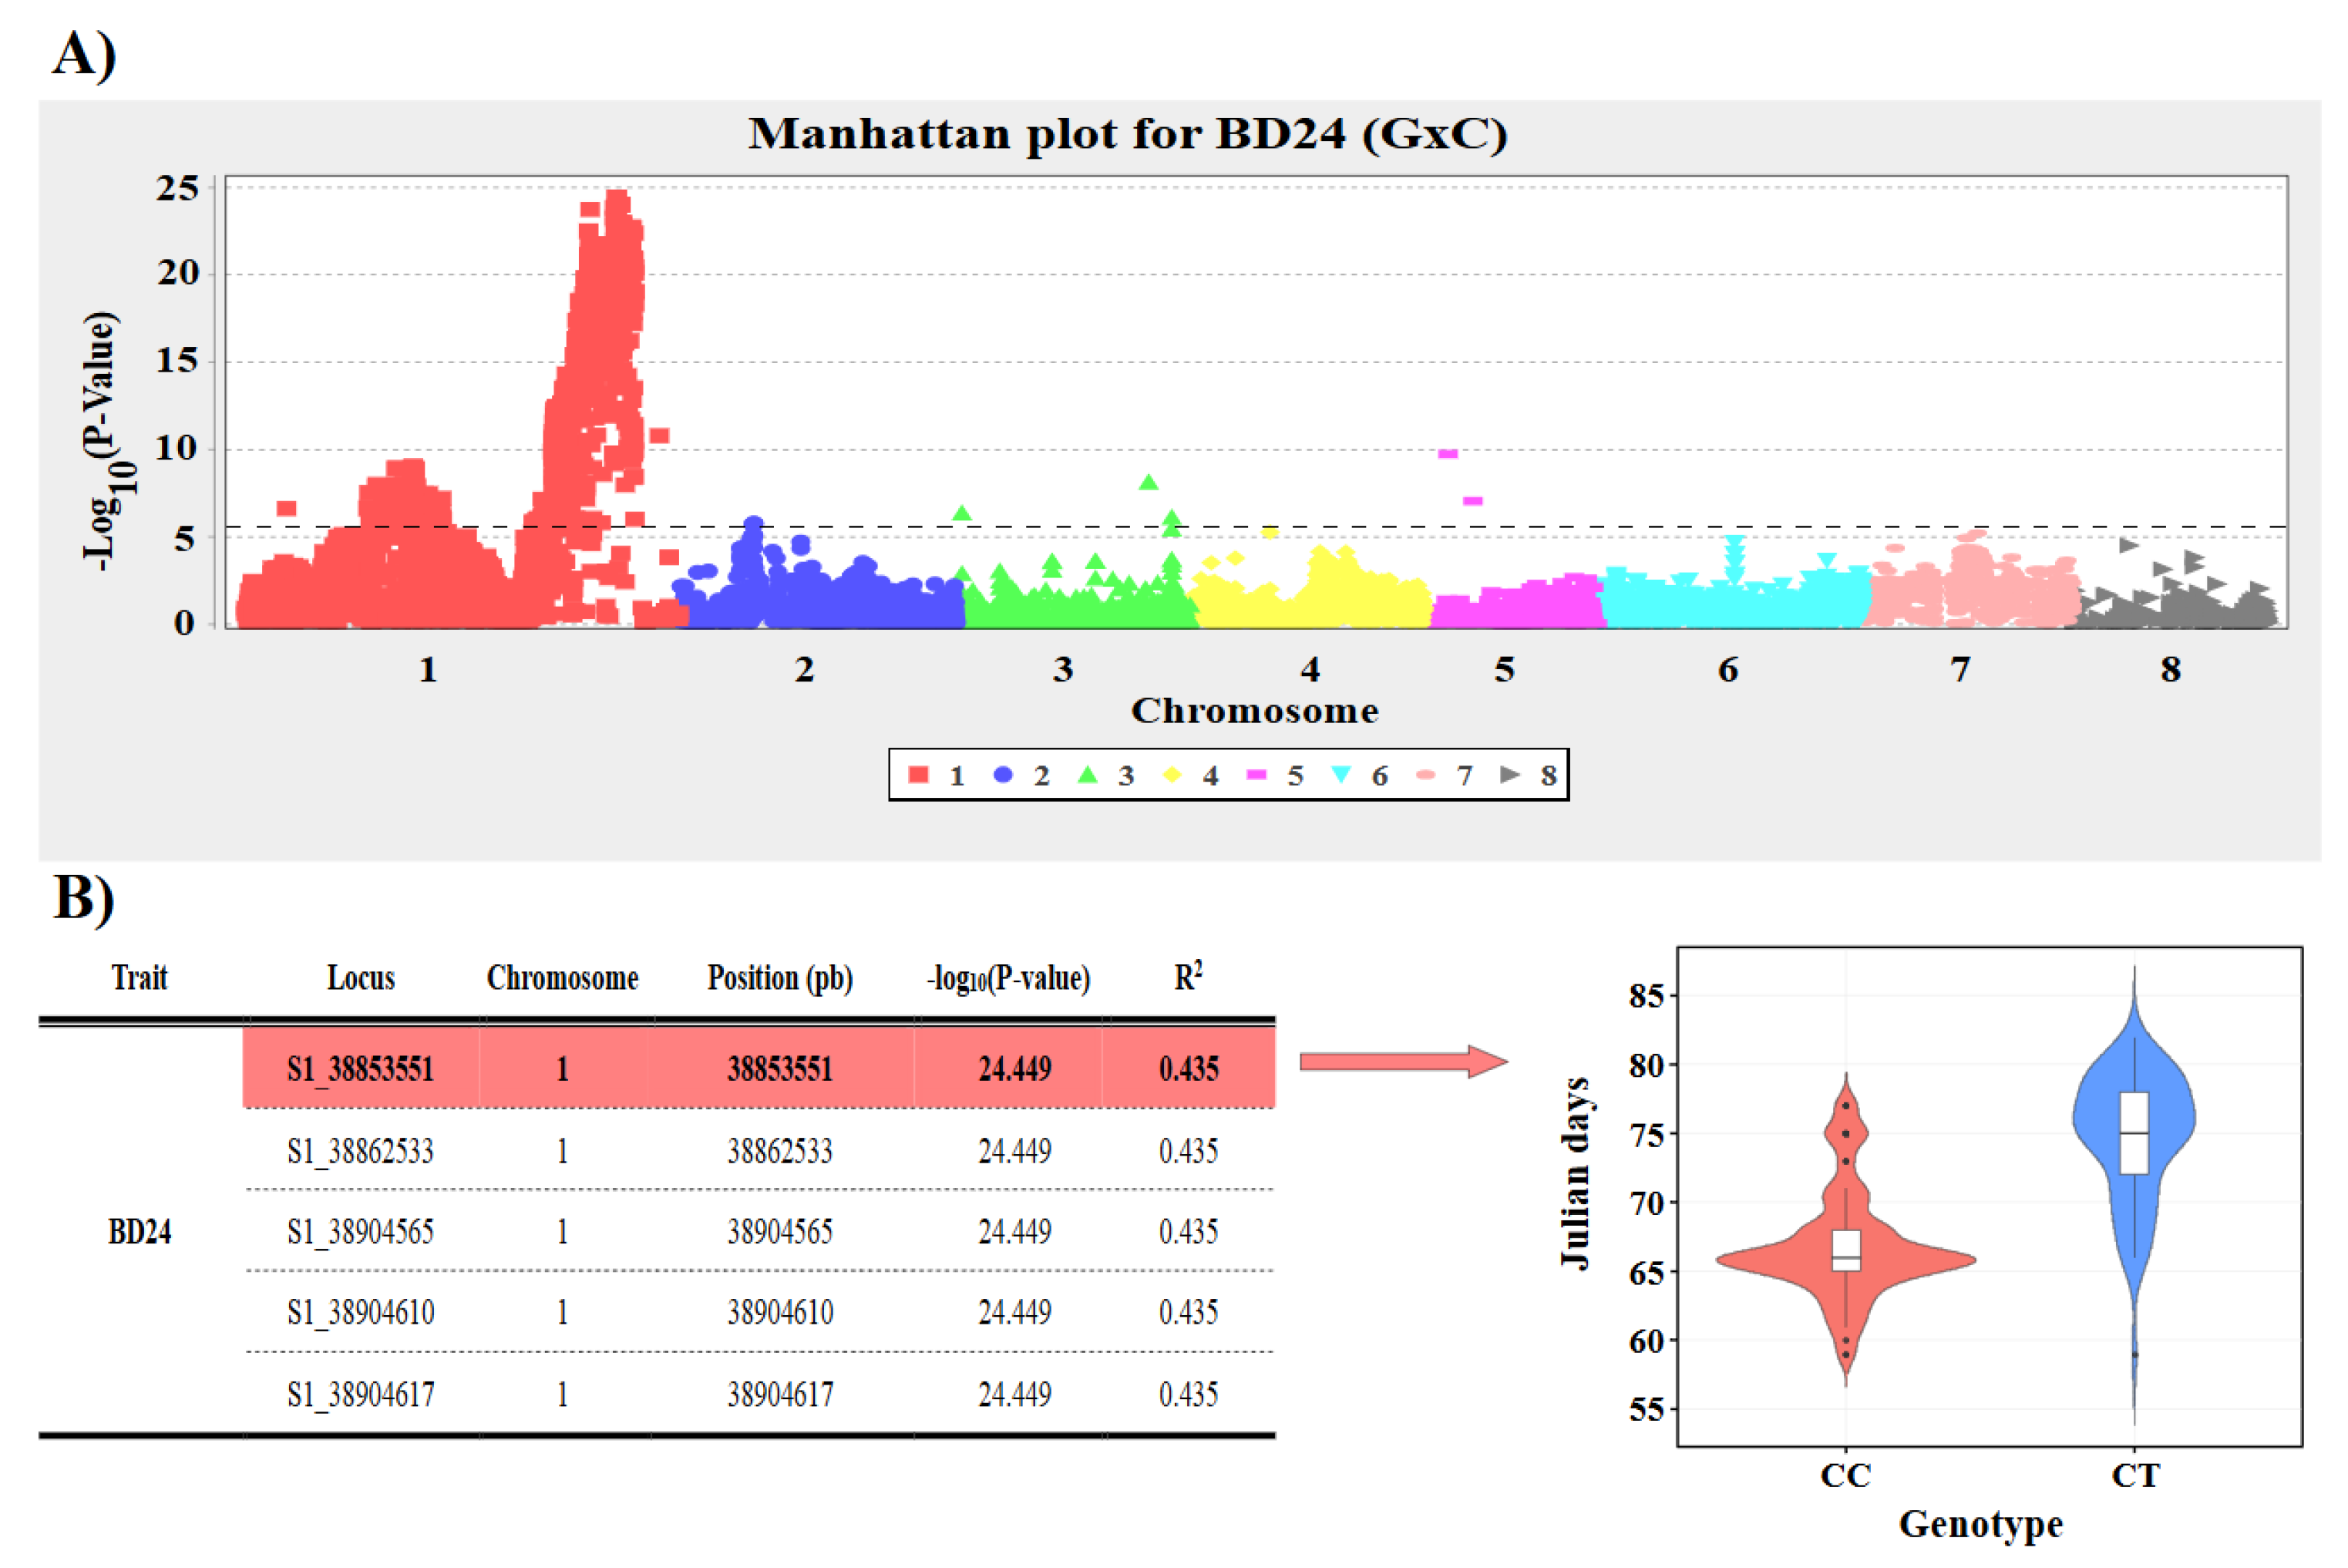
Figure 7.
A) Manhattan plot of genome-wide association analysis for RT in ‘GxC’ population. B) Table of the most significant SNPs and trait distribution by SNP genotype in violin plot.
Figure 7.
A) Manhattan plot of genome-wide association analysis for RT in ‘GxC’ population. B) Table of the most significant SNPs and trait distribution by SNP genotype in violin plot.
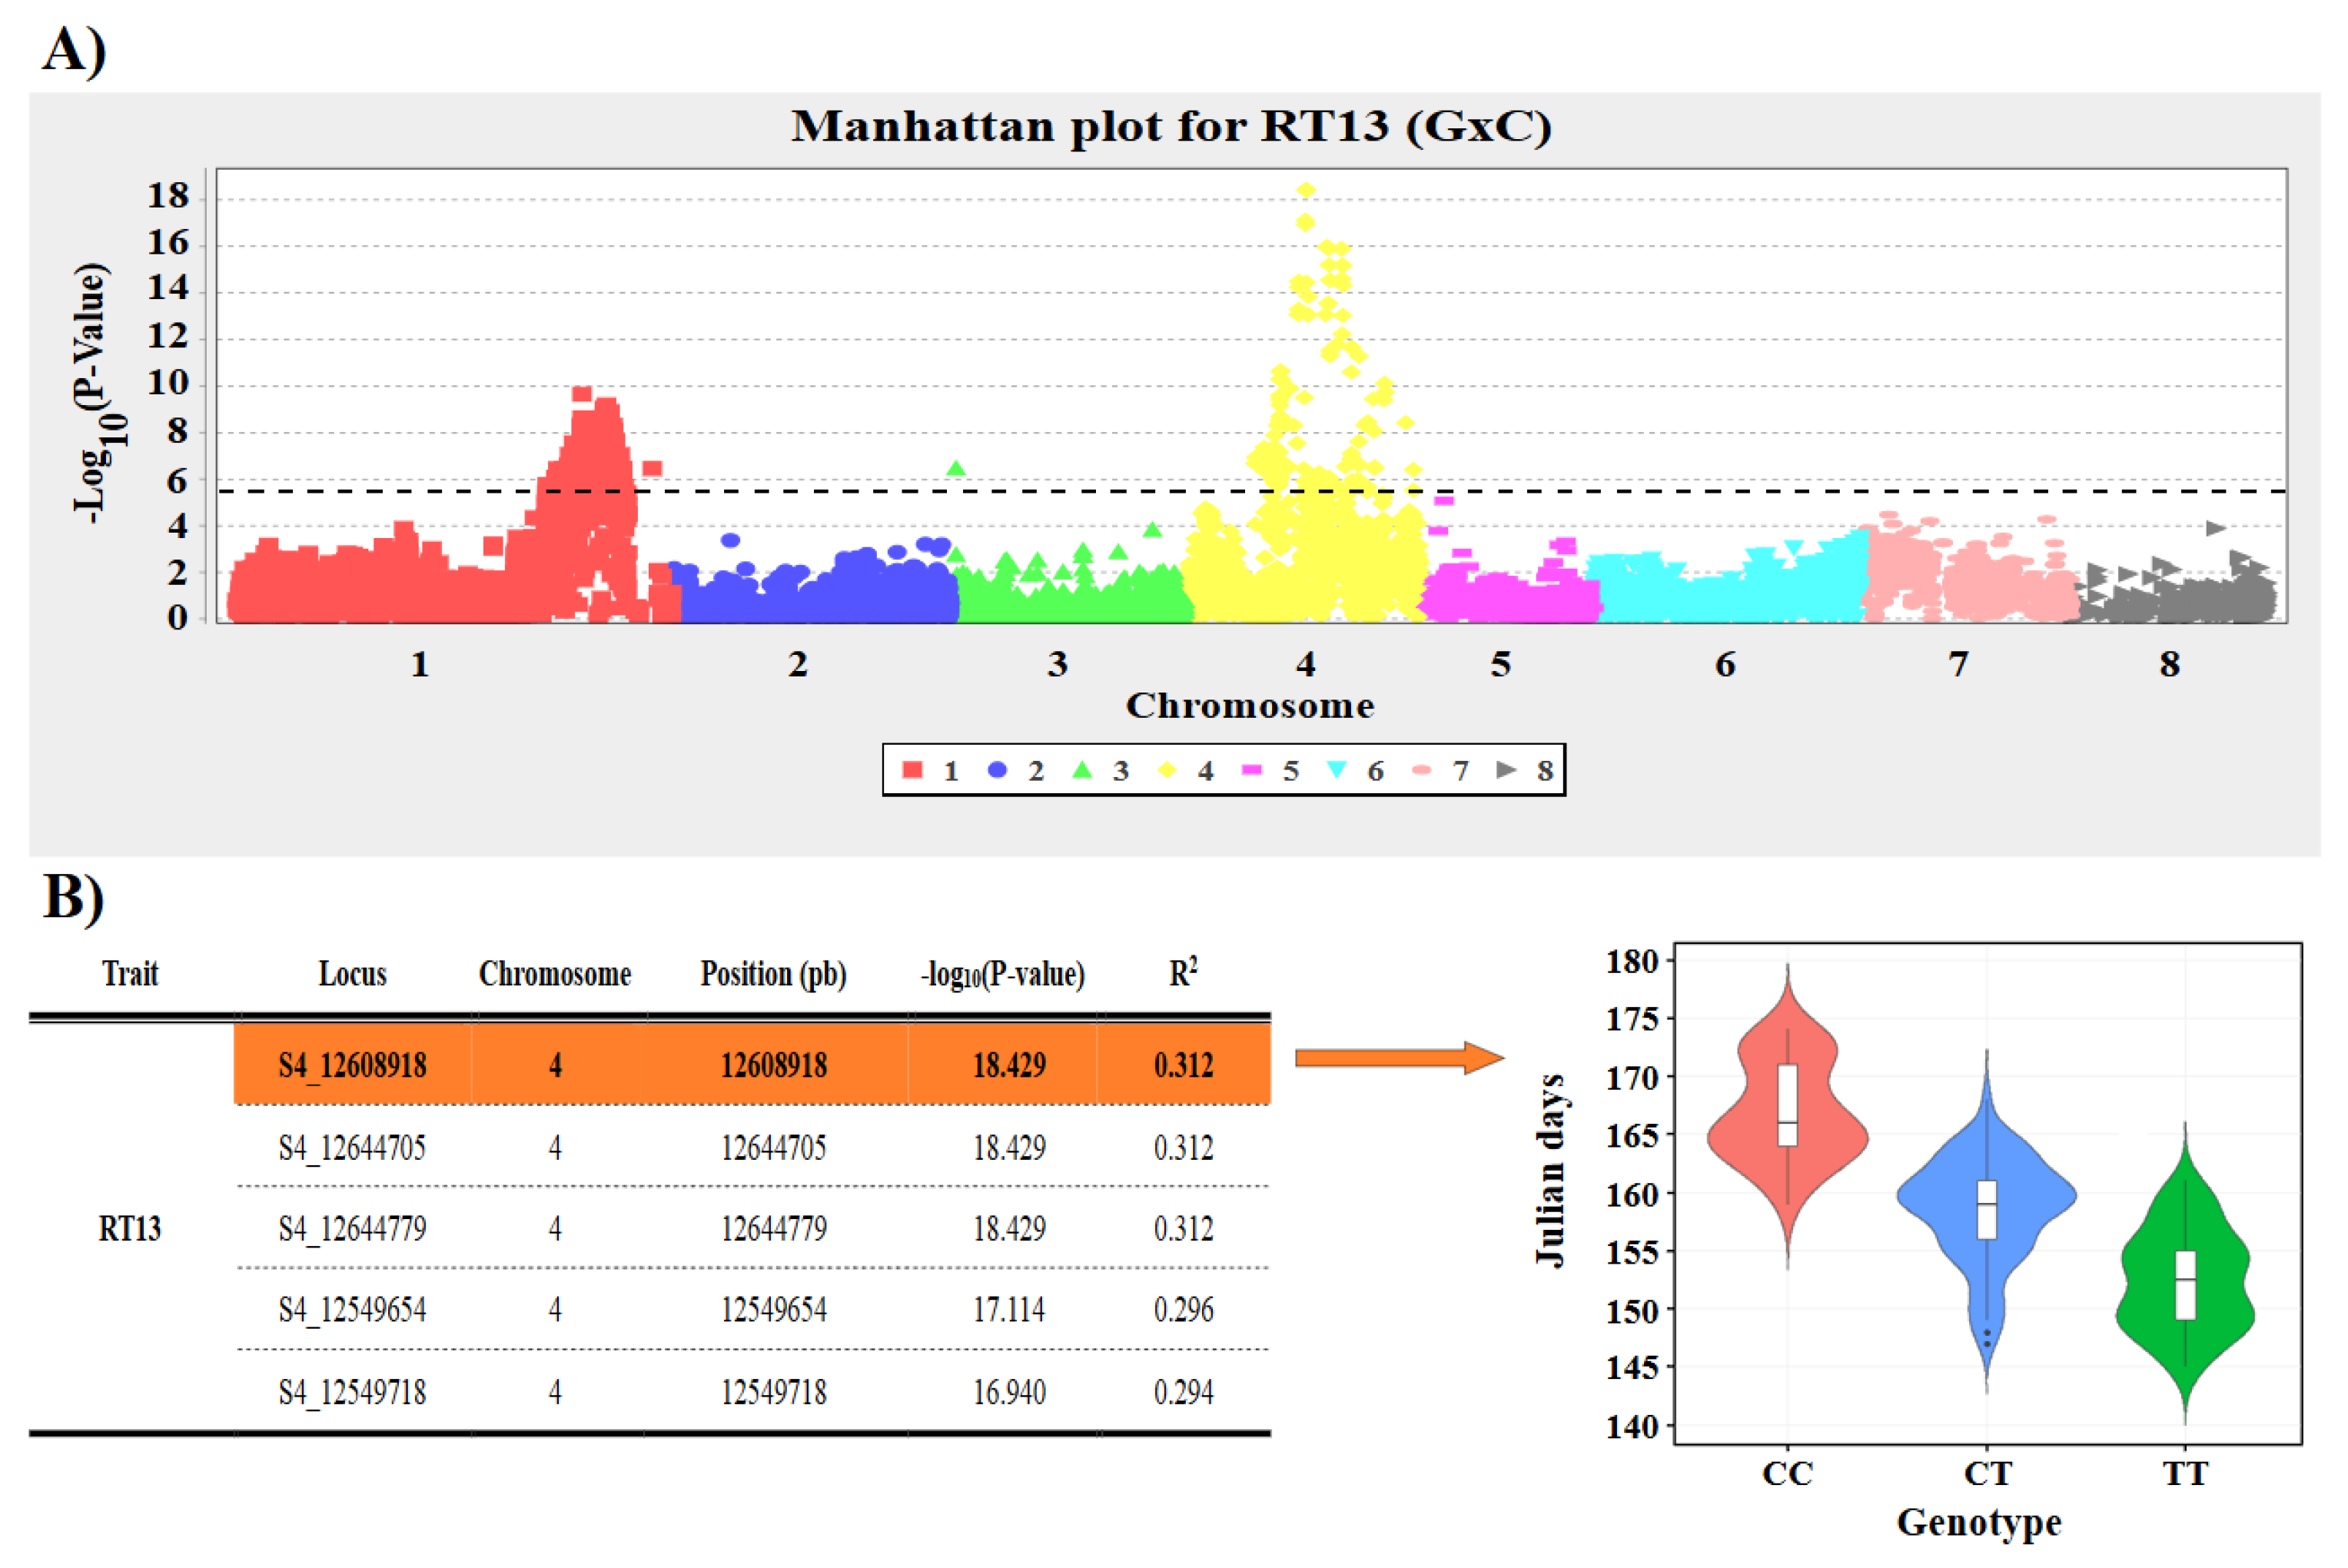

Table 1.
QTLs identified in the ‘Bergeron’ parent from the ‘B×C’ cross for phenology traits.
| ‘Bergeron’ (‘BxC’) Traitsa |
LG | Position (cM) | Locus | LODb | Kc | PEVd |
|---|---|---|---|---|---|---|
| CH12 | 1 | 21.014 | S1_9890869 | 5.3 | 24.5 | 17.6 |
| CH24 | 1 | 21.014 | S1_9890869 | 5.1 | 24.3 | 17.1 |
| CH25 | 1 | 21.014 | S1_9890869 | 5.8 | 39.4 | 19.0 |
| UCU25 | 1 | 81.657 | S1_36674940 | 5.8 | 15.6 | 19.0 |
| CP24 | 1 | 21.014 | S1_9890869 | 5.2 | 22.6 | 17.3 |
| CP25 | 1 | 21.014 | S1_9890869 | 10.4 | 38.2 | 31.6 |
| BD12 | 7 | 32.071 | S7_15878965 | 6.5 | 27.1 | 19.9 |
| BD13 | 1 | 98.262 | S1_42896153 | 5.4 | 19.4 | 17.0 |
| BD14 | 7 | 38.592 | S7_17185342 | 5.9 | 25.1 | 18.5 |
| BD21 | 1 | 21.014 | S1_9890869 | 7.0 | 29.0 | 21.6 |
| BD22 | 4 | 59.141 | S4_22646518 | 5.9 | 15.7 | 18.9 |
| BD23 | 7 | 40.827 | S7_18085942 | 5.4 | 17.8 | 17.0 |
| BD24 | 1 | 21.014 | S1_9890869 | 6.4 | 25.6 | 20.1 |
| BD25 | 1 | 21.014 | S1_9890869 | 7.3 | 29.2 | 23.1 |
| FDP12 | 4 | 48.887 | S4_12380084 | 9.0 | 37.6 | 26.7 |
| FDP13 | 4 | 49.376 | S4_12383019 | 5.4 | 22.6 | 17.0 |
| FDP14 | 4 | 48.800 | S4_12377040 | 8.6 | 33.8 | 25.6 |
| FDP21 | 4 | 41.021 | S4_10082360 | 5.5 | 17.4 | 17.8 |
| FDP22 | 4 | 43.186 | S4_11065125 | 13.3 | 42.8 | 39.1 |
| FDP23 | 4 | 41.021 | S4_10082360 | 7.7 | 26.3 | 23.6 |
| FDP24 | 4 | 38.312 | S4_9749496 | 7.5 | 17.7 | 23.3 |
| FDP25 | 4 | 43.186 | S4_11065125 | 9.2 | 35.8 | 28.3 |
| RT12 | 4 | 48.887 | S4_12380084 | 7.7 | 30.5 | 23.1 |
| RT13 | 4 | 48.887 | S4_12380084 | 7.9 | 32.3 | 23.6 |
| RT14 | 4 | 48.800 | S4_12377040 | 9.4 | 30.9 | 27.8 |
| RT21 | 4 | 48.887 | S4_12380084 | 6.3 | 24.0 | 20.1 |
| RT22 | 4 | 39.977 | S4_9840503 | 8.7 | 20.2 | 27.2 |
| RT23 | 4 | 48.887 | S4_12380084 | 7.2 | 29.0 | 22.5 |
| RT24 | 4 | 48.887 | S4_12380084 | 6.7 | 27.6 | 20.9 |
| RT25 | 4 | 48.887 | S4_12380084 | 8.0 | 29.5 | 24.2 |
a CH: chill hours, UCU: Utah chill units, CP: chill portions, BD: blooming date, FDP: fruit development period, RT: ripening time, b ’LOD’ represents the statistic obtained from the interval mapping test. c ’K’ refers to the statistic derived from the Kruskal-Wallis test. d ’PEV’ indicates the percentage of phenotypic variation explained by the marker.
Table 2.
QTLs identified in the ‘Currot’ parent from the ‘B×C’ cross for phenology traits.
| ‘Currot’ (‘BxC’) Traitsa |
LG | Position (cM) | Locus | LODb | Kc | PEVd |
|---|---|---|---|---|---|---|
| CH12 | 1 | 52.814 | S1_13528605 | 5.9 | 24.9 | 19.5 |
| CH24 | 1 | 52.814 | S1_13528605 | 6.3 | 26.7 | 20.5 |
| CP24 | 1 | 52.814 | S1_13528605 | 6.6 | 25.9 | 21.3 |
| CP25 | 1 | 46.784 | S1_9928286 | 9.1 | 35.1 | 28.3 |
| BD12 | 7 | 42.204 | S7_16347087 | 7.2 | 14.1 | 21.9 |
| BD13 | 7 | 39.646 | S7_15373247 | 4.9 | 12.8 | 15.4 |
| BD14 | 7 | 39.646 | S7_15373247 | 5.6 | 26.8 | 17.5 |
| BD21 | 1 | 46.784 | S1_9928286 | 6.9 | 27.2 | 21.5 |
| BD22 | 4 | 58.528 | S4_16316561 | 5.4 | 19.4 | 17.5 |
| BD24 | 1 | 46.784 | S1_9928286 | 6.1 | 22.4 | 19.3 |
| BD25 | 1 | 46.784 | S1_9928286 | 6.9 | 26.8 | 21.9 |
| RT12 | 4 | 54.858 | S4_14749428 | 6.8 | 21.7 | 20.8 |
| FDP12 | 4 | 48.669 | S4_12421090 | 11.2 | 35.1 | 31.9 |
| FDP13 | 4 | 48.669 | S4_12421090 | 8.4 | 20.8 | 25.1 |
| FDP14 | 4 | 48.669 | S4_12421090 | 9.0 | 35.1 | 26.9 |
| FDP21 | 4 | 43.277 | S4_10232868 | 6.1 | 14.0 | 19.7 |
| FDP22 | 4 | 48.669 | S4_12421090 | 15.6 | 18.4 | 43.9 |
| FDP23 | 4 | 43.277 | S4_10232868 | 8.0 | 29.3 | 24.5 |
| FDP24 | 4 | 48.669 | S4_12421090 | 9.2 | 17.0 | 27.9 |
| FDP25 | 4 | 48.669 | S4_12421090 | 11.3 | 15.0 | 33.4 |
| RT13 | 4 | 54.858 | S4_14749428 | 6.9 | 25.7 | 21.1 |
| RT14 | 4 | 54.795 | S4_14709453 | 7.3 | 14.5 | 22.3 |
| RT21 | 4 | 54.858 | S4_14749428 | 5.6 | 12.3 | 18.0 |
| RT22 | 4 | 54.858 | S4_14749428 | 7.0 | 22.2 | 22.6 |
| RT23 | 4 | 55.573 | S4_14759605 | 6.1 | 12.4 | 19.3 |
| RT24 | 4 | 54.757 | S4_14564191 | 7.0 | 18.9 | 21.9 |
| RT25 | 4 | 54.757 | S4_14564191 | 6.1 | 20.2 | 18.9 |
a CH: chill hours, CP: chill portions, BD: blooming date, FDP: fruit development period, RT: ripening time. b ’LOD’ represents the statistic obtained from the interval mapping test. c ’K’ refers to the statistic derived from the Kruskal-Wallis test. d ’PEV’ indicates the percentage of phenotypic variation explained by the marker.
Table 3.
QTLs identified in the ‘Goldrich’ parent from the ‘G×C’ cross for phenology traits.
| ‘Goldrich’ (‘GxC’) Traitsa |
LG | Position (cM) | Locus | LODb | Kc | PEVd |
|---|---|---|---|---|---|---|
| CH12 | 1 | 92.558 | S1_39509319 | 6.5 | 27.2 | 17.5 |
| CH25 | 1 | 88.221 | S1_38997919 | 8.0 | 54.4 | 21.0 |
| UCU24 | 1 | 92.834 | S1_39663110 | 10.1 | 44.7 | 25.7 |
| UCU25 | 1 | 92.834 | S1_39663110 | 9.9 | 41.1 | 25.3 |
| CP25 | 1 | 88.221 | S1_38997919 | 15.0 | 55.5 | 35.7 |
| BD12 | 4 | 50.832 | S4_16824752 | 9.4 | 33.2 | 24.0 |
| BD13 | 4 | 47.832 | S4_15055783 | 10.2 | 38.3 | 25.5 |
| BD14 | 4 | 47.832 | S4_15055783 | 14.4 | 64.3 | 34.0 |
| BD21 | 1 | 87.715 | S1_38992466 | 9.4 | 41.2 | 23.8 |
| BD22 | 1 | 88.221 | S1_38997919 | 13.8 | 46.7 | 33.0 |
| BD23 | 1 | 92.834 | S1_39663110 | 11.4 | 43.0 | 28.2 |
| BD24 | 1 | 92.834 | S1_39663110 | 20.5 | 69.6 | 45.0 |
| BD25 | 1 | 88.221 | S1_38997919 | 20.9 | 67.3 | 45.4 |
| FDP12 | 4 | 40.228 | S4_11831218 | 19.3 | 60.6 | 43.0 |
| FDP13 | 4 | 40.228 | S4_11831218 | 10.3 | 27.6 | 26.0 |
| FDP14 | 4 | 47.006 | SSR4_13182815 | 6.0 | 25.2 | 16.0 |
| FDP21 | 4 | 39.159 | SSR4_10030354 | 12.5 | 47.2 | 31.7 |
| FDP22 | 4 | 40.228 | S4_11831218 | 11.4 | 28.1 | 28.6 |
| FDP23 | 4 | 47.006 | SSR4_13182815 | 8.3 | 33.1 | 21.8 |
| FDP24 | 4 | 40.228 | S4_11831218 | 8.9 | 28.3 | 23.1 |
| FDP25 | 4 | 40.228 | S4_11831218 | 8.6 | 38.5 | 22.1 |
| RT12 | 4 | 50.832 | S4_16824752 | 23.8 | 43.6 | 49.7 |
| RT13 | 4 | 47.832 | S4_15055783 | 28.0 | 58.0 | 55.8 |
| RT14 | 4 | 50.832 | S4_16824752 | 23.2 | 59.8 | 49.1 |
| RT21 | 4 | 47.832 | S4_15055783 | 18.6 | 52.1 | 43.3 |
| RT22 | 4 | 40.228 | S4_11831218 | 20.2 | 65.9 | 44.7 |
| RT23 | 4 | 47.832 | S4_15055783 | 17.4 | 54.8 | 40.3 |
| RT24 | 4 | 40.228 | S4_11831218 | 18.4 | 60.1 | 41.5 |
| RT25 | 4 | 40.228 | S4_11831218 | 16.8 | 61.1 | 38.5 |
a CH: chill hours, UCU: Utah chill units, CP: chill portions, BD: blooming date, FDP: fruit development period, RT: ripening time. b ’LOD’ represents the statistic obtained from the interval mapping test. c ’K’ refers to the statistic derived from the Kruskal-Wallis test. d ’PEV’ indicates the percentage of phenotypic variation explained by the marker.
Table 4.
QTLs identified in the ‘Currot’ parent from the ‘G×C’ cross for phenology traits.
| ‘Currot’ (‘GxC’) Traitsa |
LG | Position (cM) | Locus | LODb | Kc | PEVd |
|---|---|---|---|---|---|---|
| CH12 | 1 | 113.479 | S1_40650682 | 6.5 | 21.1 | 17.4 |
| CH25 | 1 | 111.436 | S1_40331683 | 8.7 | 48.1 | 22.7 |
| UCU24 | 1 | 112.712 | S1_40573005 | 12.0 | 37.2 | 29.7 |
| UCU25 | 1 | 112.712 | S1_40573005 | 10.4 | 32.0 | 26.4 |
| CP25 | 1 | 112.712 | S1_40573005 | 16.0 | 46.6 | 37.6 |
| BD12 | 4 | 55.715 | S4_14369731 | 9.5 | 26.5 | 24.2 |
| BD13 | 4 | 55.715 | S4_14369731 | 10.1 | 23.2 | 25.4 |
| BD14 | 4 | 55.715 | S4_14369731 | 14.1 | 36.3 | 33.6 |
| BD21 | 4 | 55.715 | S4_14369731 | 7.9 | 14.0 | 20.5 |
| BD22 | 1 | 112.712 | S1_40573005 | 12.1 | 34.0 | 29.8 |
| BD23 | 1 | 112.712 | S1_40573005 | 12.0 | 35.5 | 29.3 |
| BD24 | 1 | 112.712 | S1_40573005 | 24.0 | 52.6 | 50.4 |
| BD25 | 1 | 112.712 | S1_40573005 | 23.0 | 55.8 | 48.6 |
| RT12 | 4 | 59.340 | S4_14816248 | 22.6 | 42.5 | 48.0 |
| FDP12 | 4 | 51.955 | S4_12695425 | 19.4 | 55.5 | 43.2 |
| FDP13 | 4 | 51.955 | S4_12695425 | 11.4 | 45.2 | 28.3 |
| FDP14 | 4 | 59.340 | S4_14816248 | 6.4 | 25.3 | 17.1 |
| FDP21 | 4 | 51.955 | S4_12695425 | 11.7 | 21.7 | 30.1 |
| FDP22 | 4 | 51.955 | S4_12695425 | 12.5 | 38.2 | 30.8 |
| FDP23 | 4 | 66.056 | S4_18156937 | 9.3 | 20.3 | 24.0 |
| FDP24 | 4 | 51.955 | S4_12695425 | 10.3 | 33.9 | 26.1 |
| FDP25 | 4 | 51.240 | S4_12611878 | 13.0 | 42.1 | 31.3 |
| RT13 | 4 | 53.107 | S4_12863010 | 30.8 | 50.1 | 59.3 |
| RT14 | 4 | 59.340 | S4_14816248 | 23.2 | 25.2 | 49.2 |
| RT21 | 4 | 59.340 | S4_14816248 | 18.1 | 22.0 | 42.4 |
| RT22 | 4 | 51.955 | S4_12695425 | 19.3 | 37.5 | 43.2 |
| RT23 | 4 | 59.340 | S4_14816248 | 17.4 | 13.4 | 40.4 |
| RT24 | 4 | 59.340 | S4_14816248 | 20.0 | 33.0 | 44.2 |
| RT25 | 4 | 51.240 | S4_12611878 | 17.4 | 26.8 | 39.5 |
a BD: blooming date, FDP: fruit development period, RT: ripening time, CH: chill hours, UCU: Utah chill units, CP: chill portions. b ’LOD’ represents the statistic obtained from the interval mapping test. c ’K’ refers to the statistic derived from the Kruskal-Wallis test. d ’PEV’ indicates the percentage of phenotypic variation explained by the marker.
Disclaimer/Publisher’s Note: The statements, opinions and data contained in all publications are solely those of the individual author(s) and contributor(s) and not of MDPI and/or the editor(s). MDPI and/or the editor(s) disclaim responsibility for any injury to people or property resulting from any ideas, methods, instructions or products referred to in the content. |
© 2026 by the authors. Licensee MDPI, Basel, Switzerland. This article is an open access article distributed under the terms and conditions of the Creative Commons Attribution (CC BY) license.
Copyright: This open access article is published under a Creative Commons CC BY 4.0 license, which permit the free download, distribution, and reuse, provided that the author and preprint are cited in any reuse.


