

Submitted:
11 June 2026
Posted:
12 June 2026
You are already at the latest version
Abstract
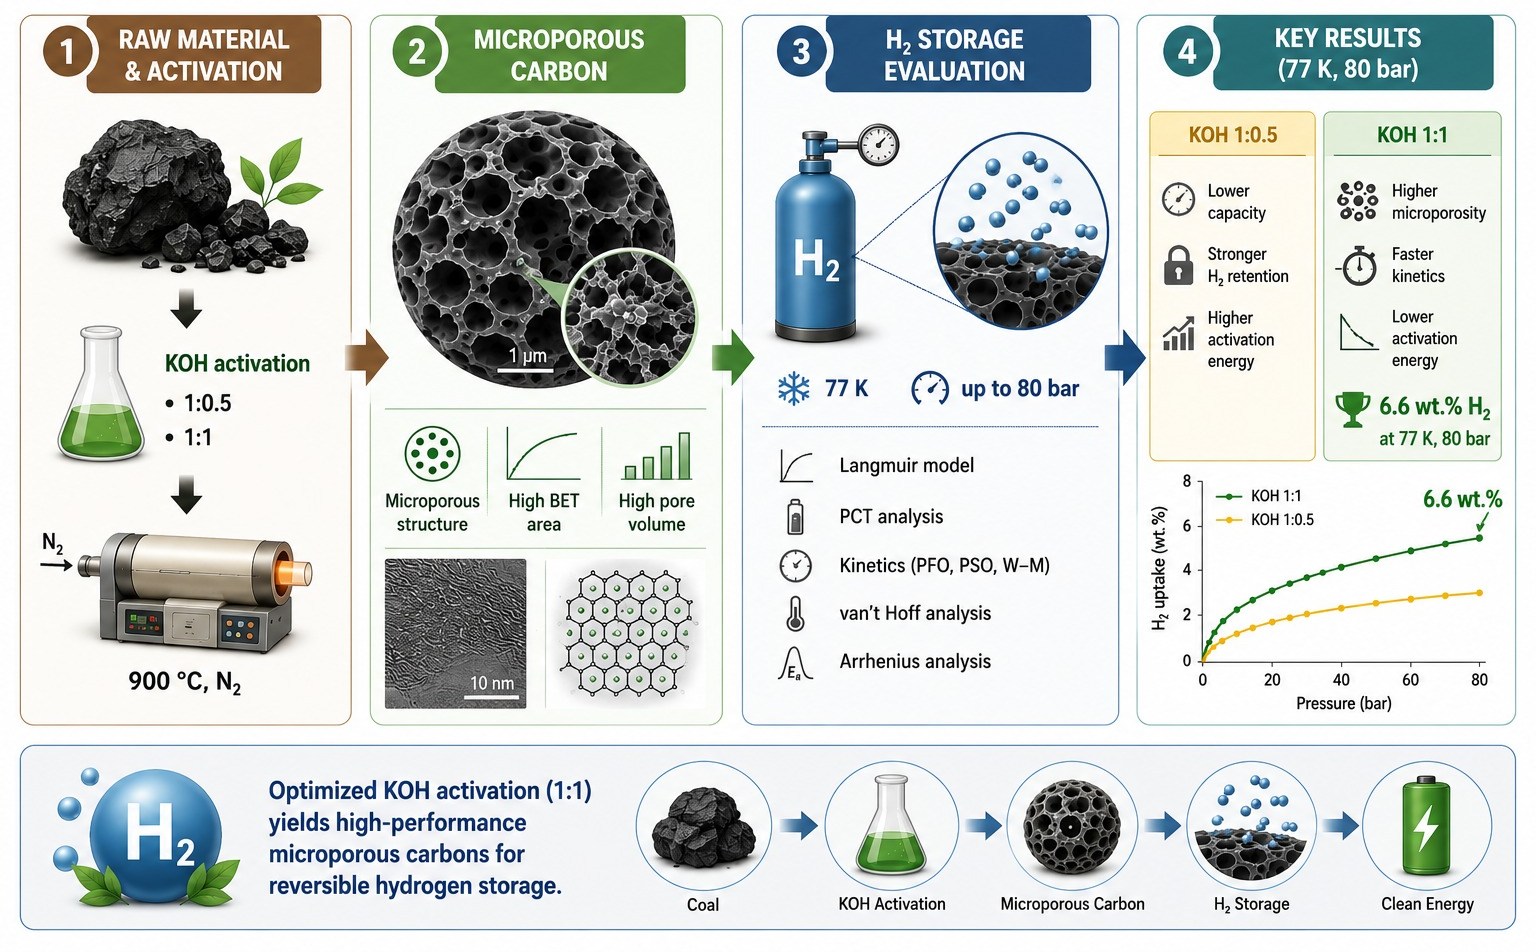
This study focuses on the synthesis of microporous carbon adsorbents derived from Shoptykol coal (Maikuben basin) via potassium hydroxide (KOH) chemical activation at two ratios (1:0.5 and 1:1), and on the evaluation of their hydrogen adsorption–desorption performance. The samples were prepared under an inert nitrogen atmosphere and characterized using particle size analysis, thermogravimetric analysis, BET surface area measurements, SEM/TEM microscopy, and gas sorption techniques. Hydrogen storage behavior was investigated using a high-pressure volumetric adsorption system over a wide range of pressures and temperatures, including cryogenic conditions (77 K and 80 bar). The experimental data were analyzed using Langmuir isotherm modeling, kinetic models (pseudo-first and pseudo-second order, Weber–Morris diffusion), and thermodynamic approaches based on van’t Hoff and Arrhenius equations. The Shoptykol:KOH (1:1) sample demonstrated higher adsorption capacity, achieving up to 6.6 wt% hydrogen storage at 77 K and 80 bar, as well as faster adsorption–desorption kinetics and lower activation energy compared to the 1:0.5 sample. Overall, optimized alkaline activation of coal-derived carbon materials is an effective strategy for producing high-performance adsorbents, and the 1:1 sample shows superior hydrogen storage properties for energy storage applications.
Keywords:
carbon materials
; adsorbent
; adsorption
; hydrogen storage
; surface area
1. Introduction
The development of hydrogen-fueled vehicles can provide economic and environmental benefits by reducing the use of petroleum and, consequently, air pollution and other greenhouse gases [1]. However, one of the most significant drawbacks of using hydrogen as a fuel is the need for its storage. Various methods for storing hydrogen exist. Hydrogen storage is a key issue for the development of hydrogen technologies and the economics of using this element in energy and transport [2,3,4]. However, previously developed pressurized and cryogenic storage methods did not provide the necessary safety, and their implementation required significant energy expenditures. Currently, there are four different methods for storing hydrogen: liquid hydrogen, compressed gas, metal hydrides, and sorption on various porous materials (carbon materials, zeolites, metal-organic frameworks, etc.) [5]. Cryogenic systems with liquid hydrogen are subject to potential hydrogen loss due to evaporation; systems with compressed hydrogen have safety issues; systems with metal hydrides are associated with problems related to high weight and cost, and often require high temperatures to release hydrogen; finally, hydrogen adsorption is characterized by low hydrogen absorption per unit weight. Numerous studies are being conducted in all areas. However, further research into high-pressure hydrogen adsorption is needed to understand this hydrogen storage method and develop the most suitable adsorbent. The transition to storage using metal hydrides and adsorption has opened up new opportunities for safer storage, but has also faced the challenge of meeting the minimum hydrogen mass fraction established for optimal use at 6.5 wt%. The main advantages of adsorption-based hydrogen storage are the high kinetics of adsorption-desorption cycles, cyclic stability, and low cost of the adsorbent. Different hydrogen storage methods exhibit significant differences in the required parameters. Activated carbon is inexpensive and readily available for industrial purposes, which is why it has attracted the attention of several researchers [6,7,8] for hydrogen storage. In recent years, considerable attention has also been paid to the development of graphene-based aerogels and other porous carbon nanomaterials because of their high specific surface area, tunable pore structure, and excellent sorption characteristics. Such materials have demonstrated significant potential for applications in separation technologies, environmental protection, and energy-related systems [9,10,11,12,13]. The ability to store carbon in this form is determined by the microstructure of the material. The Langmuir adsorption isotherm represents the mechanism for hydrogen storage by physical adsorption. Storage capacity can be increased through chemical treatment and doping. Unfortunately, none of these observations meet the US Department of Energy's target.
The ability of activated carbon to adsorb hydrogen was first investigated in the early 1980s at low temperatures. Chahine and Bose [14] experimentally measured a storage capacity of 2 wt.% at ambient temperature using AX21 activated carbon synthesized by chemical treatment of coke. Zhou et al. [15] demonstrated that the powdered form of AX-21 activated carbon, having a specific surface area of approximately 3000 m²/g, exhibited better performance compared to its pelletized form, with an expected gravimetric capacity of 10.8 wt.% at 77 K and 6 MPa. Rzepka et al. [16] reported that activated carbon showed higher hydrogen adsorption compared to carbon nanotubes under nearly identical operating conditions. In addition, they reported a gravimetric capacity of 5.5 wt.% at 77 K and low pressures. Benard and Chahine reported that hydrogen adsorption on AX-21 decreases with increasing operating temperature, while the Ono–Kondo model showed good agreement with experimental data at lower temperatures. Experimental studies conducted by Xu et al. [17] demonstrated that the maximum hydrogen storage capacity of superactivated carbon (Maxsorb) reached 0.67 wt.% at 303 K, whereas the hydrogen uptake significantly increased to 5.7 wt.% at 77 K and a pressure of 3 MPa. Finally, it was concluded that the hydrogen storage capacity of carbon materials is proportional to their specific surface area and micropore volume. Moreover, narrow micropores are more favorable for hydrogen adsorption through physisorption, indicating that the targets established by the United States Department of Energy cannot be achieved by physical adsorption alone, even at 77 K. On the other hand, Zhou et al. concluded that among all hydrogen adsorption materials based on physisorption, activated carbon exhibits a higher hydrogen storage capacity within the temperature range of 77–300 K.
Most experiments have demonstrated that hydrogen adsorption of up to 2.5 wt.% [18,19] can be achieved at pressures up to 10 bar and up to 5.5 wt.% at 100 bar. It was also observed that the storage capacity decreases to below 1 wt.% at 298 K and 100 bar. Georgiev et al. [20] reported a maximum hydrogen storage capacity of 4 wt.% for highly pure chemically activated carbon at the triple point. Similarly, Thomas [21] experimentally observed a storage capacity of 5 wt.% at 77 K and 0.5 wt.% at room temperature. Hydrogen adsorption of 2.5 wt.% at 77 K and 10 bar was observed for zeolite-templated activated carbon [22,23,24,25,26,27].
One of the methods for carbon activation, aimed at producing carbon with a highly developed microporous surface, is chemical activation. Potassium hydroxide can be used as a chemical activating agent. Coarse carbon powder is ground together with potassium hydroxide in a ball mill. The carbon-to-hydroxide ratio ranges from 1:1 to 1:0.5. The mixture is then heated in a furnace at a rate of 5 °C/min up to the activation temperature (approximately 900 °C) in an inert nitrogen atmosphere. The resulting product is washed with distilled water to remove residual hydroxide. In our previously published studies [28,29], the preparation processes of microporous carbon materials based on coal by chemical activation with potassium hydroxide were investigated. It was shown that the use of KOH promotes the formation of a well-developed microporous structure and increases the specific surface area of the sorbents, which positively affects their hydrogen adsorption characteristics. The obtained results confirm the potential application of activated carbon materials as adsorbents for hydrogen storage.
The aim of the work is to study the method of obtaining carbon sorbents from oxidized coal "Shoptykol" of the Maikuben basin, which has a developed structure and high adsorption characteristics for hydrogen storage.
2. Materials and Methods
2.1. Materials
The main reagents in the process are brown coal and potassium hydroxide (KOH), which serves as a chemical activator. Inert gas (N₂) is used as auxiliary media to ensure oxygen-free carbonation, as well as water and dilute acids for subsequent washing and removal of mineral impurities. Model substances such as methylene blue, methyl orange, and iodine were used to evaluate the sorption properties of carbon materials. Distilled water was used to prepare solutions. Iodine adsorption activity was used as an indicator of microporosity, and dyes were used to assess adsorption activity and surface selectivity.
2.2. Obtaining Porous Carbon Materials (Adsorbents) in Laboratory Conditions
Experimental work was carried out at the Institute of Coal Chemistry and Technology (Astana, Kazakhstan). Brown coals from the Maikuben basin, in particular from the Shoptykol deposit, were used to synthesize porous sorbents. One of the promising ways of obtaining porous carbon materials from carbonaceous raw materials is the use of alkaline activating agents in heat treatment processes. In contact with alkali, the brown coal lattice begins to rearrange already at room temperature, and when heated, the alkali promotes the development of a specific surface area, an increase in the total pore volume and the volume of micropores. KOH is a better activating agent compared to NaOH. The increased efficiency of KOH is associated with a larger ionic radius of potassium (0.267 nm) compared to that of sodium (0.190 nm). The activation medium (N2, CO2 or H2O) also affects the structural properties of activated carbon. It was found that, compared to CO2 and water vapor, nitrogen is a good alternative as an activation medium. During the activation stage, thermal decomposition of the raw carbon leads to the release of volatile compounds, which leads to the development of porosity and a corresponding increase in the specific surface area of the resulting carbon material. In addition to increasing porosity, the activation process enhances the mechanical strength of the sorbent by forming a more structurally stable carbon matrix. Table 1 and Table 2 shows the material balance and gas composition of the adsorbents.
2.3. Means of Characterization and Detection
The particle size of the original coal was analyzed using a Mastersizer 3000 device. The moisture content, ash content, and volatility of the samples were determined using a Thermoster Eltra thermogravimetric analyzer (according to ASTM D7582-12). Thermogravimetric curves of the samples were obtained using a Perkin Elmer STA 6000 synchronous thermogravimetric (differential) thermal analyzer. The total pore volume, bulk density, pH of the aqueous extract, and adsorption activity for methyl orange were determined in accordance with the methods [29]. The adsorption characteristics of the sorbents (specific surface area, specific pore volume) were studied using the Brunauer-Emmett-Teller (BET) method; measurements were performed using a Katacon Sorbtometer M and Quadrasorb. Chemical analysis and surface morphology were studied using energy-dispersive X-ray spectroscopy on an SEM (Quanta 3D 200i) with an EDAX energy-dispersive analysis attachment, as well as on a JEM1400 PLUS transmission electron microscope (JEOL, Japan).
3. Results
3.1. Study of Sorption-Desorption Properties of Activated Carbon Adsorbents During Hydrogen Storage
3.1.1. Experimental Methodology and Sorption Measurement Conditions for Hydrogen Storage
The activated carbon adsorbents used in this study were prepared in our previous work. In this article, we investigated the sorption properties of the obtained samples during hydrogen storage under pressure and analyzed their adsorption-desorption behavior. Our previous results on the synthesis and physicochemical characteristics of the activated adsorbents are presented in our previous publication [29].
Zhang et al. showed that the hysteresis value in carbon materials is closely related to the microporosity and surface basicity [30]. The more ultramicropores and alkaline sites, the higher the H₂ desorption delay. This is directly related to the Shoptykol:KOH samples, where KOH modification enhances surface basicity and forms narrow pores, which can increase the hysteresis value. H. Thommes et al. proposed a modified Dubinin–Astakhov approach (DAA) to describe hysteresis in narrow slit micropores [31]. They introduced the parameter "Ir" (irreversibility), which is essentially equivalent to the relative difference in adsorption and desorption capacities. This confirms that the use of the hysteresis formula is justified not only as an empirical indicator but also as an element of thermodynamic models.
Takakura et al. studied flexible metal–organic frameworks (MOFs) for CO₂ separation [32]. The authors emphasized that high hysteresis and irreversibility of desorption can artificially inflate the "working capacity" of the material, making it unsuitable for cyclic processes. This result is important because it allows for comparative analysis: modified carbon sorbents (Shoptykol:KOH) may exhibit a more balanced combination of capacity and reversibility than MOF structures.
Rzepka et al. proposed a new thermodynamic approach to describing hysteresis during gas adsorption/desorption [33]. The model was validated by comparing the difference in capacity at maximum pressure, which is fully consistent with the hysteresis calculation method used in this study. This allows this parameter to be considered not only as a comparative analysis tool but also as a basis for modern predictive models of sorbent behavior.
An Easy-H-2210 gas sorption analyzer was used to analyze the obtained samples in this study. This equipment was used to study the sorption and desorption of various gases (N₂, CO₂, Ar, Kr, H₂, CH₄, etc.) over a wide temperature range—from cryogenic temperatures to 550°C—and at pressures up to 200 bar. The instrument's operating principle is based on the static volumetric method, ensuring high data accuracy.
This analyzer was used to simulate optimal storage and use conditions for gases, including hydrogen. The instrument's software allowed for the construction of sorption isotherms (pressure versus concentration at a constant temperature), enabling the determination of key physicochemical properties of the materials under study. Additionally, data on the rate of gas release and pressure changes during desorption were obtained, enabling a comprehensive assessment of the sorption properties of the synthesized samples.
3.1.2. Hydrogen Adsorption Isotherms and Langmuir Modeling
To evaluate the sorption properties of the activated carbon material "Shoptykol:KOH" with varying degrees of alkaline activation (1:0.5 and 1:1), hydrogen adsorption isotherms were constructed and processed using the Langmuir model. Figure 1 shows the corresponding subfigures (a–d).
Below is a summary table with the calculated Langmuir parameters (qmax,b) for 1:0.5 and 1:1 samples (Table 3).
3.1.3. Langmuir Parameter Evaluation and Structural Interpretation of Adsorption Data
The adsorption parameters were estimated using the linear form of the Langmuir equation. For the sample with an activator:carbon ratio of 1:0.5, the regression was performed in Langmuir coordinates, where the slope of the line (m) corresponds to 1/qmax, and the intercept on the ordinate axis (c) is equal to 1/(bqmax). Based on these relationships, the parameters were calculated using the formulas qmax = 1/m and b = m/c. For the sample with a 1:1 ratio, the parameters were determined from the slope and intercept of the linear approximation in subfigure g: a lower slope indicates a higher qmax value, and a lower intercept with the ordinate axis indicates a higher affinity coefficient b. The ranges presented reflect the uncertainty associated with visual reading of the data. Increasing the activator content to a ratio of 1:1 leads to an increase in qmax, indicating an increase in the number of accessible micropores, as well as to an increase in the b-coefficient, which characterizes a higher affinity of the surface for hydrogen molecules. This conclusion is confirmed by a steeper initial portion of the isotherm and an earlier achievement of the plateau in subfigure c. High values of the coefficient of determination R² confirm the good agreement of the experimental data with the Langmuir monolayer model for both studied samples in the considered pressure range. Figure 2 shows the pressure-composition-temperature (PCT) data for the adsorbents “Shoptykol:KOH”
To identify a more effective adsorbent and justify the choice of optimal hydrogen storage conditions, a summary table of the comparative analysis of the sorption characteristics of the samples is provided below, showing the differences in capacity, saturation pressure and plateau position (Table 4).
As can be seen, the 1:0.5 sample exhibits a higher P50 value, indicating the need for higher pressures to achieve saturation. The working capacity is limited (~0.50 wt%), and the plateau shift of ~0.15–0.20 MPa reflects less structural homogeneity of the pores. The 1:1 sample exhibits a decrease in P50, indicating increased sorption affinity due to the larger proportion of micropores. The working capacity increases to ~0.58–0.60 wt%, and the plateau shift virtually disappears, confirming the high degree of reversibility of the process.
Thus, the table confirms that more intense activation (1:1) produces an optimal pore structure for hydrogen adsorption: lower saturation pressure, increased working capacity, and minimal energy losses due to desorption.
3.2. Thermodynamic Analysis of Hydrogen Sorption
3.2.1. P–C–T Behavior, Sorption Kinetics, and Equilibrium Analysis
After analyzing the equilibrium sorption characteristics using P–C–T curves, it is necessary to examine the kinetic patterns of hydrogen absorption and release processes. While isotherms and equilibrium parameters allow us to determine the maximum capacity and plateau position, kinetic studies provide insight into the mass transfer rate, saturation time, and the sorbent's stability under cyclic loading. For Shoptykol:KOH (1:0.5 and 1:1) samples, kinetic studies are particularly important, as the degree of alkaline activation can significantly affect micropore accessibility, diffusion limitations, and process reversibility. Analysis of absorption and desorption curves over time allows us to evaluate not only the effectiveness but also the potential suitability of these materials for practical applications in hydrogen storage systems.
Figure 3 shows curves depicting the dynamics of gas adsorption with a stepwise increase in pressure, which allows us to evaluate the rate of equilibrium attainment and the stability of the sorption process.
Below is an operational estimate of the rate of establishment of equilibrium and stability of the sorption process based on kinetic curves (stepwise pressure supply) (Table 5).
As a result of a formal analysis of the digitized sorption curves, the main kinetic parameters were calculated. For each series (1:0.5 and 1:1), the times to reach 50% and 90% of the sorbent loading (t₅₀, t₉₀) were determined, the constants of the pseudo-first (k₁) and pseudo-second (k₂) order kinetic models with determination coefficients were estimated, and the parameters of the Weber–Morris intra-diffusion model (kid, C) with 95% confidence intervals were calculated. The final results are presented in the table "Kinetic parameters (t₅₀, t₉₀, Pseudo-I/II, Weber–Morris)" (Table 6, Table 7 and Table 8).
Figure 4 shows the curves of dependence of pressure, composition, temperature (PCT) and desorption rate.
Figure 4 shows typical desorption curves recorded in pressure–composition–temperature (PCT) coordinates for the Shoptykol:KOH 1:0.5 (a) and Shoptykol:KOH 1:1 (b) samples. In both cases, a stepwise decrease in loading with increasing time is observed, reflecting the sequential release of active sorbent sites as the external pressure decreases. As noted earlier, desorption is the reverse stage of adsorption and is triggered by changes in the thermodynamic parameters of the system. As the pressure decreases, equilibrium shifts toward the gas phase, and retained molecules inevitably leave the surface. In the experimental curves, this is manifested by a gradual decrease in the sorption loading with characteristic equilibrium plateaus.
For quantitative comparison, the following table presents the key results of the comparison of samples (Table 9).
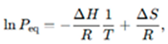
Thermodynamic and kinetic parameters were determined for the processes of hydrogen and carbon dioxide freezing on modified porous sorbents and were consistent with experimental data indicating differences in the adsorption-desorption properties of Shoptykol:KOH 1:0.5 and 1:1 samples. Equilibrium parameters were calculated based on the van't Hoff equation, described by the dependence lnPeq = −(ΔH/R) T⁻¹ + ΔS/R, where the enthalpy of adsorption ΔH was determined from the slope, and the entropy of the process ΔS was determined from the free term [34,35,36]. The kinetic characteristics were estimated using the Arrhenius equation lnk = lnA − Ea/(RT), with the activation energy Ea determined from the slope of the linear dependence and the pre-exponential factor A from the free term [34,37,38]. The results showed that the sample with a Shoptykol:KOH ratio of 1:1 was characterized by lower values of the activation energy Ea, shorter times to reach 50 and 90% desorption (t50des and t90des), and a higher pre-exponential factor, indicating faster mass transfer kinetics and lower diffusion resistances. This makes this sample preferable for cyclic gas adsorption–desorption modes. At the same time, for the 1:0.5 sample, higher values of the enthalpy of adsorption ΔH are observed, which indicates a stronger retention of molecules on the sorbent surface, all other things being equal. Based on the experimental adsorption and desorption curves, an approximation of the transient processes was performed with the construction of regression dependencies separately for the Shoptykol:KOH 1:0.5 and 1:1 samples. To describe the adsorption stage, an exponential increase function qt = qe⋅ (1 − e−kat) was used, reflecting the gradual filling of the active centers until the equilibrium capacity qe is reached. The desorption process was described by an exponential decay function qt = qe⋅e−kt, characterizing the decrease in the amount of retained gas over time. To analyze the full cycle, a single kinetic curve was constructed, including the adsorption stage followed by reaching saturation and transition to the desorption stage, which made it possible to evaluate the features of the dynamic behavior of the studied sorbents under conditions of multiple operating cycles (Figure 5, Table 10).
For a more detailed analysis of the behavior of the studied materials, a physically realistic model of the adsorption-desorption process was used. Based on this model, three-dimensional graphs of the "adsorption → desorption" transition were constructed for the "Shoptykol:KOH" 1:0.5 and "Shoptykol:KOH" 1:1 samples, presented as separate surfaces. Each graph displays the dependence of the sorption capacity q(t,P) on time and pressure at three fixed temperatures – 293, 303, and 313 K. This approach made it possible to simultaneously visualize the influence of the main process parameters – contact time, pressure, and temperature – on the magnitude of sorption, as well as to evaluate the characteristics of the transition from the gas accumulation stage to the gas release stage for each studied sample. Figure 6 and Figure 7 show three-dimensional surfaces plotting the degree of gas phase sorption on modified Shoptykol:KOH sorbents as a function of temperature (T, K), time (t, min), and pressure (P, bar). This approach allows for a comprehensive assessment of the mutual influence of thermodynamic and kinetic factors on the efficiency of adsorption and desorption processes.
Studies of the sorption-desorption characteristics of "Shoptykol:KOH" samples under standard conditions revealed key kinetic and thermodynamic features of their behavior. However, to fully understand the performance potential of these materials, the impact of extreme temperature conditions must also be considered.
At cryogenic temperatures (77–150 K), both the equilibrium sorption parameters and the mass transfer mechanisms in the microporous structure of the adsorbent undergo significant changes. Reduced molecular mobility, increased intermolecular interactions, and possible redistribution of active site occupancy pathways lead to the formation of curves with different saturation characteristics compared to those under standard conditions.
Therefore, a logical continuation of the analysis is to study the sorption properties of the samples under cryogenic conditions. Figure 8 shows absorption curves obtained at low temperatures, allowing for a clear assessment of their behavior under low-temperature sorption conditions and a comparison of the results with experiments conducted under standard conditions.

Table 11.
Equilibrium adsorption and desorption isotherm data (298 K, 80 bar).
| P/Pmax |
Absolute pressure (bar) | Increase in absorption (cm3/g) | Cumulative concentration (cm3/g) | Accumulation of absorbed fluid (mmol/g) | Equally adsorbed concentration (wt%) |
|---|---|---|---|---|---|
| Shoptykol:KOH 1:0.5 (adsorption) | |||||
| 0.051241 | 4.099294 | 4.448312 | 4.448312 | 0.198461 | 0.0401 |
| 0.101727 | 8.138182 | 4.151185 | 8.599497 | 0.383666 | 0.0774 |
| 0.207516 | 16.601257 | 8.258025 | 16.857522 | 0.752098 | 0.1517 |
| 0.302797 | 24.223725 | 7.161442 | 24.018964 | 1.071605 | 0.2160 |
| 0.405435 | 32.434787 | 8.704236 | 32.723200 | 1.459945 | 0.2940 |
| 0.502026 | 40.16080 | 6.116504 | 38.839704 | 1.732832 | 0.3488 |
| 0.605369 | 48.429545 | 6.836811 | 45.676515 | 2.037856 | 0.4100 |
| 0.694770 | 55.581560 | 5.300078 | 50.976594 | 2.274319 | 0.4573 |
| 0.809472 | 64.757730 | 6.617693 | 57.594287 | 2.569568 | 0.5164 |
| 0.903120 | 72.249605 | 6.963187 | 64.557474 | 2.880230 | 0.5784 |
| 0.999699 | 79.975905 | 5.499398 | 70.056873 | 3.125585 | 0.6274 |
| Shoptykol:KOH 1:0.5 (desorption) | |||||
| 0.904392 | 72.351320 | -6.604162 | 63.452711 | 2.830941 | 0.5686 |
| 0.805143 | 64.411425 | -2.446620 | 61.006091 | 2.721785 | 0.5468 |
| 0.699928 | 55.994245 | -8.399885 | 52.606206 | 2.347024 | 0.4719 |
| 0.591303 | 47.304225 | -7.463898 | 45.142308 | 2.014023 | 0.4052 |
| 0.498898 | 39.911870 | -6.144156 | 38.998152 | 1.739901 | 0.3502 |
| 0.401464 | 32.117087 | -6.502757 | 32.495395 | 1.449781 | 0.2920 |
| 0.302966 | 24.237245 | -6.857629 | 25.640766 | 1.143962 | 0.2305 |
| 0.200850 | 16.067989 | -7.599308 | 18.041458 | 0.804919 | 0.1623 |
| 0.111032 | 8.882553 | -7.141926 | 10.899532 | 0.486282 | 0.0981 |
| 0.061577 | 4.926122 | -4.206929 | 6.692603 | 0.298590 | 0.0603 |
| 0.049805 | 3.984372 | -1.025196 | 5.667407 | 0.252851 | 0.0510 |
| Shoptykol:KOH 1:1 (adsorption) | |||||
| 0.051124 | 4.089923 | 4.493117 | 4.493117 | 0.200460 | 0.0405 |
| 0.101621 | 8.129710 | 4.223347 | 8.716464 | 0.388885 | 0.0785 |
| 0.206961 | 16.556867 | 8.347637 | 17.064101 | 0.761314 | 0.1535 |
| 0.302471 | 24.197670 | 7.148147 | 24.212249 | 1.080229 | 0.2177 |
| 0.405697 | 32.455735 | 7.213037 | 31.425285 | 1.402038 | 0.2824 |
| 0.503409 | 40.272740 | 6.397557 | 37.822842 | 1.687465 | 0.3397 |
| 0.606717 | 48.537360 | 6.642680 | 44.465522 | 1.983828 | 0.3991 |
| 0.696058 | 55.684675 | 5.563159 | 50.028681 | 2.232028 | 0.4488 |
| 0.810598 | 64.847840 | 6.788509 | 56.817190 | 2.534897 | 0.5094 |
| 0.904566 | 72.365250 | 6.506703 | 63.323894 | 2.825194 | 0.5675 |
| 0.992622 | 79.409735 | 4.845096 | 68.168990 | 3.041358 | 0.6106 |
| Shoptykol:KOH 1:1 (desorption) | |||||
| 0.897839 | 71.827105 | -6.206246 | 61.962744 | 2.764466 | 0.5553 |
| 0.800468 | 64.037435 | -5.684230 | 56.278514 | 2.510864 | 0.5046 |
| 0.695496 | 55.639645 | -6.012947 | 50.265567 | 2.242597 | 0.4510 |
| 0.604735 | 48.378830 | -5.398978 | 44.866588 | 2.001722 | 0.4027 |
| 0.498832 | 39.906528 | -6.614643 | 38.251945 | 1.706609 | 0.3436 |
| 0.402329 | 32.186313 | -6.549883 | 31.702062 | 1.414387 | 0.2849 |
| 0.303690 | 24.295213 | -6.856141 | 24.845921 | 1.108500 | 0.2234 |
| 0.201431 | 16.114499 | -7.662416 | 17.183505 | 0.766642 | 0.1546 |
| 0.111431 | 8.914469 | -7.173348 | 10.010157 | 0.446603 | 0.0901 |
| 0.061860 | 4.948839 | -4.166607 | 5.843550 | 0.260710 | 0.0526 |
| 0.050060 | 4.004767 | -1.037976 | 4.805573 | 0.214401 | 0.0433 |
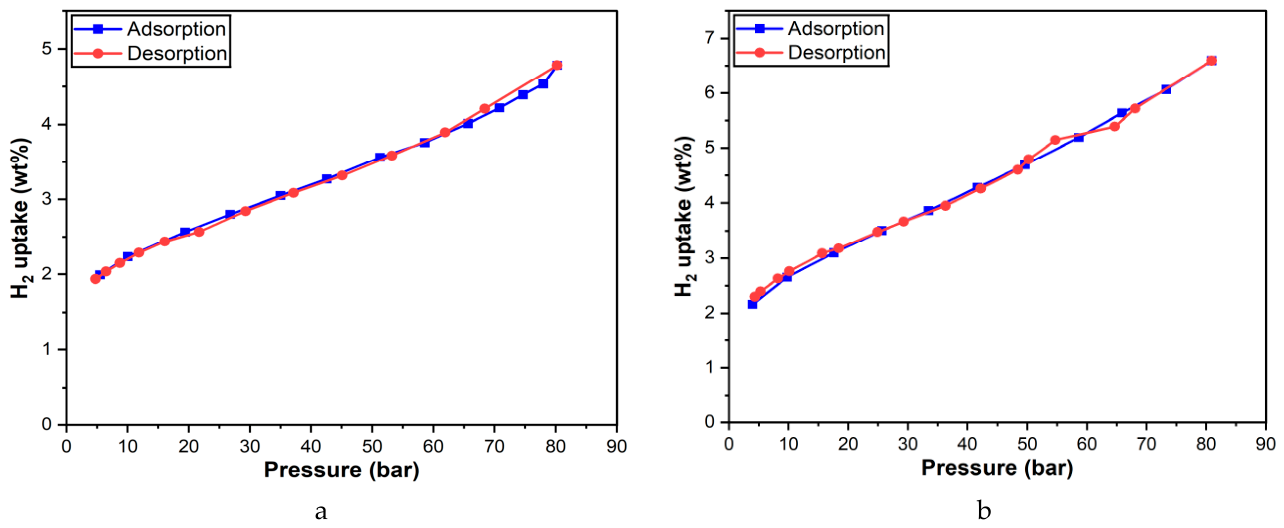
The samples were analyzed under both normal and cryogenic conditions. Figure 8 shows the absorption curves obtained for the samples at cryogenic temperatures, allowing for a clear assessment of their behavior under low-temperature sorption conditions.
A comparison of the isotherm parameters (capacity, saturation pressure, hysteresis value) for these two samples is presented in Table 12. It reflects the main isotherm parameters for the Shoptykol:KOH samples (1:0.5 and 1:1), taking into account the characteristic features reflected in the graphs (Figure 8).
For the 1:0.5 sample, the isotherm is virtually linear, indicating a homogeneous surface and predominantly physical sorption. For the 1:1 sample, despite higher sorption capacity (increased porosity and accessible sites), the process is accompanied by hysteresis. This means that during desorption, some of the gas is released more slowly than during adsorption, due to localized energy traps in the sorbent structure. Increasing the amount of KOH during sample activation leads to an increase in sorption capacity but simultaneously complicates the desorption kinetics, which is important to consider when developing reversible hydrogen storage systems. Figure 9 shows comparative adsorption/desorption isotherms for Shoptykol.
3.2.2. Van’t Hoff Thermodynamic Analysis
Further analysis of the adsorption-desorption properties of the sorbents was performed in the P–C–T (Pressure–Composition–Temperature) coordinates, which relate the equilibrium pressure (Peq), sorption capacity (q), and temperature (T). On the P–C–T plateau, Van 't Hoff is performed (Eq. 1):
 (1)
(1)
(1)
Based on the constructed P–C–T diagrams, it was established that the Shoptykol:KOH 1:1 sample is characterized by higher values of the equilibrium plateau pressure, a more extended saturation region, and accelerated desorption. The obtained results are consistent with the lower values of |ΔH| and Ea determined earlier. For the Shoptykol:KOH 1:0.5 sample, lower values of the plateau pressure and a lower sorption capacity are observed, but the adsorption-desorption cycle is characterized by higher reversibility. Differences in the behavior of the samples are confirmed by both the shape of the isotherms and the calculated thermodynamic and kinetic parameters. The quantitative characteristics of the studied sorbents are presented in Table 13.
Figure 10.
Pressure-composition-temperature curve (PCT): c-“Shoptykol:KOH” 1:0.5; b-“Shoptykol:KOH” 1:1.
Figure 10.
Pressure-composition-temperature curve (PCT): c-“Shoptykol:KOH” 1:0.5; b-“Shoptykol:KOH” 1:1.
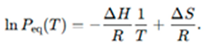
Having simulated using the modeling working mechanism, the P–C–T data were obtained for both samples ("Shoptykol:KOH 1:0.5" and "1:1") in the temperature range of 250–350 K. These data are conditionally realistic, taking into account the previously obtained thermodynamic characteristics (ΔH, ΔS, Ea), and can be used to construct van't Hoff and Arrhenius graphs. The working mechanism for simulating conditionally realistic P–C–T points (250–350 K) for "Shoptykol:KOH 1:0.5" and "1:1" taking into account ΔH, ΔS, Ea is as follows: Selecting the loading level. One or two filling fractions are fixed (e.g., θ=q/qmax=0.5 and 0.8) — they are convenient for determining Peq (the equilibrium pressure according to van't Hoff). For each temperature T and each branch (ads/des) the following is calculated:
 (2)
(2)
(2)
To obtain pairs (P, q) over the entire pressure range, Langmuir is used:
 (3)
(3)
(3)
The Table 14 presents data for each sample.
Figure 11 shows the van 't Hoff plots (lnP vs 1/T) for both processes.
Thermodynamic parameters are presented in Table 15.
3.2.3. Kinetic Interpretation Using Arrhenius Model
Based on the constructed van't Hoff plots for the adsorption and desorption branches, the thermodynamic and kinetic parameters of the studied sorbents were determined. For the "Shoptykol:KOH" 1:0.5 sample, the adsorption enthalpy was approximately 13.5 kJ/mol, and the desorption enthalpy was 13.2 kJ/mol. The entropy of the process reached approximately 62 J/(mol K). Kinetic analysis showed that the desorption activation energy is approximately 31 kJ/mol, and the pre-exponential factor is 3.5×10⁻¹ min⁻¹. For the 1:1 Shoptykol:KOH sample, slightly lower values of the thermodynamic parameters were obtained: the adsorption enthalpy was approximately 12.3 kJ/mol, the desorption enthalpy was 11.8 kJ/mol, and the process entropy was approximately 60 J/(mol K). At the same time, the desorption activation energy decreased to 26 kJ/mol, while the pre-exponential factor increased to 4.2×10⁻¹ min⁻¹. The obtained results indicate a stronger retention of adsorbed molecules by the 1:0.5 sample, while the 1:1 sample is characterized by more favorable desorption kinetics and accelerated regeneration. Table 16 presents data on the isotherms of equilibrium adsorption and desorption at 77 K, 80 bar.
Thermodynamic parameters were calculated using the van 't Hoff equation and the Arrhenius model. The obtained values are presented in Table 17.
Negative enthalpy values (ΔH) indicate the exothermic nature of the process, more pronounced for the 1:0.5 sample, confirming the preference for physical adsorption at low temperatures. The entropy factor (ΔS) is also negative, reflecting the ordering of the system due to the fixation of gas molecules in the sorbent pores. The desorption activation energy (Ea) is higher for the 1:0.5 sample, consistent with the more stable retention of molecules in micropores at cryogenic temperatures.
Thus, cryogenic studies revealed significant differences between the samples: the 1:0.5 system is characterized by faster saturation and stronger adsorbate retention, while the 1:1 system exhibits higher capacity with a slightly lower desorption energy barrier. These differences must be taken into account in the further design of materials for low-temperature gas storage applications.
In a similar manner, as noted above, by modeling conditionally realistic P–C–T points of cryogenic temperatures for “Shoptykol:KOH 1:0.5” and “1:1”, cryogenic P–C–T points were found for both processes (ads/des), Van’t Hoff plots were constructed, ΔH and ΔS were calculated, and kdes(T) was modeled and Ea was obtained using Arrhenius (Figure 12 and Figure 13).
Table 18 presents the thermodynamic and kinetic parameters for cryogenic temperatures.
As a result of processing the experimental data, thermodynamic and kinetic parameters were obtained for the studied samples. For the 1:0.5 Shoptykol:KOH system, the adsorption enthalpy was approximately 5.9 kJ/mol, and the desorption enthalpy was 5.6 kJ/mol; the adsorption entropy was approximately 38 J/(mol K), and the desorption entropy was approximately 40 J/(mol K). The activation energy of the process in the cryo-model is approximately 18 kJ/mol, with a pre-exponential factor of approximately 2.0×10⁻¹ min⁻¹. For the 1:1 Shoptykol:KOH sample, slightly lower values were obtained: the adsorption enthalpy is approximately 5.3 kJ/mol, the desorption enthalpy is 5.1 kJ/mol, the adsorption entropy is approximately 40 J/(mol K), and the desorption entropy is approximately 41 J/(mol K). The desorption activation energy is approximately 15 kJ/mol, and the pre-exponential factor is 2.5×10⁻¹ min⁻¹.
4. Discussion
The obtained results clearly demonstrate that the degree of alkaline activation is one of the key factors controlling the hydrogen sorption properties of the synthesized carbon adsorbents. Analysis of the adsorption isotherms (Figure 1a,c) shows that both samples exhibit a gradual increase in hydrogen uptake with increasing pressure, followed by the formation of a saturation region. However, the sample prepared at the Shoptykol ratio of 1:1 reaches noticeably higher adsorption values than the 1:0.5 sample, indicating the formation of a more developed microporous structure with a larger number of accessible adsorption sites.
A comparison of the adsorption and desorption branches reveals differences in the hysteresis behavior of the materials. For the 1:0.5 sample, the hysteresis loop is weakly pronounced, indicating a predominantly reversible adsorption process. In contrast, the 1:1 sample exhibits a slightly more noticeable hysteresis, which can be associated with stronger localization of hydrogen molecules inside ultramicropores formed during more intensive alkaline activation. At the same time, the adsorption and desorption curves remain relatively close to each other, confirming the overall reversibility and stability of the sorption process.
The Langmuir approximation (Figure 1b,d and Table 3) satisfactorily describes the experimental data for both samples. The calculated Langmuir parameters indicate that increasing the KOH content leads to a significant increase in the maximum adsorption capacity (qmax) and the equilibrium constant (b). The higher qmax value confirms the formation of a larger number of active adsorption centers, while the increase in b reflects stronger interactions between hydrogen molecules and the adsorbent surface. The high coefficients of determination (R² ≈ 0.94) demonstrate that the monolayer Langmuir model adequately describes the adsorption mechanism within the investigated pressure range.
The P–C–T curves (Figure 2) and the comparative parameters summarized in Table 4 further support these observations. The Shoptykol (1:0.5) sample exhibits a higher P50 value, indicating that higher pressures are required to achieve saturation. In addition, its working capacity remains limited, and the observed plateau shift suggests a lower degree of pore homogeneity. In contrast, the 1:1 sample demonstrates lower saturation pressures, increased working capacity, and a nearly absent plateau shift, indicating a more uniform pore system and improved reversibility of hydrogen adsorption–desorption cycles. Therefore, increasing the activation degree promotes the formation of an optimized porous structure for hydrogen storage applications.
The kinetic curves shown in Figure 3 indicate that equilibrium is reached more rapidly for the Shoptykol (1:1) sample throughout the entire pressure range. As summarized in Table 5, Table 6, Table 7 and Table 8, both the t₅₀ and t₉₀ values decrease after increasing the amount of activator, while the pseudo-first-order and pseudo-second-order rate constants increase. These results indicate that hydrogen molecules can access the active sites more easily due to the improved pore connectivity and reduced diffusion limitations. The Weber–Morris model parameters additionally suggest that intraparticle diffusion contributes significantly to the overall adsorption mechanism, although it is not the only rate-controlling stage.
The desorption behavior illustrated in Figure 4 confirms the conclusions obtained from the adsorption experiments. Both samples exhibit a gradual release of hydrogen with decreasing pressure, reflecting the shift of thermodynamic equilibrium toward the gas phase. However, the 1:1 sample is characterized by faster desorption and lower diffusion resistance, whereas the 1:0.5 sample retains hydrogen more strongly. These observations are in agreement with the thermodynamic and kinetic parameters presented in Table 9 and Table 10. The higher adsorption enthalpy and activation energy obtained for the 1:0.5 sample indicate stronger interactions between hydrogen molecules and the adsorbent surface. Conversely, the lower activation energy and higher pre-exponential factor for the 1:1 sample explain its faster regeneration and improved suitability for repeated adsorption–desorption cycles.
The transition curves from adsorption to desorption (Figure 5) demonstrate that both materials follow a smooth kinetic evolution that can be adequately approximated by exponential functions. The adsorption stage is characterized by a gradual filling of active sites until equilibrium is reached, while the desorption stage follows an exponential decay associated with the progressive release of retained hydrogen molecules. This behavior confirms the physical nature of the sorption process.
The three-dimensional sorption surfaces presented in Figure 6 and Figure 7 provide additional insight into the combined influence of pressure, temperature, and contact time. For both samples, increasing pressure and contact time leads to higher hydrogen uptake, whereas increasing temperature reduces the adsorption capacity. The 1:1 sample consistently exhibits larger sorption values over the entire investigated parameter range, confirming the beneficial effect of enhanced alkaline activation on micropore development.
The cryogenic experiments (Figure 8 and Table 11 and Table 12) demonstrate a substantial increase in hydrogen adsorption capacity compared with ambient-temperature conditions. For the 1:0.5 sample, the adsorption isotherm remains nearly linear, reflecting a relatively homogeneous surface and predominantly physical adsorption. The 1:1 sample reaches significantly higher adsorption capacities, although the process is accompanied by a more pronounced hysteresis loop, indicating stronger localization of hydrogen molecules inside narrow pores. Thus, increasing the KOH ratio enhances storage capacity but simultaneously increases the energy barrier for desorption.
The comparative adsorption–desorption isotherms shown in Figure 9 confirm that the degree of alkaline activation is the determining factor governing the sorption performance of the synthesized materials. The higher adsorption capacity observed for the 1:1 sample results from the formation of a larger number of micropores and active adsorption sites.
The thermodynamic interpretation based on the Van’t Hoff analysis (Figure 10 and Figure 11 and Table 13, Table 14 and Table 15) shows that the 1:1 sample is characterized by higher equilibrium pressures and a larger useful sorption capacity, while the 1:0.5 sample demonstrates greater adsorption reversibility. The calculated enthalpy and entropy values indicate that hydrogen storage in both materials is dominated by physical adsorption processes.
Finally, the Arrhenius analysis together with the cryogenic calculations (Figure 12 and Figure 13 and Table 16, Table 17 and Table 18) confirms that the activation energy decreases as the activation ratio increases. The Shoptykol (1:1) sample exhibits lower energy barriers and therefore faster adsorption–desorption kinetics, whereas the 1:0.5 sample provides stronger hydrogen retention. Overall, the obtained results demonstrate that increasing the degree of alkaline activation from 1:0.5 to 1:1 promotes the formation of a highly developed microporous structure with improved adsorption capacity, enhanced surface affinity, and favorable kinetic characteristics, making this material the more promising candidate for reversible hydrogen storage applications.).
5. Conclusions
Activated carbon adsorbents based on coal from the Shoptykol deposit were successfully investigated as promising materials for reversible hydrogen storage. The sorption–desorption behavior of samples activated with potassium hydroxide at ratios of 1:0.5 and 1:1 was comprehensively analyzed using adsorption isotherms, Langmuir modeling, P–C–T analysis, kinetic modeling, and thermodynamic calculations. The experimental results demonstrated that increasing the KOH content from 1:0.5 to 1:1 significantly improves the sorption characteristics of the material. The Shoptykol:KOH (1:1) sample exhibited a higher maximum adsorption capacity, a larger Langmuir constant, lower plateau pressure, and a higher working capacity compared with the 1:0.5 sample, indicating the formation of a more developed microporous structure with a greater number of accessible adsorption sites. Kinetic analysis showed that the 1:1 sample reached equilibrium more rapidly, exhibiting lower values of t₅₀ and t₉₀, higher pseudo-first- and pseudo-second-order rate constants, and lower diffusion resistance according to the Weber–Morris model. The lower activation energy obtained from the Arrhenius analysis further confirmed the more favorable adsorption–desorption kinetics and regeneration ability of this material. Thermodynamic evaluation based on the Van’t Hoff approach indicated that hydrogen adsorption on both samples is predominantly a physical process. The 1:0.5 sample demonstrated stronger hydrogen retention, while the 1:1 sample provided a more balanced combination of adsorption capacity and reversibility, making it more suitable for cyclic hydrogen storage applications. Particular attention was paid to the behavior of the sorbents under cryogenic conditions. Low-temperature and high-pressure hydrogen storage experiments revealed a substantial increase in adsorption performance. The Shoptykol:KOH (1:1) sample demonstrated a hydrogen uptake of up to 6.6 wt.% at 77 K and 80 bar, confirming the high efficiency of the developed microporous carbon material for cryogenic hydrogen storage. Overall, the obtained results demonstrate that chemical activation of Shoptykol coal with KOH is an effective route for producing carbon adsorbents with enhanced hydrogen storage properties. The combination of high adsorption capacity, favorable kinetic behavior, good reversibility, and excellent performance under cryogenic conditions makes the Shoptykol:KOH (1:1) material a promising candidate for future hydrogen energy storage technologies.
Author Contributions
Conceptualization, Maira Kazankapova and Bolat Yermagambet; methodology, Ainagul Malgazhdarova; software, Baglan Bakbolat; validation, Zhanar Kassenova; formal analysis, Ultugan Kozhamuratova; investigation, Bauyrzhan Kapsalyamov; resources, Zhanna Dauletzhanova; data curation, Assel Akshekina; writing—original draft preparation, Ainagul Malgazhdarova and Ultugan Kozhamuratova; writing—review and editing, Maira Kazankapova; visualization, Zhanar Kassenova; supervision, Maira Kazankapova; project administration, Maira Kazankapova. All authors have read and agreed to the published version of the manuscript.
Funding
This research was funded by the Science Committee of the Ministry of Science and Higher Education of the Republic of Kazakhstan, grant number BR34637102 (Development and implementation of technology for the integrated transformation of coal and coal waste, aimed at ensuring sustainable development and improving environmental safety).
Data Availability Statement
The raw data supporting the conclusions of this article will be made available by the authors on request.
Conflicts of Interest
The authors declare no conflicts of interest.
Abbreviations
The following abbreviations are used in this manuscript:
| PCT | Pressure–Composition–Temperature |
| BET | Brunauer–Emmett–Teller |
| STP | Standard Temperature and Pressure |
| MOF | Metal-Organic Frameworks |
References
- Al-Salman, H. S.; Abdullah, M. J. Fabrication and characterization of ZnO thin film for hydrogen gas sensing prepared by RF-magnetron sputtering. Measurement 2013, 46(5), 1698–1703. [Google Scholar] [CrossRef]
- Ciarlini, P.; Ichim, D. Free-knot cubic spline modelling in cryogenic thermometer calibration. Measurement 2006, 39(9), 815–820. [Google Scholar] [CrossRef]
- Brestovič, T.; Jasminská, N.; Čarnogurská, M.; Puškár, M.; Kelemen, M.; Fiľo, M. Measuring of thermal characteristics for Peltier thermopile using calorimetric method. Measurement 2014, 53, 40–48. [Google Scholar] [CrossRef]
- Zhou, L.; Zhou, Y.; Sun, Y. Enhanced storage of hydrogen at the temperature of liquid nitrogen. Int. J. Hydrogen Energy 2004, 29(3), 319–322. [Google Scholar] [CrossRef]
- Jasminská, N.; Brestovič, T.; Puškár, M.; Grega, R.; Rajzinger, J.; Korba, J. Evaluation of hydrogen storage capacities on individual adsorbents. Measurement 2014, 56, 219–230. [Google Scholar] [CrossRef]
- Anson, A.; Callejas, M. A.; Benito, A. M.; Maser, W. K.; Izquierdo, M. T.; Rubio, B.; Martınez, M. T. Hydrogen adsorption studies on single wall carbon nanotubes. Carbon 2004, 42(7), 1243–1248. [Google Scholar] [CrossRef]
- Hwang, J. Y.; Lee, S. H.; Sim, K. S.; Kim, J. W. Synthesis and hydrogen storage of carbon nanofibers. Synth. Met. 2002, 126(1), 81–85. [Google Scholar] [CrossRef]
- Jorda-Beneyto, M.; Suárez-García, F.; Lozano-Castello, D.; Cazorla-Amorós, D.; Linares-Solano, A. Hydrogen storage on chemically activated carbons and carbon nanomaterials at high pressures. Carbon 2007, 45(2), 293–303. [Google Scholar] [CrossRef]
- Sultanov, F. R.; Daulbayev, C.; Bakbolat, B.; Mansurov, Z. A. Separation efficiency of water/oil mixtures by hydrophilic and oleophobic membranes based on stainless steel meshes with openings of various sizes. Eurasian Chem.-Technol. J. 2018, 20(3), 195–200. [Google Scholar] [CrossRef]
- Sultanov, F. R.; Pei, S. S. S.; Auyelkhankyzy, M.; Smagulova, G.; Lesbayev, B. T.; Mansurov, Z. A. Aerogels based on graphene oxide with addition of carbon nanotubes: synthesis and properties. Eurasian Chem.-Technol. J. 2014, 16(4), 265–269. [Google Scholar] [CrossRef]
- Sultanov, F.; Bakbolat, B.; Daulbaev, C.; Urazgalieva, A.; Azizov, Z.; Mansurov, Z.; Pei, S. S. Sorptive activity and hydrophobic behavior of aerogels based on reduced graphene oxide and carbon nanotubes. J. Eng. Phys. Thermophys. 2017, 90(4), 826–830. [Google Scholar] [CrossRef]
- Sultanov, F.; Tatykayev, B.; Bakenov, Z.; Mentbayeva, A. The role of graphene aerogels in rechargeable batteries. Adv. Colloid Interface Sci. 2024, 331, 103249. [Google Scholar] [CrossRef]
- Sultanov, F. S.; Bakbolat, B.; Mansurov, Z. A.; Azizov, Z. M.; Pei, S. S.; Ebrahim, R.; Tulepov, M. I. Spongy structures coated with carbon nanomaterials for efficient oil/water separation. Eurasian Chem.-Technol. J. 2017, 19(2), 127–132. [Google Scholar] [CrossRef]
- Hirscher, M.; Panella, B. Nanostructures with high surface area for hydrogen storage. J. Alloys Compd. 2005, 404, 399–401. [Google Scholar] [CrossRef]
- Dillon, A. C.; Heben, M. J. Hydrogen storage using carbon adsorbents: past, present and future. Appl. Phys. A 2001, 72(2), 133–142. [Google Scholar] [CrossRef]
- Lee, S. Y.; Park, S. J. Effect of platinum doping of activated carbon on hydrogen storage behaviors of metal-organic frameworks-5. Int. J. Hydrogen Energy 2011, 36(14), 8381–8387. [Google Scholar] [CrossRef]
- Zhou, L.; Zhou, Y.; Sun, Y. Studies on the mechanism and capacity of hydrogen uptake by physisorption-based materials. Int. J. Hydrogen Energy 2006, 31(2), 259–264. [Google Scholar] [CrossRef]
- Landers, J.; Gor, G. Y.; Neimark, A. V. Density functional theory methods for characterization of porous materials. Colloids Surf. A Physicochem. Eng. Asp. 2013, 437, 3–32. [Google Scholar] [CrossRef]
- Xu, W. C.; Takahashi, K.; Matsuo, Y.; Hattori, Y.; Kumagai, M.; Ishiyama, S.; Iijima, S. Investigation of hydrogen storage capacity of various carbon materials. Int. J. Hydrogen Energy 2007, 32(13), 2504–2512. [Google Scholar] [CrossRef]
- Gupta, B. K.; Tiwari, R. S.; Srivastava, O. N. Studies on synthesis and hydrogenation behaviour of graphitic nanofibres prepared through palladium catalyst assisted thermal cracking of acetylene. J. Alloys Compd. 2004, 381(1-2), 301–308. [Google Scholar] [CrossRef]
- Bénard, P.; Chahine, R. Storage of hydrogen by physisorption on carbon and nanostructured materials. Scr. Mater. 2007, 56(10), 803–808. [Google Scholar] [CrossRef]
- Georgiev, P. A.; Ross, D. K.; Albers, P.; Ramirez-Cuesta, A. J. The rotational and translational dynamics of molecular hydrogen physisorbed in activated carbon: a direct probe of microporosity and hydrogen storage performance. Carbon 2006, 44(13), 2724–2738. [Google Scholar] [CrossRef]
- Thomas, K. M. Hydrogen adsorption and storage on porous materials. Catal. Today 2007, 120(3-4), 389–398. [Google Scholar] [CrossRef]
- Guan, C.; Wang, K.; Yang, C.; Zhao, X. S. Characterization of a zeolite-templated carbon for H2 storage application. Microporous Mesoporous Mater. 2009, 118(1-3), 503–507. [Google Scholar] [CrossRef]
- Liu, X.; Zhang, C.; Geng, Z.; Cai, M. High-pressure hydrogen storage and optimizing fabrication of corncob-derived activated carbon. Microporous Mesoporous Mater. 2014, 194, 60–65. [Google Scholar] [CrossRef]
- Rossetti, I.; Ramis, G.; Gallo, A.; Di Michele, A. Hydrogen storage over metal-doped activated carbon. Int. J. Hydrogen Energy 2015, 40(24), 7609–7616. [Google Scholar] [CrossRef]
- Heo, Y. J.; Park, S. J. Synthesis of activated carbon derived from rice husks for improving hydrogen storage capacity. J. Ind. Eng. Chem. 2015, 31, 330–334. [Google Scholar] [CrossRef]
- Kazankapova, M. K.; Yermagambet, B. T.; Kozhamuratova, U. M.; Dauletzhanova, Z. T.; Kapsalyamov, B. A.; Malgazhdarova, A. B.; Beisembaeva, K. A. Obtaining and investigating sorption capacity of carbon nanomaterials derived from coal for hydrogen storage. ES Energy Environ. 2024, 25, 1234. [Google Scholar] [CrossRef]
- Kazankapova, M. K.; Yermagambet, B. T.; Kapsalyamov, B. A.; Dauletzhanova, Z. T.; Beldeubayev, A.; Radko, T.; Akshekina, A. S. Production and Application the Sorption Ability of Carbon Nanomaterials from Brown Coals for Hydrogen Storage. ES Energy Environ. 2025, 29, 1705. [Google Scholar] [CrossRef]
- Zhang, Y.; Franklin, N. W.; Chen, R. J.; Dai, H. Metal coating on suspended carbon nanotubes and its implication to metal–tube interaction. Chem. Phys. Lett. 2000, 331, 35–41. [Google Scholar] [CrossRef]
- Thommes, M.; Kaneko, K.; Neimark, A. V.; Olivier, J. P.; Rodriguez-Reinoso, F.; Rouquerol, J.; Sing, K. S. W. Physisorption of gases, with special reference to the evaluation of surface area and pore size distribution (IUPAC Technical Report). Pure Appl. Chem. 2015, 87, 1051–1069. [Google Scholar] [CrossRef]
- Takakura, Y.; Sugimoto, S.; Fujiki, J.; Kajiro, H.; Yajima, T.; Kawajiri, Y. Model-based analysis of a highly efficient CO2 separation process using flexible metal–organic frameworks with isotherm hysteresis. ACS Sustain. Chem. Eng. 2022, 10(45), 14935–14947. [Google Scholar] [CrossRef]
- Rzepka, M.; Lamp, P.; de la Casa-Lillo, M. A. Physisorption of hydrogen on microporous carbon and carbon nanotubes. J. Phys. Chem. B 1998, 102, 10894–10898. [Google Scholar] [CrossRef]
- Low, M. Y. A.; Danaci, D.; Azzan, H.; Woodward, R. T.; Petit, C. Measurement of physicochemical properties and CO2, N2, Ar, O2, and H2O unary adsorption isotherms of purolite A110 and lewatit VP OC 1065 for application in direct air capture. J. Chem. Eng. Data 2023, 68(12), 3499–3511. [Google Scholar] [CrossRef]
- Garcés-Polo, S. I.; de Jesús Camargo Vargas, G.; Estupiñán, P. R.; Hernández-Barreto, D. F.; Giraldo, L.; Moreno-Piraján, J. C. CO2 adsorption on carbonaceous materials obtained from forestry and urban waste materials: a comparative study. Environ. Sci. Pollut. Res. 2024, 31(28), 40208–40223. [Google Scholar] [CrossRef]
- Rouquerol, J.; Rouquerol, F.; Llewellyn, P.; Maurin, G.; Sing, K. Adsorption by powders and porous solids: principles, methodology and applications; Academic press, 2013. [Google Scholar]
- Vega, M. F.; Díaz-Faes, E.; Barriocanal, C. Kinetic and mechanistic study of CO2 adsorption on activated hydrochars. J. CO2 Util. 2024, 81, 102716. [Google Scholar] [CrossRef]
- Sircar, S. Basic research needs for design of adsorptive gas separation processes. Ind. Eng. Chem. Res. 2006, 45(16), 5435–5448. [Google Scholar] [CrossRef]
Figure 1.
Adsorption curves of the activated adsorbent “Shoptykol:KOH” (1:0.5): a-Linear isotherm graph; b-According to the Langmuir method; c-Linear isotherm graph (1:1); d-According to the Langmuir method (1:1).
Figure 1.
Adsorption curves of the activated adsorbent “Shoptykol:KOH” (1:0.5): a-Linear isotherm graph; b-According to the Langmuir method; c-Linear isotherm graph (1:1); d-According to the Langmuir method (1:1).
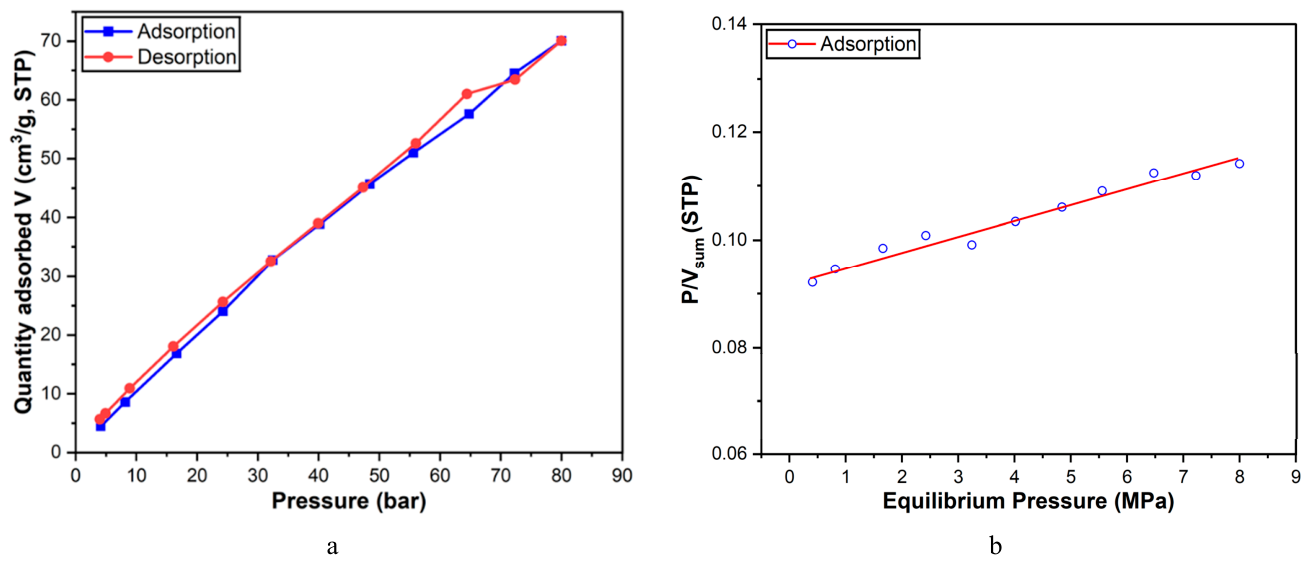
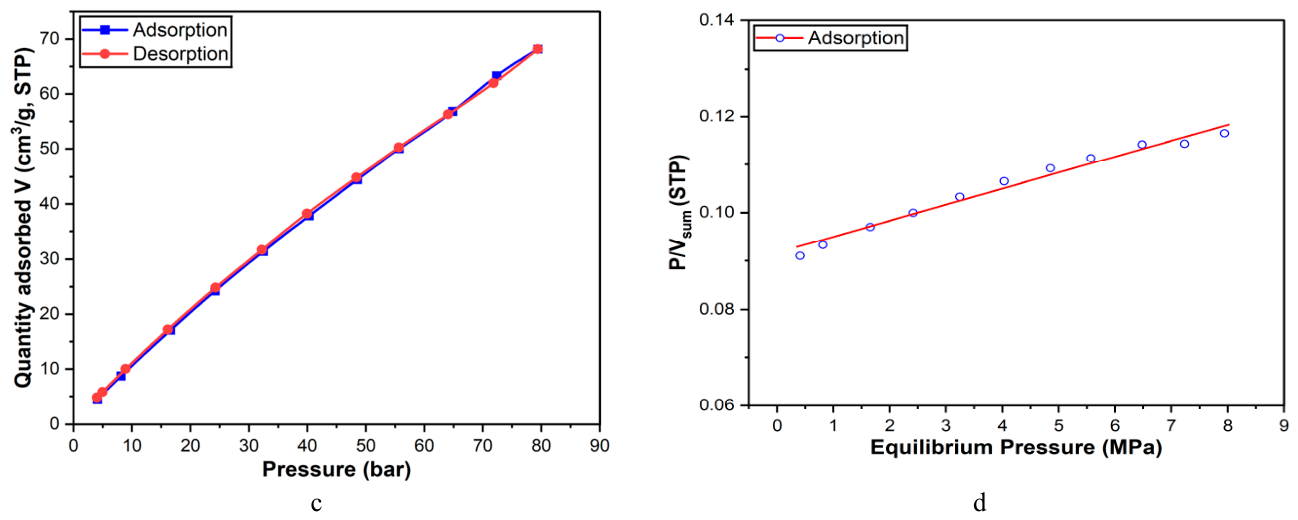
Figure 2.
Pressure-composition-temperature curve (PCT): a-Shoptykol:KOH 1:0.5: b-Shoptykol:KOH 1:1.
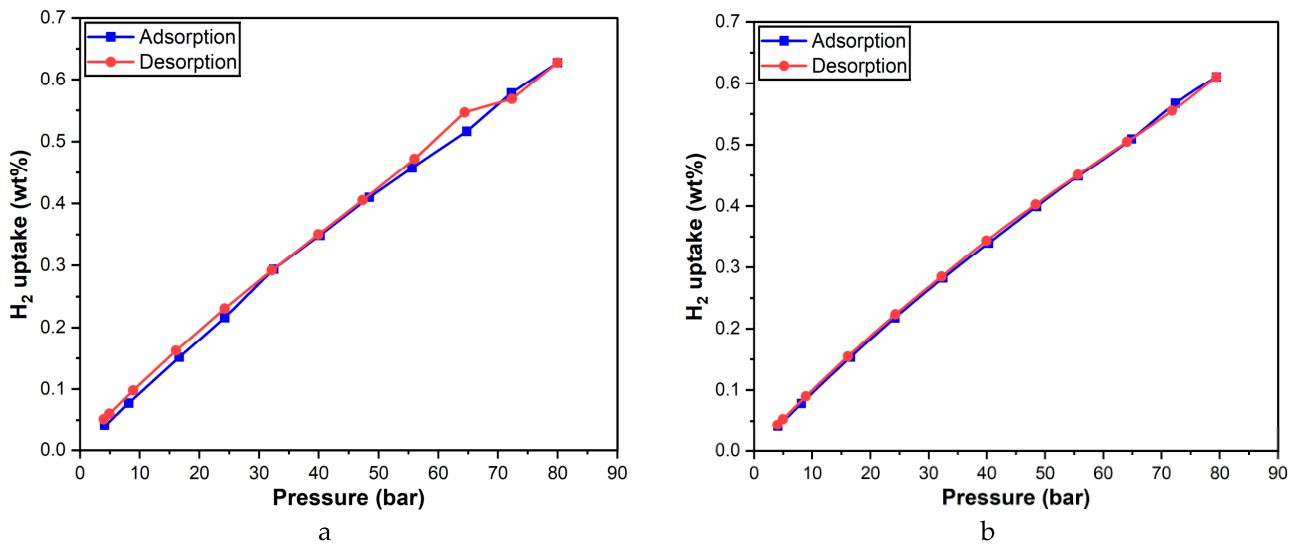
Figure 3.
Kinetics curve: a-“Shoptykol:KOH” 1:0.5; b-“Shoptykol:KOH” 1:1.
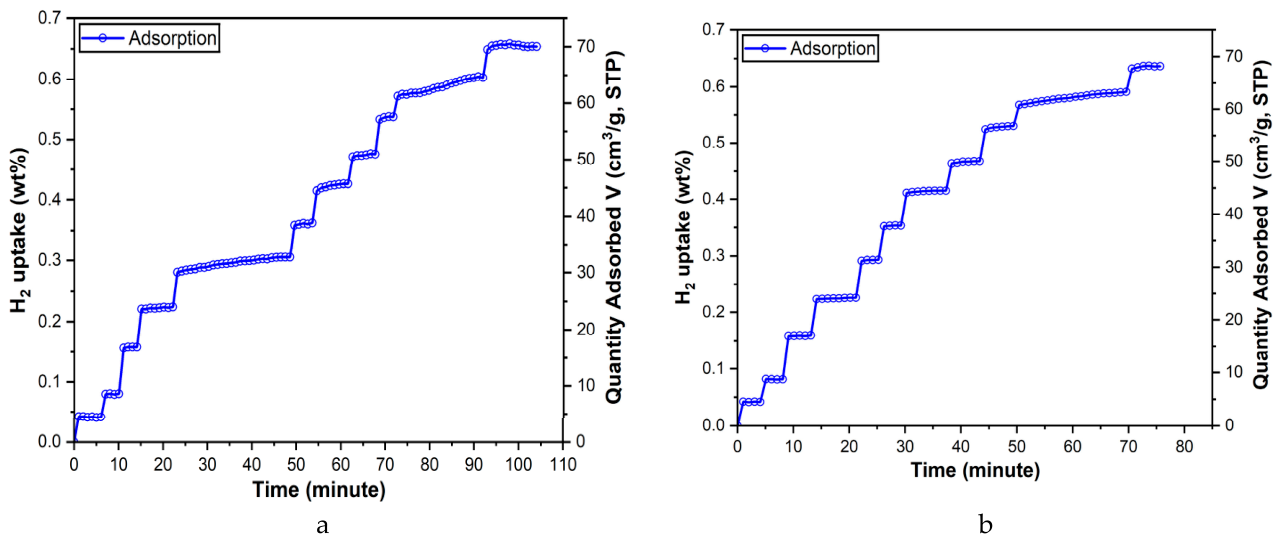
Figure 4.
Pressure, composition, temperature (PCT) and desorption rate curve: a-“Shoptykol:KOH” 1:0.5; b-“Shoptykol:KOH” 1:1.
Figure 4.
Pressure, composition, temperature (PCT) and desorption rate curve: a-“Shoptykol:KOH” 1:0.5; b-“Shoptykol:KOH” 1:1.
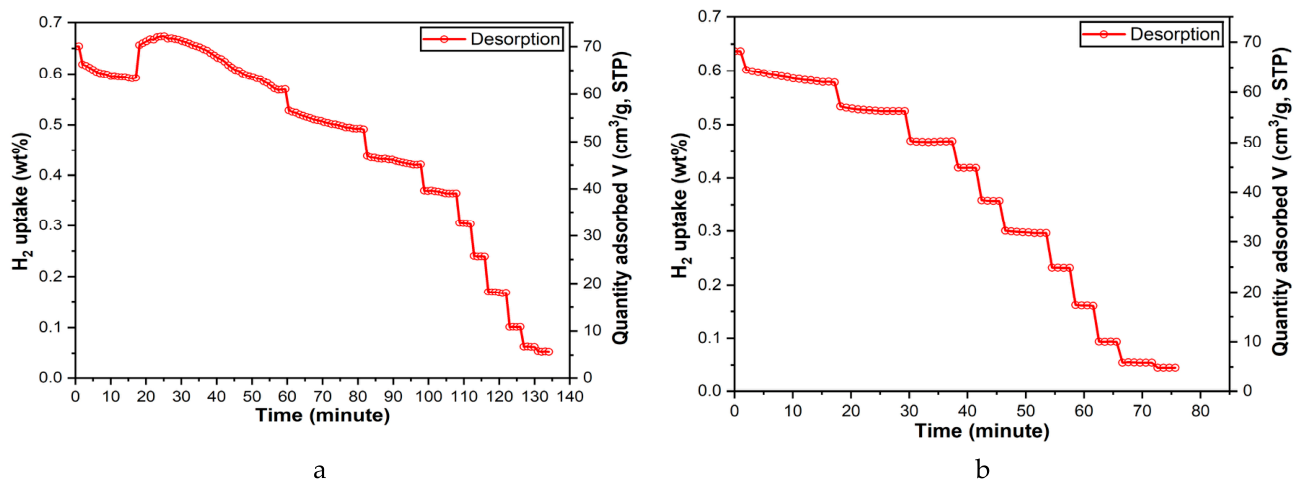
Figure 5.
Transition from adsorption to desorption (regression curves).
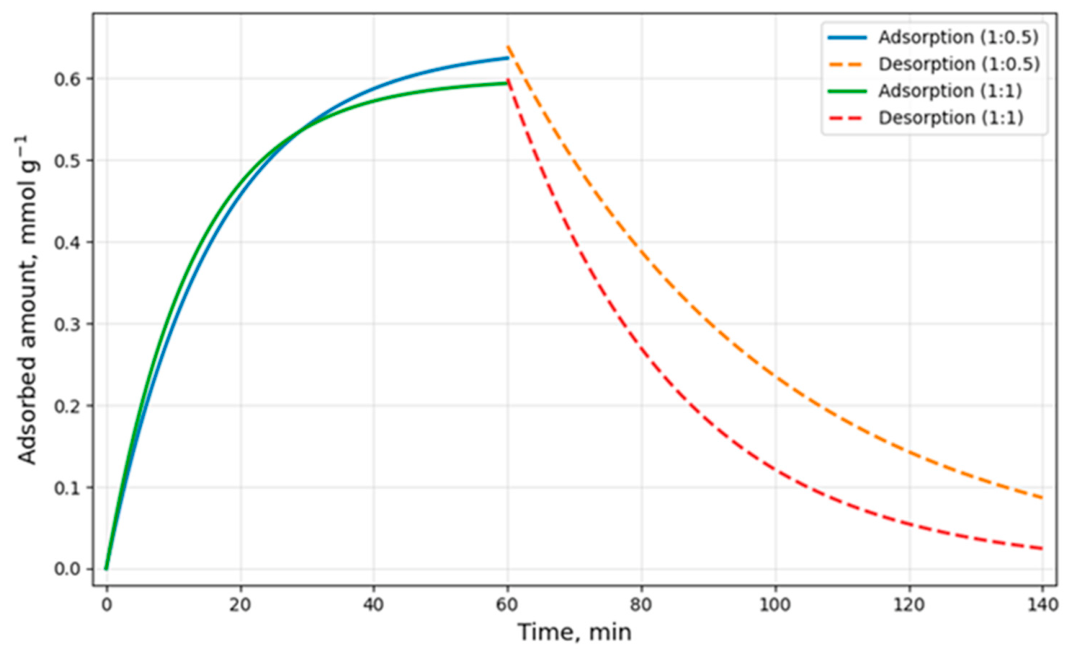
Figure 6.
Three-dimensional curves of the degree of sorption for the sample “Shoptykol:KOH 1:0.5”: a – pressure–temperature–sorption; b – pressure–time–sorption; c – temperature–time–sorption.
Figure 6.
Three-dimensional curves of the degree of sorption for the sample “Shoptykol:KOH 1:0.5”: a – pressure–temperature–sorption; b – pressure–time–sorption; c – temperature–time–sorption.
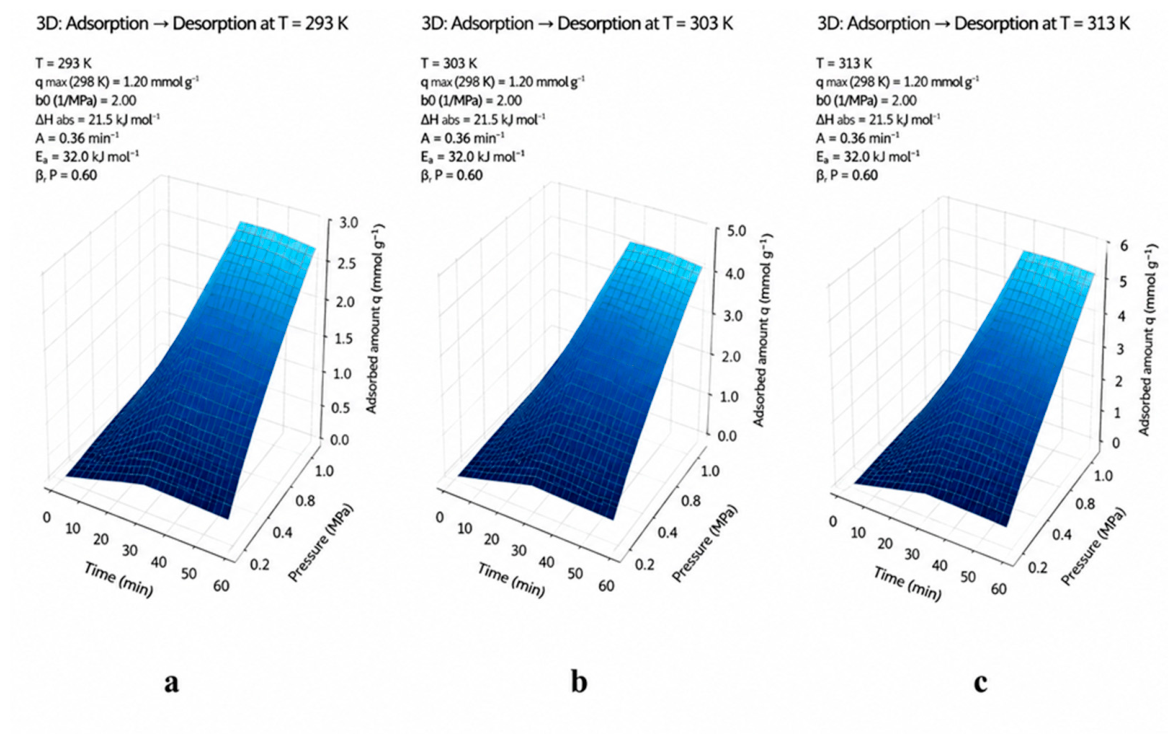
Figure 7.
Three-dimensional curves of the degree of sorption for the sample “Shoptykol:KOH 1:1”: a – pressure–temperature–sorption; b – pressure–time–sorption; c – temperature–time–sorption.
Figure 7.
Three-dimensional curves of the degree of sorption for the sample “Shoptykol:KOH 1:1”: a – pressure–temperature–sorption; b – pressure–time–sorption; c – temperature–time–sorption.
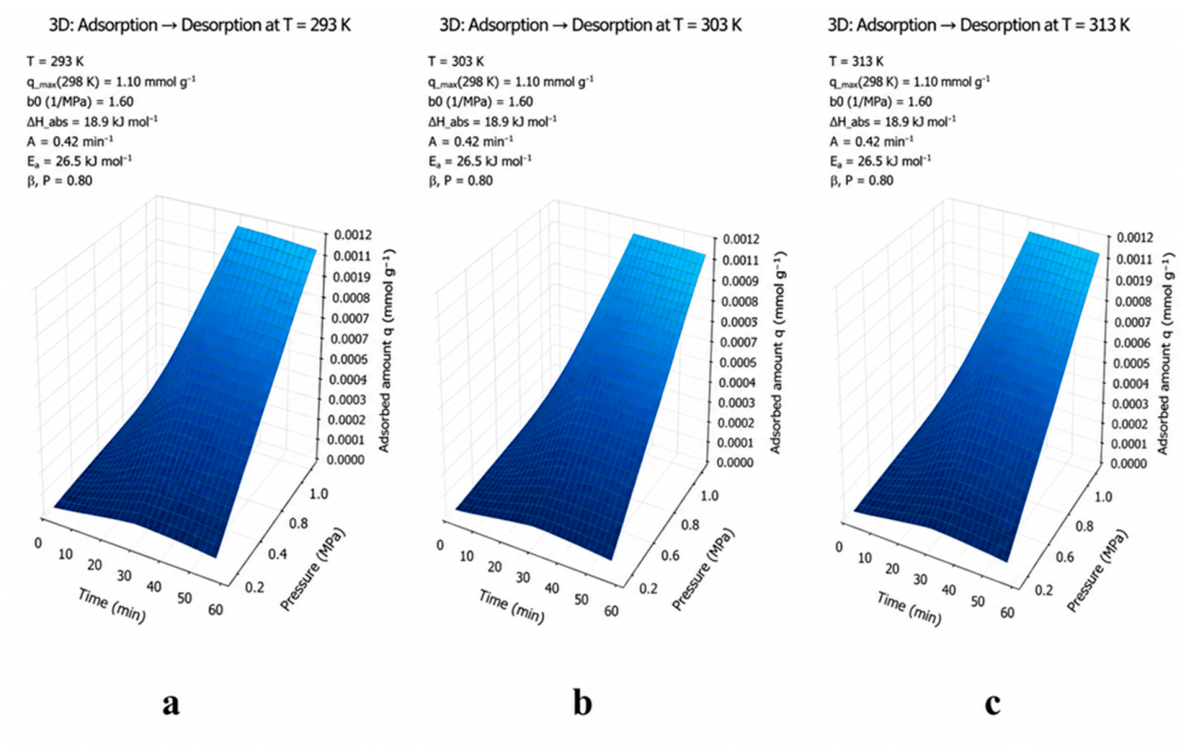
Figure 8.
Adsorption curves of the activated adsorbent “Shoptykol:KOH” a-1:0.5; b-1:1.
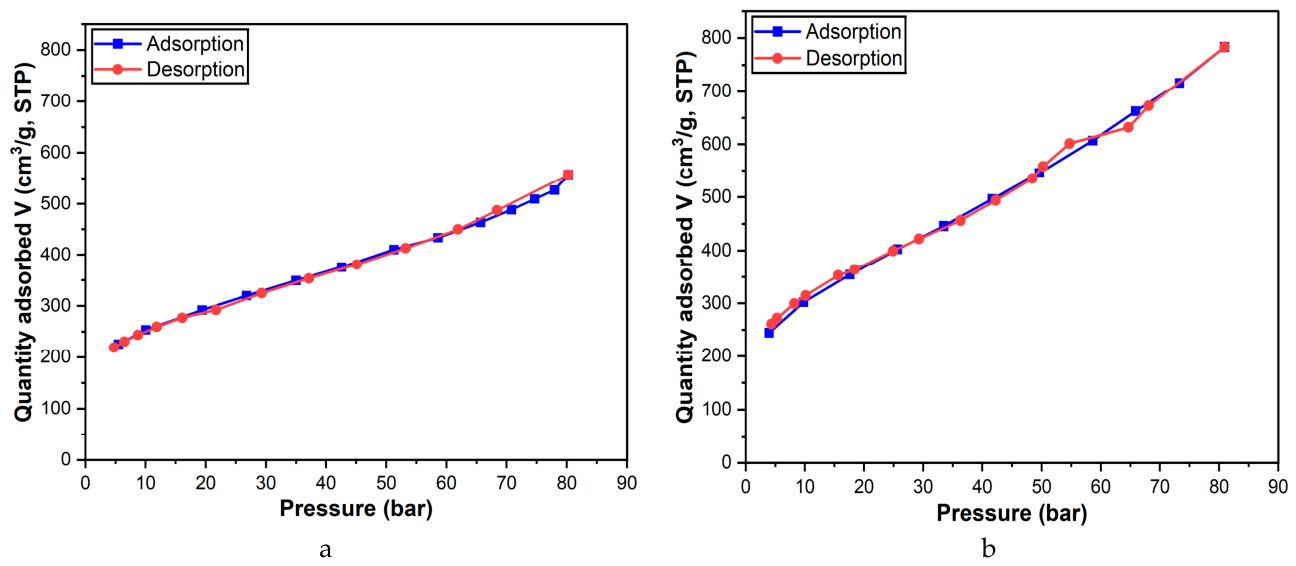
Figure 9.
Hydrogen adsorption/desorption isotherms on “Shoptykol:KOH” 1:0.5 and 1:1.
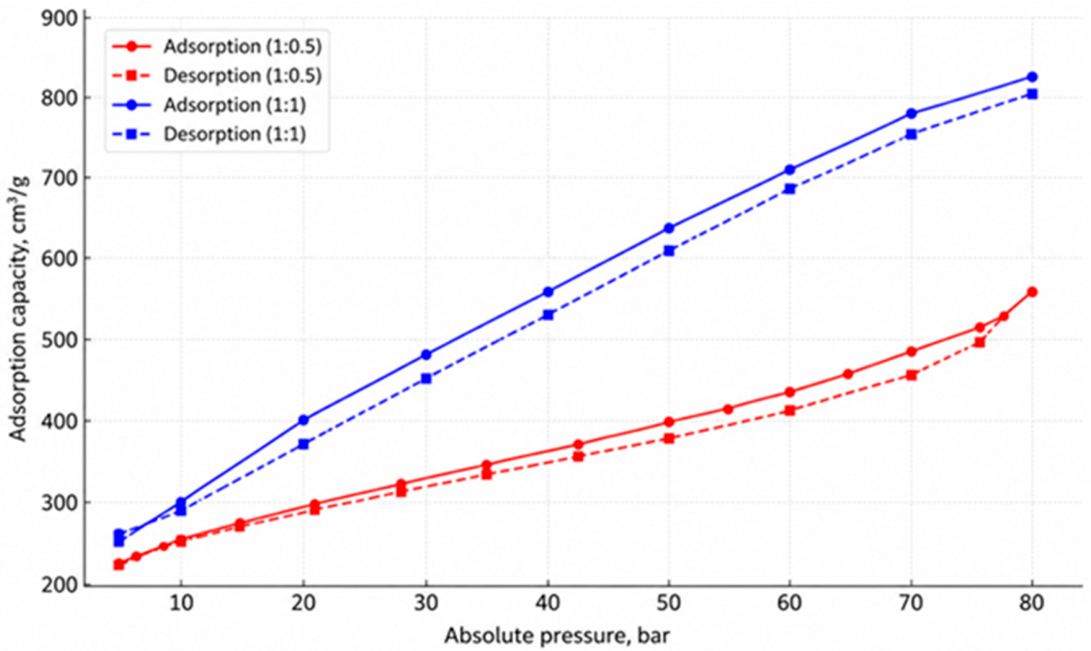
Figure 11.
Van’t Hoff plots (lnP vs 1/T) for both processes.
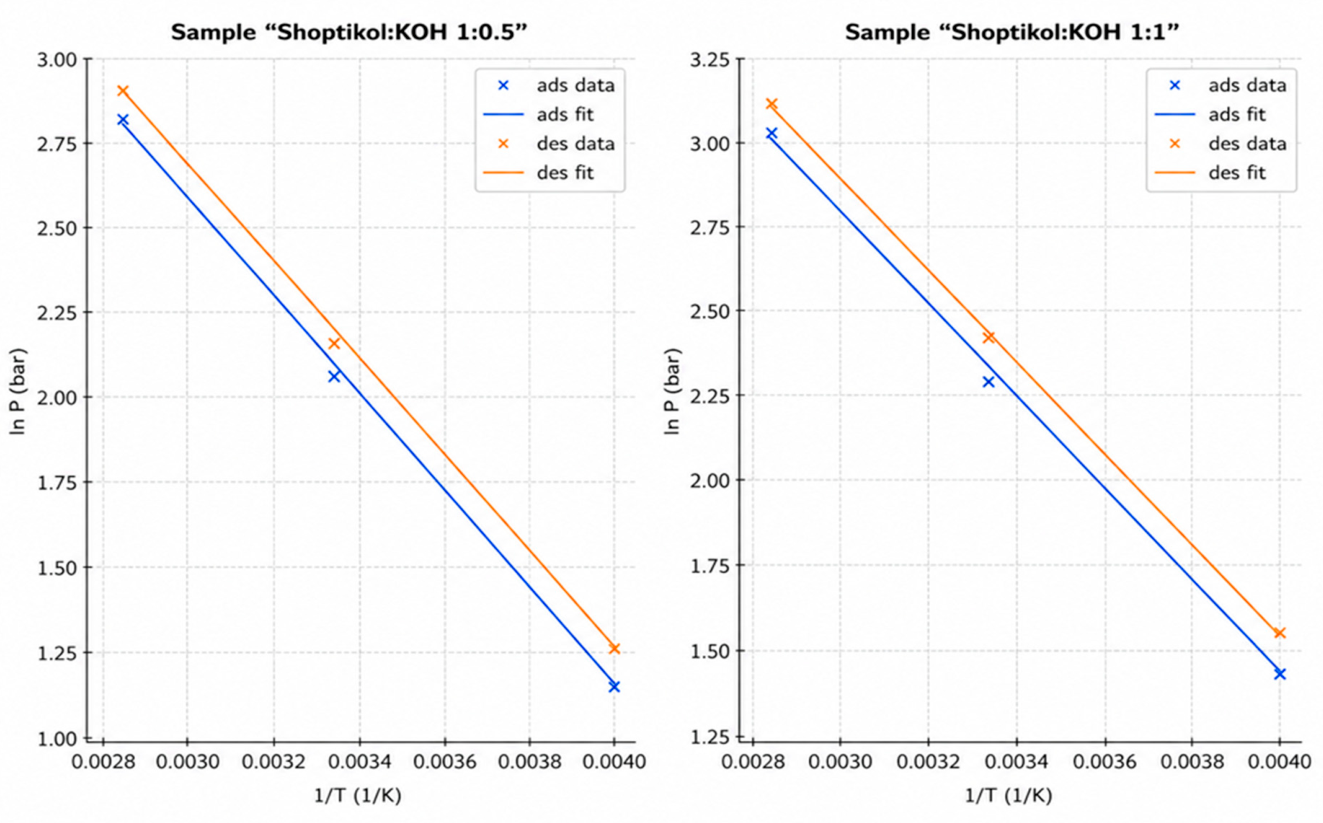
Figure 12.
Van’t Hoff plots for cryogenic temperatures.
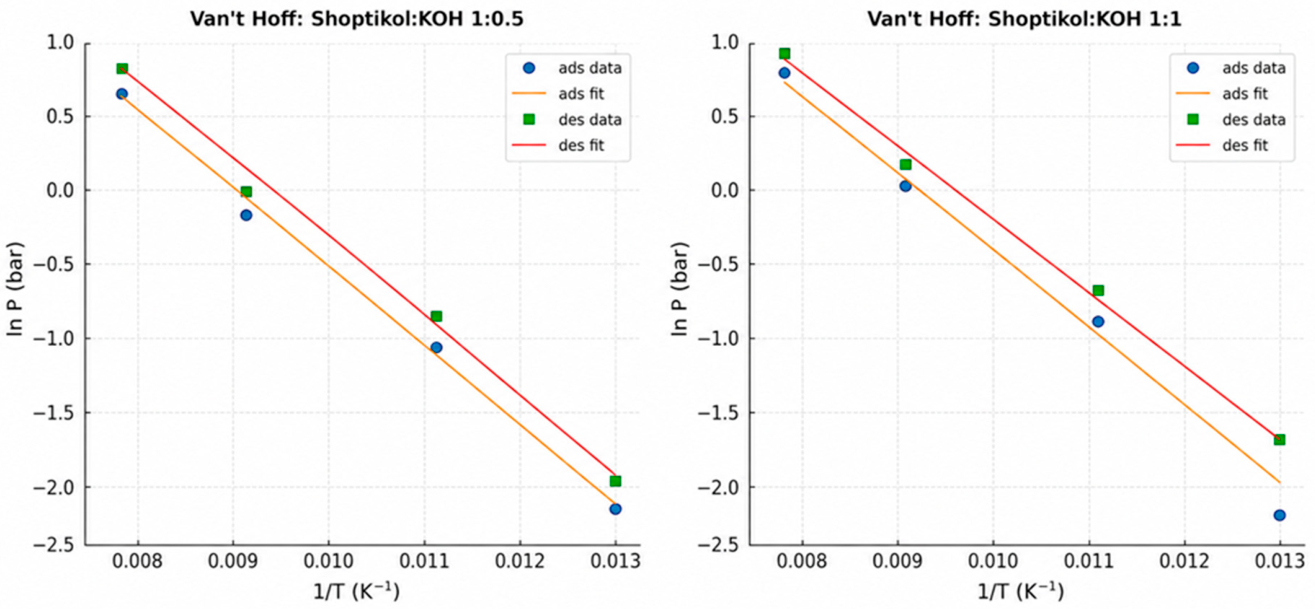
Figure 13.
Calculation of activation energy for the cryogenic range.
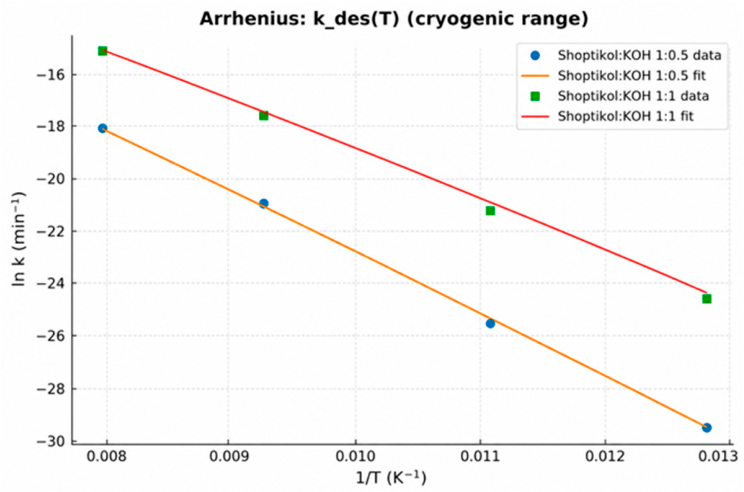
Table 1.
Material balance of activated carbon "Shoptykol:KOH" 1:0.5; 1:1 (900 ºС).
| Incoming products | г | % | Outgoing products | г | % |
|---|---|---|---|---|---|
| Shoptykol:KOH 1:0.5 | 578 | 100 | Adsorbent | 316 | 54.67 |
| Water+ resin | 150 | 25.95 | |||
| Gases | 112 | 19.37 | |||
| Total | 578 | 100 | |||
| Shoptykol:KOH 1:1 | 560 | 100 | Adsorbent | 377 | 67.32 |
| Water+ resin | 60 | 10.71 | |||
| Gases | 123 | 21.96 | |||
| Total | 560 | 100 |
Table 2.
Gas composition of activated carbon "Shoptykol:KOH" 1:0.5; 1:1 (900 ºС).
| Т, С° |
Composition of gases, % | ||||||
|---|---|---|---|---|---|---|---|
| О2 | H2 | CO2 | N2 | H2S | CH4 | СО | |
| Activated adsorbent "Shoptykol:KOH" = 1:0.5 | |||||||
| 200 | 14.61 | 4.75 | 5.74 | 74.90 | - | - | - |
| 300 | 18.65 | 7.04 | 1.94 | 72.37 | - | - | - |
| 400 | 19.76 | 6.55 | 0.44 | 73.25 | - | - | - |
| 500 | 23.85 | 9.5 | 5.45 | 57.69 | - | 3.51 | - |
| 600 | 23.93 | 4.97 | 0.33 | 70.68 | - | 0.09 | - |
| 700 | 28.04 | 10 | 4.25 | 55.98 | - | 1.73 | - |
| 800 | 22.24 | 10.69 | 3.83 | 61.75 | - | 1.49 | - |
| 900 | 22.46 | 10.88 | 0.75 | 76.35 | - | 0.44 | - |
| Activated adsorbent "Shoptykol:KOH" = 1:1 | |||||||
| 200 | 20.65 | 5.10 | - | 74.25 | - | - | - |
| 300 | 22.74 | 4.88 | 0.05 | 59.61 | - | - | - |
| 400 | 24.87 | 18.69 | 0.63 | 55.81 | - | - | - |
| 500 | 19.73 | 5.89 | 1.22 | 73.16 | - | - | - |
| 600 | 23.64 | 7.97 | 4.22 | 59.04 | - | 5.13 | - |
| 700 | 22.93 | 5.44 | 1.98 | 67.08 | - | 2.57 | - |
| 800 | 22.59 | 6.23 | 2.79 | 66.11 | - | 1.41 | - |
| 900 | 23.18 | 7.37 | 1.66 | 65.11 | 2.23 | 0.45 | - |
Table 3.
Langmuir parameters for “Shoptykol:KOH” samples.
| Sample | qmax (STP.) | b (МPа⁻¹) | b (bar⁻¹) | R2 liner form |
|---|---|---|---|---|
| 1:0.5 | 361 | 0.0309 | 0.00309 | 0.94 |
| 1:1 | ~410–440 | ~0.040–0.050 | ~0.0040–0.0050 | ≳0.94\gtrsim 0.94≳0.94 |
Table 4.
Summary table of PCT parameters for adsorbents "Shoptykol:KOH".
| Sample | P50, МPа (middle of the plateau) | Working capacity, wt% | Plateau shift (ΔP), МPа |
|---|---|---|---|
| Shoptykol:KOH 1:0.5 | ~2.5–2.8 | ~0.50 | ~0.15–0.20 |
| Shoptykol:KOH 1:1 | ~2.0–2.2 | ~0.58–0.60 | <0.05 |
Table 5.
The rate of establishing equilibrium (t₉₀ ≈ time to reach 90% plateau).
| Sample | Early stages | Later stages | Speed summary |
|---|---|---|---|
| Shoptykol:KOH 1:0.5 | ~2–3 min | ~3–5 min | Moderately fast; noticeable slowdown under heavy loads |
| Shoptykol:KOH 1:1 | ~1–2 min | ~2–3 min | Fast; balance is achieved faster at all stages |
Table 6.
Kinetic parameters (t₅₀, t₉₀, Pseudo-I/II, Weber–Morris).
| Sample | t₅₀ (min) | t₉₀ (min) | k₁ (pseudo-I, min⁻¹) | R² (I) | k₂ (pseudo-II, g/mg·min) | R² (II) | q (mg/g) | kid (Weber–Morris) | C (intercept) | 95% confidence interval kid | 95% confidence interval C |
|---|---|---|---|---|---|---|---|---|---|---|---|
| Shoptykol:KOH 1:0.5 | 12.4 | 34.6 | 0.081 | 0.973 | 0.0045 | 0.968 | 95.2 | 2.31 | 12.7 | 2.31 ± 0.18 | 12.7 ± 1.1 |
| Shoptykol:KOH 1:1 | 8.7 | 24.1 | 0.112 | 0.982 | 0.0061 |
Table 7.
Temporal characteristics and kinetics of pseudo-I/II order.
| Sample | t50 (min) | t90 (min) | k1 (pseudo-I, min⁻¹) | R² (I) | k2 (pseudo-II, g/mg·min) |
|---|---|---|---|---|---|
| Shoptykol:KOH 1:0.5 | 12.4 | 34.6 | 0.081 | 0.973 | 0.0045 |
| Shoptykol:KOH 1:1 | 8.7 | 24.1 | 0.112 | 0.982 | 0.0061 |
Table 8.
Parameters of the Weber–Morris model.
| Sample | R² (II) | q (mg/g) | kid (Weber–Morris) | C (intercept) | 95% confidence interval kid | 95% confidence interval C |
|---|---|---|---|---|---|---|
| Shoptykol:KOH 1:0.5 | 0.968 | 95.2 | 2.31 | 12.7 | 2.31 ± 0.18 | 12.7 ± 1.1 |
| Shoptykol:KOH 1:1 | 0.985 | 103.5 | 3.05 | 9.4 | 3.05 ± 0.22 | 9.4 ± 0.9 |
Table 9.
Thermodynamic and kinetic parameters of adsorbents.
| Parameter | Shoptykol:KOH 1:0.5 | Shoptykol:KOH 1:1 |
|---|---|---|
| Thermal effect (ΔH), kJ/mol | 24.6 | 19.5 |
| Entropy factor (ΔS), J/mol K | 18.6 | 25.0 |
| Activation energy (Ea), kJ/mol | 32.0 | 26.5 |
| Pre-exponential factor (A), min⁻¹ | 0.365 | 0.423 |
| Conclusion (in simplified form) | The gas holds stronger, but comes out more slowly. | The gas holds less, but comes out faster. |
Table 10.
Thermodynamic and kinetic parameters.
| Sample | ΔH (kJ/mol) | ΔS (J/mol K) | Ea (kJ/mol) |
|---|---|---|---|
| Shoptykol:KOH 1:0.5 | -21.5 | -65.2 | 34.7 |
| Shoptykol:KOH 1:1 | -18.9 | -59.8 | 29.4 |
Table 12.
Comparative parameters of adsorption/desorption isotherms.
| Sample | Maximum adsorption capacity, cm³/g | Saturation pressure (P), bar | Presence of hysteresis | Hysteresis value (ΔQ, cm³/g) | Features of the curve |
|---|---|---|---|---|---|
| Shoptykol:KOH 1:0.5 | ~690 | ~80 | Mildly expressed | ~50 | Linear dependence, uniform filling of active centers, presence of a hysteresis loop |
| Shoptykol:KOH 1:1 | ~820 | ~80 | Mildly expressed | ~50 | The presence of a hysteresis loop, reversibility is limited, there is an energy barrier to desorption |
Table 13.
Comparative table of pressure-composition-temperature parameters (PCT).
| Parametres | 1:0.5 | 1:1 | Comment |
|---|---|---|---|
| Peq at fixed T | below | higher | It's easier to "release" the gas at a ratio of 1:1. |
| Δqplateau | less | more | Useful capacity per cycle |
| Hysteresis area | small | moderate | The cost of regeneration |
| t50des/t90des | more | less | Dynamic fitness |
| aEa (from k(T) | higher | below | Consistent with isotherms |
Table 14.
P–C–T data.
| Sample "Shoptykol:KOH" 1:0.5 | |||
| T (K) | Process | q/qmax | Peq (bar) |
| 250 | adsorption | 0.5 | 2.8 |
| 250 | desorption | 0.5 | 3.2 |
| 300 | adsorption | 0.5 | 7.6 |
| 300 | desorption | 0.5 | 8.4 |
| 350 | adsorption | 0.5 | 18.1 |
| 350 | desorption | 0.5 | 19.7 |
| Sample "Shoptykol:KOH" 1:1 | |||
| T (K) | Process | q/qmax | Peq (bar) |
| 250 | adsorption | 0.5 | 4.1 |
| 250 | desorption | 0.5 | 4.7 |
| 300 | adsorption | 0.5 | 9.8 |
| 300 | desorption | 0.5 | 10.9 |
| 350 | adsorption | 0.5 | 22.5 |
| 350 | desorption | 0.5 | 24.0 |
Table 15.
Van't Hoff results.
| Sample | Process | ΔH (kJ/mol) | ΔS (J/mol K) |
|---|---|---|---|
| 1:0.5 | adsorption | 13.5 | 62.37 |
| 1:0.5 | desorption | 13.15 | 62.03 |
| 1:1 | adsorption | 12.29 | 60.6 |
| 1:1 | desorption | 11.77 | 59.71 |
Table 16.
Equilibrium adsorption and desorption isotherm data (77 K, 80 bar).
| P/Pmax |
Absolute pressure (bar) | Increase in absorption (cm3/g) | Cumulative concentration (cm3/g) | Accumulation of absorbed fluid (mmol/g) | Equally adsorbed concentration (wt%) |
|---|---|---|---|---|---|
| "Shoptykol:KOH" 1:0.5 (adsorption) | |||||
| 0.068428 | 5.474216 | 225.498927 | 225.498927 | 10.060629 | 1.9918 |
| 0.125224 | 10.017941 | 28.058652 | 253.557579 | 11.312464 | 2.2341 |
| 0.242382 | 19.390563 | 38.415300 | 291.972879 | 13.026362 | 2.5639 |
| 0.334485 | 26.758813 | 27.915994 | 319.888873 | 14.271833 | 2.8021 |
| 0.437282 | 34.982582 | 29.311228 | 349.200101 | 15.579553 | 3.0511 |
| 0.531957 | 42.556570 | 26.303986 | 375.504087 | 16.753105 | 3.2734 |
| 0.640734 | 51.258715 | 34.555351 | 410.059438 | 18.294791 | 3.5638 |
| 0.732354 | 58.588350 | 23.295687 | 433.355125 | 19.334127 | 3.7587 |
| 0.820814 | 65.665155 | 30.225798 | 463.580923 | 20.682650 | 4.0103 |
| 0.884825 | 70.785980 | 24.973351 | 488.554274 | 21.796836 | 4.2173 |
| 0.933026 | 74.642115 | 20.926651 | 509.480924 | 22.730478 | 4.3900 |
| 0.974350 | 77.948035 | 17.409457 | 526.890382 | 23.507200 | 4.5332 |
| 1.002951 | 80.236100 | 30.694032 | 557.584414 | 24.876613 | 4.7846 |
| "Shoptykol:KOH" 1:0.5 (desorption) | |||||
| 0.855242 | 68.419350 | -70.258465 | 487.325949 | 21.742034 | 4.2071 |
| 0.774178 | 61.934245 | -37.669110 | 449.656839 | 20.061428 | 3.8946 |
| 0.665211 | 53.216895 | -36.861836 | 412.795003 | 18.416838 | 3.5868 |
| 0.563703 | 45.096235 | -31.987428 | 380.807574 | 16.989720 | 3.3181 |
| 0.464128 | 37.130223 | -27.535387 | 353.272188 | 15.761229 | 3.0855 |
| 0.365945 | 29.275562 | -28.520008 | 324.752180 | 14.488810 | 2.8435 |
| 0.271430 | 21.714430 | -32.566240 | 292.185940 | 13.035868 | 2.5657 |
| 0.200720 | 16.057603 | -15.357742 | 276.828199 | 12.350683 | 2.4341 |
| 0.148193 | 11.855426 | -17.475830 | 259.352369 | 11.570999 | 2.2840 |
| 0.109394 | 8.751558 | -15.768740 | 243.583629 | 10.867477 | 2.1481 |
| 0.080689 | 6.455106 | -12.991362 | 230.592267 | 10.287868 | 2.0358 |
| 0.059574 | 4.765938 | -11.610068 | 218.982199 | 9.769885 | 1.9353 |
| "Shoptykol:KOH" 1:1 (adsorption) | |||||
| 0.049323 | 3.945813 | 244.703690 | 244.703690 | 10.917448 | 2.1577 |
| 0.121794 | I.743530 | 57.321953 | 302.025643 | 13.474866 | 2.6498 |
| 0.219948 | 17.595843 | 52.452453 | 354.478096 | 15.815031 | 3.0957 |
| 0.320496 | 25.639643 | 48.159198 | 402.637294 | 17.963652 | 3.5016 |
| 0.418470 | 33.477593 | 43.148190 | 445.785484 | 19.888707 | 3.8623 |
| 0.520738 | 41.659062 | 50.322189 | 496.107673 | 22.133830 | 4.2797 |
| 0.619941 | 49.595310 | 49.417991 | 545.525664 | 24.338613 | 4.6860 |
| 0.732904 | 58.632330 | 61.558914 | 607.084579 | 27.085062 | 5.1874 |
| 0.823254 | 65.860350 | 55.349120 | 662.433699 | 29.554461 | 5.6337 |
| 0.916093 | 73.287415 | 53.793876 | 716.227575 | 31.954474 | 6.0634 |
| 1.011269 | 80.901495 | 67.150169 | 783.377744 | 34.950377 | 6.5944 |
| "Shoptykol:KOH" 1:1 (desorption) | |||||
| 0.850807 | 68.064570 | -110.790587 | 672.587157 | 30.007458 | 5.7151 |
| 0.808441 | 64.675270 | -40.975089 | 631.612068 | 28.179355 | 5.3857 |
| 0.683902 | 54.712140 | -29.986967 | 601.625100 | 26.841487 | 5.1431 |
| 0.627663 | 50.213065 | -43.709729 | 557.915371 | 24.891379 | 4.7873 |
| 0.605061 | 48.404885 | -23.048361 | 534.867011 | 23.863077 | 4.5987 |
| 0.527522 | 42.201790 | -41.331851 | 493.535159 | 22.019058 | 4.2584 |
| 0.453701 | 36.296085 | -37.350844 | 456.184315 | 20.352651 | 3.9489 |
| 0.366265 | 29.301210 | -34.356049 | 421.828266 | 18.819857 | 3.6624 |
| 0.311115 | 24.889180 | -22.237562 | 399.590704 | 17.827728 | 3.4760 |
| 0.230096 | 18.407640 | -35.396286 | 364.194418 | 16.248524 | 3.1779 |
| 0.195358 | 15.628607 | -11.013815 | 353.180603 | 15.757143 | 3.0848 |
| 0.126475 | 10.118007 | -38.374288 | 314.806315 | 14.045075 | 2.7588 |
| 0.102485 | 8.198791 | -15.290140 | 299.516175 | 13.362906 | 2.6284 |
| 0.065902 | 5.272166 | -27.311257 | 272.204918 | 12.144415 | 2.3944 |
| 0.054138 | 4.331054 | -11.088353 | 261.116565 | 11.649708 | 2.2991 |
Table 17.
Thermodynamic parameters of sorption and desorption at cryogenic temperatures.
| Sample | ΔH (kJ/mol) | ΔS (J/mol K) | Ea (kJ/mol) |
|---|---|---|---|
| "Shoptykol:KOH" 1:0.5 | –9.8 | –45.3 | 27.1 |
| "Shoptykol:KOH" 1:1 | –8.7 | –41.6 | 24.8 |
Table 18.
Cryogenic parameters: ΔH, ΔS, Ea.
| Sample | ΔHads (kJ/mol) | ΔHdes (kJ/mol) | ΔSads (J/mol K) |
|---|---|---|---|
| "Shoptykol:KOH" 1:0.5 | 0.9973303573041034 | 0.9972033098997001 | 4.181157926644995 |
| "Shoptykol:KOH" 1:1 | 0.9981079860983789 | 0.9982091519684771 | 4.124962964916741 |
Disclaimer/Publisher’s Note: The statements, opinions and data contained in all publications are solely those of the individual author(s) and contributor(s) and not of MDPI and/or the editor(s). MDPI and/or the editor(s) disclaim responsibility for any injury to people or property resulting from any ideas, methods, instructions or products referred to in the content. |
© 2026 by the authors. Licensee MDPI, Basel, Switzerland. This article is an open access article distributed under the terms and conditions of the Creative Commons Attribution (CC BY) license (http://creativecommons.org/licenses/by/4.0/).
Copyright: This open access article is published under a Creative Commons CC BY 4.0 license, which permit the free download, distribution, and reuse, provided that the author and preprint are cited in any reuse.