Preprint
Article

This version is not peer-reviewed.

Longstanding Transcriptional Activation of APOA1 and PON1 in Human Hepatocytes by CRISPR/dCas9 Technology—Transcriptomic Profile and Crosstalk with Endothelial Cells

Submitted:

09 June 2026

Posted:

10 June 2026

You are already at the latest version

Abstract

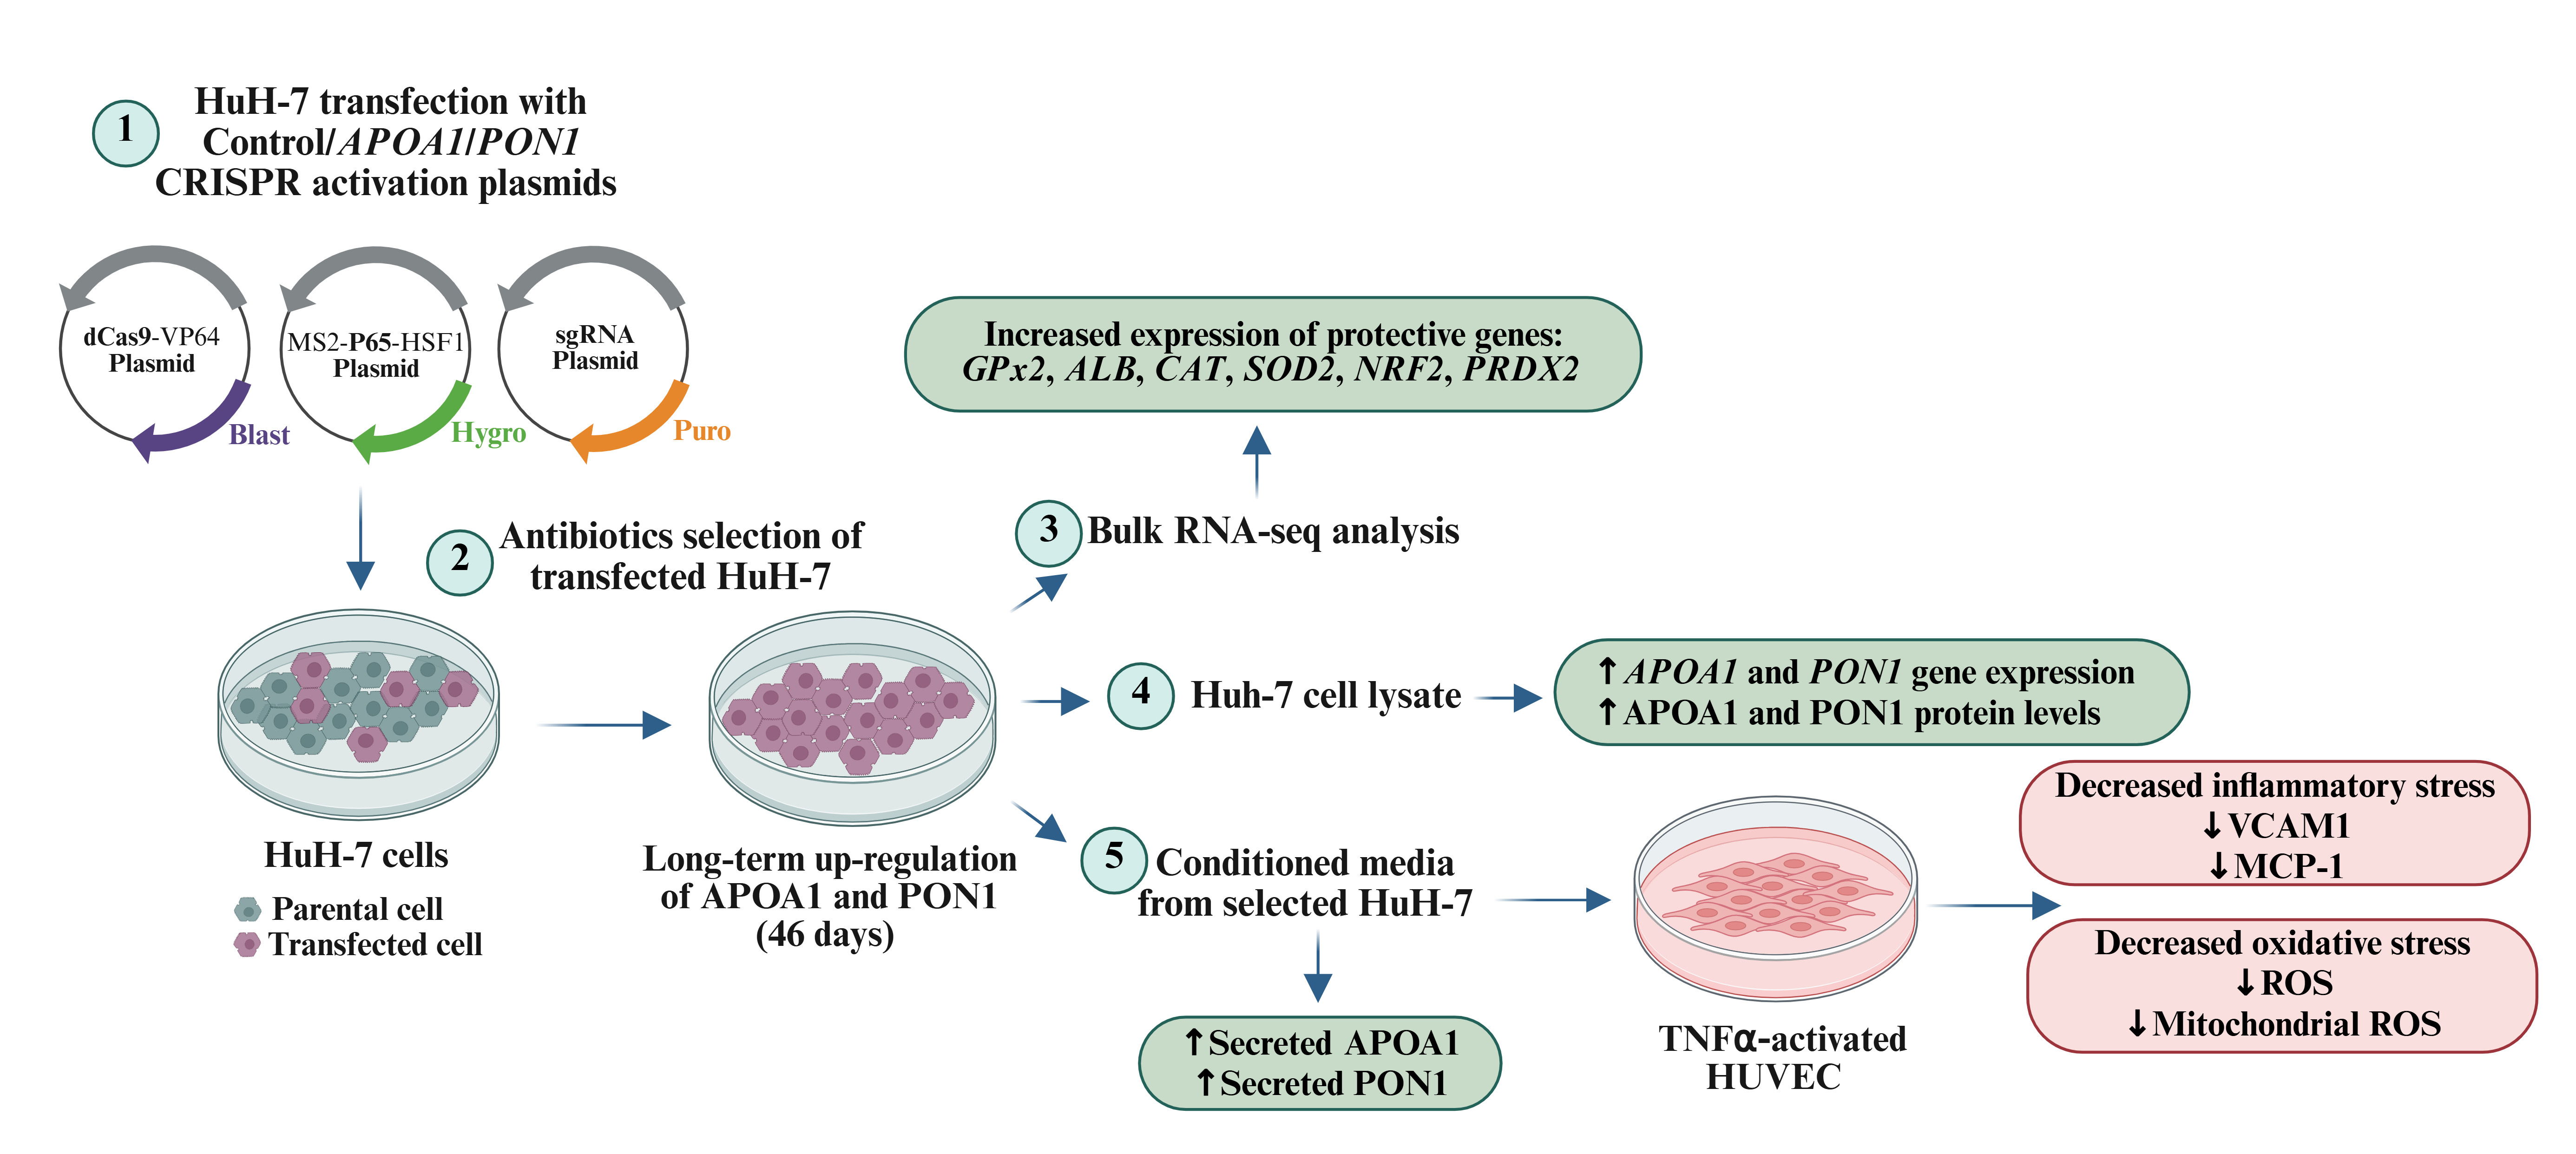
Apolipoprotein A1 (APOA1) and paraoxonase 1 (PON1) are key proteins of high-density lipoprotein (HDL). The aim of the present study was to obtain and characterize an in vitro model for endogenous APOA1 and PON1 long-time up-regulation in hepatocytes that can be further used to decipher the mechanism of their protective action. Cultured human hepatocytes (HuH-7 cell line) were transfected with CRISPR/dCas9 activation plasmids targeting APOA1/PON1 genes. Following selection with specific antibiotics, RNA sequencing was used for the transcriptomic characterization of the transfected hepatocytes. The functionality of the secreted APOAI/PON1 was evaluated as the capacity of the conditioned medium (CM) from transfected HuH-7 to modulate the oxidative and inflammatory stress in TNFα-activated primary human umbilical endothelial cells (HUVEC). The results showed that: (1) a robust, long-time up-regulation (46 days) of endogenous APOA1/PON1 was obtained after CRISPR/dCas9 transfection and antibiotics selection; (2) APOA1/PON1 up-regulation led to a modified transcriptomic profile and increased the expression of several antioxidant genes in transfected hepatocytes as demonstrated by RNAseq analysis; (3) secreted APOA1/PON1 were functional as demonstrated by the CM ability to reduce the levels of reactive oxygen species and inflammatory markers (VCAM-1, MCP-1) in TNF-α-activated HUVEC. In conclusion, we achieved an experimental model of successful long-term up-regulation of endogenous APOA1 and PON1 in human hepatocytes. The targeted proteins are secreted in a functional form and can be used for deciphering their complex mechanism of protective action in various pathological conditions.

Keywords: 
;  ;  ;  ;  ;  ;  ;  

1. Introduction

Liver is a central metabolic organ, having key roles in the regulation of lipid metabolism, oxidative stress and systemic inflammation [1]. Accumulating evidence indicates a functional crosstalk between the liver and the cardiovascular system. In this context, it has been shown that a healthy liver contributes to the vascular tree wellbeing, while its dysfunction is associated with the inception and progression of cardiovascular diseases (CVD), the clinical manifestation of atherosclerosis, which is the main cause of mortality and morbidity worldwide [1].
High-density lipoproteins (HDL) are macromolecular complexes that play an anti-atherosclerotic role. HDL is secreted mainly by hepatocytes, and its beneficial effects are mediated by two of its major proteins: apolipoprotein A1 (APOA1), main structural protein, and paraoxonase 1 (PON1), an anti-oxidant enzyme. APOA1, in the lipid-free form or associated to HDL, participates in the reverse cholesterol transport process and has anti-oxidant and anti-inflammatory properties [2,3]. PON1 exerts anti-oxidant protection to HDL and reduces the levels of the inflammatory proteins expressed by the endothelial cells exposed to pro-atherogenic conditions [2,3]. However, the mechanisms of anti-atherosclerotic action of HDL and their associated proteins are not fully understood, more investigations being required [4].
Since its discovery, CRISPR/Cas9 systems have offered innovative possibilities for the precise manipulation of cellular DNA. The system comprises a guiding RNA (gRNA) which directs Cas9 nuclease to a specific site of the host DNA based on base pair complementarity, thus allowing the gene editing (e.g., knock-ins or knock-outs). Dead Cas9 (dCas9) is a catalytically inactive Cas9, with lost endonucleases activity, which retains the ability to bind specific DNA targets, based on a single gRNA (sgRNA) sequence. These characteristics of dCas9 were exploited in the development of the CRISPR/dCas9 activation system, which contains transcriptional activator complexes in addition to the dCas9 enzyme and the customizable gRNA. The interaction of dCas9/sgRNA and transcriptional effector complexes with gene promoters enable specific, robust transcriptional activation of the target genes [5,6,7,8].
Attempts were made to increase APOA1 or PON1 levels by generating transgenic cells or animals overexpressing human APOA1, often using viral vectors to transfer the foreign DNA encoding these proteins to the host [9,10,11]. In contrast to knock-in systems, CRISPR/dCas9 systems is used for the specific transcriptional activation of endogenous genes, without affecting the genome sequence, minimizing the toxicity and offering a more physiological way for cells to produce self- functional proteins. The aim of the present study was to obtain and characterize an experimental model for long-term up-regulation of APOA1 and PON1 in cultured human hepatocytes using the advantages of the CRISPR/dCas9 activation system. Further on, the experimental model could be used to understand the mechanisms of action of these proteins or as a therapeutic approach. Deep transcriptomic analysis using the RNA sequencing approach was employed to characterize the transfected cells for the metabolic pathways that can be triggered by endogenous up-regulation of APOA1 or PON1 in hepatocytes. The functionality of the secreted APOA1 and PON1 was evaluated by assessing their capacity to modulate the oxidative and inflammatory stress in TNFα-activated primary human endothelial cells.

2. Results

2.1. Time-Course of APOA1 and PON1 Expression in Selected and Non-Selected Transfected HuH-7 Cells

After the transfection, the gene and protein expression of APOA1 and PON1 were determined in time in selected and non-selected HuH-7 cells. The Real-time PCR analysis showed that four days after the transfection, APOA1 mRNA level increased 2-fold p<0.001) and PON1 mRNA 6-fold (p<0.001) in comparison with CP (Figure 1 a and 1b). However, the levels of the gene expression of both proteins were gradually reduced in time in the non-selected cells, so that after 14 days a return to the initial CP values was observed (Figure 1 a, b). In contrast, the gene expression of APOA1 and PON1 in the cells selected with the specific antibiotics remained up-regulated, even after 46 days from the transfection, reaching higher values of mRNA compared to the ones at 4 days (approx. 20-fold for both APOA1 and PON1, p<0.001, vs. CP) (Figure 1 c, f). Consistently, the protein levels in the cell lysates and the amount of the secreted APOA1 and PON1 in the conditioned media (CM) increased slowly over time (Supplementary Figure S1) and remained highly up-regulated at 46 days (5-fold for APOA1 and 4-fold for PON-1 in cell lysate, p< 0.001; approx. 10-fold for APOA1 and 13-fold for PON1 in cells’ media, p<0.001) as demonstrated by Western blot analysis (Figure 1 d, e, g, h).

2.2. Transcriptome Profiling of HuH-7 Cells with Long-Term Upregulated APOA1 or PON1

To characterize the metabolic changes in the selected HuH-7 cells with endogenously up-regulated APOA1 or PON1, we performed bulk-RNAseq analysis of total RNA isolated from these cells. Results showed a significant change in the transcriptomic profile of the selected hepatocytes, presenting transcriptionally activated APOA1 and PON1, reflecting a modified phenotype compared to CP-treated cells, as indicated by the heatmap diagram with functional group connections for differentially expressed (DE) genes (Figure 2a). Furthermore, a significant number of DE genes reached the significance threshold (edgeR p-value ≤ 0.05 and |log2FoldChange| ≥ 0). Accordingly, over 5,900 DE genes in APOA1 group, and over 6,000 DE genes for PON1 cells were recorded. The upregulated and downregulated DE genes distribution was represented as Volcano plots. These data demonstrate the significantly modified transcriptome profiles for both APOA1 and PON1 transfected and selected hepatocytes (Figure 2b-d).

2.3. Enrichment Analysis of Differentially Expressed Genes Associated with Oxidative Signaling Pathways

We used DAVID tools and Gene Ontology (GO) database to perform a functional enrichment analysis for Biological Processes (BP) associated with identified DE genes (significantly changed, with p-value <0.05) in hepatocytes with transcriptionally-activated APOA1 or PON1. The metabolic profiles were significantly different between the two groups of selected hepatocytes (Figure 3). Accordingly, using STRING analysis of DE genes identified in DAVID, we showed that in APOA1 group most of the BP classes were related to cholesterol metabolism, such as Cholesterol metabolic processes (GO:0008203), while many BP related to oxidative stress were found to be altered by transcriptional activation in both groups, such as Response to oxidative stress (GO:003459) (Figure 3).
Using this approach, we further identified the relative expression changes of DE genes identified to belong to GO:0034599 in hepatocytes with upregulated APOA1/PON1 compared to CP. We found that, glutathione peroxidase 2 (GPX2), had the highest significant increase in cells with transcriptional activated APOA1 (log2FC = 2.36 adj.p-value = 4.03E-14) or PON1 (log2FC = 3.00, adj.p-value = 2.68E-24) (Figure 4a and b). In addition, the mRNA expression of albumin (ALB) was significantly increased in both APOA1- and PON1- CRISPR/dCas9 plasmid treated hepatocytes (log2FC = 1.96, adj.p-value = 1.98E-87, and, respectively, log2FC = 2.61, adj.p-value = 5.56E-194) (Figure 4a and b). Peroxiredoxin 2 (PRDX2), an important antioxidant enzyme, exhibited significantly increased expression in selected hepatocytes with upregulated APOA1 (log2FC = 1.11, adj.p-value = 4.95E-06) or PON1 (log2FC = 1.13, adj.p-value = 2.13E-34) (Figure 4a and b). Very interesting, we found PON1 mRNA up-regulated in the APOA1 HuH-7 cells (log2FC= 1.08, adj.p-value = 5.93E-06) (Figure 4a). Another important antioxidant enzyme, catalase (CAT), was found significantly increased only in PON1 hepatocytes (log2FC = 0.68, adj.p-value = 8.48E-07) (Figure 4b). At lower levels, SOD2 mRNA or the master transcription factor that regulates the cellular defense against oxidative stress NFE2L2 (Nrf2) were also shown to be up-regulated in PON1 HuH-7 cells (Figure 4b)
To validate the RNAseq results, some of the DE genes from transfected HuH-7 cells were selected for analysis of their protein expression. To this purpose, the antioxidant PON1 and albumin were analyzed by Western Blotting in the CM from transfected and selected HuH-7 cells. Very interesting, the results showed an increase of the protein levels of PON1 in the CM from APOA1 transfected cells. An increase in the albumin levels in the CM from APOA1 and PON1 transfected HuH-7 cells was also detected. (Figure 5 a,b,c).

2.4. APOA1 and PON1 Enriched Conditioned Media from Transfected HuH-7 Cells Alleviate TNFα-Induced Oxidative and Inflammatory Stress in Human Primary Endothelial Cells

The functionality of the secreted APOA1 and PON1 was evaluated as the capacity of the CM from transfected hepatocytes to diminish the oxidative or inflammatory stress in TNFα-activated HUVECs. To that purpose, HUVECs were activated by exposure to TNFα (6 hours), and further exposed to CM (for 18 hours) from hepatocytes with transcriptional activated APOA1/PON1. To validate the secreted APOA1/PON1 functional potential, total ROS levels, mitochondrial ROS and the expression of VCAM1 and MCP-1 was measured. The results showed that CM from HuH-7 cells with upregulated APOA1 or PON1 reduced TNFα-induced intracellular ROS levels (p<0.001 for APOA1 and p<0.01 for PON1) compared with CM from CP cells, as indicated in Figure 6a. In good agreement, both APOA1- and PON1-enriched CM slightly reduced mitochondrial ROS levels (Figure 6b).
The gene expression of VCAM-1 and MCP-1 was significantly decreased by both APOA1- and PON1-CM from transfected HuH-7 (Figure 7 a, c). CM from PON1-transactivated HuH-7 significantly decreased the protein expression for VCAM-1 and MCP-1, while APOA1-CM did not reach the statistically significance although a slight decrease is also observed (Figure 7 b, d).

3. Discussion

Studies on the athero-protective effects of HDL and its main proteins, APOA1 and PON1, are abundant, but new molecular mechanisms concerning their mode of action are needed. The key findings of the present study are: (1) CRISPR/dCas9 system was successfully used for the up-regulation of endogenous APOA1 and PON1 gene expression and increase of the secreted proteins; (2) a cellular population with sustained and long- term up-regulated APOA1 and PON1 expression was obtained after the selection of the transfected hepatocytes with specific antibiotics; (3) APOA1 and PON1 long-time up-regulation modified the transcriptomic profiles of the hepatocytes and increased protective genes, such as, GPx2, ALB, PON1, CAT, SOD2, NRF2, PRDX2; (4) APOA1 and PON1 secreted by the transfected hepatocytes are functional, as indicated by the capacity of APOA1 or PON1 enriched CM to decrease the oxidative or inflammatory stress in TNF-α activated HUVECs.
CRISPR/dCas9 is a system that does not alter the genome sequence, but allows specific regulation of endogenous genes [12]. This characteristic of CRISPR/dCas9 allows the generation of functional proteins with high specificity, with less off-target effects (as compared to CRISPR/Cas9), and without cellular exhaustion. In addition, the simple design and low cost of sgRNA, as well as the easy use in different cell types (including HuH-7) make CRISPR/Cas9 systems a good alternative for gene editing in different pathologies [7,8,13,14,15,16].
We report here a successful transcriptional activation of endogenous APOA1 and PON1 genes in HuH-7 cells by using the CRISPR/dCas9 system in accord with previously reported data on Caco-2 cells [17]. In addition, we show here that in the absence of selection antibiotics, the expression of APOA1 and PON1 slowly decreased probably due to the higher rate of cellular division of the un-transfected cells over the transfected ones. Thus, the selection with antibiotics of the transfected hepatocytes allowed the generation of a uniform population of cells with transcriptional activated APOA1 and PON1 genes, which remained up-regulated even after 46 days from the transfection moment.
To characterize these cells, we used the bulk RNAseq profiling and obtained a deep transcriptomic profile of the metabolic changes. Results show that both APOA1 and PON1 transcriptional activation generates hepatocytes with plasmid-specific phenotype as proved by the GO functional enrichment analysis of transcriptome data. Response to oxidative stress (GO:0034599) is a GO biological processes, which is altered both in ApoA1- and also PON1-transfected hepatocytes. There are only a few relevant data published related to this process [18,19,20,21]. In good agreement with our results, it was shown that administration of APOA1 mimetic peptides is associated, in a dose-dependent manner, with an increased activity of GSH peroxidases in a mouse model of Parkinson disease [18]. Similarly, administration of flaxseed oil diet or beta-sitosterol determined the up-regulation of PON1 together with increased CAT, SOD, or GPx activity and CAT expression in the liver or plasma of diabetic [19] or gamma-irradiated rat models [20]. Our results confirm these data which show an association between the levels of APOA1 or PON1 with other antioxidant proteins, and in addition, bring new evidences of a direct interconnection at the transcriptional level between the above-mentioned genes. We report here the up-regulation of PON1 in the CM from APOA1-transfected HuH-7 cells, confirming the results obtained in Caco-2 enterocytes [17], and the increase of secreted albumin, validating the RNAseq results. To the best of our knowledge, we report here for the first time that APOA1/PON1 up-regulation increases GPx2, albumin and PRDX2 mRNA in hepatocytes. This direct relation indicated by RNAseq opens directions to the identification of new protective mechanisms of APOA1 and PON1.
Data from literature had shown that ApoA1 mimetics can preserve the function of endothelial cells by reducing the oxidative stress [22,23]. PON1 recombinant was also demonstrated to reduce the expression of inflammatory proteins in endothelial cells [24]. In accord with these studies, we showed here that CM enriched in APOA1 and PON1 from hepatocytes decrease the oxidative and inflammatory stress in HUVECs. These results are in accord with another study on Caco2 enterocytes [17] and suggests that APOA1 and PON1 are functional, being at least in part responsible for the observed beneficial effects.
Although promising, the present experimental model has its limitations. One is the fact that HuH-7 cells is a tumoral cell line, so that the obtained results have to be analyzed with caution and further validated in primary hepatocytes. Next, in vitro models do not have the complexity of an in vivo model, in which organs are interconnected so that cellular response from hepatocytes can be influenced by the crosstalk with other cell types. In addition, we must keep in mind that although present in a free form in vivo, APOA1 and PON1 are mainly associated with HDL. This packaging allows the interaction with receptors, such as SR-B1 on the surface of endothelial cells, known to mediate, at least in part, the anti-atherosclerotic effects of HDL [25,26]. However, cultured cells are a good model for testing new mechanisms for various pathological conditions due to its simplicity in manipulation and obtaining.

4. Materials and Methods

4.1. Chemicals

RPMI-1640 medium (RPMI), Dulbecco’s Modified Eagle’s Medium (DMEM), penicillin, streptomycin, neomycin, 2′,7′-Dichlorofluorescein diacetate (DCFH-DA), 2',7'-Bis-(2- Carboxyethyl)-5-(and-6)-Carboxyfluorescein, Acetoxymethyl Ester (BCECF-AM), protease inhibitor cocktail, sodium fluoride, sodium orthovanadate, and bicinchoninic acid solution (BCA) were from Sigma-Aldrich Co. (MO, USA). APOA1 (sc-400499-ACT), PON1 (sc-402701-ACT), and Control (CP) (sc-437275) CRISPR/Cas9 activation plasmids, transfection medium (sc-108062) and UltraCruz Transfection Reagent (sc-395739), along with selection antibiotics Hygromycin B solution (SC-29067), Blasticidin S HCl solution (SC-495389), and Puromycin dihydrochloride (SC-108071) were supplied by Santa Cruz Biotechnology (CA, USA). Vascular Cell Basal Medium (PCS-100-030), Endothelial Cell Growth Kit-VEGF (PCS-100-041) were from ATCC (ATCC, Manassas, VA, USA), TNFα (210-TA-020/CF) was from R&D Systems, fetal bovine serum (FBS) was from GIBCO (ThermoFisher Scientific, CA, USA). High-Capacity cDNA Reverse Transcription kit and SyBr Select Master Mix were from Applied Biosystems (CA, USA). ECL chemiluminescent substrate was supplied by AppliChem GmbH (Darmstadt, Germany).

4.2. Cells and Culture Conditions

Hepatocytes from human hepatocarcinoma (HuH-7 cell line, Cell Lines Service GmbH, Germany) were cultured in RPMI-1640 supplemented with FBS (10%, v/v), penicillin (100U/mL), and streptomycin (0.1mg/mL). HuH-7 from passage 46 were transfected.
Primary human umbilical vein endothelial cells (HUVEC; PCS-100-010, ATCC, Manassas, VA, USA) were grown in Vascular Cell Basal Medium enriched with Endothelial Cell Growth Kit-VEGF according to manufacturer’s instructions. HUVEC at passage 3 were used for the experiment.

4.3. Transfection of HuH-7 Cells to Activate the Transcription of APOA1 and/or PON1 Genes Using CRISPR/dCas9 System

HuH-7 cells were seeded into 12 well plates at a density of 70.000 cells/well in complete RPMI media, without antibiotics. At 70-80% confluency, the hepatocytes were transfected using the CRISPR/dCas9 activation plasmids for APOA1, PON1, or control plasmids (CP) containing resistance genes for blasticidin, hygromycin B and puromycin. One µg DNA plasmid/mL and 2.5µL/mL transfection reagent for each transfection condition were used according to the manufacturer’s instructions. After 48h, the media was changed, and the cells were left to recover for another 48h.

4.4. Selection of Transfected HuH-7 to Obtain Long-Term Upregulation of APOA1 and/or PON1

After transfection, the culture medium was replaced with RPMI supplemented with 10% FBS, containing hygromycin B (50 µg/mL), blasticidin S HCl (2 µg/mL), and puromycin dihydrochloride (1 µg/mL). The culture medium containing selection antibiotics was changed every two days for a period of 12 days to induce the death of the un-transfected cells. After selection, the culture medium was replaced with antibiotics-free RPMI and the transfected and selected HuH-7 were allowed to grow until confluency in complete culture media.

4.5. Bulk RNA-Seq Analysis of APOA1 and PON1 Transfected Hepatocytes

Total RNA was extracted from cells using Trizol (Invitrogen, USA) based on manufacturer’s instructions. To assess RNA purity and integrity, samples were analyzed in 1% agarose gel electrophoresis, and a NanoDrop spectrophotometer was used to confirm sample purity and quantity.
Bulk long-RNA sequencing (longRNA-seq) and standard data analysis was done by external service (Novogene, UK) on total RNA isolated from hepatocytes. The analysis included an additional RNA sample quality control, directional library preparation (rRNA removal), and long-RNA sequencing on NovaSeq X Plus Series (PE150, 12G raw data per sample). Raw data analysis of transcriptomic data from Novogene include data quality control and filtering, mapping to reference genome, correlation analysis, and differential expression analysis.
Bioinformatic analysis of differential expressed (DE) genes for functional enrichment analysis was performed using DAVID (The Database for Annotation, Visualization and Integrated Discovery) or Gene Ontology (GO) biological process (BP) database [27,28]. The analyzed DE genes were defined as those with positive log2fold change and Padj < 0.05 in each dataset of group samples (APOA1 and PON1), upregulated or downregulated relative to cells transfected with CP. BP level was defined as the depth of node in AmiGO2 inferred tree view (the lower level, the more general). The depth of biological process was set to 0 and those terms deeper than 3 were considered relevant. Child annotation terms in the same branch were discarded to avoid redundancy. BP terms with Padj < 0.05 after applying Benjamini-Hochberg correction and fold enrichment > 2 were accounted for significance. Further analysis for functional gene clusters identified at BP level was performed in each APOA1 and PON1 sample group of DEG dataset (vs CP) using STRING platform [29], using high confidence interaction score (0.7) and k-means clustering (for a defined number of at least 3 clusters based on their centroids). Specific genes from the functional clusters were further identified in DEG list and histograms created to show log2FoldChange upregulation or downregulation in APOA1 and PON1 groups compared to CP group.

4.6. Preparation of Conditioned Media from Selected HuH-7 with Transcriptional Activated APOA1 and PON1

Selected HuH-7 cells at 100% confluency were incubated for 24 h with RPMI without FBS, to reduce potential FBS interference and to obtain the conditioned medium (CM) enriched in secreted APOA1 or PON1. After collection, the CM were processed by centrifugation at 300 × g for 5 min, followed by a second centrifugation at 2000 × g for 25 min to ensure pelleting of any remaining detached cells or cellular debris. The resulting CM were then either stored at −80 °C for subsequent analyses or used to assess their effects on HUVEC function.

4.7. TNFα Activation of HUVECs and Incubation with CM from HuH-7 Cells

Confluent HUVECs were stimulated with 10 ng/mL TNFα for 6 h, in the absence of FCS. Following activation, the TNFα-containing culture medium was discarded and CM from transfected HuH-7 cells was further used at a 1:1 ratio with fresh HUVECs culture media. After 18 h incubation, the HUVECs were processed for reactive oxygen species (ROS) and, quantitative Real-Time PCR and Western blot analysis. The experimental design is presented in Scheme 1.

4.8. Determination of Total Intracellular ROS

Total intracellular ROS was monitored in HUVECs through the reaction with the oxidant sensitive fluorogenic probe DCFH-DA (2,7-dichlorodihydrofluorescein diacetate) as in [30]. The fluorescence of DCF in cellular suspension was measured at 435/535 nm using Tecan Infinite M200 and ROS values were normalized to cellular protein.

4.9. Measurement of Mitochondrial ROS Levels

Mitochondrial ROS levels were measured by using MitoSOX™ Red Mitochondrial Superoxide Indicator from ThermoFisher Scientific (ThermoFisher Scientific, CA, USA) according to manufacturesrs instructions. The The fluorescence of MitoSOX was measured using Tecan Infinite M200 and the obtained results were reported to total cellular protein and normalized to CP values considered 1.

4.10. Quantitative Real-Time PCR Analysis of Gene Expression

Two μg of total RNA isolated with TRIzol reagent were reverse-transcribed to cDNA using the High-Capacity cDNA Reverse Transcription Kit with MultiScribe Reverse Transcriptase (Applied Biosystems, Waltham, Massachusetts, USA), following the recommended protocol. Quantitative Real-Time PCR was performed using a ViiA7 Real-Time PCR system (Applied Biosystems). Gene-specific primers were used for human APOA1 and PON1 in hepatocytes, and for VCAM1, MCP-1 in HUVECs; RPL13A was used as the housekeeping gene (Table S1, Supplementary material). Amplification was done using SyBr Select Master Mix (Applied Biosystems). Relative gene expression levels were determined using the “Fit Point Method” and normalized to CP cells.

4.11. Quantitative Western Blot Analysis of Protein Expression

HuH-7 cells and HUVEC were lysed in RadioImmuno Precipitation Assay (RIPA) buffer supplemented with protease and phosphatase inhibitors, on ice, using Hielscher Ultrasound Processor UP200S. The total protein concentration was assessed using the Pierce BCA Protein Assay Kit (Thermo Fisher Scientific). To concentrate CM from HuH-7, equal volumes (100 µL) from Control, CP, APOA1 and PON1 cells were precipitated using trichloracetic acid method. Western blot analysis for culture media and lysates samples was performed using standard protocol, that included SDS-PAGE migration, transfer to nitrocellulose membrane and exposure to primary antibodies for APOA1, PON1, albumin (ALB) (for hepatocytes), VCAM-1, and MCP-1 for HUVECs (Table S2, Supplementary material). The reference protein was β-actin and the ratio of target protein to β-actin expression was determined by densitometric analysis of digital images obtained with an Amersham™ ImageQuant™ 800 analyzer and ImageQuant TL analysis software (Cytiva LifeSciences, Marlborough, MA, USA).

4.12. Statistical Analysis

Statistical analysis and graphical representations were performed using GraphPad Prism software (San Diego, CA, USA). Comparisons between CP versus APOA1 or PON1 transfected HuH-7, and CM-treated HUVECs were made using the Independent Student’s T-test. P values less than 0.05 were considered statistically significant. The presented data were expressed as mean ± standard deviation (SD) from at least two experiments in triplicate.

5. Conclusions

In conclusion, our data show that long-term upregulated APOA1/PON1 genes can be achieved in HuH-7 cells by using CRISPR/dCas9 technology, followed by selection with specific antibiotics. Bulk RNAseq analysis of transfected hepatocytes indicated a modified transcriptomic profile, demonstrating a direct link between the APOA1/PON1 upregulation and the increase of genes critical for cellular antioxidant protection, such as GPx2, ALB, PON1, CAT, NRF2, SOD2, PRDX2. Secreted APOA1/PON1 from transfected and selected HuH-7 cells exerted their anti-oxidant and anti-inflammatory action in TNFα-activated HUVECs. Thus, the present experimental model can be used to confirm, complete and to bring new data regarding the mechanisms of action of APOA1 and PON1 in pathological conditions, and to design future innovative anti-atherosclerotic treatment.

Supplementary Materials

The following supporting information can be downloaded at: Preprints.org, Table S1: Primer sequences used for gene expression analysis by Real-Time PCR; Table S2: Specific antibodies used for Western Blot; Figure S1: ApoAI and PON1 levels in the conditioned media from selected HuH-7, at different time points after CRISPR/dCas9 transfection.

Author Contributions

Conceptualization , C.S.S., A.V.S. and L.T.; Methodology, C.S.S., L.T., L.S.N., E.V.F; Software, N.L.S; Validation, L.T., A.V.S, and C.S.S.; Formal Analysis, L.T., L.S.N.; Investigation, J.C.I.H., L.T., E.V.F., T.B., G.M.S; Resources, A.V.S., S.S.; Data Curation, L.T., J.I.C.H.,N.L.S.; Writing – Original Draft Preparation, L.T., J.C.I.H., N.L.S.; Writing – Review & Editing, A.V.S., C.S.S. N.L.S., T.B., L.T.; Visualization J.I.C.H., T.B.; Supervision, A.V.S., C.S.S., S.S., L.T.; Project Administration, A.V.S., C.S.S., N.L.S., S.S.; Funding Acquisition, S.S., A.V.S. All authors have read and agreed to the published version of the manuscript.

Funding

Please add: This work was supported by a grant from the Program, PNRR-III-C9-2022-I8-197 (contract no. 760059/23.05.2023), and by a grant of the Ministry of Education and Research, CCCDI - UEFISCDI, PN-IV-P6-6.1-CoEx-2024-0029, within PNCDI IV (contract no. 10-CoEx/2026) and The APC was funded by CCCDI - UEFISCDI, PN-IV-P6-6.1-CoEx-2024-0029.

Institutional Review Board Statement

Not applicable.

Data Availability Statement

The raw data supporting the conclusions of this article will be made available by the corresponding authors on request. Raw and processed RNAseq data presented in this study are available on demand and publicly available in ArrayExpress with accession number E-MTAB-17152.

Acknowledgments

The authors thank Daniela Rogoz for excellent support in the realization of Western Blots and Cristina Dobre for skillful technical assistance. Scheme 1 and graphical abstract was created with BioRender. The authors have reviewed and edited the output and take full responsibility for the content of this publication.

Conflicts of Interest

The authors declare no conflicts of interest.

Abbreviations

The following abbreviations are used in this manuscript:
APOA1 Apolipoprotein A1
PON1 Paraoxonase 1
CP Control plasmid
CM Conditioned media
TNFα Tumor necrosis factor α
HUVEC Human umbilical vascular endothelial cells
VCAM1 Vascular cell adhesion molecule 1
MCP1 Monocyte chemoattractant protein 1
CVD Cardiovascular disease
HDL High density lipoproteins
dCas9 Dead Cas9
sgRNA Single guide RNA
ROS Reactive oxygen species

References

  1. Capone, F.; Vacca, A.; Bidault, G.; Sarver, D.; Kaminska, D.; Strocchi, S.; Vidal-Puig, A.; Greco, C.M.; Lusis, A.J.; Schiattarella, G.G. Decoding the Liver-Heart Axis in Cardiometabolic Diseases. Circ. Res. 2025, 136, 1335–1362. [Google Scholar] [CrossRef] [PubMed]
  2. Stadler, J.T.; Marsche, G. Dietary Strategies to Improve Cardiovascular Health: Focus on Increasing High-Density Lipoprotein Functionality. Front Nutr. 2021, 8, 761170. [Google Scholar] [CrossRef] [PubMed]
  3. Lewoń-Mrozek, D.; Kurzynoga, J.; Jędrzejewski, P.; Kędzierska, K.; Partyka, A.; Kuriata-Kordek, M.; Ściskalska, M. Molecular Structure of Paraoxonase-1 and Its Modifications in Relation to Enzyme Activity and Biological Functions-A Comprehensive Review. Int. J. Mol. Sci. 2024, 25. [Google Scholar] [CrossRef] [PubMed]
  4. Diaz, L.; Bielczyk-Maczynska, E. High-density lipoprotein cholesterol: how studying the 'good cholesterol' could improve cardiovascular health. Open Biol. 2025, 15, 240372. [Google Scholar] [CrossRef]
  5. Kanafi, M.M.; Tavallaei, M. Overview of advances in CRISPR/deadCas9 technology and its applications in human diseases. Gene 2022, 830, 146518. [Google Scholar] [CrossRef]
  6. Cai, R.; Lv, R.; Shi, X.; Yang, G.; Jin, J. CRISPR/dCas9 Tools: Epigenetic Mechanism and Application in Gene Transcriptional Regulation. Int. J. Mol. Sci. 2023, 24. [Google Scholar] [CrossRef]
  7. Siew, W.S.; Tang, Y.Q.; Kong, C.K.; Goh, B.H.; Zacchigna, S.; Dua, K.; Chellappan, D.K.; Duangjai, A.; Saokaew, S.; Phisalprapa, P.; et al. Harnessing the Potential of CRISPR/Cas in Atherosclerosis: Disease Modeling and Therapeutic Applications. Int. J. Mol. Sci. 2021, 22. [Google Scholar] [CrossRef]
  8. Luo, N.; Zhong, W.; Li, J.; Lu, J.; Dong, R. CRISPR/dCas9 for hepatic fibrosis therapy: implications and challenges. Mol. Biol. Rep. 2022, 49, 11403–11408. [Google Scholar] [CrossRef]
  9. Rubin, E.M.; Ishida, B.Y.; Clift, S.M.; Krauss, R.M. Expression of human apolipoprotein A-I in transgenic mice results in reduced plasma levels of murine apolipoprotein A-I and the appearance of two new high density lipoprotein size subclasses. Proc. Natl. Acad. Sci. U S A 1991, 88, 434–438. [Google Scholar] [CrossRef]
  10. Lebherz, C.; Sanmiguel, J.; Wilson, J.M.; Rader, D.J. Gene transfer of wild-type apoA-I and apoA-I Milano reduce atherosclerosis to a similar extent. Cardiovasc Diabetol. 2007, 6, 15. [Google Scholar] [CrossRef]
  11. Shakweer, W.M.E.; Krivoruchko, A.Y.; Dessouki, S.M.; Khattab, A.A. A review of transgenic animal techniques and their applications. J. Genet Eng. Biotechnol. 2023, 21, 55. [Google Scholar] [CrossRef]
  12. Karlson, C.K.S.; Mohd-Noor, S.N.; Nolte, N.; Tan, B.C. CRISPR/dCas9-Based Systems: Mechanisms and Applications in Plant Sciences. Plants 2021, 10. [Google Scholar] [CrossRef]
  13. Dorr, C.R.; Remmel, R.P.; Muthusamy, A.; Fisher, J.; Moriarity, B.S.; Yasuda, K.; Wu, B.; Guan, W.; Schuetz, E.G.; Oetting, W.S.; et al. CRISPR/Cas9 Genetic Modification of CYP3A5 *3 in HuH-7 Human Hepatocyte Cell Line Leads to Cell Lines with Increased Midazolam and Tacrolimus Metabolism. Drug Metab. Dispos. 2017, 45, 957–965. [Google Scholar] [CrossRef]
  14. Li, H.; Song, C.; Li, Y.; Zhang, T.; Yang, X.; Wang, H. Genome-wide CRISPR screen reveals host factors for gama- and delta-coronavirus infection in Huh7 cells. Int. J. Biol. Macromol. 2025, 304, 140728. [Google Scholar] [CrossRef]
  15. Lee, H.K.; Lim, H.M.; Park, S.H.; Nam, M.J. Knockout of Hepatocyte Growth Factor by CRISPR/Cas9 System Induces Apoptosis in Hepatocellular Carcinoma Cells. J. Pers. Med. 2021, 11. [Google Scholar] [CrossRef] [PubMed]
  16. Soubeyrand, S.; Nikpay, M.; Turner, A.; Dang, A.T.; Herfkens, M.; Lau, P.; McPherson, R. Regulation of MFGE8 by the intergenic coronary artery disease locus on 15q26.1. Atherosclerosis 2019, 284, 11–17. [Google Scholar] [CrossRef]
  17. Toma, L.; Barbălată, T.; Sanda, G.M.; Niculescu, L.S.; Sima, A.V.; Stancu, C.S. CRISPR/dCas9 Transcriptional Activation of Endogenous Apolipoprotein AI and Paraoxonase 1 in Enterocytes Alleviates Endothelial Cell Dysfunction. Biomolecules 2021, 11. [Google Scholar] [CrossRef] [PubMed]
  18. Jiang, H.; Bai, X. Apolipoprotein A-I mimetic peptides (ApoAI MP) improve oxidative stress and inflammatory responses in Parkinson's disease mice. Front Pharmacol. 2022, 13, 966232. [Google Scholar] [CrossRef]
  19. Jangale, N.M.; Devarshi, P.P.; Dubal, A.A.; Ghule, A.E.; Koppikar, S.J.; Bodhankar, S.L.; Chougale, A.D.; Kulkarni, M.J.; Harsulkar, A.M. Dietary flaxseed oil and fish oil modulates expression of antioxidant and inflammatory genes with alleviation of protein glycation status and inflammation in liver of streptozotocin-nicotinamide induced diabetic rats. Food Chem. 2013, 141, 187–195. [Google Scholar] [CrossRef]
  20. Moustafa, E.M.; Thabet, N.M. Beta-sitosterol upregulated paraoxonase-1 via peroxisome proliferator-activated receptor-γ in irradiated rats. Can. J. Physiol. Pharmacol. 2017, 95, 661–666. [Google Scholar] [CrossRef] [PubMed]
  21. Van Eck, M.; Hoekstra, M.; Hildebrand, R.B.; Yaong, Y.; Stengel, D.; Kruijt, J.K.; Sattler, W.; Tietge, U.J.; Ninio, E.; Van Berkel, T.J.; et al. Increased oxidative stress in scavenger receptor BI knockout mice with dysfunctional HDL. Arterioscler. Thromb. Vasc. Biol. 2007, 27, 2413–2419. [Google Scholar] [CrossRef] [PubMed]
  22. He, D.; Zhao, M.; Wu, C.; Zhang, W.; Niu, C.; Yu, B.; Jin, J.; Ji, L.; Willard, B.; Mathew, A.V.; et al. Apolipoprotein A-1 mimetic peptide 4F promotes endothelial repairing and compromises reendothelialization impaired by oxidized HDL through SR-B1. Redox Biol. 2018, 15, 228–242. [Google Scholar] [CrossRef]
  23. Rosenbaum, M.A.; Chaudhuri, P.; Abelson, B.; Cross, B.N.; Graham, L.M. Apolipoprotein A-I mimetic peptide reverses impaired arterial healing after injury by reducing oxidative stress. Atherosclerosis 2015, 241, 709–715. [Google Scholar] [CrossRef] [PubMed]
  24. Mackness, B.; Hine, D.; Liu, Y.; Mastorikou, M.; Mackness, M. Paraoxonase-1 inhibits oxidised LDL-induced MCP-1 production by endothelial cells. Biochem Biophys. Res. Commun. 2004, 318, 680–683. [Google Scholar] [CrossRef]
  25. Yuhanna, I.S.; Zhu, Y.; Cox, B.E.; Hahner, L.D.; Osborne-Lawrence, S.; Lu, P.; Marcel, Y.L.; Anderson, R.G.; Mendelsohn, M.E.; Hobbs, H.H.; et al. High-density lipoprotein binding to scavenger receptor-BI activates endothelial nitric oxide synthase. Nat. Med. 2001, 7, 853–857. [Google Scholar] [CrossRef] [PubMed]
  26. Mineo, C.; Shaul, P.W. HDL stimulation of endothelial nitric oxide synthase: a novel mechanism of HDL action. Trends Cardiovasc Med. 2003, 13, 226–231. [Google Scholar] [CrossRef]
  27. Sherman, B.T.; Hao, M.; Qiu, J.; Jiao, X.; Baseler, M.W.; Lane, H.C.; Imamichi, T.; Chang, W. DAVID: a web server for functional enrichment analysis and functional annotation of gene lists (2021 update). Nucleic Acids Res. 2022, 50, W216–w221. [Google Scholar] [CrossRef]
  28. Thomas, P.D.; Ebert, D.; Muruganujan, A.; Mushayahama, T.; Albou, L.P.; Mi, H. PANTHER: Making genome-scale phylogenetics accessible to all. Protein Sci. 2022, 31, 8–22. [Google Scholar] [CrossRef]
  29. Szklarczyk, D.; Kirsch, R.; Koutrouli, M.; Nastou, K.; Mehryary, F.; Hachilif, R.; Gable, A.L.; Fang, T.; Doncheva, N.T.; Pyysalo, S.; et al. The STRING database in 2023: protein-protein association networks and functional enrichment analyses for any sequenced genome of interest. Nucleic Acids Res. 2023, 51, D638–d646. [Google Scholar] [CrossRef]
  30. Toma, L.; Sanda, G.M.; Deleanu, M.; Stancu, C.S.; Sima, A.V. Glycated LDL increase VCAM-1 expression and secretion in endothelial cells and promote monocyte adhesion through mechanisms involving endoplasmic reticulum stress. Mol. Cell Biochem 2016, 417, 169–179. [Google Scholar] [CrossRef]
Figure 1. APOA1 and PON1 levels in selected and non-selected transfected HuH-7 cells after CRISPR/dCas9 transfection.APOA1 and PON1 mRNA (a, b) in transfected and non-selected HuH-7 cells. APOA1 mRNA (c), intracellular APOA1 protein (d) and secreted APOA1 level (e) in HuH-7 cells transfected with plasmids for APOA1 activation and selected with antibiotic mix, at 46 days after the transfection. PON1 mRNA (f), intracellular PON1 protein (g) and secreted PON1 level (h) in HuH-7 cells transfected with plasmids for PON1 activation and selected with antibiotic mix, at 46 days after the transfection. The intracellular protein level is expressed relative to β-actin, and the secreted proteins in the culture medium are normalized to the total cell protein. All data are expressed as fold change versus cells transfected with control plasmids (CP) and presented as mean ± SD. *p<0.05, **p<0.01, ***p<0.001 versus CP.
Preprints 217728 g001
Figure 2. Distribution of Differentially Expressed (DE) genes identified by RNAseq analysis in transfected and selected hepatocytes for APOA1 or PON1. (a) Heatmap diagram with functional group connections for DE genes distribution in individual samples of transfected and selected HuH-7 cells: red – up-regulated genes, green – down-regulated genes; (b) The number of up-regulated (grey) and down-regulated (blue) DE genes identified in HuH-7 cells with transcriptional activated APOA1 and PON1, normalized to HuH-7 cells transfected with Control plasmid (CP). The statistical threshold applied to cutoff the DE genes were edgeR pvalue<=0.05 and |log2FoldChange|>=0.0; (c, d) Volcano plots expressing DE gene identified in selected HuH-7 hepatocytes with upregulated APOA1 (c) or upregulated PON1 (d) normalized to HuH-7 cells transfected with Control plasmid, CP). The statistical threshold applied to cutoff the DE genes were pvalue<=0.05 and |log2FoldChange|>=0. Red – up-regulated genes, green – down-regulated genes, blue – unchanged genes.
Preprints 217728 g002
Figure 3. Functional enrichment analysis for DE genes in HuH-7 cells with upregulated APOA1 (a) and PON1 (b) using DAVID tools and Gene Ontology (GO) database. Dot plots illustrate top 10 biological processes (BP, top), molecular functions (MF, middle) and cellular components (CC, bottom) associated with up- and down-regulated DE genes identified using the cutoff thresholds pvalue<=0.05 and |log2FoldChange|>=0. Dot size depicts the identified gene count in the functional enrichment group, the dot color represents p-values of predicted functional enrichment, and GeneRate is the ratio of the identified genes in the functional group to total number of the DE genes.
Preprints 217728 g003
Figure 4. Differentially expressed genes in HuH-7 cells with upregulated APOA1 or PON1. Differentially expressed (DE) genes from GO Biological process (BP) showing the Response to oxidative stress (GO:0034599) in selected HuH-7 cells with transcriptional activated APOA1 (a) or PON1 (b).
Preprints 217728 g004
Figure 5. Partial validation of RNAseq results by Western Blotting. Secreted PON1 in the conditioned media from APOA1-transfected and selected HuH-7 (a); secreted ALB level in the conditioned media from APOA1 (b) or PON1 (c)-transfected and selected HuH-7 cells. Data are expressed as fold change versus cells transfected with control plasmids (CP) and presented as mean ± SD. **p<0.01, ***p<0.001 versus CP.
Preprints 217728 g005
Figure 6. Oxidative stress markers in TNFα-activated HUVECs exposed to conditioned media from HuH-7 cells transfected with APOA1 or PON1 plasmids. Total cellular reactive oxygen species (ROS) levels expressed relative to cellular protein (a); and mitochondrial ROS levels expressed relative to cellular protein (b) in TNFα-activated HUVECs. Data are presented as mean ± SD. **p<0.001 ***p<0.001 versus CP.
Preprints 217728 g006
Figure 7. Inflammatory stress markers in TNFα-activated HUVECs exposed to conditioned media from HuH-7 cells transfected with APOA1 or PON1 plasmids. VCAM-1 mRNA (a) and protein (b) in TNFα-activated HUVECs exposed to CM from transfected HuH-7. The protein level is expressed relative to β-actin. All data are expressed as fold change versus cells transfected with control plasmids (CP) and presented as mean ± SD. *p<0.05, **p<0.01, ***p<0.001 versus CP.
Preprints 217728 g007
Scheme 1. Graphical representation of the experimental design (created with BioRender).
Preprints 217728 sch001
Disclaimer/Publisher’s Note: The statements, opinions and data contained in all publications are solely those of the individual author(s) and contributor(s) and not of MDPI and/or the editor(s). MDPI and/or the editor(s) disclaim responsibility for any injury to people or property resulting from any ideas, methods, instructions or products referred to in the content.
Copyright: This open access article is published under a Creative Commons CC BY 4.0 license, which permit the free download, distribution, and reuse, provided that the author and preprint are cited in any reuse.
Prerpints.org logo

Preprints.org is a free preprint server supported by MDPI in Basel, Switzerland.

Subscribe

Disclaimer

Terms of Use

Privacy Policy

Privacy Settings

© 2026 MDPI (Basel, Switzerland) unless otherwise stated