Submitted:
05 June 2026
Posted:
09 June 2026
You are already at the latest version
Abstract
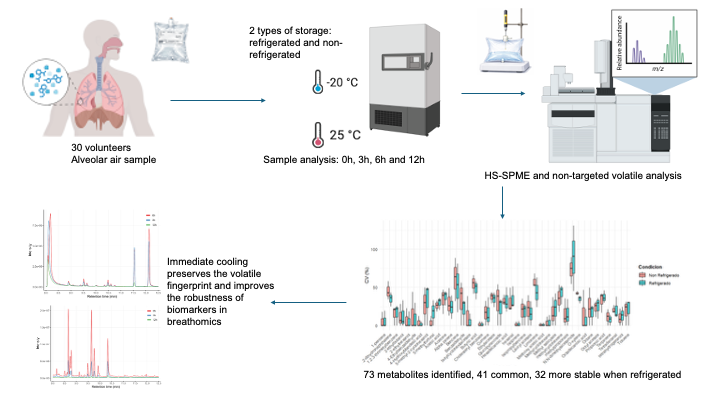
The present study aimed to evaluate the stability of volatile organic compounds (VOCs) in exhaled breath samples under different storage conditions (refrigeration at -20 °C vs. room temperature) and analysis times (0 h, 3 h, 6 h, 12 h). Alveolar exhaled breath samples were collected from 30 volunteers in 500 mL Tedlar® bags, followed by analysis using headspace solid-phase microextraction (HS-SPME) coupled to gas chromatography-mass spectrometry (GC-MS). The results showed the putative identification of 73 metabolites, 41 of which were common to both conditions. Pre-analytical storage of the samples at -20 °C significantly altered (p < 0.05) the stability of 33 of the 41 common VOCs analyzed. Specifically, refrigeration improved stability by reducing the coefficient of variation (CV) in 23 of these metabolites compared to samples kept at room temperature. Highly stable metabolites with a CV < 15% were found. A 90% loss of the analytical signal was observed 12 hours after sample collection, in contrast to the stability maintained in refrigerated samples. These findings highlight the influence of pre-analytical conditions on the integrity of volatile profiles, establishing immediate refrigeration as a fundamental step for the study of potential biomarkers present in breath. These results provide key criteria for the standardization of breathomics protocols.
Keywords:
exhaled breath
; breath biomarkers
; volatilomics
; stability of samples in the gas phase
; clinical metabolomics
1. Introduction
Volatile organic compounds (VOCs) constitute a diverse set of metabolites characterized by their low molecular weight, high vapor pressure, and low boiling point [1]. These compounds have gained great relevance in the medical field due to their potential as biomarkers for the diagnosis of various diseases. The importance of VOCs lies in their capacity to provide significant information about the body’s metabolic processes, as well as serving as indicators of exposure to environmental toxins or pollutants [2]. For instance, breath acetone correlates with ketosis processes in diabetes, while volatile sulfur compounds such as methyl mercaptan indicate liver dysfunctions [3].
The origin of VOCs can be either endogenous, as a product of the body’s normal or altered metabolism, or exogenous, deriving from exposure to environmental pollutants or external substances that are metabolically processed. In humans, approximately 2,800 different VOCs have been identified, which are present in various biological matrices such as breath, saliva, blood, milk, semen, skin, feces, and urine [2]. The presence of these compounds in exhaled breath is the result of complex physiological dynamics. They include metabolic intermediates originating both systemically and locally in the respiratory tract and the oral cavity. Those of systemic origin are transported by the bloodstream to the pulmonary capillaries, where their passage into alveolar air does not occur linearly; rather, it is strictly conditioned by selective physicochemical processes, determined by concentration gradients and the blood-gas partition coefficient of each molecule. VOCs are part of the entire metabolome; therefore, they must be treated as metabolites [4].
In this regard, a recent and promising metabolomic approach is ‘volatilomics’, defined as the study of volatile organic compounds produced in the human body and emitted through biological matrices such as breath, among others [1]. Exhaled breath sampling particularly offers unique advantages: it is non-invasive, allows for unlimited serial collections, and reflects systemic metabolic changes in real time [5,6]. This discipline has allowed the association of specific molecular signatures with oncological, respiratory, and neurodegenerative diseases. However, the low concentration of metabolites (often in the parts-per-billion range) and the high intra-individual variability pose critical analytical challenges for its clinical implementation [7].
Despite its great potential, high humidity (>95% RH), the presence of environmental pollutants, and the chemical instability of the analytes demand standardized protocols regarding sampling procedures, storage temperatures, and analytical methods. Comparative studies reveal that breath VOC concentrations can vary up to 40% intra-subject within 6-hour intervals, limiting the reproducibility of measurements, which necessitates high-sensitivity preconcentration and detection techniques. [3,8,9,10,11,12].
In this regard, the coupling of solid-phase microextraction with gas chromatography and mass spectrometry (SPME-GC/MS) overcomes these limitations. Selective preconcentration is achieved by using fibers with coatings such as polydimethylsiloxane/divinylbenzene (PDMS/DVB), which have been shown to adsorb low-polarity compounds with efficiencies exceeding 90% [13,14,15]. These mixed coatings exhibit a significantly higher extraction capacity compared to single-material fibers [16,17]. Furthermore, the minimization of interferences is achieved through headspace extraction (HS-SPME), which effectively reduces the carryover of non-volatile molecules and matrix components that could interfere with the analysis. Regarding chemical stability, recent research has demonstrated that the SPME technique preserves the integrity of volatile compounds such as terpenes and ketones during prolonged post-sampling periods. Specifically, validation studies have confirmed that SPME-GC/MS methods maintain their analytical performance and long-term stability, with tests demonstrating excellent results over extended periods [18,19,20,21].
However, even with robust analytical techniques, the clinical validity of these analyses critically depends on the temporal stability of the volatile profiles during the pre-analytical phase. Previous research has evaluated the persistence of VOCs in polymeric sampling containers. For example, fundamental studies compared the stability of various breath constituents in Tedlar bags against other polymers (Kynar and Flexfilm), demonstrating the superiority of Tedlar in terms of lower background emission and greater stability of the chemical species, although they recommended that samples be analyzed preferably within the first few hours of collection to minimize losses [22,23].
In light of the above, the present study focuses on analyzing variations in the volatile profile of exhaled breath using SPME-GC/MS, with the aim of evaluating variability under different storage conditions (refrigeration at -20 °C vs. room temperature) and analysis times (0 h, 3 h, 6 h, and 12 h). This methodological validation of volatile organic compounds in exhaled breath is crucial to ensure reproducibility and reliability in the future development of diagnostic methods and the identification of potential biomarkers.
2. Materials and Methods
2.1. Characterization of Study Subjects and Collection of Breath Samples
A total of 30 adult volunteers aged between 18 and 70 years were recruited. The demographic characteristics and relevant clinical information of the study cohort are summarized in Table 1. All participants self-reported to be apparently healthy at the time of sampling, with no recent history of acute respiratory or metabolic diseases. All participants were thoroughly informed about the objectives and methodology of the study, providing written informed consent prior to inclusion. To reduce the presence of exogenous factors in the volatile profile, each volunteer was asked to strictly adhere to the following instructions for at least 8 hours prior to sampling: refrain from consuming food, beverages, alcohol, or tobacco, and avoid the use of mouthwash or toothpaste. Breath collection was carried out at room temperature in a closed room, using 500 mL Tedlar® bags. Each participant was instructed to take a deep breath and discard the first portion of the exhaled air, in order to exclusively collect alveolar breath. Each volunteer provided a single sample, exhaling continuously until filling the total volume of one (1) collection bag, which was sealed immediately to prevent losses. As a quality control, a sampling blank was prepared by filling an identical bag with high-purity nitrogen gas (N2), which was stored and analyzed under the same experimental conditions as the biological samples. Immediately after collection, hexane injections were also performed every 5 chromatographic runs to clean impurities from the column. The 30 bags were placed in a refrigerated container for transport to the laboratory. Once there, the sample cohort was randomly divided into two equal groups: 15 samples were assigned to strict refrigeration at -20 °C, while the remaining 15 samples were stored at room temperature (25 °C). Each of these bags was sampled repeatedly by headspace extraction (HS-SPME) for GC-MS analysis at the different evaluation times (0 h, 3 h, 6 h, and 12 h).
2.2. SPME Metabolite Extraction
The extraction of volatile organic compounds (VOCs) present in the breath samples was performed using the solid-phase microextraction (SPME) technique. Agilent Technologies SPME fibers with an 80 µm thick Divinylbenzene/Carbon WR/Polydimethylsiloxane (DVB/C-WR/PDMS) stationary phase (Agilent 5191-5874) were used. The fibers employed were previously conditioned according to the manufacturer’s recommendations. The SPME fiber was inserted into the collection device and exposed directly to the headspace of the breath sample for an extraction time of 30 minutes, keeping the sample at room temperature. Since the efficiency of HS-SPME extraction depends on temperature for the proper thermodynamic partitioning of the analytes into the headspace, in the case of refrigerated samples, each bag was removed from the freezer and subjected to a thermal equilibration period at room temperature (25 °C) for 15 minutes prior to each extraction process (at 3 h, 6 h, and 12 h). Immediately after retracting the loaded fiber, the bag was sealed and returned to the -20 °C refrigeration condition. Subsequently, it was inserted into the injection port of the gas chromatograph (GC). Desorption was carried out for 10 minutes at a temperature of 270 °C.
2.3. Untargeted Volatilomics by Gas Chromatography Coupled to Mass Spectrometry (GC-MS)
Following the thermal desorption of the extracted metabolites, volatilomic analysis was carried out using an untargeted approach via GC-MS. Chromatographic separation was performed on a Shimadzu GCMS-QP2010 Plus system. A DB-5MS capillary column (30 m × 0.25 mm × 0.25 μm) was used, employing high-purity helium (99.9999%) as the carrier gas at a constant flow rate of 1 mL/min. The electron ionization (EI) source was operated at 70 eV. The injection port was operated in splitless mode at 250 °C. The oven temperature was programmed as follows: initial temperature of 50 °C (held for 1 min), increased at a rate of 10 °C/min to 290 °C (held for 4 min), and then increased at a rate of 4 °C/min to 300 °C (held for 6 min). The transfer line temperature was set at 300 °C, and the ion source and quadrupole temperatures were maintained at 300 °C. Mass spectrometry was performed in the range of 50 to 500 m/z in Scan mode at a scan speed of 1666.
2.4. Data Acquisition and Pre-processing
Data acquisition was performed using Shimadzu’s GCMS Real Time Analysis software. The raw data obtained from the GC-MS were processed using the GCMS Postrun Analysis software. Pre-processing included peak detection, deconvolution performed with AMDIS v2.73 software, retention time alignment, and peak area integration. Peak detection was carried out using the centWave algorithm, implemented in the xcms package, which identifies regions of interest (ROIs) based on peak width parameters (5–30 s), mass tolerance (15 ppm), and intensity thresholds. For peak alignment across samples, a density-based grouping approach was employed, correcting retention time variations through the iterative grouping of peaks with maximum deviations of 5 seconds within each group (<0.5% as quality criterion). Impurities were filtered by combining mass thresholds (tolerance of ±0.5 m/z for predefined masses) and relative intensity (<5% of the global maximum peak). To ensure that the identified metabolites originated exclusively from the exhaled breath, the chromatographic areas of the compounds detected in the bag blank (N2 gas) were subtracted from the analytical profiles of each sample. All processing was executed in RStudio v2025.05.0+496. Data transformation was performed using the tidyverse (dplyr) package, while the ggplot2 package was used for results visualization and plotting. The stats package was used for univariate statistical tests (Wilcoxon, t-test), calculation of means and standard deviations, and p-value adjustment. Exploratory data analysis was conducted using the MetaboAnalystR package.
2.5. Metabolites Identification
The putative identification of metabolites was achieved by comparing the acquired mass spectra with standard spectral databases from the NIST 14 library. Compounds exhibiting a spectral similarity greater than 90% were considered as putative identifications
2.6. Data Processing and Statistical Analysis
To evaluate the overall sample loss, the percentage reduction of the Total Ion Chromatogram (TIC) Area was calculated using the untransformed data of the chromatographic peak areas over time, setting the 0 h time point as 100%. Subsequently, to evaluate the relative and individual stability of each metabolite, a frequency filter was applied to define the constitutive (common) compounds; only those metabolites present in at least 70% of the samples under both storage conditions were selected for downstream analysis. After this filtering, which reduced the initial list of 73 putative compounds to a robust subset of 41 metabolites, the raw metabolomic data were subjected to the following preprocessing steps to ensure statistical integrity: normalization, logarithmic transformation of intensities (log10 scale) to reduce bias from heteroscedasticity and approximate a normal distribution, and Pareto scaling to balance the contribution of high- and low-abundance metabolites.
The stability of each metabolite was quantified using the coefficient of variation (%CV), as shown in Equation 1.
Given that each of the 30 volunteers provided a single sample bag (n = 15 for the refrigerated condition and n = 15 for room temperature), the mean and standard deviation (SD) were calculated between subjects for each evaluated time point. That is, for each metabolite, the mean and SD of the abundances obtained from the 15 individuals belonging to the same storage condition at a specific time (0 h, 3 h, 6 h, 12 h) were calculated. Subsequently, the resulting CVs from each time point were averaged. Therefore, the reported CV encompasses the technical variability of the method and the chemical stability of the metabolite, as well as the biological variability inherent to the cohort evaluated under those conditions.
For each condition (refrigerated vs. non-refrigerated) and the respective sample analysis times, the stability criteria were defined as follows: CV < 15%: High stability (robust metabolites for biomarkers). CV 15–30%: Moderate stability (requires validation). CV > 30%: High variability (potential exclusion or cautious analysis). Statistical comparison: The Wilcoxon test was used to determine significant differences in CV% between conditions. A t-test was performed to compare abundances between conditions at each time point (assuming data normality after transformation). The Benjamini-Hochberg adjustment (FDR < 0.05) was applied to control for false positives in multiple simultaneous comparisons. All analyses were performed in RStudio v2025.05.0+496.
3. Results and Discussion
3.1. Relative Stability of Breath Samples and Changes in the Metabolic Profile According to Storage Conditions
A total of 73 metabolites were putatively identified in the exhaled breath samples collected from the healthy volunteers. In order to rigorously evaluate the stability of these volatile organic compounds (VOCs) against pre-analytical factors, the samples were subjected to two contrasting storage conditions in Tedlar® bags: cryopreservation at -20 °C and maintenance at room temperature (25 °C). From the comparative analysis of the chromatograms, and after applying the frequency filtering criterion described in the methodology (presence in at least 70% of the samples under both conditions), a robust subset of 41 common metabolites was determined. These compounds exceeded the baseline analytical reproducibility threshold, ensuring that their subsequent longitudinal stability evaluation was not biased by missing values. The list, systematically grouped by chemical class along with their relative abundances and retention times, is presented in Table 2.
Statistical analysis of the coefficient of variation (CV) for these 41 detected analytes allows the evaluation of their individual stability, a critical aspect for the validity of untargeted metabolomic studies aimed at the identification of clinically relevant biomarkers [24]. The results allowed the stratification of metabolites into different biological and analytical stability categories, revealing a remarkable diversity of behaviors depending on the chemical nature of each compound and its thermodynamic interaction with the gaseous breath matrix.
It is important to note that the absolute CV values reported encompass the inter-individual biological variability of the cohort, in addition to analytical variability and storage effects. However, given that the 30 samples were randomly assigned to the two conditions (n = 15 per group), it is assumed that the baseline biological heterogeneity was evenly distributed. Consequently, the significant differences observed in the differential behavior of the CVs between the refrigerated and non-refrigerated groups can be directly attributed to the impact of the storage temperature. To complement this cross-sectional approach and isolate biological variability, degradation dynamics were also analyzed longitudinally within each sample by evaluating the trends of relative intensities over time (Figure 1), using the chromatographic analysis at 0 h as a baseline reference (100%) for the quantification of overall loss (TIC).
A first group of compounds exhibited an intrinsically high baseline stability. Metabolites such as isoprene, cholesteryl benzoate, and methoxyacetic acid showed very low variability (CV < 4%) in both refrigerated and non-refrigerated samples. However, the adjusted p-values demonstrated statistically significant differences (p_adj < 0.05) between both storage conditions. This indicates that, although their overall stability is good, the storage temperature still exerts a statistically measurable effect on their retention. The high stability of low-molecular-weight compounds such as isoprene has been previously documented in Tedlar® matrices, demonstrating a strong resistance to adsorption onto the polymer walls. [25]. This low longitudinal variability indicates that these metabolites are ideal candidates to form the human breath baseline. The identification of these stable compounds ensures that the alterations observed in future studies reflect true metabolic changes rather than mere sampling artifacts [26].
On the other hand, a majority group of metabolites from diverse chemical families—such as carboxylic acids, esters, and aldehydes—showed a significant reduction in their CV under refrigeration conditions compared to samples at room temperature (p_adj < 0.05). Lipid compounds and long-chain fatty acids such as octadecanoic acid, as well as butyl glyoxylate and lauryl acetate, evidenced a notable improvement in their analytical reproducibility when the bags were stored at -20 °C. This pattern confirms that refrigeration is an effective measure to preserve the chemical integrity of most VOCs, mitigating losses due to diffusion through the Tedlar® film, atmospheric oxidation reactions, and volatility exacerbated by vapor pressure at room temperature. Previous research has indicated that compounds with higher molecular weights and greater reactivity undergo losses of up to 20–40% within the first few hours if temperature is not controlled [27].
The dependence of this stability on the chemical family becomes evident when grouping the results presented in Table 2. For instance, the ester class exhibited markedly molecular-size-dependent responses: while the high-molecular-weight ester cholesteryl benzoate remained highly stable under both conditions (CV < 3%), medium-chain esters such as butyl glyoxylate and lauryl acetate significantly reduced their variability (from ~22–24% to ~10–18%) only when refrigerated (p_adj < 0.05). Conversely, the carboxylic acid family showed a general and robust trend toward greater preservation in cold conditions, with drastic reductions in their CVs (e.g., octadecanoic acid, from 23.39 to 12.17%; 4-hydroxymandelic acid, from 6.68 to 2.98%). Unlike carboxylic acids, aldehydes did not exhibit a general trend toward cold preservation, but rather a marked intra-class thermal heterogeneity. On the one hand, aromatic aldehydes such as benzaldehyde improved their stability under refrigeration, reducing their CV from 42.27 to 27.37%. On the other hand, more polar aldehydes and furan derivatives evidenced a significant loss of stability when refrigerated. Illustratively, the compound 5-methylfurfural quadrupled its CV under cold conditions, going from 6.85 at room temperature to 22.56% at -20 °C. This divergent behavior within aldehydes highlights the need to consider the intrinsic physicochemical properties of each analyte, suggesting that, for more polar or water-soluble compounds, refrigeration at -20 °C induces detrimental processes, such as the partitioning or dissolution of the metabolite into condensed water droplets on the bag walls due to the high intrinsic relative humidity (RH > 90%) of exhaled breath [22].
Furthermore, the presence of metabolites with extremely high variability under both evaluation conditions (CV > 50%), such as benzene and N,N-dimethylacetamide, suggests the influence of exogenous and endogenous factors beyond thermal control. This instability may be attributed to temporal physiological oscillations, environmental cross-exposure dynamics, or potential background emissions from the collection bag material itself, a phenomenon widely described in the use of polymers for environmental analysis [24].
Consistent with the above, the diversity of observed responses reinforces the premise that the optimal storage temperature in volatilomics is not universal, but rather depends on the chemical family of the target analyte. These results provide fundamental guidelines for the standardization of pre-analytical protocols using HS-SPME extraction, demonstrating that the selection of robust biomarkers requires combining statistical rigor with strict thermodynamic control of gaseous simples.
3.2. Potential Mechanisms of Stability and Instability of Metabolites Present in Breath Samples
Figure 1 shows the temporal dynamics of the relative intensity (logarithmic) of the 12 metabolites with the highest presence in the analyzed samples, comparing the refrigerated (blue) and non-refrigerated (pink) conditions at different chromatographic analysis times (0, 3, 6, and 12 hours) after sample collection. Each box summarizes the intensity distribution for that metabolite and condition at each time point.
Interquartile distributions (boxes) that maintain a constant median over time indicate that the metabolite is stable, while a reduction in the signal suggests possible degradation, adsorption, or volatilization. The progressive degradation of the gaseous matrix is visually evidenced by the absence of observations (missing values) at the later analysis times (6 h and 12 h), which reflects that the metabolite concentration fell below the instrument’s limit of detection, occurring more frequently in non-refrigerated samples. For example, the temporal dynamics of 1,2-dihydronaphthalene illustrate the complexity of this stability: rather than a continuous linear degradation, the intensity exhibits fluctuations throughout the 12-hour period under both conditions. However, the overall variability is quantitatively more pronounced in the samples subjected to room temperature, as supported by the overall statistical analysis (non-refrigerated CV = 50.52% vs. refrigerated CV = 46.01%; p_adj = 0.014). This statistically evidences that, despite the intrinsic instability of the compound, maintenance at -20 °C significantly mitigates its degradation compared to storage at 25 °C.
Acetic acid shows a trend toward lower values in the non-refrigerated condition, especially at intermediate time points. On the other hand, the visual representation of 5-methylfurfural and 4-hydroxymandelic acid exhibits low baseline intensities and narrow interquartile distributions, which is in numerical agreement with the low coefficients of variation reported in Table 3. However, in strict accordance with our previous statistical analysis, while 4-hydroxymandelic acid visually confirms greater stability under refrigeration (CV decreases from 6.68% to 2.98%), 5-methylfurfural evidences the opposite pattern, losing stability under cold conditions. For the majority of the metabolites, the general trend demonstrated that when samples were refrigerated, intensities remained higher and more stable throughout the 12-hour evaluation period.
The intrinsic stability of metabolites is a phenomenon that has been previously documented in metabolomic studies, where it has been demonstrated that certain compounds exhibit greater resistance to degradation under various experimental conditions. This variability in stability is determined by three main factors: physicochemical properties, biological function, and environmental handling conditions. At the molecular level, polarity and susceptibility to processes such as oxidation or hydrolysis make primary metabolites and basic cellular compounds—such as amino acids and carbohydrates—intrinsically more resistant to degradation than unsaturated lipids, aldehydes, or secondary metabolites, which undergo greater fluctuations. Furthermore, external factors such as temperature, humidity, and exposure to oxygen drastically alter these metabolic profiles. This thermal vulnerability has been confirmed in various biological matrices, such as urine and dried blood, where refrigerated storage successfully preserves the vast majority of compounds, whereas exposure to room temperature induces rapid degradation and drops of up to 40% in their concentration [13,28,29]. Furthermore, integrating stability data with genomic and proteomic profiles enables the identification of robust biomarkers for clinical applications [30].
3.3. Impact of Sample Storage on the Selection of Potential Biomarkers
Rigorous control of pre-analytical storage temperature is critical for preserving the chemical integrity of potential gaseous biomarkers. Unlike liquid matrices (such as plasma or blood), where degradation is primarily driven by enzymatic or bacterial activity, the loss of VOCs in breath samples stored in polymers like Tedlar is mediated by physicochemical processes such as diffusion through the material, adsorption onto the bag walls, and reactivity, among others. By reducing the temperature to -20 °C, the decrease in kinetic energy attenuates the volatility and permeability of the metabolites in the polymer, preventing their escape or degradation [31,32,33]. Through untargeted metabolomics, it is possible to identify differential stability patterns. For example, the results of this study show that cholesteryl benzoate and methoxyacetic acid could be considered as potential quality control markers due to their high stability across different temperatures, whereas 5-methylfurfural requires cryogenic storage.
Consistent with the above, Figure 2 (Volcano Plot) provides a comprehensive visual representation of the statistical significance and magnitude of the differences in metabolite abundance between both storage conditions. To construct this model, the preprocessed relative intensities (with Log10 transformation and Pareto scaling) corresponding to all post-sampling time points were consolidated, globally comparing the group kept at room temperature (n=15) against the group under refrigeration at -20 °C (n=15). The magnitude of the change was evaluated by directly calculating the median difference, while statistical significance was determined using the nonparametric Wilcoxon rank-sum test (Mann-Whitney U test) for independent samples. To control the false positive rate derived from multiple comparisons, the p-values were rigorously adjusted using the Benjamini-Hochberg False Discovery Rate (FDR) method, setting the significance threshold at p_adj < 0.05. The analysis reveals three distinct categories of metabolites based on their response: Metabolites significantly more abundant in the non-refrigerated condition, such as 5-methylfurfural, methyl salicylate, and hexanal, are located in the upper left region of the plot, indicating that they present statistically significant negative median differences (p < 0.05). These compounds show greater stability or formation under non-refrigerated storage conditions, suggesting they may be sensitive to low temperatures or benefit from chemical processes occurring at room temperature.
On the other hand, metabolites significantly more abundant in the refrigerated condition, such as tetradecanal and benzaldehyde, are located in the upper right region, demonstrating positive median differences with high statistical significance. These metabolites evidence greater stability under refrigeration, which supports the importance of cold storage in preserving the integrity of certain volatile compounds in exhaled breath samples. Octadecanoic acid (refrigerated CV: 12.2% vs. non-refrigerated: 23.4%, p < 0.001) indicates that refrigeration preserves its abundance. This implies that these metabolites can be used to optimize storage protocols. Finally, there are the metabolites without significant differences. Most metabolites are distributed in the central region of the plot, close to the X-axis (median differences close to 0) and with low -log10 (p-value) values, indicating that they do not present significant changes between conditions. These compounds can be considered stable and independent of the storage condition, making them ideal candidates for robust biomarkers.
Significantly altered metabolites can be grouped into: Lipids and fatty acids, such as butyl glyoxylate and lauryl acetate (median difference > 0.5, p < 0.05), which suggest alterations in membrane synthesis or energy storage [34,35]. Amino acids and their derivatives, such as 4-hydroxymandelic acid (refrigerated CV: 2.98% vs. non-refrigerated: 6.68%), could indicate alterations in phenylalanine metabolism or oxidative stress [34,36]. Metabolites with low CV values and significant differences, such as isoprene, may correlate with stable physiological processes, such as the baseline production of volatile compounds [36,37]. Long-term metabolite stability suggests robust homeostatic mechanisms, whereas unstable metabolites reflect potential environmental influence [37,38].
3.4. Changes in the Chromatographic Profile of Samples Relative to Storage Conditions
Figure 3 displays chromatographic profiles of representative subjects, illustrating the predominant longitudinal trends in the cohort. It is important to highlight that the observable differences in peak magnitude at the initial time point (0 h) between panel A and panel B are due exclusively to the intrinsic inter-individual biological variability of the volunteers. Figure 3A demonstrates the greater stability of volatile metabolites under refrigeration; the chromatographic profiles across the four evaluated time points (0 h, 3 h, 6 h, and 12 h) show excellent overlap, with well-defined main peaks at retention times of 8.1 and 12.0 minutes. This temporal consistency indicates that refrigeration effectively preserves the chemical integrity of breath VOCs, maintaining relative intensities without significant degradation over the 12-hour study period. Intensities remain in the range of 7.5×10⁶ for the main peak, suggesting that oxidation, hydrolysis, and thermal degradation processes are practically inhibited under these controlled storage conditions [41].
In contrast, Figure 3B illustrates the progressive degradation of volatile compounds at room temperature. At the initial time point (0 h, red line), a metabolite-rich profile is observed with multiple taller peaks distributed between 8.3 and 10.2 minutes, reaching maximum intensities of 2.0×10⁷. However, this metabolite concentration decreases over time. When the analysis is performed at 3 hours (green line) post-sampling, intensities have dropped substantially, and by 12 hours (blue line), most of the peaks have disappeared almost completely, being reduced to baseline levels. Total Ion Chromatogram (TIC) analysis based on raw, unnormalized areas revealed that this visual loss represents a quantitative drop of more than 90% of the original overall analytical signal at room temperature. This massive loss of the total analyte mass in the headspace is consistent with previous studies reporting significant instability due to diffusion and reactivity of thermolabile VOCs [12,41].
The degradation observed under non-refrigerated conditions can be attributed to multiple simultaneous processes, such as the atmospheric oxidation of unsaturated compounds, accelerated volatilization due to increased vapor pressure, and potential interaction with condensed water vapor within the storage system [39,42]. The most susceptible compounds likely include aldehydes, short-chain ketones, and sulfur compounds, which are known for their low thermal stability [12,41].
3.5. Impact of Volatile Metabolite Instability on the Identification of Biomarkers for Clinical Diagnostic Use
The results of this research have demonstrated that VOCs present in breath samples are susceptible to post-sampling storage conditions. Although the analysis of these metabolites via HS-SPME-GC-MS requires minimal sample manipulation, the handling and disposition of the sample prior to analysis represents a crucial step that directly impacts the results. The instability of VOCs represents a critical challenge for the reliable identification of potential biomarkers in breath metabolomics studies. Thermal degradation, oxidation, and the selective volatilization of certain metabolites can alter the chromatographic profiles of the samples, generating analytical artifacts that compromise the reproducibility of the results. Thermolabile compounds, such as volatile sulfur compounds (H₂S, CH₃SH) and aldehydes (hexanal, nonanal), show losses of 30–60% after 6 hours at room temperature [26,40], while ketones such as acetone exhibit greater stability (<5% degradation at 4 °C) [43]. This variability in metabolite concentration and the formation of new VOCs depend on storage conditions, which introduces biases in cross-sectional studies, where apparent differences between groups could reflect pre-analytical instability rather than genuine physiological phenomena [44,45].
Sample collection and storage protocols are aspects that must be taken into account in the experimental design. Previous studies demonstrated that samples stored in Tedlar® bags at -20 °C maintain more than 90% of the original VOCs for 14 days, whereas at 25 °C, losses of 40% are observed within 48 hours. Furthermore, differential adsorption on materials such as Tenax TA® varies according to molecular polarity: non-polar hydrocarbons (e.g., isoprene) show recoveries of 95%, compared to 70% for polar alcohols (methanol, ethanol) under identical conditions. These technical factors can mask true biomarkers or generate false positives, particularly for low-concentration compounds (<1 ppb) [46,47].
To counteract these effects, it is advisable to implement storage temperature control, preferably refrigerating the samples at -20 °C immediately after collection. Chromatographic analysis should be performed within 6 hours post-sampling. The use of stable standards is recommended for the correction of analytical losses. Once biomarker candidates for the studied pathology are identified, their degradation kinetics must be analyzed. This is necessary because metabolic instability is not uniform; while alkanes can maintain stable profiles for weeks, other compounds may degrade rapidly [26], whereas sulfur and oxygenated compounds require shorter analytical windows (<4 hours) [43]. This demonstrates that biomarker validation in breathomics requires the integration of metabolomic stability studies. Consequently, standardized protocols that allow for the control of preanalytical variables [44,46], will allow for the discrimination between technical fluctuations and biologically relevant signals for studies with subsequent robust diagnostic applications.
A limitation inherent to the longitudinal sampling design of this study should be noted. Due to the thermodynamic requirements of the HS-SPME technique, the refrigerated samples experienced brief heating cycles prior to each temporal analysis (3 h, 6 h, and 12 h) to ensure the release of the analytes into the headspace. Although these repeated thermal fluctuations could exacerbate the degradation of VOCs, the results showed that the samples subjected to refrigeration maintained superior stability compared to those kept continuously at room temperature. This underscores the high efficacy of cryopreservation at -20 °C for preanalytical preservation, even when samples are subjected to repeated handling.
4. Conclusions
The comprehensive study on the stability of volatile organic compounds (VOCs) in exhaled breath samples highlights the critical importance of preanalytical control in clinical metabolomic research. The comparative analysis of the coefficient of variation (CV) confirms that storage and handling conditions constitute a determining factor to ensure the reproducibility of results and methodological robustness in precision medicine studies. Statistical analysis based on %CV evidences that some constitutive baseline metabolites present high intrinsic stability (CV < 15%), regardless of storage conditions. This characteristic positions them as reliable references for comparisons between pathological states.
Furthermore, the stratification of VOCs according to their stability allows for the identification and exclusion of potential false positives derived from degradation processes, as well as the prioritization of compounds with lower variability as biomarkers of clinical interest. The identification of stable metabolites and the understanding of their variability patterns provide substantial evidence for the development of non-invasive diagnostic strategies. The implementation of these approaches can favor the early detection of pathologies through exhaled breath analysis, optimizing diagnostic sensitivity and specificity within a personalized medicine framework.
To strengthen analytical consistency, it is recommended to establish differentiated protocols that consider the selection of appropriate adsorbents and the application of cryopreservation during transport, especially in the case of mercaptans and aldehydes. Likewise, it is suggested to limit the interval between collection and analysis of furans to a maximum of 24 hours. The systematic adoption of these measures will favor the standardization of sampling and analysis procedures, promoting the effective transfer of metabolomic research to the clinical setting.
The findings of this study indicate that immediate refrigeration at -20 °C significantly alters the cross-sectional profile of volatile compounds (33 of 41 metabolites showed p < 0.05). Specifically, the data suggest that cold maintenance attenuates the analytical signal loss suffered by thermolabile compounds at room temperature at 12 hours, promoting lower statistical variability (CV reduction in 23 metabolites). However, since these CV calculations include inter-individual biological variability, it was evidenced that the preanalytical response is heterogeneous and strongly dependent on the chemical family, with a subgroup of compounds (18 metabolites) presenting increased variability under refrigeration. Although future intra-subject longitudinal studies are required to completely isolate biological variability, these observations provide fundamental criteria for methodological standardization in clinical volatilomics.
Author Contributions
Villaroel Erica: Conceptualization, Data curation, Formal Analysis, Investigation, Methodology, Writing—original draft. Taborda-Ocampo Gonzalo: Investigation, Writing—review and editing, Supervision. Jaramillo Jorge: Project Administration, Supervision, Writring—review and editing.
Acknowledgments
The authors express their sincere gratitude to the PhD Program in Sciences at Universidad de Caldas for the financial, logistical, and technical support provided during this study, as well as to the Ministry of Science, Technology and Innovation of Colombia (MinCiencias) for funding through Call 905. We particularly appreciate access to laboratory facilities and computational resources. We extend our thanks to the volunteers who participated in exhaled breath sample collection, whose collaboration was essential for this work. Finally, we acknowledge the valuable suggestions from anonymous reviewers that helped improve the manuscript’s quality.
References
- B. R. B. da Costa and B. S. De Martinis, “Analysis of urinary VOCs using mass spectrometric methods to diagnose cancer: A review,” Clinical Mass Spectrometry, vol. 18, pp. 27–37, 2020. [CrossRef]
- M. Llambrich, N. Ramírez, R. Cumeras, and J. Brezmes, “SPME arrow-based extraction for enhanced targeted and untargeted urinary volatilomics,” Anal. Chim. Acta, vol. 1329, Nov. 2024. [CrossRef]
- F. Kus, C. Altinkok, E. Zayim, S. Erdemir, C. Tasaltin, and I. Gurol, “Surface acoustic wave (SAW) sensor for volatile organic compounds (VOCs) detection with calix [4]arene functionalized Gold nanorods (AuNRs) and silver nanocubes (AgNCs),” Sens. Actuators B Chem., vol. 330, no. December 2020, p. 129402, 2021. [CrossRef]
- L. K. Meredith and M. M. Tfaily, “Capturing the microbial volatilome: an oft overlooked ‘ome,’” Trends Microbiol., vol. 30, no. 7, pp. 622–631, 2022. [CrossRef]
- E. Gashimova et al., “Quantification of cancer biomarkers in urine using volatilomic approach,” Heliyon, vol. 10, no. 19, Oct. 2024. [CrossRef]
- Y. Saeki et al., “Lung cancer detection in perioperative patients’ exhaled breath with nanomechanical sensor array,” Lung Cancer, vol. 190, Apr. 2024. [CrossRef]
- Y. Yang, H. Long, Y. Feng, S. Tian, H. Chen, and P. Zhou, “A multi-omics method for breast cancer diagnosis based on metabolites in exhaled breath, ultrasound imaging, and basic clinical information,” Heliyon, vol. 10, no. 11, Jun. 2024. [CrossRef]
- P. U. Mancheary John, S. K. Kandula, S. S. Cheekatla, V. S. M. K. Metta, and K. Peddi, “Qualitative and Untargeted Volatilome Fingerprinting of Aspergillus sp. and Bulbithecium sp. by HS-SPME-GCMS and Functional Interactions,” J. Basic Microbiol., vol. 64, no. 11, p. e2400210, Nov. 2024. [CrossRef]
- T. Adak et al., “Development and validation of HS-SPME-GCMS/MS method for quantification of 2-acetyl-1-pyrroline in rice cultivars,” J. Food Sci. Technol., vol. 60, no. 3, pp. 1185–1194, Mar. 2023. [CrossRef]
- D. C. Dewi, C. Mahdi, H. Sulistyarti, and A. Am, “Identification of volatile compounds in several meat and bone broth using Solid Phase Micro Extraction-Gas Chromatography Mass Spectrometry (SPME-GCMS) for initial detection of Halal and Non-Halal Food,” J. Pure App. Chem. Res, vol. 2023, no. 02, pp. 65–79, 2023. [CrossRef]
- F. Zhang, P. Li, Y. Lu, Y. Han, and H. Yan, “Advancing Lung Cancer Diagnosis through NH2-MON-SPME-GC-MS/MS: Enhanced Sensitivity in Aldehyde Biomarker Detection from Exhaled Breath,” Anal. Chem., vol. 96, no. 38, pp. 15422–15429, Sep. 2024. [CrossRef]
- K. J. Kiland, L. Martins, S. A. Borden, S. Lam, and R. Myers, “Stability of volatile organic compounds in thermal desorption tubes and in solution,” J. Breath Res., vol. 19, no. 2, p. 026001, Apr. 2025. [CrossRef]
- J. D. S. Guedes et al., “Methyl Effect on the Metabolism, Chemical Stability, and Permeability Profile of Bioactive N-Sulfonylhydrazones,” ACS Omega, vol. 7, no. 43, pp. 38752–38765, Nov. 2022. [CrossRef]
- R. Rodríguez-Pérez et al., “Instrumental drift removal in GC-MS data for breath analysis: The short-Term and long-Term temporal validation of putative biomarkers for COPD,” J. Breath Res., vol. 12, no. 3, Mar. 2018. [CrossRef]
- H. H. Jeleń, M. Majcher, R. Zawirska-Wojtasiak, M. Wiewiórowska, and E. Wa̧sowicz, “Determination of Geosmin, 2-Methylisoborneol, and a Musty-Earthy Odor in Wheat Grain by SPME-GC-MS, Profiling Volatiles, and Sensory Analysis,” J. Agric. Food Chem., vol. 51, no. 24, pp. 7079–7085, Nov. 2003. [CrossRef]
- M. T. Bingman, C. E. Stellick, J. P. Pelkey, J. M. Scott, and C. A. Cole, “Monitoring cider aroma development throughout the fermentation process by headspace solid phase microextraction (Hs-spme) gas chromatography–mass spectrometry (gc-ms) analysis,” Beverages, vol. 6, no. 2, pp. 1–14, Jun. 2020. [CrossRef]
- J. Merib, G. Nardini, and E. Carasek, “Use of Doehlert design in the optimization of extraction conditions in the determination of organochlorine pesticides in bovine milk samples by HS-SPME,” Analytical Methods, vol. 6, no. 10, pp. 3254–3260, May 2014. [CrossRef]
- A. Panighel and R. Flamini, “Applications of solid-phase microextraction and gas chromatography/mass spectrometry (SPME-GC/MS) in the study of grape and wine volatile compounds,” Dec. 01, 2014, MDPI AG. [CrossRef]
- Y. Liu et al., “Accurate Determination of 12 Lactones and 11 Volatile Phenols in Nongrape Wines through Headspace-Solid-Phase Microextraction (HS-SPME) Combined with High-Resolution Gas Chromatography-Orbitrap Mass Spectrometry (GC-Orbitrap-MS),” J. Agric. Food Chem., vol. 70, no. 6, pp. 1971–1983, Feb. 2022. [CrossRef]
- S. Park, H. W. Kim, C. Joo Lee, Y. Kim, and J. Sung, “Profiles of volatile sulfur compounds in various vegetables consumed in Korea using HS-SPME-GC/MS technique,” Front. Nutr., vol. 11, 2024. [CrossRef]
- J. Dennenlöhr, S. Thörner, A. Manowski, and N. Rettberg, “Analysis of Selected Hop Aroma Compounds in Commercial Lager and Craft Beers Using HS-SPME-GC-MS/MS,” Journal of the American Society of Brewing Chemists, vol. 78, no. 1, pp. 16–31, Jan. 2020. [CrossRef]
- P. Mochalski, J. King, K. Unterkofler, and A. Amann, “Stability of selected volatile breath constituents in Tedlar, Kynar and Flexfilm sampling bags.”.
- M. Basanta, B. Ibrahim, D. Douce, M. Morris, A. Woodcock, and S. J. Fowler, “Methodology validation, intra-subject reproducibility and stability of exhaled volatile organic compounds,” J. Breath Res., vol. 6, no. 2, p. 026002, 2012. [CrossRef]
- O. Lawal, W. M. Ahmed, T. M. E. Nijsen, R. Goodacre, and S. J. Fowler, “Exhaled breath analysis: a review of ‘breath-taking’ methods for off-line analysis,” Metabolomics, vol. 13, no. 10, pp. 1–16, 2017. [CrossRef]
- E. Schulz, M. Woollam, P. Grocki, M. D. Davis, and M. Agarwal, “Methods to Detect Volatile Organic Compounds for Breath Biopsy Using Solid-Phase Microextraction and Gas Chromatography–Mass Spectrometry,” Molecules, vol. 28, no. 11, Jun. 2023. [CrossRef]
- P. Mochalski and C. A. Mayhew, “Stability of selected exhaled breath volatiles stored in Tenax® TA adsorbent tubes at −80 °C,” J. Breath Res., vol. 18, no. 4, Oct. 2024. [CrossRef]
- Y. Hanai et al., “Urinary volatile compounds as biomarkers for lung cancer,” Biosci. Biotechnol. Biochem., vol. 76, no. 4, pp. 679–684, 2012. [CrossRef]
- H. N. Cui et al., “Evaluation of metabolite stability in dried blood spot stored at different temperatures and times,” Sci. Rep., vol. 14, no. 1, Dec. 2024. [CrossRef]
- M. Rotter et al., “Stability of targeted metabolite profiles of urine samples under different storage conditions,” Metabolomics, vol. 13, no. 1, Jan. 2017. [CrossRef]
- X. Dong and H. Sun, “Effect of Temperature and Moisture on Degradation of Herbicide Atrazine in Agricultural Soil,” 2016.
- S. Sagona et al., “Impact of Different Storage Temperature on the Enzymatic Activity of Apis mellifera Royal Jelly,” Foods, vol. 11, no. 20, Oct. 2022. [CrossRef]
- L. M. Petrick et al., “Effects of storage temperature and time on metabolite profiles measured in dried blood spots, dried blood microsamplers, and plasma,” Science of the Total Environment, vol. 912, Feb. 2024. [CrossRef]
- S. D. Mcculloch, E. D. Karoly, M. W. Mitchell, A. M. Evans, and K. Goodman, “Stability of metabolite profiles using dried blood spot cards,” 2021.
- J. Li et al., “Metabolomic analysis reveals potential biomarkers and the underlying pathogenesis involved in Mycoplasma pneumoniae pneumonia,” Emerg. Microbes Infect., vol. 11, no. 1, pp. 593–605, 2022. [CrossRef]
- Y. Chen, E. M. Li, and L. Y. Xu, “Guide to Metabolomics Analysis: A Bioinformatics Workflow,” Apr. 01, 2022, MDPI. [CrossRef]
- M. Subramani, C. A. Urrea, and V. Kalavacharla, “Comparative Analysis of Untargeted Metabolomics in Tolerant and Sensitive Genotypes of Common Bean (Phaseolus vulgaris L.) Seeds Exposed to Terminal Drought Stress,” Metabolites, vol. 12, no. 10, Oct. 2022. [CrossRef]
- O. A. Zeleznik et al., “Intrapersonal Stability of Plasma Metabolomic Profiles over 10 Years among Women,” Metabolites, vol. 12, no. 5, May 2022. [CrossRef]
- Y. Chen, E. M. Li, and L. Y. Xu, “Guide to Metabolomics Analysis: A Bioinformatics Workflow,” Apr. 01, 2022, MDPI. [CrossRef]
- S. Kang and C. L. Paul Thomas, “How long may a breath sample be stored for at -80 °c? A study of the stability of volatile organic compounds trapped onto a mixed Tenax:Carbograph trap adsorbent bed from exhaled breath,” J. Breath Res., vol. 10, no. 2, Jun. 2016. [CrossRef]
- S. W. Harshman et al., “Storage stability of exhaled breath on Tenax TA,” J. Breath Res., vol. 10, no. 4, Oct. 2016. [CrossRef]
- X. R. Wang, J. Cassells, and A. Z. Berna, “Stability control for breath analysis using GC-MS,” J. Chromatogr. B Analyt. Technol. Biomed. Life Sci., vol. 1097–1098, pp. 27–34, Oct. 2018. [CrossRef]
- C.-C. Hsieh, S.-H. Horng, and P.-N. Liao, “Stability of Trace-Level Volatile Organic Compounds Stored in Canisters and Tedlar bags,” 2003.
- S. W. Harshman et al., “Storage stability of exhaled breath on Tenax TA,” J. Breath Res., vol. 10, no. 4, Oct. 2016. [CrossRef]
- A. Azim et al., “Measurement of Exhaled Volatile Organic Compounds as a Biomarker for Personalised Medicine: Assessment of Short-Term Repeatability in Severe Asthma,” J. Pers. Med., vol. 12, no. 10, Oct. 2022. [CrossRef]
- K. ; Westphal, D. ; Dudzik, M. ; Waszczuk-Jankowska, B. ; Graff, K. ; Narkiewicz, and M. J. Markuszewski, “Common Strategies and Factors Affecting Off-Line Breath Sampling and Volatile Organic Compounds Analysis Using Thermal Desorption-Gas Chromatography-Mass Spectrometry (TD-GC-MS),” 2022. [CrossRef]
- M. Bajo-Fernández, É. A. Souza-Silva, C. Barbas, M. F. Rey-Stolle, and A. García, “GC-MS-based metabolomics of volatile organic compounds in exhaled breath: applications in health and disease. A review,” 2023, Frontiers Media SA. [CrossRef]
- N. R. Subawickrama Mallika Widanaarachchige, A. Paul, I. K. Banga, A. Bhide, S. Muthukumar, and S. Prasad, “Advancements in Breathomics: Special Focus on Electrochemical Sensing and AI for Chronic Disease Diagnosis and Monitoring,” Feb. 11, 2025, American Chemical Society. [CrossRef]
Figure 1.
Temporal dynamics of the relative intensity (log10 transformation) of the 12 most representative metabolites, comparing storage under refrigeration at -20 °C (blue) and at room temperature (pink) at 0 h, 3 h, 6 h, and 12 h. Boxes represent the interquartile range, and individual points indicate the observations per subject. * Note: The absence of data points or boxes at later time points (particularly at 6 h and 12 h) is due to the metabolite abundance falling below the instrument’s limit of detection (missing values due to non-detection), which is direct evidence of analyte degradation and loss in the headspace.

Figure 2.
Volcano plot analysis of breath metabolites: comparison between refrigerated and non-refrigerated samples. Blue dots represent metabolites that are significantly more abundant in non-refrigerated samples, red dots indicate greater abundance in refrigerated samples, and gray dots correspond to metabolites with no significant changes.

Figure 3.
Chromatograms of exhaled breath samples analyzed using HS-SPME-GC-MS. A. Exhaled breath sample cooled to -20 °C after sampling. B. Exhaled breath sample stored at room temperature. *Note: The chromatograms shown in panels 3A and 3B correspond to different individuals (given the unpaired study design); therefore, differences in absolute intensities at the initial time point (0 h) reflect normal inter-individual biological variability in exhaled breath. Degradation is evaluated by observing the relative decrease in signal within the same individual over time, rather than by comparing absolute peak heights between A and B.


Table 1.
Clinical and demographic characteristics of the study cohort.
| Characteristic | Refrigerated samples (n=15) | Non refrigerated samples (n=15) |
| Age (years), Mean ± SD | 36.0 ± 11.8 | 43.8 ± 11.3 |
| Age range | 18–60 | 27–73 |
| Sex, n (%) | ||
| - Female | 9 (60.0%) | 8 (53.4%) |
| - Male | 6 (40.0%) | 7 (46.6%) |
| Habits, n (%) | ||
| - Smoking | 3 (20.0%) | 3 (20.0%) |
| - Alcohol | 2 (13.3%) | 4 (26.6%) |
| - Farmaceuticals use | 1 (6.6%) | 2 (13.3%) |
Table 2.
Comparative analysis of the stability of volatile organic compounds in exhaled breath: CV% and statistical significance between cooling conditions.
Table 2.
Comparative analysis of the stability of volatile organic compounds in exhaled breath: CV% and statistical significance between cooling conditions.
| RT | Putative identification | m/z | Class | CV–No Ref (%) | CV–Ref (%) | p_adj |
| 2.9655 | 2-ethylbutanol | 102 | Alcohol | 17.07 | 19.99 | 5.98e-06 |
| 2.9655 | 2-methyl-1-butanol | 72 | Alcohol | 20.10 | 17.82 | 3.30e-05 |
| 12.1080 | 5-methyl-2-cyclohexanol | 156 | Alcohol | 30.24 | 36.17 | 0.0002 |
| 9.1370 | tetrahydrogeraniol | 158 | Alcohol | 15.38 | 19.11 | 2.85e-05 |
| 6.0000 | 4-Ethylbenzaldehyde | 134 | Aldehyde | 25.01 | 20.65 | 9.42e-06 |
| 5.8855 | 5-methylfurfural | 110 | Aldehyde | 6.85 | 22.56 | 5.89e-10 |
| 14.0000 | Benzaldehyde | 106 | Aldehyde | 42.27 | 27.37 | 0.0434 |
| 7.0400 | Tetradecanal | 212 | Aldehyde | 20.87 | 22.38 | 1.24e-13 |
| 38.0000 | hexanal | 100 | Aldehyde | 34.18 | 37.71 | 0.0169 |
| 21.4070 | Methylcyclohexane | 98 | Alkane | 6.24 | 7.29 | 1.55e-15 |
| 4.3285 | Octane | 254 | Alkane | 29.27 | 20.91 | 4.94e-05 |
| 1.8900 | 1-pentene | 70 | Alkene | 9.49 | 10.22 | 1.55e-15 |
| 1.6015 | Isoprene | 68 | Alkene | 2.82 | 3.23 | 3.28e-14 |
| 21.4070 | methylcyclohexene | 96 | Alkene | 37.85 | 43.92 | 0.1857 |
| 4.4265 | N.N-dimethylacetamide | 87 | Amide | 71.16 | 84.32 | 0.0747 |
| 2.4560 | glycine | 75 | Amine acid | 37.62 | 27.63 | 0.0147 |
| 13.4845 | 1.2-dihydronaphthalene | 130 | Aromatic | 50.52 | 46.01 | 0.0148 |
| 7.4080 | 1.2.3-thrimetylbenzene | 120 | Aromatic | 20.57 | 21.94 | 0.0005 |
| 2.2700 | Bencene | 78 | Aromatic | 60.63 | 52.22 | 0.0131 |
| 6.7730 | Cumene | 120 | Aromatic | 21.54 | 22.90 | 7.34e-05 |
| 22.0000 | Isopropylbencene | 120 | Aromatic | 28.81 | 22.47 | 0.0007 |
| 4.4670 | O-xylene | 106 | Aromatic | 44.21 | 42.47 | 0.0550 |
| 3.1240 | Toluene | 92 | Aromatic | 28.39 | 26.86 | 0.0061 |
| 5.5395 | 4-HydroxyMandelic acid | 152 | Carboxilic acid | 6.68 | 2.98 | 3.28e-14 |
| 1.9015 | Acetic acid | 60 | Carboxilic acid | 26.56 | 30.17 | 8.98e-06 |
| 4.4190 | Butyric acid | 88 | Carboxilic acid | 55.56 | 49.25 | 0.0597 |
| 20.0000 | Hexadecanoic acid | 256 | Carboxilic acid | 31.76 | 31.60 | 7.77e-06 |
| 2.0765 | Methoxy acetic acid | 90 | Carboxilic acid | 1.87 | 1.85 | 1.42e-15 |
| 20.6405 | Octadecanoic acid | 284 | Carboxilic acid | 23.39 | 12.17 | 1.97e-11 |
| 33.0000 | Propionic acid | 74 | Carboxilic acid | 37.50 | 40.90 | 0.3952 |
| 1.5695 | Acetone | 58 | Cetone | 38.67 | 40.83 | 0.2432 |
| 24.0435 | Cholesteryl benzoate | 490 | Ester | 2.86 | 2.79 | 1.42e-15 |
| 1.9845 | Ethylacetate | 88 | Ester | 36.72 | 34.21 | 0.0147 |
| 23.8480 | Lauryl acetate | 228 | Ester | 24.32 | 18.71 | 7.60e-08 |
| 27.0000 | Methyl salicylate | 152 | Ester | 24.12 | 28.98 | 3.63e-06 |
| 9.7025 | Octyl acetate | 172 | Ester | 24.84 | 27.73 | 1.49e-07 |
| 14.2490 | butyl glyoxylate | 130 | Ester | 21.91 | 10.38 | 1.26e-09 |
| 2.1300 | methylpropionate | 88 | Ester | 21.83 | 21.71 | 5.80e-09 |
| 5.4675 | Alpha pinene | 136 | Terpene | 40.17 | 32.00 | 0.3947 |
| 6.9875 | Limonene | 136 | Terpene | 56.64 | 49.74 | 0.7033 |
| 6.7790 | Terpinene | 136 | Terpene | 13.60 | 9.35 | 6.11e-10 |
* CV: coefficient of variation; RT: retention time; m/z: mass-to-charge ratio; p_adj: p-value adjusted for multiple comparisons (FRD). CV% values represent the relative variability of each metabolite under storage conditions, refrigerated (-20 °C) and unrefrigerated at room temperature.
Table 3.
Characterization of the relative stability of critical metabolites in exhaled breath: implications for clinical diagnosis and optimization of storage protocols.
Table 3.
Characterization of the relative stability of critical metabolites in exhaled breath: implications for clinical diagnosis and optimization of storage protocols.
| RT | Putative identification | m/z | Class | CV% No Ref | CV% Ref | p_adj | Short interpretation |
| 24.04 | Cholesteryl benzoate | 490 | ester | 2.86 | 2.79 | 1.40E-15 | Highly stable in both conditions |
| 2.08 | Methoxy acetic acid | 90 | carboxilic acid | 1.87 | 1.85 | 1.40E-15 | Highly stable in both conditions |
| 1.6 | Isoprene | 68 | alkene | 2.82 | 3.23 | 3.30E-14 | Highly stable in both conditions |
| 5.54 | 4-HydroxyMandelic acid | 152 | carboxilic acid | 6.68 | 2.98 | 3.30E-14 | More stable under refrigeration |
| 20.64 | Octadecanoic acid | 284 | carboxilic acid | 23.39 | 12.17 | 2.00E-11 | More stable under refrigeration |
| 14.25 | Butyl glyoxylate | 130 | ester | 21.91 | 10.38 | 1.30E-09 | More stable under refrigeration |
| 23.85 | Lauryl acetate | 228 | ester | 24.32 | 18.71 | 7.60E-08 | More stable under refrigeration |
| 5.89 | 5-methylfurfural | 110 | aldehyde | 6.85 | 22.56 | 5.90E-10 | More stable without refrigeration |
| 4.43 | Butyric acid | 88 | carboxilic acid | 55.56 | 49.25 | 0.06 | High variability under both conditions |
| 4.43 | N,N-dimethylacetamide | 87 | amide | 71.16 | 84.32 | 0.075 | High variability under both conditions |
| 2.27 | Bencene | 78 | aromatic | 60.63 | 52.22 | 0.013 | High variability, slightly better under refrigeration |
Disclaimer/Publisher’s Note: The statements, opinions and data contained in all publications are solely those of the individual author(s) and contributor(s) and not of MDPI and/or the editor(s). MDPI and/or the editor(s) disclaim responsibility for any injury to people or property resulting from any ideas, methods, instructions or products referred to in the content. |
© 2026 by the authors. Licensee MDPI, Basel, Switzerland. This article is an open access article distributed under the terms and conditions of the Creative Commons Attribution (CC BY) license (http://creativecommons.org/licenses/by/4.0/).
Copyright: This open access article is published under a Creative Commons CC BY 4.0 license, which permit the free download, distribution, and reuse, provided that the author and preprint are cited in any reuse.


