Submitted:
08 June 2026
Posted:
09 June 2026
You are already at the latest version
Abstract
This study evaluated the use of finishing diets to reduce fish oil (FO) inclusion in European sea bass feeds while preserving fillet quality and n-3 fatty acid content. Fish (197 g) were fed for 25 weeks with a control FO diet, based on 9% FO and 6% plant oil, or diets where 6% FO was replaced by rapeseed oil (RO) or microalgae (AO; Nannochloropsis sp. and Schizochytrium sp.). After 13 weeks, 2 groups of fish fed the RO diet were switched to the FO or AO finishing diets for the final 12 weeks. Growth, feed efficiency, body composition, and health were unaffected by dietary treatments. However, long-term RO feeding reduced EPA and DHA and increased monounsaturated and n-6 fatty acids compared to fish fed AO or FO. Finishing diets effectively restored morphometric traits, fatty acid profiles, liver histology, and overall fish quality, with FO outperforming AO in recovering the original fatty acid composition of FO-fed fish. Longer finishing periods may further enhance fillet quality when using microalgae-based oils.
Keywords:
wash-out
; polyunsaturated fatty acids
; fish
; growth performance indexes
; lipid quality indexes
; liver
; intestine
; histology
; immunology
1. Introduction
Aquaculture has expanded rapidly over the last decades and now supplies more than half of the fish consumed globally, increasing the demand for nutritionally balanced and sustainable aquafeeds [1]. Traditionally, fishmeal (FM) and fish oil (FO) have been the primary protein and lipid sources in aquafeeds because of their high digestibility, balanced amino acid profile, and richness in essential long-chain n-3 polyunsaturated fatty acids (LC-PUFA), particularly eicosapentaenoic acid (EPA) and docosahexaenoic acid (DHA) [2,3]. However, the continued dependence of aquaculture on marine-derived feed ingredients places significant pressure on wild fisheries and raises concerns regarding the long-term sustainability, availability, and cost of FM and FO [4,5]. Consequently, the aquafeed industry has increasingly explored alternative and more sustainable ingredients, including plant-derived oils and meals, terrestrial animal by-products, insects, and microalgae [3,6,7].
Among these alternatives, vegetable oils have been widely adopted as substitutes for FO due to their availability, lower cost, and favourable environmental profile. Several studies and recent meta-analyses have demonstrated that partial or even complete replacement of FO with plant oils can maintain acceptable growth performance in many fish species, although responses are species-dependent [3]. In Mediterranean marine fish species such as European sea bass (Dicentrarchus labrax) and gilthead seabream (Sparus aurata), high levels of FO replacement by plant oils have often resulted in reduced growth performance, feed efficiency, or alterations in tissue lipid composition although some gradual adaptation to plant oil was obtained after long-term feeding [8,9,10,11,12,13,14,15,16]. These limitations are mainly associated with the low levels of EPA and DHA in vegetable oils and the limited capacity/inability of marine fish, particularly European sea bass, to biosynthesize LC-PUFA from C18 fatty acid precursors through desaturation and elongation activity [8,14,17,18]. As a result, prolonged feeding with plant oil-based diets generally decreases the EPA and DHA content of fish tissues and lowers the nutritional value of fillets for human consumers [19].
To address this challenge, two main nutritional strategies have emerged. The first involves the use of alternative lipid sources naturally rich in long-chain polyunsaturated fatty acids (LC-PUFA), particularly microalgae-derived oils. The second consists of “finishing” or “wash-out” feeding strategies, in which fish are initially reared on diets low in marine ingredients and subsequently fed diets rich in LC-PUFA before harvest to restore the fatty acid profile of the fillet. Finishing strategies using FO have been successful in several aquaculture species, including salmonids, seabream, and sea bass, demonstrating partial or complete recovery of tissue EPA and DHA levels after periods of vegetable oil feeding [12,19,20,21,22,23,24,25,26,27,28,29,30,31,32,33,34,35,36,37,38,39,40]. Nevertheless, the reliance of these approaches on FO during the finishing phase does not fully resolve sustainability concerns.
Microalgae have recently attracted considerable attention as promising sustainable alternatives to FO because they constitute the primary natural producers of marine LC-PUFA. Several species, including Nannochloropsis sp., Phaeodactylum tricornutum, and Schizochytrium sp., are particularly rich in EPA and/or DHA and additionally provide valuable bioactive compounds such as pigments, antioxidants, vitamins, and polysaccharides [41,42]. Beyond their nutritional value, microalgae cultivation may contribute to reducing the environmental impact of aquafeeds through lower dependence on wild fish stocks, lower contaminant accumulation, and potential carbon dioxide mitigation during production [19,43,44]. Consequently, microalgae-derived ingredients have been increasingly investigated as partial replacements for FM and FO in aquafeeds [41,45,46]. In European sea bass and gilthead seabream, previous studies demonstrated that partial replacement of dietary FO with microalgal biomass or oils can maintain growth performance and improve tissue fatty acid quality depending on the inclusion level and algal species used [45,47,48,49].
Despite these promising findings, important knowledge gaps still exist regarding the application of microalgae-based finishing diet strategies in marine fish nutrition. Most previous studies have either evaluated microalgae as direct FO replacement throughout the production cycle or applied finishing diets in formulations still containing relatively high levels of marine ingredients or focusing on the replacement of plant oil rather than FO [50,51,52]. Moreover, limited information is available on the combined use of EPA-rich and DHA-rich microalgae in finishing diets specifically formulated to restore fillet LC-PUFA levels following prolonged feeding with plant oil-based diets. Furthermore, the effects of such strategies on growth performance, nutrient utilization, tissue fatty acid recovery, and overall health in European sea bass remain largely unexplored.
Therefore, the present study aimed to compare the long-term dietary effects of two microalgae-based ingredients, the EPA-rich Nannochloropsis sp. and the DHA-rich Schizochytrium sp., with those of FO or rapeseed oil (RO) in European sea bass diets. Given the limited availability of FO and the relatively high cost of microalgae, the study also investigated the feasibility of further reducing dietary inclusion of FO and AO through a finishing (“wash-out”) feeding strategy. In this approach, fish initially reared on a RO-based diet low in marine ingredients were subsequently fed diets containing FO or AO in order to restore fillet nutritional quality, while simultaneously reducing reliance on finite marine resources and improving the sustainability of aquafeed formulations. The effects of replacing FO with RO or AO, either throughout the entire feeding period or exclusively during the finishing phase, were evaluated in terms of growth performance, feed utilization, fillet proximate composition and fatty acid profile, liver and posterior intestine histology, and innate immune responses.
2. Materials and Methods
2.1. Animal Ethics Statement
All experiments involving fish were conducted in accordance with EU guidelines on the protection of animals used for scientific purposes (Directive 2010/63/EU). The research followed the generally accepted ‘3Rs’ (replacement, reduction, refinement of animal used) and the ARRIVE (Animal Research: Reporting of in vivo Experiments) guidelines (https://arriveguidelines.org). The Hellenic Centre for Marine Research (HCMR) rearing facilities are licensed by the Greek authorities (EL91-BIOexp-04). The experiment was designed in accordance with the region of crete Ethics Committee and with the ARRIVE guidelines. It was supervized by a scientist (MM) accredited by the Federation for Laboratory Animal Science Associations (FELASA, Functions A-D), and responsible for the care, anesthesia, sampling and euthanasia of experimental fish.
2.2. Microalgae
Two microalgae meals were chosen for their richness in n-3 PUFA. Nannocholoropsis sp. (21.00% lipids), rich in EPA (21.33% of total FA) and also containing arachidonic acid (ARA, 20:4 n-6, 5.60% of total FA), was obtained from Algatech (Israel) under the name AlgaNea. Schizochytrium sp. (51.55% lipids), chosen for its richness in DHA (52.76% of total FA), was obtained under the name Algaprime (Corbion, The Netherlands). Their proximate composition is given in Table 1.
2.3. Experimental Diets
Three isoenergetic (21.8 ΜJ/Kg), isolipidic (17.5%), and isonitrogenous (44.4% CP) diets were formulated based on FM and a mixture of plant ingredients commonly used for European sea bass aquafeeds (Table 2): a FO-based control diet similar to commercial diets (9% FO, 6% RO, diet FO), a plant oil-based diet containing only 3% of FO to cover the basic DHA/EPA requirement and 12% of RO (diet RO), and a diet based on a mixture of the 2 microalgae meals each providing 1.5% of the dietary lipids content (diet AO, 7.2% Nannochloropsis sp., 3% Schizochytrium sp., 3% FO and 9% RO). They were produced at the facilities of the Applied Nutrition Laboratory of the Institute of Marine Biology, Biotechnology and Aquaculture (IMBBC) of HCMR in Anavyssos, Greece. All ingredients, except 80% of the dietary oils (FO and RO), were mixed together and 4.5 mm pellets were obtained using a floor-standing food mixer (Hobart, USA). The pellets were dried at 40 °C for 6h and the remaining dietary oil was added by vacuum coating (Dinnissen, The Netherlands). The three diets were analysed for proximate and fatty acid composition (Table 2 & Table 3) as described in section 2.6.
1 Mono-calcium phosphate, lysine, methionine, vitamin C (ascorbic acid, Stay-C) (Irida, Greece), taurine (Sigma Aldrich, USA) and the premix were diluted with corn gluten to 100g.
2 Per kilogram of mineral and vitamin premix (Irida, Greece): vitamin A (retinyl acetate, 4,000,000 IU), vitamin D3 (cholecalciferol, 800,000 IU), vitamin E (DL-α-tocopherol, 100 g), vitamin C (Stay-C, 80 g), vitamin B1 (thiamin, 8 g), vitamin B2 (riboflavin, 8 g), vitamin B3 (niacin, 60 g), vitamin B5 (D-pantothenic acid, 24 g), vitamin B6 (pyridoxine-HCl, 8 g), vitamin B7 (biotin, 400 mg), vitamin B8 (inositol, 60g), vitamin B12 (cyanocobalamin, 80 mg), vitamin K3 (menadione, 4 g), folic acid (1.6 g), Iron (FeSO4, H2O, 28 g), Manganese (MnO,14 g), Iodine (KI, 2.4 g), Copper (CuSO4, 5H2O, 2.8 mg), Zinc (ZnSO4, H2O, 24 g) and 2 antioxidants (16 mg butylated hydroxyanisole, BHA, E320 and 160 mg butylated hydroxytoluene, BHT, E321in carrier CaCO3).
3 CP = Crude protein, EE = ether extract, moisture, and ash are all analysed concentrations.
4 Nitrogen-Free extract and Organic Matter were calculated by the formulae: NFE = 100—(crude protein + crude lipid + moisture + ash); OM= 100—moisture—ash.
5 Crude Fiber, Acid Detergent Fiber and Neutral Detergent Fiber were calculated based on the ingredients CF, ADF and NDF content.
6 Energy was calculated by the formulae: (CP x 23.6 + EE x 39.5 + NFE x 17.3) / 100

Table 3.
Fatty acid profile (% total fatty acid) of the 3 experimental diets for European sea bass.
| Fatty Acids | FO | AO | RO |
|---|---|---|---|
| 14:0 | 2.79 | 1.64 | 1.22 |
| 15:0 | 0.43 | 0.21 | 0.18 |
| 16:0, PA | 14.31 | 14.17 | 9.93 |
| 17:0 | 0.50 | 0.27 | 0.24 |
| 18:0, SA | 3.61 | 2.51 | 2.60 |
| 20:0 | 0.64 | 0.53 | 0.59 |
| 22:0 | 0.44 | 0.42 | 0.46 |
| 24:0 | 0.27 | 0.23 | 0.26 |
| Σ SFA | 23.00 | 20.02 | 15.49 |
| 16:1 n-7, POA | 3.47 | 3.74 | 1.61 |
| 16:1 n-9, HDA | 0.35 | 0.18 | 0.14 |
| 17:1n-7 | 0.21 | 0.16 | 0.13 |
| 18:1 n-7 | 2.70 | 2.53 | 3.03 |
| 18:1 n-9, OA | 31.60 | 35.40 | 43.34 |
| 20:1n-7 | 0.13 | 0.08 | 0.09 |
| 20:1 n-9 | 1.10 | 0.98 | 1.20 |
| 20:1n-11 | 0.14 | 0.10 | 0.10 |
| 22:1n-9 | 0.29 | 0.25 | 0.30 |
| 22:1 n-11, EA | 0.60 | 0.38 | 0.44 |
| 24:1 n-9 | 0.71 | 0.43 | 0.50 |
| Σ MUFA | 41.32 | 44.25 | 50.90 |
| Σ n-9 MUFA | 34.05 | 37.25 | 45.48 |
| 18:2 n-6, LA | 14.00 | 16.04 | 19.83 |
| 18:3 n-6 | 0.12 | 0.11 | 0.07 |
| 20:2 n-6, EDA | 0.22 | 0.13 | 0.17 |
| 20:3 n-6, ERA | 0.20 | 0.19 | 0.13 |
| 20:4 n-6, ARA | 0.66 | 0.90 | 0.37 |
| Σ n-6 PUFA | 15.20 | 17.37 | 20.57 |
| 18:3 n-3, ALA | 3.46 | 4.10 | 5.26 |
| 18:4 n-3, SDA | 0.77 | 0.41 | 0.40 |
| 20:3 n-3 | 0.17 | 0.11 | 0.16 |
| 20:4 n-3 | 0.32 | 0.25 | 0.20 |
| 20:5 n-3, EPA | 4.76 | 3.87 | 2.31 |
| 22:5 n-3, DPA | 0.59 | 0.34 | 0.32 |
| 22:6 n-3, DHA | 10.40 | 9.28 | 4.40 |
| Σ n-3 PUFA | 20.48 | 18.35 | 13.05 |
Diets FO = fish oil; AO = algal oil; RO = rapeseed oil; ALA = α-linolenic acid; ARA = arachidonic acid; DHA = docosahexanoic acid; DPA = Docosapentaenoic acid; EA = Erusic acid; EDA = eicosadienoic acid; EPA = eicosapentaenoic acid; ERA = eicosatrienoic acid; HDA =hypogenoic acid; LA = linoleic acid; MUFA = monounsaturated fatty acids; n-3/n-6 PUFA = ratio of omega 3/omega 6 FA; OA = oleic acid; PA = palmitic acid; POA = palmitoleic acid; PUFA = polyunsaturated fatty acids; SA = Stearic acid; SDA = Stearidonic acid; SFA = saturated fatty acids; Σ = Total.
2.4. Fish Rearing
Adult fish fed on a commercial diet (Gorgo 4.5mm, 45% crude protein and 17% lipids, containing FM, FO, wheat, sunflower meal, soya protein concentrate, soybean meal and corn gluten, Zoonomi, Greece) were transferred from the HCMR sea cage facilities in Souda (Crete, Greece) to the IMBBC Aqualabs rearing facilities in Gournes (Crete, Greece). Fish were acclimated for 10 d in a large 5 m3 tank (2.4x1.7x1.2 m, L x l x H) in a sheltered outdoor facility. They were fed ad libitum twice a day with the same commercial diet mentioned above. After the acclimation period, 240 European sea bass with an initial body weight of 197.5 ± 35.4 g were randomly distributed in 12 nets of 840 L (1.4 x 0.5 x 1.2 m, L x l x H) in 4 cement tanks of 5 m3 (3 nets/tank). The fish were kept in an open flow system supplied at a high renewal rate of 40%/h with borehole seawater (salinity: 34‰) enabling a stable temperature of 20.0 ± 0.6 °C and natural photoperiod. The physico-chemical properties of the water remained stable throughout the experiment (pH: 7.80 ± 0.22; O2: 8.3 ± 0.5 ppm; oxygen saturation: 91.0 ± 5.6%).
A block randomized design was used to obtain 3 large tanks each including all three basal diets assigned randomly to the 3 nets and one technical non-factorial validation tank with three nets of fish fed a single diet (RO) for the 13 wk-growth period (see graphical abstract and section 2.9). Therefore, fish fed the RO-based diets were kept in 6 nets (1 net in each of the 3-block design tanks and 3 nets in the validation tank), while fish fed the FO- and AO-based diets were kept in triplicate nets. At the end of the 13 wk-growth period, fish were sampled and assigned to new diets in duplicate nets for the finishing period of the study, which lasted for an additional 12 wk (25 wk in total). Fish fed the FO or AO diets continued to be fed with the same diets. Fish fed the RO diet were either switched to FO or AO based diets or continued being fed on the RO diet (see graphical abstract). Fish were fed twice daily to satiation and the distributed feed was weighed daily for each net.
2.5. Samplings, growth performance, morphometric indices
Samplings were performed after 13 wk (growth period) and 25 wk (finishing period) of the feeding trial on 24h-fasted fish. Fish were randomly sampled, anesthetized with 0.05% clove oil (diluted 1:10 in ethanol), and individually weighed to determine growth performance, feed efficiency, and survival. Six fish were sampled per dietary treatment to determine the proximate composition and fatty acid profile of the fish fillets (2 fish per triplicate net at the end of the growth period and 3 fish per duplicate net at the end of the finishing period). Livers and intestines were dissected from 3 fish/net and stored in 20 volumes of 4% formalin for histological analysis. At the end of the finishing period, liver, viscera, and visceral fat were collected from 12 fish per dietary treatment (6 fish per replicate net) and individually weighed to determine hepato-somatic (HSI), viscero-somatic (VSI), and mesenteric fat index (MFI). Blood samples were also collected at 25 wk, from 8 fish per net (16 fish per dietary treatment), by caudal puncture using 2.5 mL syringes without heparin. A 20 μL blood sample was heparinized for hemoglobin analysis. Non-heparinized blood was allowed to clot for 3h at 4 °C, centrifuged at 16,000 x g for 10 min at 4 °C, and serum samples were stored at -80 °C until immunological analyses were performed. Sampled fish were then humanely killed by an overdose of anesthetic (0.5% clove oil) followed by cervical transection in accordance with the EU Directive 2010/63/EU on the protection of animals used for scientific purposes.
2.6. Biochemical Analyses
2.6.1. Proximate Composition
The proximate compositional analysis of the diets and fish fillets (moisture, ash, protein and lipids) was determined by standard methods [53]. Moisture content was determined by the loss on drying method (LOD) by drying pre-weighed samples in porcelain cups at 105 °C for 24h (method 950.46). Ash content was assessed by combustion in a muffle furnace for 12 h at 550 °C (method 920.153). Crude protein (N x 6.25, method 954.01) was determined by the Kjeldahl method after acid digestion (Kjeltec Auto Tecator, Foss Tecator, Denmark) (method 988.05). Total lipid in diets was determined by acid hydrolysis of the sample using HCl followed by fat extraction with petroleum ether in a Soxhlet apparatus (Soxtec System HT, 1043 Extraction Unit Foss Tecator, Denmark) according to the ISO method 6492:1999 (Animal Feeding Stuff—Determination of fat content).
2.6.2. Determination of the tissue fatty acid profiles
The fatty acid profiles of the experimental diets and fish fillets were determined as fatty acid methyl esters (FAME) after extraction and direct transesterification in a methanol-toluene (3:2) and acetyl chloride-methanol 1:20 (v/v) solution (modified method [54]). In brief, FAME were analyzed by gas chromatography-mass spectrometry (7890A GC system, Agilent Technologies, Santa Clara, CA, USA), with separation performed on an Agilent DB-WAX GC column (30 m 0.25 mm, coated with a 0.25-μm film thickness, Agilent Technologies, Santa Clara, CA, USA). The oven temperature increased from 130oC to 215oC at a rate of 3oC/min, then to 220oC at a rate of 0.3oC/min, and to 240oC at a rate of 20oC/min and held for 12 min. The injector was operated in the split mode, and the temperatures of the MS source and quadrupole were set at 230oC and 150oC, respectively. Compound identification was based on comparison of MS data with reference compounds and with NIST library (NIST/EPA/NIH Mass Spectral Library with Search Program, software version 2.0f). Individual fatty acid concentrations were expressed as the percentage of the total lipids. Nutritional quality indices of the lipid fraction were calculated from the FA composition analysis of the fish fillets [55,56]. From the fatty acid profile, the Hypocholesterolaemic / hypercholesterolaemic ratio (h/H), the Atherogenic index (AI), the Thrombogenic index (TI), the Unsaturation index (UI), and the Fish lipid quality (FLQ) were calculated using the following equations where Σ n-6 PUFA and Σ n-3 PUFA were the sum of omega 6 and omega 3 polyunsaturated fatty acids, Σ MUFA was the total of monounsaturated fatty acids and Σ SFA was the total saturated fatty acids:
h/H = (C18:1 n-9 + Σ n-6 PUFA+ Σ n-3 PUFA) / (C12:0 + C14:0 + C16:0)
AI = (C12:0 + 4 x C14:0 + C16:0) / Σ unsaturated FA,
TI = (C14:0 + C16:0 + C18:0) / [(0.5 x Σ MUFA) + (0.5 x Σ n-6 PUFA) + (3 x Σ n-3 PUFA) + (Σ n-3 PUFA / Σ n-6 PUFA)],
UI = 1 x (Σ monoenoic FA) + 2 x (Σ dienoic FA) + 3 x (Σ trienoic FA) + 4 x (Σ tetraenoic FA) + 5 x (Σ pentaenoic FA) + 6 x (Σ hexaenoic FA),
FLQ = 100 x (C22:6 n-3 + C20:5 n-3) / Σ SFA
2.7. Intestine & Liver Histology
Standard histological methods were used to prepare liver and intestine sections [57]. Briefly, tissues fixed in 10% buffered formalin were washed in 70% ethanol, dehydrated in ascending methanol/ethanol concentrations to 100% and embedded in paraffin (60oC). Thin sections (2-4 μm) were cut using a microtome (Leica RM 2255, Nussloch, Germany), stained with hematoxylin and eosin (H&E, Leica Auto Stainer XL, Nussloch, Germany) and examined by light microscopy (Olympus VANOX-T, NJ, USA) with a digital camera (Infinity, Lumenera, Ontario, Canada). Posterior intestine sections were evaluated for the presence of absorptive vacuoles in the mucosal enterocytes and for mucosal and submucosal integrity. Liver sections were evaluated for the degree of lipid degeneration and hepatocyte integrity. Photographs were recorded and processed using an image analysis software (Digital Image Systems, Athens, Greece) according to Kokou and colleagues [58].
2.8. Hematological & Immunological Parameters
All hematological and immune parameters were assessed using a microplate reader (Fluostar, BMG Labtech, Germany). Hemoglobin concentration was assessed in the heparinized whole blood using the Drabkin method [59] with methemoglobin as standard and miniaturized for assessement in 96-well microplates [60]. Immune parameters were assessed in 384-wells microplates in the serum samples stored at -80oC. The antibacterial activity of serum lysozyme against a Gram-positive bacterium, Microccocus luteus and the antibacterial activity of the serum complement against a luminescent strain of a Gram-negative bacterium, Escherichia coli, were assessed as previously described [61]. The anti-protease activity was determined using azocasein as substrate and porcine pancreas trypsin as standard [62]. Serum nitric oxide was determined using the Griess reagent and sodium nitrite as standard [61]. Serum myeloperoxidase activity was determined using 2.5 mM 3,3′,5,5′-tetramethylbenzidine hydrochloride and 5 mM hydrogen peroxide as substrate [60,63]. Ceruloplasmin activity was determined using p-phenylenediamine as substrate as described before [62]. The alkaline phosphatase activity was determined as described before [64] with some modifications to adapt the methods for use in 384 wells- microplates to enable triplicate measurement for each sample. In more details, 5 μL of serum samples diluted with 75 μL of 100 mM ammonium bicarbonate buffer, 1 mM MgCl2, pH 7.8 were incubated in triplicate wells of a 384 well transparent microplate with 20 μL of 8 mM p-nitrophenol phosphate (Sigma) diluted in the same buffer. The increase in OD was measured every minute for 30 minutes at 405 nm using a microplate reader (Fluostar, BMG Labtech, Germany). ΔOD data were converted in Units/mL serum using 18.75mM of absorptivity of p-nitrophenol.
2.9. Experimental Design and Statistical Analysis
Regarding the experimental design (see graphical abstract), in the first (growth) phase, a balanced 3-block design was applied with three experimental tanks, each containing 3 nets randomly assigned to the 3 dietary treatments (FO, AO, and RO), while a fourth technical validation tank, containing 3 nets all supplied with RO, was used as a diagnostic control to evaluate potential between tanks effect and within-tank (net-to-net) variability. A two-way ANOVA analysis was thus performed only on fish fed the RO diet either in the 3-block design or in the validation tank to determine the effect of the net position in the tank and of the tank and their interaction. Then, one-way ANOVA was performed only on the 3-block design tanks (triplicate nets/diet) after the 13 wk growth trial to determine the effect of the diets on fish growth, proximate composition, and FA profile. For the second (finishing) phase, technical duplication (two tanks per treatment) was applied due to logistical constraints and the distinct objective of this phase: while the initial 13-week growth period, which examined the dose-response effects of dietary RO on fish growth, was conducted using triplicate tanks as standard practice, the finishing phase focused on fatty acid composition of the fillet and fish immune responses. To mitigate the reduced tank replication, a higher number of fish per net was sampled, and statistical inference was therefore based on biological replicates within dietary treatment, thereby maintaining the robustness of comparisons among dietary treatments. Beside the larger sample size, rigorous analytical procedures, repeated measurements, and internal standards, further ensured the quality control and data reliability.
Prior to statistical analysis, proportional data (percentage and fatty acid profiles) were transformed using arcsine square-root to meet ANOVA assumptions of normality and homoscedasticity, checked using the Shapiro-Wilk and the Levene tests respectively. When assumptions were met, data were analysed using Analysis of Variance (ANOVA). Post-hoc comparisons were performed using Tukey’s HSD test when significant differences were detected (α = 0.05). When assumptions were not met despite the transformations, non-parametric tests were performed, i.e., Kruskal-Wallis followed by the Games-Howell Post-Hoc test.
At the end of the growth phase, linear and quadratic effects of dietary rapeseed oil inclusion were assessed using polynomial contrast analysis, based on dietary levels of RO inclusion in diets FO, AO and RO (6%, 9%, and 12% respectively). These polynomial regression analyses were not applied at the end of the finishing phase because dietary lipid composition was no longer linearly graded across treatments due to the intermediate switching of diets. The simple contrast analysis was performed for the immunological parameters to compare each experimental dietary treatment to the FOFO group.
In addition, fatty acid datasets and lipid quality indices were further explored using multivariate approaches. Variables showing significant differences among diets were standardized (zero mean and unit variance) prior to Principal Component Analysis (PCA), which was used to reduce dimensionality and explore overall patterns among dietary groups. Separate PCA analyses were performed for fatty acid profiles and lipid quality indices, and results were visualized using 2 biplots to illustrate relationships between variables and diet clusters represented by ellipses.
All statistical tests were performed with a significance level of α= 0.05 using JASP Statistical Software (v 0.95.4; JASP Team, 2025), except PCA, which was performed and presented using the R Studio (v 4.4.2; R Core Team, 2024) using the fviz_pca_biplot function.
3. Results
3.1. Fish Growth, Feed Utilization and Morphometric Indices
Comparing the 4th validation tank and the 3 RO nets in the 3-block design, consistent growth was obtained across independent rearing units (Table 4). No significant differences in fish weight were observed among fish fed the RO diet at any sampling point (t0, 56d and 93d), regardless of whether the fish were reared in nets positioned differently, in separate nets within the validation tank or in distinct tanks under the 3-block experimental design. These results indicate that neither the position of the net within the tank (net effect) nor the different tanks (tank effect) influenced fish weight during the experimental period (One-Way ANOVA, P-value > 0.05).
All fish, fed the RO diet for the 13 wk-growth phase, were distributed either in nets in the first, second or third position of the 3-block tanks, or in the 3 nets of the validation tank. Fish were weighed at the beginning of the trial (initial weight, Wi), at the first intermediate sampling after 56 days (W 56d), at the end of the growth trial (W 93d =13 weeks). Number of fish in each net (n) varied from 20 to 12 fish/net from the start to the end of the growth trial.
Fish performance, feed utilization and morphometric results are presented in Table 5. Fish growth was slower during the 13 wk-growth period than during the final 12 wk-finishing period (mean SGR 0.27 ± 0.01 and 0.47 ± 0.02 and mean FCR 2.05 ± 0.12 and 1.50 ± 0.05, respectively). At the end of the 13 wk-growth period, there were no significant differences in growth performance (P > 0.05), morphometric parameters (data not shown) and feed utilization among the dietary groups. Identically, during the 12 wk-finishing period alone and when the entire growth period (0-25 wk) was considered, fish growth and feed utilization did not show any differences among the dietary groups (P > 0.05, Table 4). The 3 morphometric parameters tested at the end of the finishing period (25 wk) showed significant differences among the diets, with HSI significantly reduced in fish fed AOAO, ROFO and ROAO compared to fish fed RORO, whilst VSI and MFI were significantly reduced in fish fed ROAO compared to fish fed RORO (P < 0.05). VSI was also significantly reduced in fish fed ROFO compared to fish fed RORO or FOFO (P = 0.001).
The growth performance indices were calculated based on the initial body weight (Wi, g/fish), fish weight (Wt, g/fish) at sampling time t (days), the biomass of each net at the start (Bi, g) and at sampling time t (Bt, g) as follows:
4 WG (Weight Gain, %) = 100 x (Wf—Wi) /Wi
5 DFI (Daily Feed Intake, g/fish/day) = total feed intake / number of fish / feeding days
6 SGR (Specific Growth Rate, %/day) = (Ln Wf—Ln Wi) x 100 / feeding days
7 FCR (Feed Conversion Ratio) = total feed intake / (Biomass t—Biomass i)
8 HIS (%) = 100 x (Weight liver / BW)
9 VSI (%) = 100 x (Weight viscera / BW)
10 MFI (%) = 100 x (Weight visceral fat / BW)
3.2. Proximate composition of the fish fillet
The proximate composition of the fish fillets did not show any significant difference between the dietary treatments at either 13 or 25 wk (Table 6) except for the protein composition of the fillets at the end of the growth period which were significantly higher in fish fed AO or RO diets compared to fish fed the FO diet (P = 0.011) with a linear effect of dietary RO (P = 0.010). This was not apparent anymore after 25 wk of trial.
3.3. Fatty Acids of the Fish Fillet
The results of the FA profile of the fish fillets at the end of the growth and finishing periods are presented in Table 7 and Table 8, respectively. The fatty acids profile of the sea bass fillet reflected the dietary fatty acid profile (Table 3). At the end of the 13 wk-growth trial, n-9 MUFA (P = 0.007), mainly the 18:1 n-9 (oleic acid, OA, P = 0.009), and h/H (P = 0.001) were significantly increased in fish fed the RO diet compared to the control FO group. These dose-response increases were linear in function of the dietary RO content (P ≤ 0.003). On the contrary, SFA (P < 0.001), 16:1 n-7 (P = 0.001), n-3 PUFA (P = 0.039), mainly stearidonic acid (SDA, P = 0.002) and EPA (P < 0.001), n-3/n-6 (P = 0.054), AI (P < 0.001) and EPA+DHA (P = 0.028), were significantly lower than that of fish fed FO and decreased in a linear manner when dietary RO was considered (P < 0.05). In AO-fed fish, ARA (20:4 n-6) and h/H were highly significantly increased (both at P = 0.001), while SFA (P < 0.001), 16:1 n-9 (P < 0.001), SDA (P = 0.002), AI (P < 0.001) and TI (P = 0.029) were reduced compared to the FO-fed fish giving significant quadratic regressions in function of the dietary RO (P < 0.05).
Results are expressed as the means of 3 replicates of 2 fish per replicate (n = 6).
a-c Different letters on the same line show significant differences in one type of FA or in a lipid nutritional quality indice among dietary treatments (FO, AO or RO) of fish fed for 13 wk. Where a dietary group showed significant difference in comparison with fish fed the FO-based diet (P < 0.05), the percentage of change compared to FO-fed fish is given in brackets in the adjacent column (Δ, %).
1 include fatty acids not listed (< 0.5% of total FA).
2 h/H =Hypocholesterolaemic / hypercholesterolaemic ratio (h/H)
3 AI= Atherogenecity index
4 TI=Thrombogenicity index,
5 UI= Unsaturation index
6 FLQ=Fish lipid quality
7 EPA+DHA is expressed as g/100g fillet.
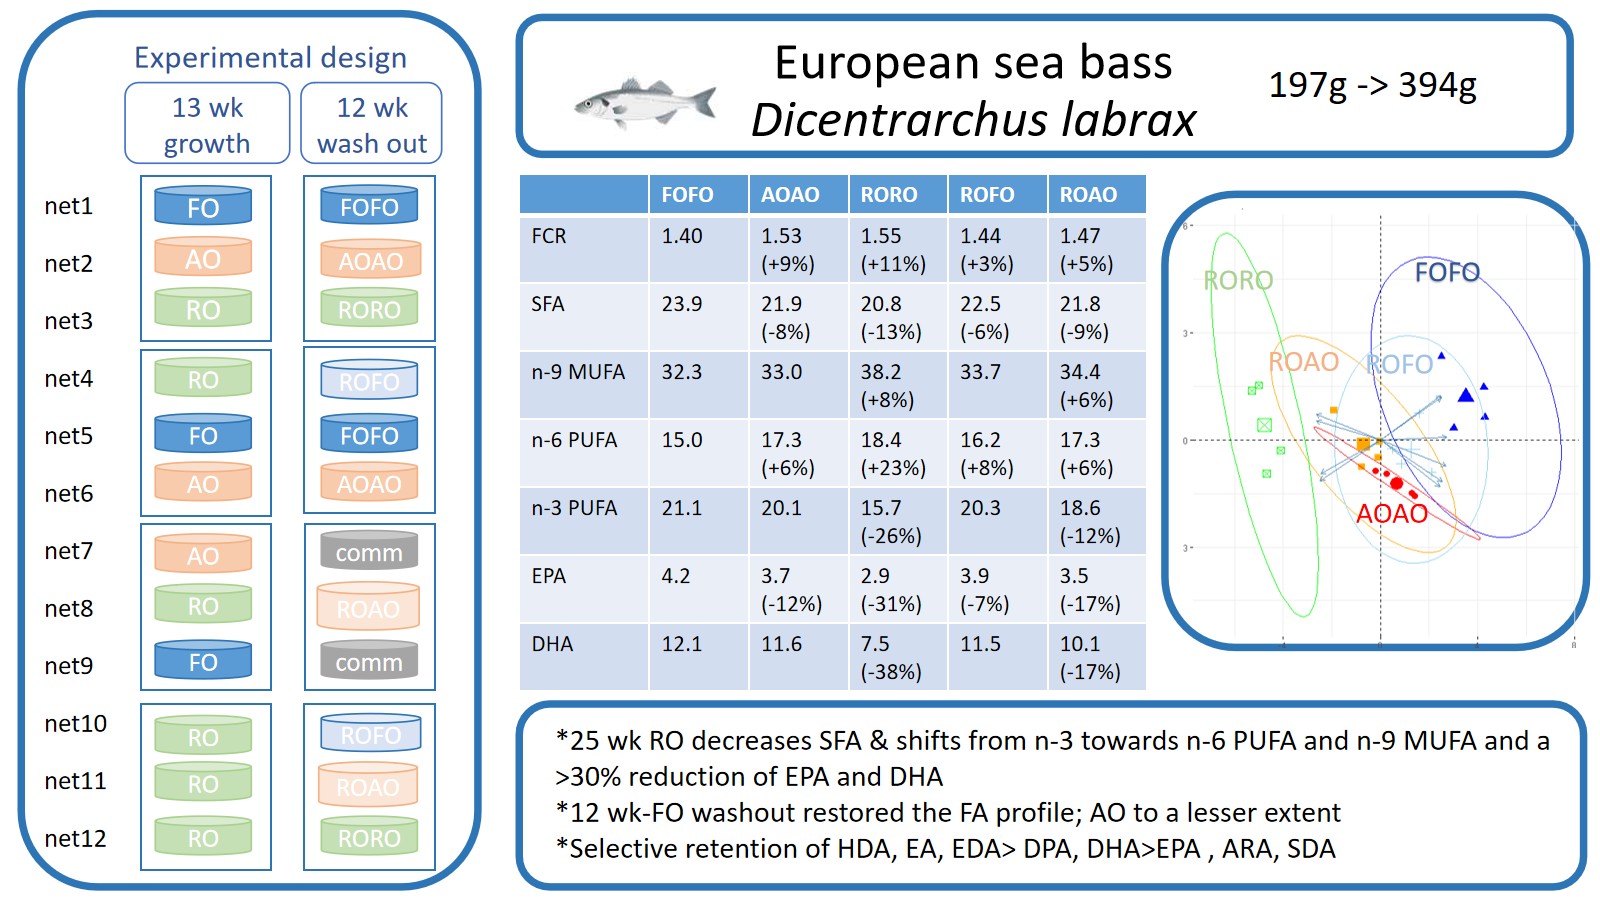
At the end of the finishing trial (Table 8, 25 wk), the differences in FA profile became significant for all FA groups. A significant decrease in SFA (P < 0.001), and n-3 PUFA (20:5 n-3, EPA, P< 0.001; 22:5 n-3, docosapentaenoic acid, DPA, P = 0.002; 22:6 n-3, DHA, P < 0.001) and a highly significant increase in oleic acid (18:1 n-9, OA, P < 0.001) and linoleic acid (18:2 n-6, LA, P < 0.001) were observed in the group of fish reared on the RORO diet compared to the FOFO diet. There was a significant decrease in n-3/n-6 PUFA ratio (P < 0.001) in RORO-fed fish compared to FOFO-fed fish, which was fully recovered in fish fed ROFO but only partially in fish fed ROAO. Significant reductions in n-3 PUFA levels, particularly in EPA, DHA, and their intermediate DPA, were observed in RORO-fed fish, with decreases of 31%, 38%, and 20.7%, respectively (P ≤ 0.002) compared to FO-fed fish resulting in a 25.5% reduction of total n-3 PUFA levels (P < 0.001). In addition, AOAO-fed fish also showed highly significant reduction in EPA (-11.9%, P < 0.001) and its precursor stearidonic acid (SDA, 18:4 n-3, -24.5%, P = 0.002) but not in DPA or DHA levels compared to FOFO-fed fish. Almost complete recovery (96.6%) of the total n-3 PUFA levels was achieved in fish fed ROFO while partial but still high recovery (88.4%) was evident for diet ROAO. The plant oil diet resulted in lower AI, UI and FLQ (P < 0.001) and higher h/H (P < 0.001) compared to the FO and AO diets. UI and FLQ returned to the levels of FO-fed fish in fish switched to FO or AO for 12 wk. Concerning h/H and AI, changes observed in RORO fish were halved in fish switched to FO diet, and somewhat less resolved in fish fed AO for the last 12 wk.
Table 8.
Effect of dietary oil on the fatty acid profile (% of total fatty acids) of the fillet of European sea bass after 25 wk feeding with the 3 different experimental diets (FOFO, AOAO, RORO) or after 12 wk of FO or AO finishing diets in fish fed the RO diet for the first 13 wk (ROFO, ROAO).
Table 8.
Effect of dietary oil on the fatty acid profile (% of total fatty acids) of the fillet of European sea bass after 25 wk feeding with the 3 different experimental diets (FOFO, AOAO, RORO) or after 12 wk of FO or AO finishing diets in fish fed the RO diet for the first 13 wk (ROFO, ROAO).
| FOFO | AOAO | Δ | RORO | Δ | ROFO | Δ | ROAO | Δ | SEM | P-value | |
|---|---|---|---|---|---|---|---|---|---|---|---|
| 14:0 | 2.33 c | 1.70 a | (-26.9) | 1.66 a | (-28.6) | 2.02 b | (-13.2) | 1.79 ab | (-23.3) | 0.063 | < 0.001 |
| 16:0, PA | 15.71c | 14.90 b | (-5.2) | 13.93 a | (-11.3) | 14.82 b | (-5.6) | 14.84 b | (-5.5) | 0.143 | < 0.001 |
| 18:0, SA | 4.40 | 4.13 | 4.01 | 4.28 | 4.04 | 0.052 | 0.078 | ||||
| ΣSFA1 | 23.89c | 21.94 b | (-8.2) | 20.75 a | (-13.1) | 22.49 b | (-5.9) | 21.84 b | (-8.6) | 0.247 | < 0.001 |
| 16:1 n-7, POA | 3.45 c | 3.30 bc | 2.60 a | (-24.6) | 3.01 b | (-12.7) | 3.39 bc | 0.080 | < 0.001 | ||
| 16:1 n-9, HDA | 0.54 c | 0.42 a | (-22.8) | 0.49 bc | 0.52 c | 0.45 ab | (-15.7) | 0.012 | < 0.001 | ||
| 18:1 n-7 | 2.81 | 2.70 | 2.80 | 2.77 | 2.77 | 0.027 | 0.738 | ||||
| 18:1 n-9,OA | 28.78a | 29.39 ab | 34.40 c | (+19.5) | 30.11ab | 30.64 b | (+6.5) | 0.478 | < 0.001 | ||
| 20:1 n-9 | 2.20 a | 2.41 ab | 2.48 ab | 2.24 ab | 2.50 b | (+13.7) | 0.039 | 0.013 | |||
| 22:1 n-11, EA | 0.87 | 1.07 | 1.04 | 0.87 | 1.07 | 0.039 | 0.218 | ||||
| ΣMUFA1 | 40.08 a | 40.66 ab | 45.18 c | (+2.7) | 40.96 ab | 42.22 b | (+5.3) | 0.447 | < 0.001 | ||
| Σn-9 MUFA | 32.33 a | 33.03 ab | 38.16 c | (+8.0) | 33.71 ab | 34.37 b | (+6.3) | 0.492 | < 0.001 | ||
| 18:2 n-6,LA | 13.22 a | 15.10 b | (+14.3) | 16.78 c | (+26.9) | 14.35 ab | 15.34 b | (+16.0) | 0.291 | < 0.001 | |
| 20:2 n-6, EDA | 0.72 | 0.80 | 0.73 | 0.82 | 0.79 | 0.014 | 0.102 | ||||
| 20:4 n-6,ARA | 0.68ab | 0.99 b | (+45.6) | 0.46 a | 0.66 ab | 0.82 b | 0.050 | < 0.001 | |||
| Σn-6 PUFA | 14.96 a | 17.28 bc | (+5.5) | 18.39 c | (+22.9) | 16.21 b | (+8.4) | 17.33 bc | (+5.8) | 0.288 | < 0.001 |
| 18:3 n-3,ALA | 2.84 a | 3.19 b | (+12.3) | 3.75c | (+32.0) | 3.16 b | (+11.3) | 3.32 b | (+16.9) | 0.071 | < 0.001 |
| 18:4 n-3,SDA | 0.57 b | 0.43 a | (-24.5) | 0.48 ab | 0.53 b | 0.48 b | 0.013 | 0.002 | |||
| 20:5 n-3,EPA | 4.15 d | 3.68 bc | (-11.9) | 2.86 a | (-31.0) | 3.85c | (-7.1) | 3.54 b | (-16.7) | 0.102 | < 0.001 |
| 22:5 n-3,DPA | 0.76c | 0.67 abc | 0.60 a | (-20.7) | 0.73 bc | 0.65 ab | (-14.0) | 0.016 | 0.002 | ||
| 22:6 n-3,DHA | 12.13 c | 11.55 bc | 7.50 a | (-38.0) | 11.47 bc | 10.06 b | (-16.5) | 0.416 | < 0.001 | ||
| Σn-3 PUFA | 21.06 c | 20.12 bc | 15.69 a | (-25.5) | 20.34 bc | 18.61 b | (-11.6) | 0.473 | < 0.001 | ||
| n-3/n-6 PUFA | 1.40 c | 1.17 b | (-14.3) | 0.85 a | (-35.7) | 1.26 bc | 1.08 b | (-21.4) | 0.046 | < 0.001 | |
| h/H 2 | 3.59 a | 4.02 b | (+11.9) | 4.39 c | (+22.2) | 3.96 b | (+10.2) | 4.00 b | (+11.4) | 0.062 | < 0.001 |
| AI 3 | 0.23 c | 0.20 b | (-15.2) | 0.18 a | (-23.8) | 0.21b | (-10.8) | 0.20 b | (-15.2) | 0.004 | < 0.001 |
| TI 4 | 0.24 | 0.23 | 0.25 | 0.23 | 0.24 | 0.002 | 0.080 | ||||
| UI 5 | 182.1 b | 182.1b | 160.6 a | (-11.7) | 180.6 b | 174.1b | 2.089 | < 0.001 | |||
| FLQ 6 | 68.19 b | 69.42 b | 50.01 a | (-26.7) | 68.15 b | 62.27 b | 1.874 | < 0.001 | |||
| EPA + DHA 7 | 0.67 | 0.46 | 0.49 | 0.52 | 0.59 | 0.028 | 0.119 |
AI = atherogenecity index; ALA = α-linolenic acid; ARA = arachidonic acid; DHA = docosahexanoic acid; DPA = Docosapentaenoic acid; EA = Erusic acid; EDA = eicosadienoic acid; EPA = eicosapentaenoic acid; ERA = eicosatrienoic acid; FLQ = fish lipid quality; HDA =hypogenoic acid; h/H = hypocholesterolaemic/ hypercholesterolaemic ratio; LA = linoleic acid; MUFA = monounsaturated fatty acids; n-3/n-6 PUFA = ratio of omega 3/omega 6 FA; OA = oleic acid; PA = palmitic acid; POA = palmitoleic acid; PUFA = polyunsaturated fatty acids; SA = Stearic acid; SDA = Stearidonic acid; SEM = Standard Error of the mean; SFA = saturated fatty acids; TI = thrombogenicity index ; UI = unsaturation index; Σ = Total.
Results are expressed as the mean ± S.D. The data are the means of 2 replicates of 3 fish per replicate (n = 6).
a-d Different letters on the same line show significant differences between fish fed 25 wk with the 5 different dietary combinaisons (One-Way ANOVA, P < 0.05). Where a dietary group showed significant difference in one type of FA or in a lipid nutritional quality indice in comparison with fish fed the FOFO based diet, the percentage of change compared to FOFO-fed fish is given in brackets in the adjacent column (Δ, %).
1 include fatty acids not listed (< 0.5% of total FA).
2 h/H = (C18:1 n-9 + Σ n-6 PUFA+ Σ n-3 PUFA)/(C12:0 + C14:0 + C16:0)
3 AI = (C12:0 + 4 x C14:0 + C16:0) / Σ unsaturated FA
4 TI = (C14:0 + C16:0 + C18:0) / [(0.5 x Σ MUFA) + (0.5 x Σ n-6 PUFA) + (3 x Σ n-3 PUFA) + (Σ n-3 PUFA / Σ n-6 PUFA)]
5 UI = 1 x (Σ monoenoic FA) + 2 x (Σ dienoic FA) + 3 x (Σ trienoic FA) + 4 x (Σ tetraenoic FA) + 5 x (Σ pentaenoic FA) + 6 x (Σ hexaenoic FA)
6 FLQ = 100 x (C22:6 n-3 + C20:5 n-3)/ Σ SFA
7 EPA+DHA is expressed as g/100g fillet.
The proportions of selected FA of the 3 experimental diets were compared to that of the fish fillets after 13 and 25 wk in Figure 1 and the FA metabolism pathways are visualized in Figure 2.
As revealed by the Proximate Component Analysis (PCA) presented in Figure 3A, the FA accounting for 77.8% of the differences in the FA profiles of the fish fed the experimental diets were mainly LA (18:2 n-6), ALA (18:3 n-3), OA (18:1 n-9), EPA (20:5 n-3) and DHA (22:6 n-3) on the horizontal axis, while levels of hypogeic acid (16:1 n-9), SDA (18:4 n-3) and ARA (20:4 n-6) discriminated the fish on the vertical axis. The quality indices of FA (Figure 3B) explained 95.9% of the differences between dietary treatments.
3.4. Histology
3.4.1. Liver Histology
At the end of the growth period (13 wk), a moderate degree of cytoplasmic vacuolization of the hepatocytes due to fat accumulation was observed in all liver sections, affecting the shape or the position of the nucleus (Figure 4A–C). The histological structure of 3 out of the 9 livers obtained from fish fed the AO diet showed a slightly better morphology (Figure 4B) than that of fish fed the FO diet (Figure 4A), while 3 out of 9 livers from fish fed the RO diet (Figure 4C) showed more fat accumulation than the other 2 groups. The bile ducts were normal and there was no evidence of inflammation in the pancreatic tissue in any of the dietary groups. At the end of the finishing period (25 wk), slightly higher fat accumulation was observed in the liver sections of the experimental groups that continued to be reared on FO, AO and especially RO diets (Figure 5A, B, C) compared to those observed after 13 wk (Figure 4). The experimental groups of fish reared first on the RO-based diet for 13 wk and then on either FO or AO diets for a further 12 wk, showed a tendency for partial tissue recovery in some areas of the liver tissue forming a mosaic pattern (Figure 5D & 5E) compared to fish fed RO diet for the entire 25 wk period (Figure 5C). This was particularly evident in fish reared on the AO finishing diet (Figure 5E).
3.4.2. Intestine Histology
After 13 wk of feeding the diets based on the different lipid sources, the morphology of the posterior part of the intestine examined microscopically showed no differences between the dietary groups (Figure 6A–C). Epithelial integrity without any sign of hypertrophy or hyperplasia was observed in 6 to 9 out of a total of 9 fish/diet. Enterocyte nuclei were located either at the base or mid-cell position and were accompanied by supranuclear vacuoles, normal in number and size. A small number of leukocytes and eosinophilic granulocytes were observed in the intestinal mucosa similarly in FO and AO diets (Figure 6α & β) and were slightly increased in group of fish reared on RO diet (Figure 6γ). At the end of the finishing period, when the groups of fish reared on RO diet were switched to either FO or AO diet for the last 12 wk of the trial, histological observation of the posterior intestine showed no differences between the groups (Figure 7 A, B, D, E). Fish continually fed with RO (RORO) (Figure 7C) continued to show slightly increased number of leucocytes and eosinophilic granulocytes as observed during the first period (Figure 6C).
3.5. Haematological and Immunological Parameters
Regarding the haematology and immunology parameters at the end of the trial, no significant difference was found among all the dietary treatments tested (P > 0.05, Table 8). Hemoglobin concentration was not affected by the dietary lipids (P = 0.932). On the one hand, lysozyme activity, which measures the antibacterial activity against a gram-positive bacterium, M. luteus, tended to be increased in fish fed the RO-based diet throughout the trial compared to fish fed the AO-based diet either throughout the trial or as a finsihing diet (P = 0.093). On the other hand, the antibacterial activity of the fish sera against a gram-negative bacterium (E. coli) tended to be increased in fish fed the AO-based diet for the entire trial compared to fish fed the FO-based diet (P = 0.050). This antibacterial activity was significantly increased in AOAO-fed fish and ROAO-fed fish compared to FOFO-fed fish when simple contrast analysis was performed (P < 0.05). The myeloperoxidase activity of serum showed no significant difference between dietary treatments (P = 0.860). Ceruloplasmin activity showed no significant differences between diets (P = 0.513), although fish response was elevated in all diets compared to fish fed FOFO, slightly less so in fish switched to FO or AO after 13 wk of RO feeding, but high inter-individual variation somewhat masked this effect. Alkaline phosphatase response followed the same pattern (P = 0.553).
Table 9.
Haematological & serum immunological parameters at the end of the finishing period (at 25 wk) in European sea bass fed 13 wk with the 3 different lipid sources (FO, AO, RO) and then for another 12 wk with either the same diet as before (FOFO, AOAO, RORO) or with the FO or AO finishing diets in fish fed RO for the first 13 wk (ROFO, ROAO).
| FOFO | AOAO | RORO | ROFO | ROAO | SEM | P-value | |
|---|---|---|---|---|---|---|---|
| Hemoglobin, g/dL | 14.17 | 15.49 | 16.33 | 15.01 | 16.64 | 0.817 | 0.932 |
| Lysozyme, U/mL | 600.93 | 526.47 | 654.38 | 582.67 | 543.61 | 17.393 | 0.093 |
| E. coli growth inhibition, % | 43.13 | 50.68# | 48.56 | 43.01 | 49.61# | 1.216 | 0.050 |
| E. coli killing capacity, % | 84.26 | 88.25 | 84.82 | 82.31 | 84.87 | 0.800 | 0.205 |
| Myeloperoxidase activity, OD | 0.17 | 0.11 | 0.16 | 0.15 | 0.15 | 0.014 | 0.860 |
| Ceruloplasmin activity, U/mL | 155.09 | 330.49 | 387.88 | 323.78 | 273.97 | 39.957 | 0.513 |
| Alkaline phosphatase, U/mL | 1.41 | 1.43 | 1.59 | 1.49 | 1.50 | 0.033 | 0.553 |
SEM= Standard Eroor of the Mean. # Hash signs show significant difference between the tested diet and FOFO (simple contrast analysis, P < 0.05). Results are represented as the the means of 2 replicates of 8 fishes per replicate (n = 16).
Figure 7.
Posterior intestine sections of fish fed continuously on A) FO diet (FOFO), B) AO diet (AOAO), C) RO diet (RORO) for 25 wk, or of fish fed RO for 13 wk and switched to D) FO diet (ROFO), or E) AO diet (ROAO) 13W after the start of the trial (10Χ).
Figure 7.
Posterior intestine sections of fish fed continuously on A) FO diet (FOFO), B) AO diet (AOAO), C) RO diet (RORO) for 25 wk, or of fish fed RO for 13 wk and switched to D) FO diet (ROFO), or E) AO diet (ROAO) 13W after the start of the trial (10Χ).


5. Discussion
Overfishing and exacerbating climate change severely impact wild fish stocks and thus drastically reduce the availability of FM and FO for inclusion in aquafeed [66]. As a result, commercial diets today tend to contain lower levels of FM and FO and higher levels of more sustainable nutrients. The present work is the first long-term nutritional study on European sea bass reaching marketable size, fed with RO in low-FM diets (17%) and focusing not only on finishing diets based on FO, but also on a mixture of EPA- and DHA-rich microalgae meals. The 3 experimental diets tested in the present study contained 15% of oils, of which 60% were FO and 40% RO in the FO control diet, 20% FO and 80% RO in the RO diet or 20% FO, 60% RO and 20% of oil from 2 microalgae meals in the AO diet. Such a high replacement of FO (66.67%) in European sea bass diets has previously been investigated in finishing studies (60% FO replacement) but in high FM diets (38-40%) [27,28,67]. Another 3 studies have also looked at the use of microalgae in finishing diets in fish but they either replaced none or very little dietary FO or the experimental diets were not balanced in lipids [50,51,52]. The experimental design of the present study fully addresses the issue of diminishing availability of marine ingredients for aquafeeds through either the direct partial replacement of FO by algal oil or the use of microalgae in finishing diet after long-term feeding fish with plant oil.
5.1. Fish Growth and Morphometrics
In the present study, fish growth was slower during the first 13 wk than during the final 12 wk-finishing period (lower SGR and higher FCR), probably because strong winds prevailing during the first period might have stressed the fish. High and medium levels of dietary RO (80% in RO diet and 60% in AO diet) did not significantly affect fish growth or feed utilization after 13 and 25 wk of feeding. Interestingly, at the end of the trial, the tendency for higher FCR (1.55) in fish fed RORO compared to control fish fed FOFO (1.51) was reduced in fish fed ROFO (1.44) and ROAO (1.51) underlining the efficacy of the finishing strategy. Other studies in European sea bass have investigated the effect of partial or total replacement of FO by different single or combinations of plant oils such as rapeseed oil, linseed oil, palm oil, olive oil, or algal oils on fish growth and feed efficiency [9,27,28,67,68,69]. Fish growth was reduced by replacing 60% of FO with RO for 34 wk in 75g fish [27] but not in 94g fish [28]. Concerning dietary microalgae, the growth of salmon was negatively affected by 15-20% of dietary Nannochloropsis oceanica for 12-28 wk [70,71]. On the contrary, 5-10% of dietary Nannochloropsis oculata for 7-8 wk improved the growth of Nile tilapia, Oreochromis niloticus [72,73] whereas dietary N. gaditana had no effect on fish growth in gilthead seabream [52], or in turbot [74]. In European sea bass, recent studies have shown no significant effect of dietary microalgae on fish growth through a meta-analysis of the use of Schizochytrium [75] or through the use of rapeseed oil, Schizochytrium algae oil (Veramaris) and a mixture of Nannochloropsis, Gracilaria and Schizochytrium (Algaessence) [69]. In the present study, fish fed AO tended to show a better FCR (1.48) than fish fed FO (1.51) throughout the trial but no statistical difference was evident. The absence of effect of the nature of dietary oils on fish growth suggested that the requirements of the fish were adequately covered by the basal FO inclusion in all formulated diets of the present study.
In general, whole-body lipid content is proportional to dietary lipid levels, and excess dietary lipid is deposited in the liver, viscera, muscle, and adipose tissue of fish [76,77] thus making indices such as hepatosomatic and viscerosomatic indices good indicators of fat deposition. At the end of the trial, after 25 wk feeding, hepatosomatic indices (HSI) were significantly decreased in AOAO-, ROFO- and ROAO-fed fish compared to RORO-fed fish, indicating a lower fat deposition in AO-fed fish and in fish fed both finishing diets suggesting that the finishing strategy may successfully mitigate the negative effects of long-term RO feeding. The significant increase in HSI in RO-fed fish in the present study was previously described in sea bass [67] and in RO-fed gilthead sea bream (Sparus aurata) [12]. Regarding VSI, it was not affected by 25 wk of RO feeding (RORO) but was significantly reduced in D. labrax fed RO for 13 wk followed by a FO- or AO-finishing diet for 12 wk (ROFO and ROAO respectively) compared to fish fed FO or RO throughout the trial (FOFO and RORO). Similarly, VSI was not affected in gilthead seabream [12] or in red hybrid tilapia, Oreochromis sp. [29] fed RO. Likewise, MFI was not significantly affected by dietary oil in these 2 fish species [12,29] or in European sea bass in the present study but tended to be decreased in fish fed ROFO compared with fish fed RORO and significantly so in fish fed ROAO. The reduced VSI and MFI, significantly or not, in fish switched to finishing diets compared to fish fed continuously with the same diet may suggest that the energy consumed to adapt to the dietary change may reduce the fat accumulation in and around their viscera.
5.2. Fish Fillet Proximate Composition
No significant differences were found in any of the nutrients analyzed in the fish fillets of the different dietary treatments except for the protein content of fish fillet at the end of the growth period which was higher in fish fed AO or RO compared to fish fed FO. After long-term feeding (25 wk), this difference was not significant anymore. However, the lipid accumulation in the liver of RORO-fed fish suggested previously by the increased HSI was further evoked by a tendency for increased lipids in their fillet compared to FOFO- and AOAO-fed fish after long-term feeding (25 wk). The finishing strategy with AO and especially with FO reduced this slight lipid accumulation observed in RORO-fed fish in the fillet. The lipid accumulation in the liver and fish fillet of RO-fed fish was also reversed by a finishing FO diet in rainbow trout [40].
5.3. Fish Fillet Fatty Acids Profile and Quality Indices
The present study on the partial replacement of dietary FO was based on 3 diets formulated to cover the basic FA requirements of European sea bass. This carnivorous marine fish has an extremely low/inexistent ability, compared to salmonids, to convert C18 precursors into long-chain PUFA and has therefore specific requirements for PUFA in its diet [8,14,17,18]. Diets were therefore formulated to include at least 3% of FO to cover the requirements of these FA for normal growth and development of marine fish [78]. Moreover, RO, rich in n-9 MUFA [20], was chosen over soybean oil, rich in n-6 FA, in order to avoid undesirable effects on the n-3/n-6 ratio [25].
In the present study, the fatty acid composition of the fish fillets was closely related to the dietary fatty acid input for most FA. As expected from the RO content in diets FO, AO and RO at 6, 9 and 12% respectively, a linear effect of dietary RO was obtained on FA rich in the RO diet while a quadratic effect was obtained on FA rich in the AO diet. However, small differences in FA of interest between dietary treatments after 13 wk feeding became significant after 25 wk feeding and suggest that tissue fatty acid profile does not in fact mirror dietary composition in a proportional manner. Instead a hierarchical pattern of fatty acid retention and utilisation was evident and can be visualised in Figure 1 and Figure 2. Discrepancies between the dietary FA profile and the FA composition of fish fillets suggest the intake of oleic acid (OA, 18:1 n-9), linoleic acid (LA, 18:2 n-6), and α-linolenic acid (ALA, 18:3 n-3), along with the selective deposition of specific FAs such as palmitic acid (PA, 16:0), stearic acid (SA, 18:0), palmitoleic acid (POA, 16:1 n-7), hypogenoic acid (HDA, 16:1 n-9), erusic acid (EA, 22:1 n-11), eicosadienoic acid (EDA, 20:2 n-6), docosapentaenoic acid (DPA, 22:5, n-3) and docosahexanoic acid (DHA,22:6 n-3). Indeed, the levels of OA in fish fed the RO diet for 25 wk was higher (34.40%) compared to the FO diet (28.78%), but not as much as expected from the percentage of dietary OA (43.34% in diet RO, 31.60% in diet FO), suggesting the utilization of this FA for energy purposes. Similar to the findings of Mourente and colleagues [28], the tendency for increased levels of MUFA (P = 0.063) and n-6 PUFA (P = 0.146) (mainly OA and LA, respectively) in fish fed the RO diet for 13 wk compared to FO-fed fish became highly significant after 25 wk of feeding (P < 0.001) in the present study. Diets AO and especially RO, typically rich in LA and ALA, were only translated into significant increase in these PUFA in fish fillets after 25 wk (not after 13 wk), but not as strongly as dietary levels would have implied. In the present study, LA exhibited greater proportional incorporation into tissue lipids than ALA, suggesting moderate deposition with limited selective conservation of LA, while ALA consistently showing low retention relative to dietary supply, was preferentially utilized through β-oxidation rather than deposited in muscles [28]. The modest increase of tissue LA and ALA from 13 to 25 wk feeding suggested that the tissue may be approaching a regulated equilibrium where additional ALA is increasingly diverted to metabolism rather than deposition in muscle lipids. Fish fed the low-ARA RO diet initially maintained elevated tissue ARA levels, indicating selective conservation and likely recycling from membrane phospholipid pools as ARA is an indispensable precursor of eicosanoids [79]. Over prolonged feeding however, tissue ARA partially declined toward a lower steady state, suggesting dietary deficiency. This temporal pattern indicating an initial phase of rapid incorporation followed by a slower equilibration phase between 13 and 25 wk was also noticed in the case of PA, SDA and EA.
Concerning DHA, levels in the fillets of RO-fed fish were much higher than dietary levels (almost double), suggesting that this PUFA is not only strongly conserved and selectively retained, it is maintained above dietary concentrations and protected from oxidation. This was also true of the fish fed the diets richer in DHA (FO and AO) and underlines that muscle lipid composition is physiologically regulated rather than simply mirroring diet. The fact that DHA was strongly conserved across diets and feeding durations, often exceeding dietary levels or remaining within a narrow physiological range, is probably due to its role as a structural membrane lipid. The selective deposition of DHA was also observed in other studies in European sea bass [27,67], in gilthead sea bream [12] and many other fish species [20,28,29,31,80,81], and reviewed recently by Xu and colleagues [65]. Fish are net producers of DHA whether through de novo synthesis in low trophic species or selective deposition in marine or high-trophic species [65]. This strong selective deposition of DHA was also obtained for another LC-PUFA, DPA, and for one of the intermediates between LA and ARA, the EDA, suggesting their incorporation into muscle phospholipids and cellular membrane. In the FA biosynthesis pathway, EPA may have an intermediate role between DHA and ALA, reflecting dietary supply while still buffering low dietary intake, suggesting a regulated partitioning between structural (membrane) and metabolic (eicosanoids precursor, partial oxidation) use. The presence of dietary EPA is suggested to reduce the deposition of ARA in many fish species [65]. EPA is also suggested to be elongated into PUFA such as DHA in freshwater or low-trophic species, but it is either β-oxidated for energy production or incorporated into cellular membranes or muscle for marine or high-trophic species, such as European sea bass [65]. A dose of retro-conversion of DHA into DPA, through peroxisomal β-oxidation may also be involved [65,82] and would support the high levels of deposition of DPA. Interestingly, many studies have consistently reported that an adequate supply of OA (18:1 n-9, high in RO diet), which is a primary substrate FA for triglycerides synthesis typically used for energy mobilisation, could spare the PUFA from being β-oxidized for energy production [65]. This could explain the deposition of EPA and DHA in fish fed RO, slight for EPA and strong concerning DHA. Xu and colleagues [65] have also suggested that when supplied in excess, DHA and EPA are oxidised for energy production and this could have been the case of EPA in the FO diet as fish fed this diet showed slighty decreased levels of EPA compared to dietary levels.
Overall, the fatty acid profiles of European sea bass reflected a hierarchical regulation of lipid metabolism. Collectively, these findings demonstrate that this marine fish species regulates fatty acid composition through selective retention rather than passive incorporation, with a clear priorisation of long-chain highly unsaturated FA, especially EA, EDA, DPA, and DHA over C18 precursors (OA, LA, ALA) mainly used for energy [65]. Intermediate FA such as SDA, ARA and EPA are maintained through metabolic partitioning between selective retention and utilization.
The investigation on the efficacy of both finishing diets ROFO and ROAO has shown that the reductions of ARA, EPA and DHA in RO fed fish (-32.4, -31.0 and -38.0%, respectively) compared to FO fed fish for 25 wk were successfully almost completely reversed (-2.9, -7.1 and -5.0%, respectively) when fish were fed the FO diet for the last 12 wk of the trial. Feeding the 13 wk-RO fed fish with the ARA-rich AO diet for the last 12 wk only partly reversed EPA and DHA to reductions levels of 16.7 and 16.5%, respectively but totally restored and even exceeded ARA levels found in FO-fed fish (+20.6%). Other studies in Mediterranean fish, European sea bass [27,28,67], gilthead seabream [12,21,25,83,84], red seabream, Pagrus auratus [24], or Mediterranean yellowtail, Seriola dumerili [22], showed partial to complete recovery of DHA and ARA, while EPA was often only partially recovered.
From a human nutritional perspective, 7 indices have been calculated from the FA profile to assess the nutritional quality of the lipid fraction of the fish fillets. High levels of n-3 PUFA in fish fillets are desirable due to their health benefits, including a cardioprotective effects, improved immune function, mental and metabolic health [85,86]. The Recommended Daily Intake (RDI) of EPA + DHA is estimated at 0.25 g per day for healthy individuals [87]. Despite the observed changes in fish fillet FA composition, the EPA + DHA levels at the end of the growth period of fish fed the AO or RO diets were slightly reduced compared to those of fish fed the FO control diet but were still much higher than the RDI. The finishing process with the FO or AO diets for 12 wk after the previous 13 wk of feeding with the RO diet increased the amount of EPA + DHA making these fillets better than RO-fed fish in terms of nutritional value of the end products. The n-3/n-6 ratios obtained in the present study were close to those obtained by Montero and colleagues [27] when 60% of the FO was replaced by RO. The 35.7% reduction in the n-3/n-6 ratio of the RO group was fully restored when fish were fed an FO-based diet for 12 wk prior to commercialization, but a switch to a microalgae-based diet only mitigated the reduction to 21.4%. The recovery of the n-3/n-6 ratio by a finishing FO diet was also shown in S. dumerili [22]. Another important index is the Unsaturation Index (UI), with high values reflecting the ability of fish to maintain membrane fluidity at relatively low temperatures [55]; while the Fish Lipid Quality (FLQ), a quality index designed specifically for fish, focuses on DHA and EPA in relation to SFA. Both these PUFA are very important for human brain function and reduce the risk of cardiovascular disease and dementia [85,86,88]. Previous studies have reported the FLQ indices ranging from 1.3 to 36 in different fish species [55,89]. In the present study, it was particularly high, ranging from 50 in RO-fed fish to 69 in FO- and AO-fed fish, making them a particularly healthy choice for human consumption. As expected, both UI and FLQ were lower in fish fed with the RO diet for 25 wk compared to the FO and AO diet groups but were completely reversed in RO-fed fish after the 12-wk finishing process whether performed with FO or AO. Three supplementary FA quality indices related to human health cardioprotection were calculated namely the Hypocholesterolaemic / hypercholesterolaemic (h/H) ratio, the atherogenicity (AI) and the thrombogenicity indices (TI). These indices focus on the ratio of SFA (favouring lipid adhesion to circulating and immune cells) and unsaturated FA (inhibiting plaque accumulation and reducing the levels of phospholipids, cholesterol and esterified fatty acids) [55,56]. Low AI and TI values reflect food products with strong cardiovascular protection whereas high h/H ratio reflects a good lipid quality [55]. Low levels of SFA, principally 16:0, were obtained in fish fed the AO and RO diets for 13 wk compared to fish fed the FO diet (-4.7 and -6.2%, respectively) and even more so after 25 wk (-8.2 and -13.1%, respectively). These results were not surprising as fat of animal origin contains higher levels of SFA compared to those extracted from plants. Reduction in SFA was also observed in sea bass fed plant oils [28] and in gilthead seabream fed microalgae [49]. As expected, the switch from RO to FO or AO diets resulted in less pronounced SFA reduction after 25 wk (-5.9 and -8.6%, respectively). Thus, fish fed the AO diet and even more so the RO diet showed significantly higher h/H and lower AI than fish fed the FO diet while finishing diets brought fish fillets to intermediate levels of these two indices. The same was true for Mediterranean yellowtail [22]. However, it should be noted that fish fed the FO diet in the present study had a h/H of 3.59 towards the high end of the normal range obtained in fish species (0.21- 4.83) [55,89] and an AI of 0.23, not as good as that of RO-fed fish (0.18) but which can still be considered as “healthy” compared to foods high in saturated fat such as meat (AI up to 1.32) or dairy products (AI ranging from 1.42 to 5.13) [55]. TI values were comparable in the experimental groups examined herein (0.23-0.25), but also in Mediterranean yellowtail white muscle (0.23) [22] and in many other marine fish species [90], and was within the recommended values for human health (<1.0) [91,92]. In comparison, TI ranged from 0.19 to 0.63 in juvenile sea bass fed with increasing amounts of animal fat [93].
The principal component analysis has been shown to be a useful tool for understanding complex data such as fatty acids [94,95]. It was therefore used in the present study to better understand and visualize the effect of the fish diets on the fatty acids or quality indices of the fish fillets. This analysis showed that the FA profile of FO-fed fish was mostly defined by their richness in 16:00, EPA, DPA, DHA and 16:1 n-7, while RO-fed fish were skewed towards OA, LA, ALA, and 18:3 n-6, 20:1 n-9 and 22:1 n-9. AO-fed fish showed a FA profile mainly defined as ARA- rich. The finishing diet ROAO recentered the FA profile towards the profile of RO-fed fish while ROFO skewed the FA profile more stronlgy towards that of FO-fed fish rich in DHA, DPA and EPA. Taking into account all the FA showing significant differences between the diets, 77.8% of the differences among diets were explained, while significantly different quality indices, i.e., all indices except for TI, explained 95.9% of these differences in the FA profile of the fish fillets. FOFO-fed fish were skewed towards high AI and SFA mainly due to high levels of EPA, DHA and their intermediate docosapentaenoic acid (DPA, 22:5 n-3), while RORO-fed fish were more determined by n-9 MUFA (mainly due to high OA) and n-3 and n-6 PUFA (mainly due to high ALA and LA). AOAO-fed fish showed an intermediate position between FOFO- and RORO-fed fish with high levels of ARA. ROAO- and even more so ROFO-fed fish were skewed from the RORO position towards the position of FOFO-fed fish. This clearly shows the efficacy of the finishing strategy with AO and especially with FO to mitigate the effects of long-term feeding of the fish with RO and to restore the FA profile of the fish fillet close to that of fish fully fed with FO. A longer finishing period may have allowed full recovery of the healthy FA profile.
5.4. Fish Liver and Intestine Histology
The slightly more pronounced accumulation of lipid droplets in the livers of fish fed the RO diet suggests a direct effect of dietary lipid on lipid metabolism, probably mainly due to the abundance of OA leading to excessive fat storage in these fish. Liver steatosis has also been observed in sea bass fed 60% RO [28], in gilthead sea bream fed RO [12], and in Nile tilapia, Oreochromis niloticus fed 5 or 10% of Nannochloropsis oculata for 7 wk [72]. The present study with 7% of Nannochloropsis sp. and 3% of Schizochytrium sp. did not show such steatosis. On the contrary, it seemed to reduce vacuolation of fish hepatocytes compared to fish fed with RO. The finishing process with FO and especially with AO allowed a partial tissue recovery of the liver of fish fed the RO diet (mosaic pattern). As observed from the HSI and VSI results described above, the liver and viscera of fish fed the FO or AO diets for 12 wk after 13 wk of feeding the RO diet were lighter than those of fish fed RO throughout the trial. Thus, dietary RO-induced fat accumulation in the liver and intestine of fish was therefore avoided by the finishing strategy using AO or FO-based diets. This reduced fat accumulation in the organs of fish fed FO and AO compared to RO suggests a better lipid metabolism of FO and AO compared to RO in European sea bass.
Regarding the distal intestinal histology, a slight leukocyte infiltration was observed in RO-fed fish compared to FO-fed and AO-fed fish in the present study and in the long-term finishing study with FO [28]. However, there was no difference at the end of the 25-wk trial. In general, the histological status of the distal intestine showed a healthy picture of the experimental fish. The slight differences between dietary treatments may have been due to the rich oleic acid content of the RO diet. This FA has been linked to antioxidant defense mechanisms at the intestinal level of European sea bass [96].
5.5. Fish Haematological and Immune Parameters
The role of long-chain n-3 PUFA (EPA and DHA) in human and animal health has been shown to involve multiple modes of action: i. they compete with ARA, thereby reducing the production of pro-inflammatory and immunomodulatory eicosanoids; ii. they are precursors of specialized pro-resolving mediators involved in the resolution of inflammation; iii. they bind directly to cellular and nuclear receptors, affecting signalling pathways, cellular differentiation and gene expression; iv. they alter the fluidity and physical properties of the cellular membranes, affecting membrane-bound enzymes, receptors and ion channels. These 4 modes of action are redundant mechanisms that strongly influence inflammatory and immunomodulatory responses [97,98,99]. Nevertheless, despite the differences in the FA profile of the 3 diets, no significant effect was detected in any of the hematological or immunological parameters tested at the end of the present trial (25 wk) suggesting that all 3 diets met the requirements of the fish for optimal immunity. Similarly, in seabream, 5 and 10% Nannochloropsis for 2-4 wk did not show significant differences in any of the innate immune parameters tested (respiratory burst activity, phagocytosis or complement hemolytic activity) [100]. The lack of effect of dietary oils on hematological parameters (hematocrit and hemoglobin concentration) was also observed in another Mediterranean fish species, gilthead seabream fed RO for 29 wk and in Atlantic salmon [101. The effect of dietary lipids on the respiratory burst activity is highly variable in animals [97]. In fish also, as exemplified in the present study by the absence of effects of dietary lipids on myeloperoxidase activity, while a reduction of respiratory burst activity was observed in gilthead seabream and European sea bass fed RO [28,101]. Dietary plant oils were associated with reduced phagocytosis activity in several fish species [102,103]. This was temperature dependent in Atlantic salmon and a direct correlation between temperature, the degree of unsaturation of the FA content of the plasma membrane, and thus the membrane fluidity may explain variations of the phagocytosis in fish [104]. Ceruloplasmin activity, an acute phase protein considered a marker of fish inflammatory response, although not significantly affected by the dietary lipids, showed higher means in all dietary groups compared to fish fed the FO-based diet throughout the trial. Similarly, a reduction in dietary long-chain PUFA (DHA and EPA) tended to increase gene expression of pro-inflammatory cytokines in gilthead sea bream [105]. Also, a study using 5 and 10% of the microalga N. oculata showed an inflammatory response in tilapia [72].
Regarding the antibacterial activity of fish, feeding Atlantic salmon or European sea bass with RO-based diets had no significant effect on lysozyme antibacterial activity or complement hemolytic activity [28,106]. Similarly, lysozyme activity, which measures the antibacterial activity against a gram-positive bacterium, tended to be elevated in fish fed the RO-based diet throughout the trial compared to fish fed the AO-based diet either for the entire trial or just for the last 12 wk, but there was no significant difference between the dietary treatments. The complement activity determined in the present study, assesses the antibacterial activity of the fish sera against a gram-negative bacterium (E. coli) rather than the hemolytic activity assessed in the previously mentioned studies [28,106]. This activity tended to be increased in fish fed the AO-based diet throughout the trial or only during the last 12 wk compared to fish fed the FO-based control diet, and the differences were significant when simple contrast analysis was performed to compare each diet with the control FO-based diet. The immunostimulatory activity of microalgae may be related to various bioactive compounds such as polysaccharides [107,108]. Atlantic salmon fed a diet containing 5% of Nannochloropsis gaditana and 5% of Schizochytrium spp. for 30 d showed a slight immunostimulation [109]. Dietary inclusion of 8% Nannochloropsis reduced the diversity of the sea bass microbiota, thus expected to affect the fish immune system [110]. However, it may have favoured beneficial bacteria over potential pathogens. A low dietary dose (0.01-0.08%) of a mixture of microalgae (Chlorella vulgaris, Euglena viridis and Spirulina platensis) also improved serum immune parameters (respiratory burst and myeloperoxidase, lysozyme and serum bactericidal activity, ceruloplasmin and trypsin inhibition, with a maximal increase after 2 wk of feeding) and survival rates of Labeo rohita after a challenge with Aeromonas hydrophila [111] motivating the inclusion of microalgae in functional aquafeed.
6. Conclusions
In conclusion, although long-term feeding dietary lipids had little effects on fish growth, feed efficiency, fish fillet proximate composition or fish health, the use of finishing diets had a significant effect on morphometric indices, FA fillet profile and liver histology and thus on fish quality. The dietary inclusion of rapeseed oil reduced total SFA and n-3 PUFA, especially EPA, DPA and DHA, and increased MUFA especially OA, and n-6 PUFA, especially LA in the fish fillet compared to fish fed microalgae or fish oil, reflecting the composition of the diet to a certain extent. However, the discrepancies between dietary and fish fillet FA levels demonstrated a clear hierarchical regulation of lipid deposition and metabolism rather than a direct reflection of dietary intake. Docosahexaenoic acid (DHA) was strongly conserved and preferentially deposited in tissue lipids across diets and feeding durations, frequently exceeding dietary levels or remaining within a narrow physiological range, while arachidonic acid (ARA) showed a similar but less pronounced pattern, consistent with tight homeostatic control linked to their essential roles in membrane structure and cellular signaling. Eicosapentaenoic acid (EPA) exhibited intermediate behaviour, with partial dietary dependence but clear buffering under low dietary supply, indicating regulated deposition alongside metabolic utilisation rather than a biosynthetic capacity, absent or extremely low in European sea bass. In contrast, linoleic acid (LA) showed a weaker and attenuated response to dietary variation, reflecting moderate deposition with limited selective conservation. Alpha-linolenic acid (ALA) was poorly retained, consistent with preferential catabolism. Overall, tissue fatty acid profiles were governed by differential deposition efficiency, and metabolic prioritisation, with long-chain HUFA preferentially incorporated into structural lipid pools. A 12-wk finishing period with the FO-based diet, before the fish reached commercial size, was sufficient to restore most of the fatty acid profile of the fish fed a plant oil-based diet for 13 wk. The microalgae-based diet, which may allow aquaculture professionals to reduce their reliance on FO and thereby reduce the pressure on wild fish stocks, allowed partial recovery of the FA profile. With the future expected decreasing availability of FO and decreasing prices of AO, the latter may become a good alternative to FO. Rapeseed oil was also a good alternative to FO as fish growth was not significantly affected, and a 12-wk finishing period with FO could restore the typical healthy FA profile of fish continuously fed with FO, thus substantially reducing the total amount of FO required over the full production cycle.
Author Contributions
Conceptualization, M.H., E.F. and I.T.K.; methodology, M.H., E.F. and I.T.K.; validation, M.H..; formal analysis, M.H., E.F., M.M., C.N., D.K., P.C., E.T., M.C.; investigation, M.H., E.F., M.M., A.V., C.N., D.K., P.C., E.T., M.C.; resources, M.H.; data curation, M.H., E.F., M.M., A.V., C.N., D.K.; writing—original draft preparation, M.H.; writing—review and editing, M.H., E.F., M.M., A.V., C.N., D.K., P.C., E.T., M.C. and I.T.K.; visualization, M.H., E.F.., E.T., M.C.; supervision, M.H.; project administration, M.H. and I.T.K.; funding acquisition, M.H., E.F. and I.T.K. All authors have read and agreed to the published version of the manuscript.
Funding
This research was part of the project FInAl (http://final.uth.gr; MIS 5045804—grant number T6YBP-00076), co-funded by the EU and the Greek General Secretariat for Research & Innovation (GSRI) through the Entrepreneurship and Innovation Operational Programme “Competitiveness-Enterprise-Innovation” (EPAnEK 2014-2020), approved by the European Commission (10162 final EU Decision of 18/12/2014) in the framework of the Special Actions “Aquaculture, industrial materials, open innovation in culture.
Institutional Review Board Statement
All experiments involving fish were conducted in accordance with EU guidelines on the protection of animals used for scientific purposes (Directive 2010/63/EU) approved by the Greek presidential decree (ΠΔ 56/2013). The Hellenic Centre for Marine Research (HCMR) rearing facilities are licensed by the Greek authorities (EL91-BIOexp-04). The experiment was designed in accordance with the Ethics Committee of the region of Crete, Greece (protocol 255340) and with the ARRIVE guidelines, and supervized by a scientist (M.M.) accredited by the Federation for Laboratory Animal Science Associations (FELASA, functions A-D).
Informed Consent Statement
Not applicable.
Data Availability Statement
The original data presented in this study are included in the article. Further inquiries can be directed to the corresponding author.
Acknowledgments
During the preparation of this manuscript, the authors used ChatGPT for the purposes of improving language and readability. The authors have reviewed and edited the output and take full responsibility for the content of this publication.
Conflicts of Interest
The authors declare no conflicts of interest. The public funding source had no role in the design of the study; in the collection, analyses, or interpretation of data; in the writing of the manuscript; or in the decision to publish the results.
Abbreviations
The following abbreviations are used in this manuscript:
| ADF | Acid Detergent Fiber |
| AI | Atherogenic index |
| ALA | α-linolenic acid |
| ARA | Arachidonic acid |
| AO | Algal oil |
| BW | Body weight |
| CF | Crude Fiber |
| CP | Crude protein |
| DFI | Daily Feed Intak |
| DHA | Docosahexaenoic acid |
| EA | Erusic acid |
| EDA | Eicosadienoic acid |
| EE | Ether extract |
| EPA | Eicosapentaenoic acid |
| ERA | Eicosatrienoic acid |
| FA | Fatty acids |
| FCR | Feed Conversion Ratio |
| FLQ | Fish lipid quality |
| FM | Fishmeal |
| FO | Fish oil |
| HDA | hypogenoic acid |
| h/H | Hypocholesterolaemic / hypercholesterolaemic ratio |
| HSI | Hepato Somatic Index |
| LA | Linoleic acid |
| LC-PUFA | long-chain polyunsaturated fatty acids |
| MFI | Mesenteric fat index |
| MUFA | Monounsaturated fatty acids |
| NDF | Neutral Detergent Fiber |
| NFE | Nitrogen-Free extract |
| OA | Oleic acid |
| OM | Organic Matter |
| PA | Palmitic acid |
| POA | Palmitoleic aid |
| PUFA | Polyunsaturated fatty acids |
| RO | Rapeseed oil |
| SA | Stearic acid |
| SDA | Stearidonic acid |
| SGR | Specific Growth Rate |
| SFA | Saturated fatty acids |
| TI | Thrombogenic index |
| UI | Unsaturation index |
| VSI | Viscero Somatic Index |
| WG | Weight Gain |
| Wf | Final weight |
| Wi | Initial weight |
| wk | weeks |
References
- FAO The State of World Fisheries and Aquaculture 2022. Towards Blue Transformation; FAO, 2022.
- Qian, Y.F.; Wang, J.X.; Qiao, F.; Luo, Y.; Chen, L.Q.; Zhang, M.L.; Du, Z.Y. Modelling the Impact of Replacing Fish Oil with Plant Oils: A Meta-Analysis to Match the Optimal Plant Oil for Major Cultured Fish. Rev. Aquac. 2024, 1–28. [Google Scholar] [CrossRef]
- Qian, Y.F.; Limbu, S.M.; Qiao, F.; Luo, Y.; Chen, L.Q.; Zhang, M.L.; Du, Z.Y. Seeking the Best Alternatives: A Systematic Review and Meta-Analysis on Replacing Fishmeal with Plant Protein Sources in Carnivorous Fish Species. Rev. Aquac. 2024, 16, 1099–1126. [Google Scholar] [CrossRef]
- Naylor, R.L.; Hardy, R.W.; Buschmann, A.H.; Bush, S.R.; Cao, L.; Klinger, D.H.; Little, D.C.; Lubchenco, J.; Shumway, S.E.; Troell, M. A 20-Year Retrospective Review of Global Aquaculture. Nature 2021, 591, 551–563. [Google Scholar] [CrossRef] [PubMed]
- Willer, D.F.; Newton, R.; Malcorps, W.; Kok, B.; Little, D.; Lofstedt, A.; de Roos, B.; Robinson, J.P.W. Wild Fish Consumption Can Balance Nutrient Retention in Farmed Fish. Nat. Food 2024, 5, 221–229. [Google Scholar] [CrossRef]
- Henry, M.; Gasco, L.; Piccolo, G.; Fountoulaki, E. Review on the Use of Insects in the Diet of Farmed Fish: Past and Future. Anim. Feed Sci. Technol. 2015, 203, 1–22. [Google Scholar] [CrossRef]
- Serra, V.; Pastorelli, G.; Tedesco, D.E.A.; Turin, L.; Guerrini, A. Alternative Protein Sources in Aquafeed: Current Scenario and Future Perspectives. Vet. Anim. Sci. 2024, 25. [Google Scholar] [CrossRef] [PubMed]
- Betancor, M.B.; MacEwan, A.; Sprague, M.; Gong, X.; Montero, D.; Han, L.; Napier, J.A.; Norambuena, F.; Izquierdo, M.; Tocher, D.R. Oil from Transgenic Camelina Sativa as a Source of EPA and DHA in Feed for European Sea Bass (Dicentrarchus Labrax L.). Aquaculture 2021, 530. [Google Scholar] [CrossRef]
- Castro, P.L.; Torrecillas, S.; Montero, D.; Izquierdo, M.S.; Ginés, R. Effect of Combined Fishmeal and Fish Oil Replacement on Growth Performance, Flesh Quality and Shelf Life of European Sea Bass (Dicentrarchus Labrax). Aquaculture 2022, 560. [Google Scholar] [CrossRef]
- Castro, C.; Peréz-Jiménez, A.; Coutinho, F.; Díaz-Rosales, P.; Serra, C.A.D.R.; Panserat, S.; Corraze, G.; Peres, H.; Oliva-Teles, A. Dietary Carbohydrate and Lipid Sources Affect Differently the Oxidative Status of European Sea Bass (Dicentrarchus Labrax) Juveniles. Br. J. Nutr. 2015, 114, 1584–1593. [Google Scholar] [CrossRef] [PubMed]
- Castro, C.; Couto, A.; Pérez-Jiménez, A.; Serra, C.R.; Díaz-Rosales, P.; Fernandes, R.; Corraze, G.; Panserat, S.; Oliva-Teles, A. Effects of Fish Oil Replacement by Vegetable Oil Blend on Digestive Enzymes and Tissue Histomorphology of European Sea Bass (Dicentrarchus Labrax) Juveniles. Fish. Physiol. Biochem. 2016, 42, 203–217. [Google Scholar] [CrossRef]
- Fountoulaki, E.; Vasilaki, A.; Hurtado, R.; Grigorakis, K.; Karacostas, I.; Nengas, I.; Rigos, G.; Kotzamanis, Y.; Venou, B.; Alexis, M.N. Fish Oil Substitution by Vegetable Oils in Commercial Diets for Gilthead Sea Bream (Sparus Aurata L.); Effects on Growth Performance, Flesh Quality and Fillet Fatty Acid Profile. Recovery of Fatty Acid Profiles by a Fish Oil Finishing Diet under Fluctuating Water Temperatures. Aquaculture 2009, 289, 317–326. [Google Scholar] [CrossRef]
- Özşahinoğlu, I.; Eroldoğan, T.; Mumoğullarında, P.; Dikel, S.; Engin, K.; Yılmaz, A.H.; Arslan, M.; Sirkecioğlu, A.N. Partial Replacement of Fish Oil with Vegetable Oils in Diets for European Seabass (Dicentrarchus Labrax): Effects On Growth Performance and Fatty Acids Profile. Turk. J. Fish. Aquat. Sci. 2013, 13, 819–825. [Google Scholar] [CrossRef]
- Torrecillas, S.; Robaina, L.; Caballero, M.J.; Montero, D.; Calandra, G.; Mompel, D.; Karalazos, V.; Kaushik, S.; Izquierdo, M.S. Combined Replacement of Fishmeal and Fish Oil in European Sea Bass (Dicentrarchus Labrax): Production Performance, Tissue Composition and Liver Morphology. Aquaculture 2017, 474, 101–112. [Google Scholar] [CrossRef]
- Verge-Mèrida, G.; Barroeta, A.C.; Ferrer, C.; Serrano, T.; Guardiola, F.; Soler, M.D.; Sala, R. Olive Pomace and Soybean-Sunflower Acid Oils as Alternative Fat Sources in European Seabass (Dicentrarchus Labrax) Diets: Effects on Performance, Digestibility and Flesh Fatty Acid Composition and Quality Parameters. Animals 2022, 12. [Google Scholar] [CrossRef]
- Wassef, E.A.; Wahbi, O.M.; Saqr, E.M.; Saleh, N.E. Response of European Seabass (Dicentrarchus Labrax) to Canola Oil Diets: Effect on Growth Performance, Fish Health and Liver and Intestine Histomorphology. Aquac. Int. 2016, 24, 1073–1088. [Google Scholar] [CrossRef]
- Tocher, D.R.; Betancor, M.B.; Sprague, M.; Olsen, R.E.; Napier, J.A. Omega-3 Long-Chain Polyunsaturated Fatty Acids, EPA and DHA: Bridging the Gap between Supply and Demand. Nutrients 2019, 11. [Google Scholar] [CrossRef]
- Geay, F.; Zambonino-Infante, J.; Reinhardt, R.; Kuhl, H.; Santigosa, E.; Cahu, C.; Mazurais, D. Characteristics of Fads2 Gene Expression and Putative Promoter in European Sea Bass (Dicentrarchus Labrax): Comparison with Salmonid Species and Analysis of CpG Methylation. Mar. Genom. 2012, 5, 7–13. [Google Scholar] [CrossRef]
- Bélanger-Lamonde, A.; Sarker, P.K.; Ayotte, P.; Bailey, J.L.; Bureau, D.P.; Chouinard, P.Y.; Dewailly, É.; Leblanc, A.; Weber, J.P.; Vandenberg, G.W. Algal and Vegetable Oils as Sustainable Fish Oil Substitutes in Rainbow Trout Diets: An Approach to Reduce Contaminant Exposure. J. Food Qual. 2018, 2018. [Google Scholar] [CrossRef]
- Bell, J.G.; McGhee, F.; Campbell, P.J.; Sargent, J.R. Rapeseed Oil as an Alternative to Marine Fish Oil in Diets of Post-Smolt Atlantic Salmon (Salmo Salar): Changes in Flesh Fatty Acid Composition and Effectiveness of Subsequent Fish Oil ‘”Wash Out. Aquaculture 2003, 218, 515–528. [Google Scholar] [CrossRef]
- Benedito-Palos, L.; Navarro, J.C.; Bermejo-Nogales, A.; Saera-Vila, A.; Kaushik, S.; Pérez-Sánchez, J. The Time Course of Fish Oil Wash-out Follows a Simple Dilution Model in Gilthead Sea Bream (Sparus Aurata L.) Fed Graded Levels of Vegetable Oils. Aquaculture 2009, 288, 98–105. [Google Scholar] [CrossRef]
- Bordignon, F.; Martínez-Llorens, S.; Trocino, A.; Jover-Cerdá, M.; Tomás-Vidal, A. Recovery of Fatty Acid Composition in Mediterranean Yellowtail (Seriola Dumerili, Risso 1810) Fed a Fish-Oil Finishing Diet. Int. J. Mol. Sci. 2020, 21, 1–17. [Google Scholar] [CrossRef]
- Codabaccus, M.B.; Bridle, A.R.; Nichols, P.D.; Carter, C.G. Restoration of Fillet N-3 Long-Chain Polyunsaturated Fatty Acid Is Improved by a Modified Fish Oil Finishing Diet Strategy for Atlantic Salmon (Salmo Salar L.) Smolts Fed Palm Fatty Acid Distillate. J. Agric. Food Chem. 2012, 60, 458–466. [Google Scholar] [CrossRef]
- Glencross, B.D.; Hawkins, W.E.; Curnow, J.G.; Glencross, B.D. Restoration of the Fatty Acid Composition of Red Seabream (Pagrus Auratus) Using a Fish Oil Finishing Diet after Grow-out on Plant Oil Based Diets. Aquac. Nutr. 2003, 9, 409–418. [Google Scholar] [CrossRef]
- Izquierdo, M.S.; Montero, D.; Robaina, L.; Caballero, M.J.; Rosenlund, G.; Ginés, R. Alterations in Fillet Fatty Acid Profile and Flesh Quality in Gilthead Seabream (Sparus Aurata) Fed Vegetable Oils for a Long Term Period. Recovery of Fatty Acid Profiles by Fish Oil Feeding. Aquaculture 2005, 250, 431–444. [Google Scholar] [CrossRef]
- Karanth, S.; Sharma, P.; Pal, A.K.; Venkateshwarlu, G. Effect of Different Vegetable Oils on Growth and Fatty Acid Profile of Rohu (Labeo Rohita, Hamilton); Evaluation of a Return Fish Oil Diet to Restore Human Cardio-Protective Fatty Acids. Asian-Aust.J.Anim.Sci. 2009, 22, 565–575. [Google Scholar]
- Montero, D.; Robaina, L.; Caballero, M.J.; Ginés, R.; Izquierdo, M.S. Growth, Feed Utilization and Flesh Quality of European Sea Bass (Dicentrarchus Labrax) Fed Diets Containing Vegetable Oils: A Time-Course Study on the Effect of a Re-Feeding Period with a 100% Fish Oil Diet. Aquaculture 2005, 248, 121–134. [Google Scholar] [CrossRef]
- Mourente, G.; Good, J.E.; Bell, J.G. Partial Substitution of Fish Oil with Rapeseed, Linseed and Olive Oils in Diets for European Sea Bass (Dicentrarchus Labrax L.): Effects on Flesh Fatty Acid Composition, Plasma Prostaglandins E2 and F2α, Immune Function and Effectiveness of a Fish Oil Finishing Diet. Aquac. Nutr. 2005, 11, 25–40. [Google Scholar] [CrossRef]
- Ng, W.K.; Chong, C.Y.; Wang, Y.; Romano, N. Effects of Dietary Fish and Vegetable Oils on the Growth, Tissue Fatty Acid Composition, Oxidative Stability and Vitamin E Content of Red Hybrid Tilapia and Efficacy of Using Fish Oil Finishing Diets. Aquaculture 2013, 372–375, 97–110. [Google Scholar] [CrossRef]
- Palmeri, G.; Turchini, G.M.; De Silva, S.S. Short-Term Food Deprivation Does Not Improve the Efficacy of a Fish Oil Finishing Strategy in Murray Cod. Aquac. Nutr. 2009, 15, 657–666. [Google Scholar] [CrossRef]
- Regost, C.; Arzel, J.; Robin, J.; Rosenlund, G.; Kaushik, S.J. Total Replacement of Fish Oil by Soybean or Linseed Oil with a Return to Fish Oil in Turbot (Psetta Maxima) 1. Growth Performance, Flesh Fatty Acid Profile, and Lipid Metabolism. Aquaculture 2003, 217, 465–482. [Google Scholar]
- Reis, B.; Cabral, E.M.; Fernandes, T.J.R.; Castro-Cunha, M.; Oliveira, M.B.P.P.; Cunha, L.M.; Valente, L.M.P. Long-Term Feeding of Vegetable Oils to Senegalese Sole until Market Size: Effects on Growth and Flesh Quality. Recovery of Fatty Acid Profiles by a Fish Oil Finishing Diet. Aquaculture 2014, 434, 425–433. [Google Scholar] [CrossRef]
- Suomela, J.P.; Tarvainen, M.; Kallio, H.; Airaksinen, S. Fish Oil Finishing Diet Maintains Optimal N-3 Long-Chain Fatty Acid Content in European Whitefish (Coregonus Lavaretus). Lipids 2017, 52, 849–855. [Google Scholar] [CrossRef]
- Thanuthong, T.; Francis, D.S.; Senadheera, S.P.S.D.; Jones, P.L.; Turchini, G.M. Short-Term Food Deprivation before a Fish Oil Finishing Strategy Improves the Deposition of n-3 LC-PUFA, but Not the Washing-out of C 18 PUFA in Rainbow Trout. Aquac. Nutr. 2012, 18, 441–456. [Google Scholar] [CrossRef]
- Thanuthong, T.; Francis, D.S.; Senadheera, S.D.; Jones, P.L.; Turchini, G.M. Fish Oil Replacement in Rainbow Trout Diets and Total Dietary PUFA Content: I) Effects on Feed Efficiency, Fat Deposition and the Efficiency of a Finishing Strategy. Aquaculture 2011, 320, 82–90. [Google Scholar] [CrossRef]
- Turchini, G.M.; Francis, D.S.; Senadheera, S.P.S.D.; Thanuthong, T.; De Silva, S.S. Fish Oil Replacement with Different Vegetable Oils in Murray Cod: Evidence of an “Omega-3 Sparing Effect” by Other Dietary Fatty Acids. Aquaculture 2011, 315, 250–259. [Google Scholar] [CrossRef]
- Turchini, G.M.; Francis, D.S.; De Silva, S.S. Modification of Tissue Fatty Acid Composition in Murray Cod (Maccullochella Peelii Peelii, Mitchell) Resulting from a Shift from Vegetable Oil Diets to a Fish Oil Diet. Aquac. Res. 2006, 37, 570–585. [Google Scholar] [CrossRef]
- Turchini, G.M.; Francis, D.S.; De Silva, S.S. Finishing Diets Stimulate Compensatory Growth: Results of a Study on Murray Cod, Maccullochella Peelii Peelii. Aquac. Nutr. 2007, 13, 351–360. [Google Scholar] [CrossRef]
- Suloma, A.; El–Husseiny, O.M.; A Zidan, A.E.N.F.; Mabroke, R.S. The Efficiency of Washout Strategy on Decreasing the Deposit Linoleic Acid of Tilapia Fillet and Viscera. Aquac. Rep. 2022, 23. [Google Scholar] [CrossRef]
- Yıldız, M.; Eroldoğan, T.O.; Ofori-Mensah, S.; Engin, K.; Baltacı, M.A. The Effects of Fish Oil Replacement by Vegetable Oils on Growth Performance and Fatty Acid Profile of Rainbow Trout: Re-Feeding with Fish Oil Finishing Diet Improved the Fatty Acid Composition. Aquaculture 2018, 488, 123–133. [Google Scholar] [CrossRef]
- Chen, F.; Leng, Y.; Lu, Q.; Zhou, W. The Application of Microalgae Biomass and Bio-Products as Aquafeed for Aquaculture. Algal Res. 2021, 60, 102541. [Google Scholar] [CrossRef]
- Pascon, G.; Messina, M.; Petit, L.; Maria, L.; Valente, P.; Oliveira, B.; Przybyla, C.; Dutto, G.; Tulli, F. Potential Application and Beneficial Effects of a Marine Microalgal Biomass Produced in a High-Rate Algal Pond (HRAP) in Diets of European Sea Bass, Dicentrarchus Labrax. Environ. Sci. Pollut. Res. Published. 2021, 28. [Google Scholar] [CrossRef]
- Bartek, L.; Strid, I.; Henryson, K.; Junne, S.; Rasi, S.; Eriksson, M. Life Cycle Assessment of Fish Oil Substitute Produced by Microalgae Using Food Waste. Sustain. Prod. Consum. 2021, 27, 2002–2021. [Google Scholar] [CrossRef]
- Mahata, C.; Das, P.; Khan, S.; Thaher, M.I.A.; Abdul Quadir, M.; Annamalai, S.N.; Al Jabri, H. The Potential of Marine Microalgae for the Production of Food, Feed, and Fuel (3F). Fermentation 2022, 8, 316. [Google Scholar] [CrossRef]
- Haas, S.; Bauer, J.L.; Adakli, A.; Meyer, S.; Lippemeier, S.; Schwarz, K.; Schulz, C. Marine Microalgae Pavlova Viridis and Nannochloropsis Sp. as n-3 PUFA Source in Diets for Juvenile European Sea Bass (Dicentrarchus Labrax L.). J. Appl. Phycol. 2016, 28, 1011–1021. [Google Scholar] [CrossRef]
- Karapanagiotidis, I.T.; Metsoviti, M.N.; Gkalogianni, E.Z.; Psofakis, P.; Asimaki, A.; Katsoulas, N.; Papapolymerou, G.; Zarkadas, I. The Effects of Replacing Fishmeal by Chlorella Vulgaris and Fish Oil by Schizochytrium Sp. and Microchloropsis Gaditana Blend on Growth Performance, Feed Efficiency, Muscle Fatty Acid Composition and Liver Histology of Gilthead Seabream (Sparus Aurata). Aquaculture 2022, 561. [Google Scholar] [CrossRef]
- Cardinaletti, G.; Messina, M.; Bruno, M.; Tulli, F.; Poli, B.M.; Giorgi, G.; Chini-Zittelli, G.; Tredici, M.; Tibaldi, E. Effects of Graded Levels of a Blend of Tisochrysis Lutea and Tetraselmis Suecica Dried Biomass on Growth and Muscle Tissue Composition of European Sea Bass (Dicentrarchus Labrax) Fed Diets Low in Fish Meal and Oil. Aquaculture 2018, 485, 173–182. [Google Scholar] [CrossRef]
- Randazzo, B.; Di Marco, P.; Zarantoniello, M.; Daniso, E.; Cerri, R.; Finoia, M.G.; Capoccioni, F.; Tibaldi, E.; Olivotto, I.; Cardinaletti, G. Effects of Supplementing a Plant Protein-Rich Diet with Insect, Crayfish or Microalgae Meals on Gilthead Sea Bream (Sparus Aurata) and European Seabass (Dicentrarchus Labrax) Growth, Physiological Status and Gut Health. Aquaculture 2023, 575. [Google Scholar] [CrossRef]
- Santigosa, E.; Brambilla, F.; Milanese, L. Microalgae Oil as an Effective Alternative Source of Epa and Dha for Gilthead Seabream (Sparus Aurata) Aquaculture. Animals 2021, 11. [Google Scholar] [CrossRef] [PubMed]
- Cortegano, C.A.A.; de Alcântara, A.M.; da Silva, A.F.; Epifânio, C.M.F.; Bentes, S.P.C.; dos Santos, V.J.; Visentainer, J.V.; Gonçalves, L.U. Finishing Plant Diet Supplemented with Microalgae Meal Increases the Docosahexaenoic Acid Content in Colossoma Macropomum Flesh. Aquac. Res. 2019, 50, 1291–1299. [Google Scholar] [CrossRef]
- Ribeiro, A.R.; Gonçalves, A.; Barbeiro, M.; Bandarra, N.; Nunes, M.L.; Carvalho, M.L.; Silva, J.; Navalho, J.; Dinis, M.T.; Silva, T.; et al. Phaeodactylum Tricornutum in Finishing Diets for Gilthead Seabream: Effects on Skin Pigmentation, Sensory Properties and Nutritional Value. J. Appl. Phycol. 2017, 29, 1945–1956. [Google Scholar] [CrossRef]
- Sáez, M.I.; Galafat, A.; Suárez, M.D.; Chaves-Pozo, E.; Arizcun, M.; Ayala, M.D.; Alarcón, F.J.; Martínez, T.F. Effects of Raw and Hydrolysed Nannochloropsis Gaditana Biomass Included at Low Level in Finishing Diets for Gilthead Seabream (Sparus Aurata) on Fillet Quality and Shelf Life. J. Appl. Phycol. 2023, 35, 1163–1181. [Google Scholar] [CrossRef]
- AOAC (Association of the Official Analytical Chemists). Official Methods of Analysis of Official Analytical Chemists International, 18th ed.; Arlington, VA, USA, 2005. [Google Scholar]
- Lepage, G.; Roy, C.C. Improved Recovery of Fatty Acid through Direct Transesterification without Prior Extraction or Purification Supplementary Key Words Triglyceride Gas-Liquid Chromatography. J. Lipid Res. 1984, 25, 1391–1396. [Google Scholar] [CrossRef]
- Chen, J.; Liu, H. Nutritional Indices for Assessing Fatty Acids: A Mini-Review. Int. J. Mol. Sci. 2020, 21, 1–24. [Google Scholar] [CrossRef] [PubMed]
- Ghaeni, M.; Ghahfarokhi, K.N. Fatty Acids Profile, Atherogenic (IA) and Thrombogenic (IT) Health Lipid Indices in Leiognathusbindus and Upeneussulphureus. J. Mar. Sci. Res. Dev. 2013, 03. [Google Scholar] [CrossRef]
- Roberts, R.S.D.M.E. Laboratory Methods. In Fish pathology; Roberts, R., Ed.; Wiley-Blackwell: Chichester, UK, 2012; pp. 439–481. [Google Scholar]
- Kokou, F.; Henry, M.; Nikoloudaki, C.; Kounna, C.; Vasilaki, A.; Fountoulaki, E. Optimum Protein-to-Lipid Ratio Requirement of the Juvenile Shi Drum (Umbrina Cirrosa) as Estimated by Nutritional and Histological Parameters. Aquac. Nutr. 2019, 25, 444–455. [Google Scholar] [CrossRef]
- Drabkin, D.L.; Austin, J.H. Spectrometric Studies II. Preparations from Washed Blood Cells; Nitric Oxide Hemoglobin and Sulfhemoglobin. J. Biol. Chem. 1935, 112, 51–65. [Google Scholar] [CrossRef]
- Henry, M.A.; Nikoloudaki, C.; Tsigenopoulos, C.; Rigos, G. Strong Effect of Long-Term Sparicotyle Chrysophrii Infection on the Cellular and Innate Immune Responses of Gilthead Sea Bream, Sparus Aurata. Dev. Comp. Immunol. 2015, 51, 185–193. [Google Scholar] [CrossRef]
- Henry, M.A.; Golomazou, E.; Asimaki, A.; Psofakis, P.; Fountoulaki, E.; Mente, E.; Rumbos, C.I.; Athanassiou, C.G.; Karapanagiotidis, I.T. Partial Dietary Fishmeal Replacement with Full-Fat or Defatted Superworm (Zophobas Morio) Larvae Meals Modulates the Innate Immune System of Gilthead Seabream, Sparus Aurata. Aquac. Rep. 2022, 27. [Google Scholar] [CrossRef]
- Henry, M.; Fountoulaki, E. Optimal Dietary Protein/Lipid Ratio for Improved Immune Status of a Newly Cultivated Mediterranean Fish Species, the Shi Drum Umbrina Cirrosa, L. Fish. Shellfish Immunol. 2014, 37, 215–219. [Google Scholar] [CrossRef] [PubMed]
- Kokou, F.; Rigos, G.; Henry, M.; Kentouri, M.; Alexis, M. Growth Performance, Feed Utilization and Non-Specific Immune Response of Gilthead Sea Bream (Sparus Aurata L.) Fed Graded Levels of a Bioprocessed Soybean Meal. Aquaculture 2012, 364–365, 74–81. [Google Scholar] [CrossRef]
- Ross, N.W.; Firth, K.J.~; Wang, A.; Burka, J.F.; Johnson, S.C. Changes in Hydrolytic Enzyme Activities of Naive Atlantic Salmon Salmo Salar Skin Mucus Due to Infection with the Salmon Louse Lepeophtheirus Salmonis and Cortisol Implantation. Dis. Aquat. Organ. 2000, 41, 43–51. [Google Scholar]
- Xu, H.; Turchini, G.M.; Francis, D.S.; Liang, M.; Mock, T.S.; Rombenso, A.; Ai, Q. Are Fish What They Eat? A Fatty Acid’s Perspective. Prog. Lipid Res. 2020, 80, 101064. [Google Scholar] [CrossRef] [PubMed]
- Andersen, N.F.; Cavan, E.L.; Cheung, W.W.L.; Martin, A.H.; Saba, G.K.; Sumaila, U.R. Good Fisheries Management Is Good Carbon Management. npj Ocean Sustain. 2024, 3. [Google Scholar] [CrossRef]
- Mourente, G.; Bell, J.G. Partial Replacement of Dietary Fish Oil with Blends of Vegetable Oils (Rapeseed, Linseed and Palm Oils) in Diets for European Sea Bass (Dicentrarchus Labrax L.) over a Long Term Growth Study: Effects on Muscle and Liver Fatty Acid Composition and Effectiveness of a Fish Oil Finishing Diet. Comp. Biochem. Physiol. Biochem. Mol. Biol. 2006, 145, 389–399. [Google Scholar] [CrossRef]
- Le Boucher, R.; Vandeputte, M.; Dupont-Nivet, M.; Quillet, E.; Mazurais, D.; Robin, J.; Vergnet, A.; Médale, F.; Kaushik, S.; Chatain, B. A First Insight into Genotype × Diet Interactions in European Sea Bass (Dicentrarchus Labrax L1756) in the Context of Plant-Based Diet Use. Aquac. Res. 2011, 42, 583–592. [Google Scholar] [CrossRef]
- Marques, A.; Canada, P.; Costa, C.; Basto, A.; Piloto, F.; Salgado, M.A.; Abreu, H.; Dias, J.; Valente, L.M.P. Replacement of Fish Oil by Alternative N-3 LC-PUFA Rich Lipid Sources in Diets for European Sea Bass (Dicentrarchus Labrax). Front. Mar. Sci. 2023, 10. [Google Scholar] [CrossRef]
- Liu, C.; Palihawadana, A.M.; Nadanasabesan, N.; Vasanth, G.K.; Vatsos, I.N.; Dias, J.; Valente, L.M.P.; Micallef, G.; Sørensen, M.; Kiron, V. Utilization of Nannochloropsis Oceanica in Plant-Based Feeds by Atlantic Salmon (Salmo Salar). Aquaculture 2022, 561. [Google Scholar] [CrossRef]
- Sørensen, M.; Gong, Y.; Bjarnason, F.; Vasanth, G.K.; Dahle, D.; Huntley, M.; Kiron, V. Nannochloropsis Oceania-Derived Defatted Meal as an Alternative to Fishmeal in Atlantic Salmon Feeds. PLoS ONE 2017, 12. [Google Scholar] [CrossRef]
- Zahran, E.; Elbahnaswy, S.; Ahmed, F.; Ibrahim, I.; Khaled, A.A.; Eldessouki, E.A. Nutritional and Immunological Evaluation of Nannochloropsis Oculata as a Potential Nile Tilapia-Aquafeed Supplement. BMC Vet. Res. 2023, 19. [Google Scholar] [CrossRef]
- Abdelghany, M.F.; El-Sawy, H.B.; Abd El-hameed, S.A.A.; Khames, M.K.; Abdel-Latif, H.M.R.; Naiel, M.A.E. Effects of Dietary Nannochloropsis Oculata on Growth Performance, Serum Biochemical Parameters, Immune Responses, and Resistance against Aeromonas Veronii Challenge in Nile Tilapia (Oreochromis Niloticus). Fish. Shellfish Immunol. 2020, 107, 277–288. [Google Scholar] [CrossRef]
- Qiao, H.; Hu, D.; Ma, J.; Wang, X.; Wu, H.; Wang, J. Feeding Effects of the Microalga Nannochloropsis Sp. on Juvenile Turbot (Scophthalmus Maximus L.). Algal Res. 2019, 41. [Google Scholar] [CrossRef]
- Trevi, S.; Uren Webster, T.; Consuegra, S.; Garcia de Leaniz, C. Benefits of the Microalgae Spirulina and Schizochytrium in Fish Nutrition: A Meta-Analysis. Sci. Rep. 2023, 13. [Google Scholar] [CrossRef]
- Toussaint, C.; Fauconneau, B.; Médale, F.; Collewet, G.; Akoka, S.; Haffray, P.; Davenel, A. Description of the Heterogeneity of Lipid Distribution in the Flesh of Brown Trout (Salmo Trutta) by MR Imaging. Aquaculture 2005, 243, 255–267. [Google Scholar] [CrossRef]
- Yuan, X.; Liang, X.F.; Liu, L.; Fang, J.; Li, J.; Li, A.; Cai, W.; Xue, M.; Wang, J.; Wang, Q. Fat Deposition Pattern and Mechanism in Response to Dietary Lipid Levels in Grass Carp, Ctenopharyngodon Idellus. Fish. Physiol. Biochem. 2016, 42, 1557–1569. [Google Scholar] [CrossRef] [PubMed]
- NRC (National Research Council). Nutrient Requirements of Fish and Shrimp; The National Academy Press: Washington (DC), USA, 2011. [Google Scholar]
- Bell, J.G.; Sargent, J.R. Arachidonic Acid in Aquaculture Feeds: Current Status and Future Opportunities. 2003, 218, 491–499. [Google Scholar]
- Caballero, M.J.; Obach, A.; Rosenlund, G.; Montero, D.; Gisvold, M. Impact of Different Dietary Lipid Sources on Growth, Lipid Digestibility, Tissue Fatty Acid Composition and Histology of Rainbow Trout, Oncorhynchus Mykiss. Aquaculture 2002, 214, 253–271. [Google Scholar] [CrossRef]
- Liao, Z.; Gong, Q.; Liu, Y.; Wei, Y.; Liang, M.; Xu, H. Response of Lipid-Related Composition of Farmed Tiger Puffer (Takifugu Rubripes) to Starvation under Different Dietary Lipid Levels in the Previous Feeding Period. Aquac. Rep. 2022, 24. [Google Scholar] [CrossRef]
- Kaur, G.; Cameron-Smith, D.; Garg, M.; Sinclair, A.J. Docosapentaenoic Acid (22:5n-3): A Review of Its Biological Effects. Prog. Lipid Res. 2011, 50, 28–34. [Google Scholar] [CrossRef]
- Ayala, M.D.; Chaves-Pozo, E.; Sáez, M.I.; Galafat, A.; Alarcón, F.J.; Martínez, T.F.; Arizcun, M. Effect on Muscle Cellularity of Diet Supplementation with Nannochloropsis Gaditana Microalgae in the Final Fattening Phase of Gilthead Seabream Culture up to Commercial Size. Fishes 2023, 8. [Google Scholar] [CrossRef]
- Ayala, M.D.; Balsalobre, N.; Chaves-Pozo, E.; Sáez, M.I.; Galafat, A.; Alarcón, F.J.; Martínez, T.F.; Arizcun, M. Long-Term Effects of a Short Juvenile Feeding Period with Diets Enriched with the Microalgae Nannochloropsis Gaditana on the Subsequent Body and Muscle Growth of Gilthead Seabream, Sparus Aurata L. Animals 2023, 13. [Google Scholar] [CrossRef]
- Tsoupras, A.; Brummell, C.; Kealy, C.; Vitkaitis, K.; Redfern, S.; Zabetakis, I. Cardio-Protective Properties and Health Benefits of Fish Lipid Bioactives; The Effects of Thermal Processing. Mar. Drugs 2022, 20, 187. [Google Scholar] [CrossRef]
- Van Dael, P. Role of N-3 Long-Chain Polyunsaturated Fatty Acids in Human Nutrition and Health: Review of Recent Studies and Recommendations. Nutr. Res. Pract. 2021, 15, 137–159. [Google Scholar] [CrossRef]
- EFSA, E.F.S.A. Dietary Reference Values for Nutrients Summary Report. 2017, Vol. 14. [Google Scholar]
- Johnson, E.J.; Schaefer, E.J. Potential Role of Dietary N3 Fatty Acids in the Prevention of Dementia and Macular Degeneration 1-4. Am. J. Clin. Nutr. 2006, 83, 1494S–1498S. [Google Scholar] [CrossRef]
- Gowda, S.; Minami, Y.; Gowda, D.; Chiba, H.; Hui, S.P. Detection and Characterization of Lipids in Eleven Species of Fish by Non-Targeted Liquid Chromatography/Mass Spectrometry. Food Chem. 2022, 393. [Google Scholar] [CrossRef]
- Durmuş, M. Fish Oil for Human Health: Omega-3 Fatty Acid Profiles of Marine Seafood Species. Food Sci. Technol. 2019, 39, 454–461. [Google Scholar] [CrossRef]
- Stancheva, M.; Merdzhanova, A.; Dobreva, D.A.; Makedonski, L. Common Carp (Cyprinus Caprio) and European Catfish (Sillurus Glanis) from the Danube River as Sources of Fat Soluble Vitamins and Fatty Acids. Czech. J. Food Sci. 2014, 32, 16–24. [Google Scholar] [CrossRef]
- Ouraji, H.; Shabanpour, B.; Kenari, A.A.; Shabani, A.; Nezami, S.; Sudagar, M.; Faghani, S. Total Lipid, Fatty Acid Composition and Lipid Oxidation of Indian White Shrimp ( Fenneropenaeus Indicus ) Fed Diets Containing Different Lipid Sources. J. Sci. Food Agric. 2009, 89, 993–997. [Google Scholar] [CrossRef]
- Monteiro, M.; Matos, E.; Ramos, R.; Campos, I.; Valente, L.M.P. A Blend of Land Animal Fats Can Replace up to 75% Fish Oil without Affecting Growth and Nutrient Utilization of European Seabass. Aquaculture 2018, 487, 22–31. [Google Scholar] [CrossRef]
- Erena, T.; Belay, A.; Geleta, M.; Deme, T. Fatty Acid Profile and Proximate Composition of Sirloin and Chuck of Selected Ethiopia Cattle Types. Carpathian J. Food Sci. Technol. 2024, 16, 50–65. [Google Scholar] [CrossRef]
- Jouini, J.; Besbes, N.; Sadok, S.; Gargouri, L. Does Anisakis Spp. Infestation Affect the Proximate Composition, Fatty Acids, and Minerals Contents of Its Host Merluccius Merlucccius? Parasitol. Res. 2023, 122, 3053–3062. [Google Scholar] [CrossRef]
- Martins, N.; Moutinho, S.; Magalhães, R.; Pousão-Ferreira, P.; Oliva-Teles, A.; Peres, H.; Castro, C. Oleic Acid as Modulator of Oxidative Stress in European Sea Bass (Dicentrarchus Labrax) Juveniles Fed High Dietary Lipid Levels. Comp. Biochem. Physiol. B Biochem. Mol. Biol. 2024, 270. [Google Scholar] [CrossRef]
- Al-Khalaifah, H. Modulatory Effect of Dietary Polyunsaturated Fatty Acids on Immunity, Represented by Phagocytic Activity. Front. Vet. Sci. 2020, 7. [Google Scholar] [CrossRef]
- Calder, P.C. Fatty Acids: Long-Chain Fatty Acids and Inflammation. Proc. Nutr. Soc. 2012, 71, 284–289. [Google Scholar] [CrossRef]
- Mendivil, C.O. Dietary Fish, Fish Nutrients, and Immune Function: A Review. Front. Nutr. 2021, 7. [Google Scholar] [CrossRef]
- Cerezuela, R.; Guardiola, F.A.; Meseguer, J.; Esteban, M.Á. Enrichment of Gilthead Seabream (Sparus Aurata L.) Diet with Microalgae: Effects on the Immune System. Fish. Physiol. Biochem. 2012, 38, 1729–1739. [Google Scholar] [CrossRef]
- Montero, D.; Kalinowski, T.; Obach, A.; Robaina, L.; Tort, L.; Caballero, M.J.; Izquierdo, M.S. Vegetable Lipid Sources for Gilthead Seabream (Sparus Aurata): Effects on Fish Health. Aquaculture 2003, 225, 353–370. [Google Scholar] [CrossRef]
- Waagbø, R. The Impact of Nutritional Factors on the Immune System in Atlantic Salmon, Salmo Salar L.: A Review. Aquac. Res. 1994, 25, 175–197. [Google Scholar] [CrossRef]
- Waagbó, R.; Hemre, G.I.; Holm, J.C.; Lie, O. Tissue Fatty Acid Composition, Haematology and Immunity in Adult Cod, Gadus Morhua L., Fed Three Dietary Lipid Sources. J. Fish. Dis. 1995, 18, 615–622. [Google Scholar] [CrossRef]
- Bowden, L.A.; Restall, C.J.; Rowley, A.F. The Influence of Environmental Temperature on Membrane Fluidity, Fatty Acid Composition and Lipoxygenase Product Generation in Head Kidney Leucocytes of the Rainbow Trout, Oncorhynchus Mykiss. Biochem. Physiol. 1996, 15, 375–382. [Google Scholar]
- Montero, D.; Mathlouthi, F.; Tort, L.; Afonso, J.M.; Torrecillas, S.; Fernández-Vaquero, A.; Negrin, D.; Izquierdo, M.S. Replacement of Dietary Fish Oil by Vegetable Oils Affects Humoral Immunity and Expression of Pro-Inflammatory Cytokines Genes in Gilthead Sea Bream Sparus Aurata. Fish. Shellfish Immunol. 2010, 29, 1073–1081. [Google Scholar] [CrossRef]
- Mourente, G.; Good, J.E.; Thompson, K.D.; Bell, J.G. Effects of Partial Substitution of Dietary Fish Oil with Blends of Vegetable Oils, on Blood Leucocyte Fatty Acid Compositions, Immune Function and Histology in European Sea Bass (Dicentrarchus Labrax L.). Br. J. Nutr. 2007, 98, 770–779. [Google Scholar] [CrossRef]
- Sushytskyi, L.; Synytsya, A.; Lukáč, P.; Rajsiglová, L.; Capek, P.; Pohl, R.; Bleha, R.; Vannucci, L.E.; Smrz, D.; Čopíková, J.; et al. Immunologically Active Cell Wall Polysaccharides of Green Microalga Dictyosphaerium Chlorelloides (Chlorellacea). Carbohydr. Polym. 2025, 353. [Google Scholar] [CrossRef] [PubMed]
- Riccio, G.; Lauritano, C. Microalgae with Immunomodulatory Activities. Mar. Drugs 2020, 18. [Google Scholar] [CrossRef]
- Sánchez, F.; Lozano-Muñoz, I.; Muñoz, S.; Diaz, N.; Neira, R.; Wacyk, J. Effect of Dietary Inclusion of Microalgae (Nannochloropsis Gaditana and Schizochytrium Spp) on Non-Specific Immunity and Erythrocyte Maturity in Atlantic Salmon Fingerlings. Fish. Shellfish Immunol. 2023, 140. [Google Scholar] [CrossRef] [PubMed]
- Ferreira, M.; Abdelhafiz, Y.; Abreu, H.; Silva, J.; Valente, L.M.P.; Kiron, V. Gracilaria Gracilis and Nannochloropsis Oceanica, Singly or in Combination, in Diets Alter the Intestinal Microbiota of European Seabass (Dicentrarchus Labrax). Front. Mar. Sci. 2022, 9. [Google Scholar] [CrossRef]
- Sattanathan, G.; Liu, W.C.; Padmapriya, S.; Pushparaj, K.; Sureshkumar, S.; Lee, J.W.; Balasubramanian, B.; Kim, I.H. Effects of Dietary Blend of Algae Extract Supplementation on Growth, Biochemical, Haemato-Immunological Response, and Immune Gene Expression in Labeo Rohita with Aeromonas Hydrophila Post-Challenges. Fishes 2023, 8. [Google Scholar] [CrossRef]
Figure 1.
Dietary FA profile of selected FA and comparison with the fillet FA profile of European sea bass after 13 or 25 wk feeding with the 3 different experimental diets (FO, AO, RO) or after 12 wk of finishing with the FO or AO diets in fish fed the RO diet for the first 13 wk (ROFO, ROAO). ALA = α-linolenic acid; ARA = arachidonic acid; DHA = docosahexanoic acid; DPA = Docosapentaenoic acid; EA = Erusic acid; EDA = eicosadienoic acid; EPA = eicosapentaenoic acid; HDA =hypogenoic acid; LA = linoleic acid; OA = oleic acid; PA = palmitic acid; POA = palmitoleic acid; SA = Stearic acid; SDA = Stearidonic acid.

Figure 2.
Biosynthetic pathway of polyunsaturated fatty acid with putative explanation of variations between dietary and muscle fatty acids (adapted from [17,65]).

Figure 3.
Proximate Component Analysis biplots with (A) all FA significantly different between dietary treatments, (B) with all quality indices of fish fillet of European sea bass after 25 wk feeding with the 3 different experimental diets (FOFO, AOAO, RORO) or after 12 wk of finishing with the FO or AO diets in fish fed the RO diet for the first 13 wk (ROFO, ROAO). FO = fish oil; AO = algal oil; RO = rapeseed oil; Σ = Total; SFA = saturated fatty acids; OA = oleic acid; MUFA = monounsaturated fatty acids; LA = linoleic acid; ARA = arachidonic acid; PUFA = polyunsaturated fatty acids; ALA = α-linolenic acid; SDA = Stearidonic acid; EPA = eicosapentaenoic acid; DHA = docosahexanoic acid; DPA = docosapentaenoic acid; h/H = hypocholesterolaemic/ hypercholesterolaemic ratio (C18:1 n-9 + Σ n-6 PUFA+ Σ n-3 PUFA)/(C12:0 + C14:0 + C16:0) ; AI = atherogenecity index (C12:0 + 4 x C14:0 + C16:0) / Σ unsaturated FA; TI = thrombogenicity index(C14:0 + C16:0 + C18:0) / [(0.5 x Σ MUFA) + (0.5 x Σ n-6 PUFA) + (3 x Σ n-3 PUFA) + (Σ n-3 PUFA / Σ n-6 PUFA)]; UI = unsaturation index = 1 x (Σ monoenoic FA) + 2 x (Σ dienoic FA) + 3 x (Σ trienoic FA) + 4 x (Σ tetraenoic FA) + 5 x (Σ pentaenoic FA) + 6 x (Σ hexaenoic FA); FLQ = fish lipid quality = 100 x (C22:6 n-3 + C20:5 n-3)/ Σ SFA.


Figure 4.
Liver sections at 13W of fish fed on A) FO diet, B) AO diet and C) RO diet (10X).

Figure 5.
Liver sections of of fish fed continuously on A) FO diet (FOFO), B) AO diet (AOAO), C) RO diet (RORO) for 25 wk, or of fish fed RO for 13 wk and switched to D) FO diet (ROFO), or E) AO diet (ROAO) for the last 12 weeks of the trial (10X).
Figure 5.
Liver sections of of fish fed continuously on A) FO diet (FOFO), B) AO diet (AOAO), C) RO diet (RORO) for 25 wk, or of fish fed RO for 13 wk and switched to D) FO diet (ROFO), or E) AO diet (ROAO) for the last 12 weeks of the trial (10X).

Figure 6.
Posterior intestine sections of fish fed on A) FO diet, B) AO diet and C) RO diet 13 wk after the start of the trial (Latin letters 10Χ, Greek letters 20Χ). EG Eosinophilic granulocytes.
Figure 6.
Posterior intestine sections of fish fed on A) FO diet, B) AO diet and C) RO diet 13 wk after the start of the trial (Latin letters 10Χ, Greek letters 20Χ). EG Eosinophilic granulocytes.

Table 1.
Proximate composition (% as-is) and EPA-DHA contents (% of total fatty acids) of the microalgae used in the experimental diet AO.
Table 1.
Proximate composition (% as-is) and EPA-DHA contents (% of total fatty acids) of the microalgae used in the experimental diet AO.
| Nannochloropsis sp. | Schizochytrium sp. | |
|---|---|---|
| Moisture(%) | 4.24 | 3.23 |
| Ash(%) | 8.80 | 5.66 |
| Proteins(%) | 35.36 | 12.79 |
| Lipids(%) | 21.00 | 51.55 |
| 20:5 n-3(EPA) (% of FA) | 4.48 | 0.22 |
| 22:6 n-3(DHA) (% of FA) | 0.00 | 27.20 |
AO: Algal oil; EPA = eicosapentaenoic acid; DHA = docosahexanoic acid.
Table 2.
Formulation and proximate composition of the 3 experimental diets for European sea bass (%, as fed basis).
Table 2.
Formulation and proximate composition of the 3 experimental diets for European sea bass (%, as fed basis).
| FO | AO | RO | |
|---|---|---|---|
| Ingredients | |||
| Fish meal 68 | 17.00 | 17.00 | 17.00 |
| Wheat meal | 16.74 | 13.69 | 16.69 |
| Wheat gluten | 9.00 | 9.00 | 9.00 |
| Corn gluten | 15.00 | 15.00 | 15.00 |
| Soy bean meal 47 | 9.00 | 9.00 | 9.00 |
| Soy bean concentrate 60 | 14.50 | 10.30 | 14.50 |
| Fish oil | 9.00 | 3.00 | 3.00 |
| Rapeseed oil | 6.00 | 9.00 | 12.00 |
| Nannochloropsis sp. | 0.00 | 7.20 | 0.00 |
| Schizochytrium sp. | 0.00 | 3.00 | 0.00 |
| Mono-calcium phosphate 1 | 2.50 | 2.50 | 2.50 |
| Mineral & Vitamin premix 1,2 | 0.25 | 0.25 | 0.25 |
| Vitamin C 1 | 0.06 | 0.06 | 0.06 |
| Lysine 1 | 0.50 | 0.50 | 0.50 |
| Methionine 1 | 0.30 | 0.30 | 0.30 |
| Taurine 1 | 0.15 | 0.20 | 0.20 |
| Proximate composition | |||
| Moisture 3 | 7.10 | 7.33 | 7.00 |
| Ash 3 | 6.78 | 7.13 | 6.93 |
| CP 3 | 43.95 | 44.04 | 44.18 |
| EE 3 | 17.22 | 17.50 | 17.47 |
| NFE 4 | 24.96 | 24.12 | 24.41 |
| OM 4 | 86.12 | 85.67 | 86.07 |
| CF 5 | 1.58 | 1.77 | 1.57 |
| ADF 5 | 4.15 | 4.80 | 4.12 |
| NDF 5 | 2.15 | 2.56 | 2.14 |
| Energy (MJ/kg) 6 | 21.49 | 21.48 | 21.54 |
FO = fish oil; AO = algal oil; RO = rapeseed oil.
Table 4.
Statistical analysis of the weights of fish fed the RO diet in the 3-block randomised tanks or in the validation tank; effect of the net position in the large tanks (Net effet) and of the tank (nets in distinct tanks, i.e., 3-block tanks or nets in the same tank, i.e., validation tank).
Table 4.
Statistical analysis of the weights of fish fed the RO diet in the 3-block randomised tanks or in the validation tank; effect of the net position in the large tanks (Net effet) and of the tank (nets in distinct tanks, i.e., 3-block tanks or nets in the same tank, i.e., validation tank).
| One-Way ANOVA (P) | Net effect | Tank effect | Net x Tank Effect |
|---|---|---|---|
| Wi (n=20) | 0.997 | 0.554 | 0.713 |
| W 56d (n=20) | 0.745 | 0.655 | 0.613 |
| W 93d (13W, n=12) | 0.581 | 0.436 | 0.425 |
Table 5.
Effect of dietary oil on fish growth performance, feed utilization and morphometric indices of European sea bass fed 25 wk with the 3 different lipid sources (fish oil, FOFO; algal oil, AOAO; rapeseed oil, RORO) or for 13 wk with the RO diet followed by a 12-week finishing period with the FO or AO diets (ROFO; ROAO respectively).
| FOFO | AOAO | RORO | ROFO | ROAO | P-values | ||||
|---|---|---|---|---|---|---|---|---|---|
| SEM | T | L | Q | ||||||
| Wi, g/fish 1 | 200.22 | 193.38 | 195.10 | 2.597 | 0.565 | 0.423 | 0.433 | ||
| Growth period (13 wk) | |||||||||
| BW, g/fish 1 | 260.00 | 246.23 | 247.83 | 4.073 | 0.470 | 0.094 | 0.214 | ||
| WG, % 1,4 | 29.86 | 27.34 | 27.00 | 1.071 | 0.457 | 0.338 | 0.662 | ||
| DFI, g/fish/day 1,5 | 2.12 | 2.12 | 2.09 | 0.024 | 0.870 | 0.674 | 0.774 | ||
| SGR, %/day 1,6 | 0.28 | 0.26 | 0.26 | 0.009 | 0.453 | 0.337 | 0.680 | ||
| FCR 1,7 | 2.01 | 2.28 | 1.86 | 0.115 | 0.355 | 0.585 | 0.194 | ||
| Finishing period (12 wk) | |||||||||
| Wf, g/fish 2 | 393.66 | 365.10 | 357.22 | 375.71 | 355.93 | 7.081 | 0.505 | ||
| WG, % 2,4 | 51.15 | 48.95 | 43.26 | 44.80 | 44.20 | 2.156 | 0.831 | ||
| DFI, g/fish/day 2,5 | 2.24 | 2.13 | 2.12 | 2.16 | 2.04 | 0.040 | 0.726 | ||
| SGR, %/day 2,6 | 0.51 | 0.49 | 0.45 | 0.46 | 0.46 | 0.018 | 0.821 | ||
| FCR 2,7 | 1.51 | 1.48 | 1.55 | 1.44 | 1.51 | 0.018 | 0.399 | ||
| Total trial (25 wk) | |||||||||
| WG, % 2,4 | 97.94 | 90.32 | 81.46 | 91.01 | 80.25 | 3.301 | 0.492 | ||
| DFI, g/fish/day 2,5 | 4.34 | 4.20 | 4.17 | 4.35 | 4.11 | 0.059 | 0.526 | ||
| SGR, %/day 2,6 | 0.39 | 0.37 | 0.34 | 0.37 | 0.34 | 0.010 | 0.493 | ||
| HSI, % 3,8 | 1.70 ab | 1.35 a | 2.01 b | 1.59 a | 1.56 a | 0.067 | 0.006 | ||
| VSI, % 3,9 | 10.67 c | 9.91 bc | 10.60 c | 9.66 b | 8.57 a | 0.267 | 0.001 | ||
| MFI, % 3,10 | 4.71ab | 4.75ab | 5.20b | 4.44ab | 3.64a | 0.186 | 0.021 | ||
SEM= standard error of the mean; T=treatment; L=linear; Q=quadratic; Wi = initial body weight; BW = body weight; Wf = final body weight; WG, percentage of weight gain; FI = feed intake; SGR = specific growth rate; FCR = feed conversion ratio; HSI = hepatosomatic index; VSI = viscero-somatic index; MFI = Mesenteric fat index; NS = not significant. a-c Different letters in the same row show significant differences between experimental diets (One-Way ANOVA, P < 0.05). 1 The data are the means of 3 net replicates of 20 fish in each group (n = 3).2 The data are the means of 2 net replicates of 9 fish in each group (n = 2). 3 The data are the means of 12 fish in 2 nets (6 fish per replicate net, n = 12 fish).
Table 6.
Proximate composition (analysed, not calculated) of the fillet of European sea bass after 13 or 25 wk feeding with the 3 different experimental diets (FOFO, AOAO, RORO) or after 12wk of feeding with the FO or AO finishing diets in fish fed the RO diet for the first 13 wk (ROFO, ROAO).
Table 6.
Proximate composition (analysed, not calculated) of the fillet of European sea bass after 13 or 25 wk feeding with the 3 different experimental diets (FOFO, AOAO, RORO) or after 12wk of feeding with the FO or AO finishing diets in fish fed the RO diet for the first 13 wk (ROFO, ROAO).
| FOFO | AOAO | RORO | ROFO | ROAO | SEM | P-values | |||
|---|---|---|---|---|---|---|---|---|---|
| End of growth period(13 wk) | T | L | Q | ||||||
| Moisture 1 | 76.58 | 76.57 | 75.94 | 0.135 | 0.079 | 0.050 | 0.244 | ||
| Ash 1 | 1.42 | 1.38 | 1.41 | 0.037 | 0.942 | 0.951 | 0.738 | ||
| Proteins 1 | 17.41a | 18.69b | 18.60b | 0.211 | 0.011 | 0.010 | 0.071 | ||
| Lipids 1 | 4.59 | 3.73 | 4.28 | 0.194 | 0.192 | 0.515 | 0.092 | ||
| End of the trial (25 wk) | |||||||||
| Moisture 2 | 75.20 | 75.60 | 75.45 | 75.90 | 75.08 | 0.113 | 0.150 | ||
| Ash 2 | 1.38 | 1.44 | 1.33 | 1.38 | 1.42 | 0.014 | 0.087 | ||
| Proteins 2 | 19.30 | 20.08 | 18.81 | 19.37 | 19.72 | 0.170 | 0.294 | ||
| Lipids 2 | 4.10 | 3.06 | 4.83 | 3.39 | 4.40 | 0.254 | 0.152 | ||
SEM= Standard error of the mean; T= treatment; L=linear; Q=quadratic. 1 The data are the means of 3 replicates of 2 fishes per replicate (n = 6). 2 The data are the means of 2 replicates of 3 fishes per replicate (n = 6).
Table 7.
Effect of dietary oil on the fatty acid profile (% of total fatty acids) of the fillet of European sea bass after 13 wk feeding with the 3 different experimental diets (FO, AO, RO).
Table 7.
Effect of dietary oil on the fatty acid profile (% of total fatty acids) of the fillet of European sea bass after 13 wk feeding with the 3 different experimental diets (FO, AO, RO).
| FO | AO | Δ | RO | Δ | SEM | P-value | |||
|---|---|---|---|---|---|---|---|---|---|
| T | L | Q | |||||||
| 14:0 | 2.40 b | 1.98 a | (-17.5) | 2.01 a | (-16.3) | 0.057 | < 0.001 | < 0.001 | 0.007 |
| 16:0, PA | 15.92 b | 15.42 ab | 15.07 a | (-5.3) | 0.135 | 0.022 | 0.007 | 0.746 | |
| 18:0, SA | 4.30 | 4.15 | 4.20 | 0.045 | 0.416 | 0.367 | 0.335 | ||
| Σ SFA1 | 23.88 b | 22.75 a | (-4.7) | 22.39 a | (-6.2) | 0.194 | < 0.001 | < 0.001 | 0.173 |
| 16:1 n-7, POA | 3.59 b | 3.39 b | 3.03 a | (-15.5) | 0.073 | 0.001 | < 0.001 | 0.456 | |
| 16:1 n-9, HDA | 0.46 b | 0.38 a | (-17.5) | 0.41 ab | 0.010 | < 0.001 | 0.024 | 0.001 | |
| 18:1 n-7 | 2.87 | 2.83 | 2.86 | 0.016 | 0.654 | 0.937 | 0.367 | ||
| 18:1 n-9, OA | 27.73 a | 28.41 ab | 30.12 b | (+8.6) | 0.357 | 0.009 | 0.003 | 0.390 | |
| 20:1 n-9 | 2.89 | 2.81 | 2.99 | 0.043 | 0.232 | 0.309 | 0.166 | ||
| 22:1 n-11, EA | 1.83 | 1.70 | 1.73 | 0.048 | 0.541 | 0.436 | 0.436 | ||
| 24:1n-9 | 0.56 | 0.61 | 0.54 | 0.017 | 0.224 | 0.613 | 0.101 | ||
| Σ MUFA1 | 41.20 | 41.29 | 42.89 | 0.338 | 0.063 | 0.036 | 0.252 | ||
| Σ n-9 MUFA1 | 32.08 a | 32.66 a | 34.51 b | (+7.6) | 0.361 | 0.007 | 0.003 | 0.295 | |
| 18:2 n-6, LA | 15.03 | 15.51 | 16.18 | 0.279 | 0.249 | 0.102 | 0.873 | ||
| 20:2 n-6, EDA | 0.82 | 0.82 | 0.85 | 0.012 | 0.502 | 0.277 | 0.684 | ||
| 20:4 n-6, ARA | 0.56 a | 0.92 b | (+64) | 0.65 a | 0.049 | 0.001 | 0.280 | < 0.001 | |
| Σ n-6 PUFA1 | 16.76 | 17.67 | 18.09 | 0.282 | 0.146 | 0.059 | 0.666 | ||
| 18:3 n-3, ALA | 2.96 | 3.12 | 3.27 | 0.055 | 0.066 | 0.022 | 0.931 | ||
| 18:4 n-3, SDA | 0.68 b | 0.56 a | (-18.4) | 0.58 a | (-15.1) | 0.017 | 0.002 | 0.003 | 0.013 |
| 20:5 n-3, EPA | 3.86 b | 3.59 ab | 3.34 a | (-13.5) | 0.066 | < 0.001 | < 0.001 | 0.922 | |
| 22:5 n-3, DPA | 0.87 | 0.77 | 0.78 | 0.022 | 0.105 | 0.088 | 0.186 | ||
| 22:6 n-3, DHA | 9.13 | 9.43 | 7.99 | 0.268 | 0.060 | 0.069 | 0.105 | ||
| Σ n-3 PUFA1 | 18.15 ab | 18.28 b | 16.64 a | (-8.3) | 0.305 | 0.039 | 0.032 | 0.129 | |
| n-3/n-6 PUFA | 1.09 b | 1.04ab | 0.93 a | (-14.7) | 0.029 | 0.054 | 0.020 | 0.556 | |
| h/H 2 | 3.42 a | 3.70 b | (+7.9) | 3.80 b | (+12.7) | 0.051 | 0.001 | < 0.001 | 0.233 |
| AI 3 | 0.24 b | 0.21 a | (-10.2) | 0.21 a | (-12.7) | 0.004 | < 0.001 | < 0.001 | 0.034 |
| TI 4 | 0.27b | 0.25a | (-5.6) | 0.26ab | 0.002 | 0.029 | 0.266 | 0.014 | |
| UI 5 | 168.62 | 171.77 | 163.89 | 1.401 | 0.059 | 0.138 | 0.053 | ||
| FLQ 6 | 54.40 | 57.19 | 50.61 | 1.213 | 0.076 | 0.175 | 0.060 | ||
| EPA + DHA 7 | 0.59 b | 0.47 ab | 0.42 a | (-29.1) | 0.028 | 0.028 | 0.010 | 0.524 | |
Diets FO = fish oil; AO = algal oil; RO = rapeseed oil; T = treatment; L = linear; Q=quadratic; AI = atherogenecity index; ALA = α-linolenic acid; ARA = arachidonic acid; DHA = docosahexanoic acid; DPA = Docosapentaenoic acid; EA = Erusic acid; EDA = eicosadienoic acid; EPA = eicosapentaenoic acid; ERA = eicosatrienoic acid; FLQ = fish lipid quality; HDA =hypogenoic acid; h/H = hypocholesterolaemic/ hypercholesterolaemic ratio; LA = linoleic acid; MUFA = monounsaturated fatty acids; n-3/n-6 PUFA = ratio of omega 3/omega 6 FA; OA = oleic acid; PA = palmitic acid; POA = palmitoleic acid; PUFA = polyunsaturated fatty acids; SA = Stearic acid; SDA = Stearidonic acid; SEM = Standard Error of the mean; SFA = saturated fatty acids; TI = thrombogenicity index ; UI = unsaturation index; Σ = Total.
Disclaimer/Publisher’s Note: The statements, opinions and data contained in all publications are solely those of the individual author(s) and contributor(s) and not of MDPI and/or the editor(s). MDPI and/or the editor(s) disclaim responsibility for any injury to people or property resulting from any ideas, methods, instructions or products referred to in the content. |
© 2026 by the authors. Licensee MDPI, Basel, Switzerland. This article is an open access article distributed under the terms and conditions of the Creative Commons Attribution (CC BY) license.
Copyright: This open access article is published under a Creative Commons CC BY 4.0 license, which permit the free download, distribution, and reuse, provided that the author and preprint are cited in any reuse.


