

Submitted:
05 June 2026
Posted:
09 June 2026
You are already at the latest version
Abstract
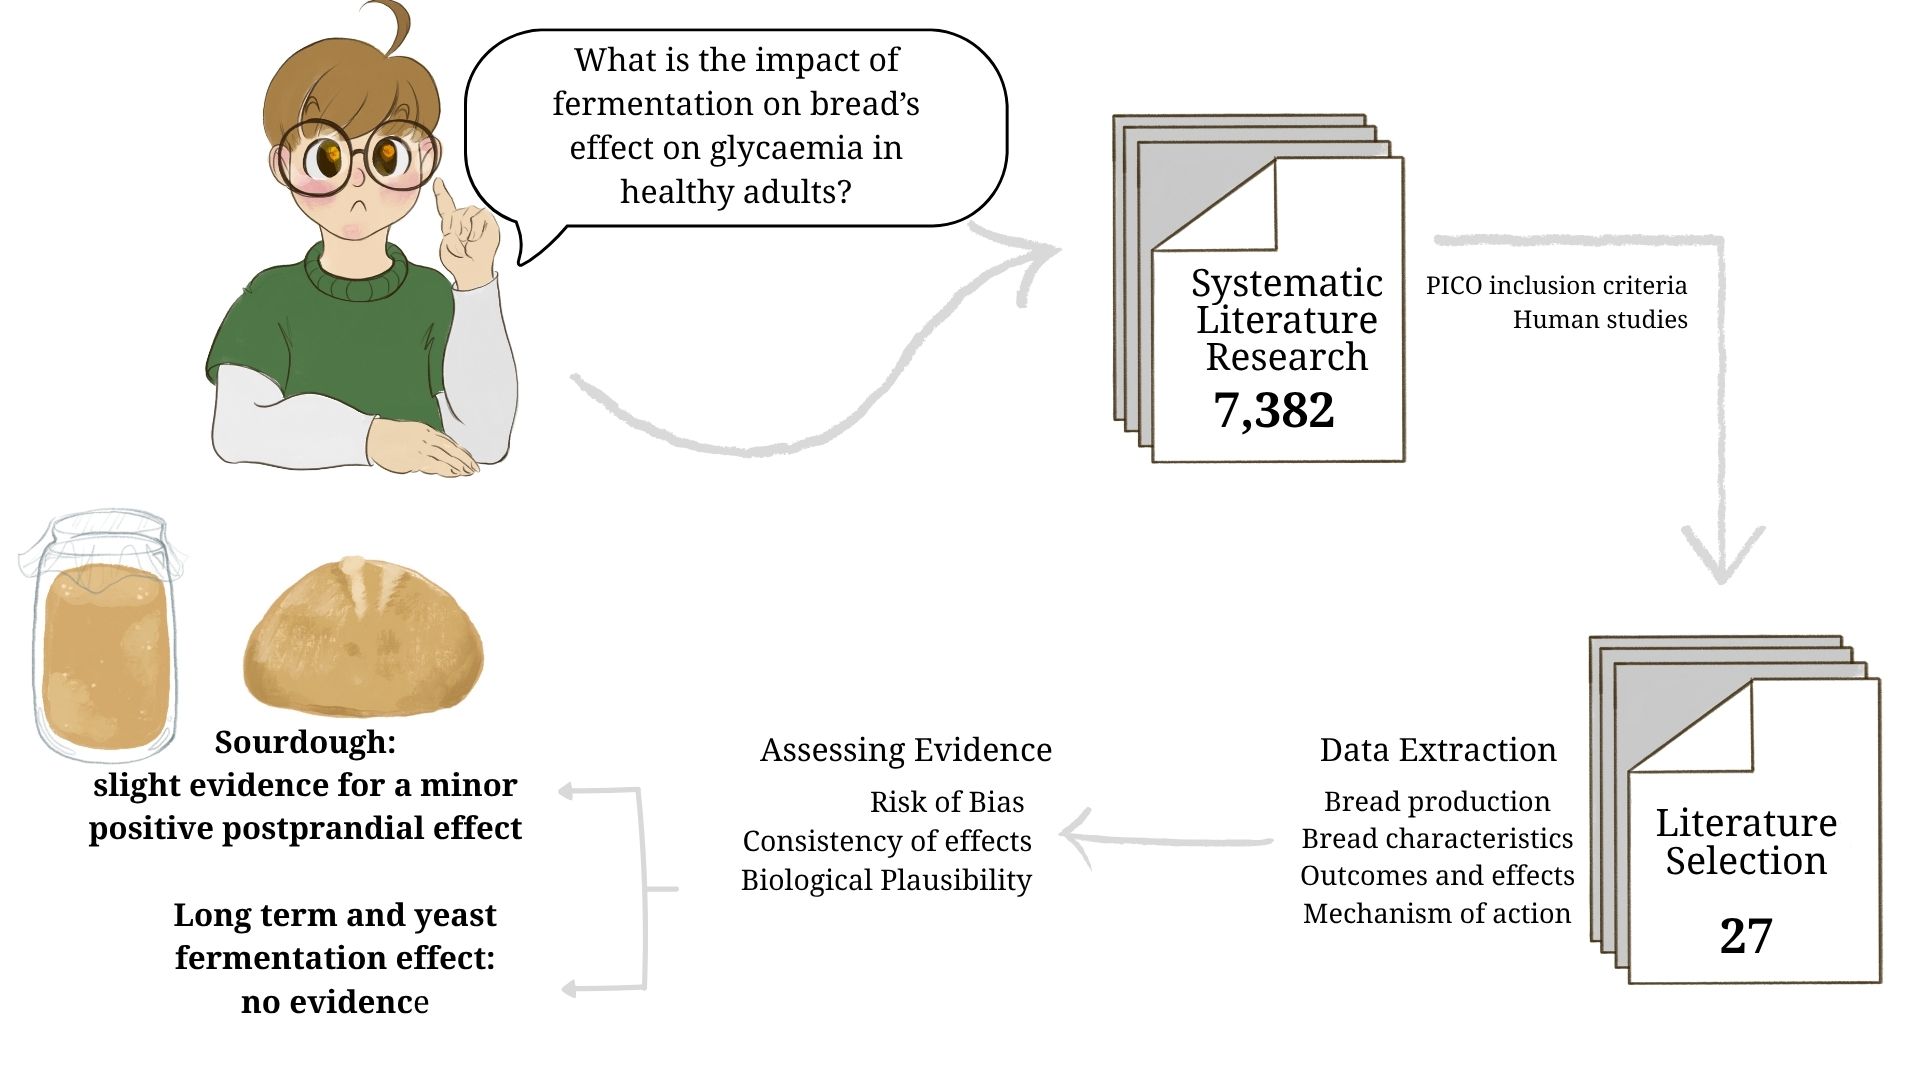
Bread is an important source of energy and is ubiquitous in human diets. As a carbohydrate-rich food, it is often considered to impair glycaemic homeostasis; however, clinical and molecular evidence suggests that its effects may vary depending on characteristics of bread consumed. In particular, sourdough-fermented bread has been proposed to exert potentially beneficial effects on glycemia via a shift in the metabolites present in the food matrix as well as chemical and physical changes that take place during fermentation. However, evidence from human interventional studies on this topic is inconsistent due to differing experimental design, heterogeneous populations or focusing exclusively on sourdough fermentation not considering the effect of yeast fermentation. Our objective was to evaluate the evidence for a positive effect of fermented bread consumption on glycaemia and insulinaemia in healthy adults. To this end, we conducted a systematic review to identify and analyse relevant human studies, complemented by a characterisation of the breads investigated and a discussion of possible mechanisms of action, following the framework required for an EFSA dossier. We identified 27 studies that met our inclusion criteria. Taking into account the risk of bias in these studies, the consistency of the reported effects, and the biological plausibility based on food characteristics and potential mechanisms of action, we conclude that the available evidence for a beneficial effect of sourdough compared to yeast-fermented bread on glycaemic and insulinaemic homeostasis in healthy individuals is neither sufficient nor convincing. For the general effect of fermentation on glycaemic and insulinaemic homeostasis in healthy individuals, evidence is considered very low.
Keywords:
bread
; sourdough
; fermentation
; glucose response
; insulin sensitivity
; systematic review
1. Introduction
Fermented foods (FFs) constitute a diverse and ancient category of food products that are produced via the controlled activity of microorganisms (bacteria, yeasts or molds), acting on raw food materials of both plant and animal origins (including cereals, legumes, vegetables, roots and tubers, milk, meat or fish). Defined as “foods made through desired microbial growth and enzymatic conversions of food components” [1], FFs have been used in human cultures worldwide for millennia. The fermentation process extends shelf-life, influences flavours, aromas, textures and modifies the nutritional and functional characteristics of foods. Microbial metabolism transformations involve biochemical changes that contribute to food safety by inhibiting spoilage and pathogenic organisms while also improving nutrient bioavailability, reducing anti-nutritional factors and generating compounds with potential health benefits. Therefore, FFs hold a unique position as both traditional dietary components and objects of renewed scientific interest and investigation, being increasingly recognised for their roles in modulating the gut microbiota, supporting metabolic health and contributing to the prevention of chronic diseases, including type 2 diabetes mellitus (T2D) [2].
The increasing prevalence of T2D represents one of the most critical public health challenges of the 21st century, placing a considerable burden on healthcare systems worldwide [3,4]. T2D is characterised by chronic hyperglycaemia resulting from impaired insulin action and secretion. The condition is driven by a complex interplay of genetic, metabolic and lifestyle factors, with dietary factors playing an important role in the disease pathogenesis and development. According to the World Health Organization, the diagnosis of T2D is established by elevated fasting plasma glucose or abnormal glucose tolerance [5]. As rates of T2D continue to rise globally, a lot of research has been invested to identify dietary strategies for prevention or delay of the disease onset, among healthy individuals and particularly populations at increased risk of T2D, such as those with prediabetes or obesity. Carbohydrate quality and consumption, are important dietary components implicated in risk [6,7] and management of T2D [8,9]. Of the different dietary sources of carbohydrates, bread is widely understood to induce rapid rises in glycemia and indeed white bread is often used as the reference (in place of glucose) for assessing glycaemic index (GI), a measure indicating the rise of blood glucose in the 2 hours following consumption of the food [10]. In this context, understanding the glycaemic impact of different breads particularly in relation to processing and fermentation methods, is essential for dietary management. The practice of fermenting grains to produce bread has historical roots, with both baker’s yeast and sourdough breads consumed across cultures for millennia. While some breads are processed without a fermentation step (e.g., soda bread), fermentation of bread is common, improving sensory properties, shelf-life, nutrient bioavailability of bread, and generating bioactive compounds that alter carbohydrate structure in ways that may positively affect postprandial metabolism [11]. A number of systematic reviews have already considered the growing body of evidence investigating different types of fermented breads on glycaemic control and insulin sensitivity [12,13,14]. However, these previous reviews often pooled broad study populations and diverse bread types, comprising different cereal or fibre contents. Such an approach prevents solid conclusions from being made for healthy people and makes the role of fermentation itself in the observed effects difficult to elucidate.
The present review attempts to address the challenges in this research topic by first characterising bread, its constituents and modes of production, and how these might explain purported effects on glucose homeostasis, then using a systematic approach to search for relevant clinical trials investigating the effects of fermented bread on glycemia, and finally reporting on possible mechanisms of action underlying the observed effects. Using key outcomes of glucose homeostasis such as fasting blood glucose, insulin sensitivity, postprandial glucose and insulin responses, we sought to determine whether regular consumption of fermented breads can support metabolic health in healthy adults, including obesity and pre-diabetes to reflect populations at risk of T2D. Within this overarching aim we examined three specific research questions: does the type of fermentation influence the effects of bread on glycaemia (i.e., mainly sourdough versus yeast-based fermentation)? Does fermentation impact the glycaemic effects (i.e., fermented bread versus non-fermented bread or other kind of cereal-based food)? Does the consumption of specific breads affect glycaemic parameters considering both differences captured by low versus high intakes and changes between pre- and post-intervention? Through this comprehensive and systematic synthesis, we intend to clarify whether fermented breads offer measurable benefits for glucose regulation in healthy adults and to provide evidence that may inform both clinical nutrition practice and public dietary recommendations.
2. Methods
This review was conducted following a generic search strategy, developed within the COST Action CA20218 Promoting Innovation of ferMENTed fOods PIMENTO initiative detailed in a corresponding position paper [15], and in agreement with the EFSA guidances [16,17]. This review is structured in three main parts, (i) a systematic review of human studies in accordance with published guidelines [18] as well as (ii) complementary parts on food characterization and (iii) mechanism of action. The review protocol, including specific search terms and strategy, was registered in the Open Science Framework (OSF protocol, DOI: 10.17605/osf.io/qrza3).
2.1. Systematic Review of Human Studies
2.1.1. Literature Search
A literature search was conducted using Medline, Cochrane, and Scopus. The search was limited to English-language studies and used predefined strings (see Supplementary Material 1). The studies included in this review were identified through (i) selection of articles that met the predefined eligibility criteria aligned with the P/I/C/O (Population, Intervention, Control, Outcome) framework (no exclusion criteria on study design), (ii) screening of relevant systematic reviews for possibly missed studies meeting the same criteria, as shown in the flow diagram (Figure 1). From 7,382 initial records (post-deduplication), 1,660 met PIO (Population/ Intervention/ Outcome) criteria based on title and abstract. After full-text assessment applying refined inclusion criteria, 314 entries were retained.
The selection was further narrowed to 65 articles focused on bread as the fermented product of interest. Of these, eighteen included an appropriate control but two used exactly the same data from one trial, so one of these was excluded and seventeen were retained for this review.
An update of the search (from September 2023 to January 2025), focusing on fermented cereals only, retrieved 329 new entries (317 after deduplication), resulting in fourteen full-text eligible studies and one meeting full PICO (Population/ Intervention/ Control/ Outcome) criteria.
Review articles were retained at the screening stage if they addressed related topics, allowing for the identification of missed pertinent primary studies: Systematic reviews identified during the search contributed fifteen entries meeting the PIO framework; nine met the full PICO criteria and were included.
2.1.2. Selection Criteria
Eligibility according to the PIO criteria was assessed using CADIMA, an open-source platform designed to support systematic literature reviews and evidence mapping [19]. Two reviewers screened independently the studies and resolved discrepancies through discussion, involving a third reviewer in case of conflict. Inclusion was limited to original studies involving, at least in part, healthy or prediabetic adults, but no athletes or pregnant women. Additionally, only participants without regular use of medications were eligible, with exceptions for contraceptive pills, postmenopausal hormone treatment and well-adjusted thyroid hormone therapy. Studies with blood measures of glucose or insulin homeostasis were selected.
The intervention or exposure was initially defined as the oral intake or consumption of any type of fermented food (FF), or instances where FF consumption could be derived from dietary questionnaires. Interventions were excluded if FFs were mixed with other components that prevented the effect of the FF to be isolated/assessed independently. Also, studies testing only probiotics (without a FF matrix, or without a direct participation in the fermentation of the food matrix) or only an extract from the FF were excluded, as we were interested in the effect of the whole food. Non-oral applications were not considered. Outcomes of interest were defined as measures related to glucose or insulin homeostasis, or, at a minimum, the collection of relevant blood samples indicative of metabolic responses. In a second step, we focused our search on studies assessing bread. Eligible controls for fermented breads were defined as non-fermented cereal products (e.g., pasta, porridge, unfermented bread), providing that they used the same cereal and flour type. Comparisons of leavening method such as yeast-fermented vs. sourdough breads, were also eligible where breads were produced using similar flour/cereal. ‘Long-term’ intervention studies offering a before/after intervention comparison were accepted in the absence of a proper control. Studies that only compared breads to glucose drinks were excluded. Observational studies employing dietary questionnaires comparing high vs. low intake of bread were retained unless it was impossible to discern fermented food consumption (i.e., described only within broader categories such as cereals). Primary outcomes of interest were measures related to glucose homeostasis or insulin, including both postprandial responses for short term studies and fasting values for long-term studies, such as HbA1c, or different measures of insulin sensitivity. Therefore, studies without collection of relevant blood samples indicative of metabolic response analyses were excluded, at the level of abstract screening. Incidence of T2D alone was, however, not a valid outcome for inclusion at full text level screening. Additionally, studies addressing diabetes incidence or risk were included provisionally at abstract level, pending full-text evaluation for relevant glucose or insulin data. Studies assessing glucose changes solely during exercise were excluded. At full text level, studies assessing the GI of breads when a valid control was present were also taken into consideration.
Data on adverse effects for assessment of security safety and effects on gut parameters for possible mechanisms of action were noted when available.
2.1.3. Data Extraction
A standardized data extraction form was used. Each study was independently reviewed by two researchers. Discrepancies were resolved by discussion. Extracted data included general information on the study such as study design, participant characteristics, and location of the study. Additionally, details about the fermented bread and the control used were extracted, the outcome measures and the effect detected. Depending on the type of control identified, studies were clustered for each of the three specific research questions. Finally adverse events, and mechanistic hypotheses described in the studies were collected.
2.1.4. Risk of Bias (RoB) and Quality Assessment
For each included study the risk of bias using the “Revised Cochrane risk-of-bias tool for randomized trials (RoB 2) [20] was evaluated. The outcomes were visualized using Robvis [21].
Potential sources of bias across multiple domains were considered, including the randomization process, period and carryover effects, effect of adhering to interventions, missing outcome data, outcome measurement, and the selection of reported results. Each domain was evaluated independently by two researchers, and an overall risk of bias judgment was subsequently assigned to each study, resolving discrepancies by discussion.
2.1.5. Data Synthesis
A descriptive synthesis was conducted. Due to heterogeneity in study designs and outcomes, meta-analysis was not performed. The strength of the evidence was assessed from the identified studies with respect to each of our questions, pooling all considered glycaemia/insulinaemia outcomes together to identify any effect on glucose metabolism in general. Criteria that were applied consisted in the number of studies identified, their quality (considering the RoB assessment) and the consistency of the effects observed, in a modified form of the GRADE approach [22]. Four levels of evidence were considered: (i) a high level (strong evidence), if more than 10 randomized control trials (RCT) were found, with the majority displaying a low-risk of bias evaluation and none a high risk and the vast majority reporting a consistent effect; (ii) a moderate level if at least 10 human studies (RCT or cohort studies) were available, with a maximum of one study with a high-risk of bias and the majority reporting a consistent effect; (iii) a low level of evidence if at least 10 human studies (RCT or cohort studies) were available, a minority displaying a high RoB and a majority reporting a consistent effect; (iii) a very low level of evidence if either only few human studies were found, and/or most identified studies showed a high RoB and/or no consistency in the reported effects were found.
2.2. Non-Systematic Parts of the Review
These complementary sections of the review address important parts of an EFSA dossier.
2.2.1. Characteristics of the Fermented Foods
Narrative synthesis was used to describe product characteristics using data from included studies and complementary sources (e.g., Codex Alimentarius, AACC standards). Attributes such as fermentation type, microbial strains, processing parameters, physical quality characteristics, proximate composition and bioactive components possibly affecting glycaemic responses were also included.
2.2.2. Supportive Evidence: Mechanism of Action and Bioavailability
Similarly to the product characterization, we screened selected studies for information on possible mechanisms of action and bioavailability of bioactive compounds, and complemented them with additional literature, particularly adding animal and in vitro studies which offered a deeper understanding of the involved mechanisms, including the potential role of the gut microbiota in mediating the effect of bread on glycemia, as well as bioaccessibility and absorption of bioactive compounds from bread.
2.2.3. Safety of Fermented Foods
We screened all included studies for adverse effects reported and complemented this information with additional relevant literature.
2.3. Summary of the Systematic and Non-Systematic Parts of the Review
We evaluated the current collective evidence using systematic and non-systematic parts of this review, taking into account the results for the human study search, the coherence/plausibility of the observed effects, and the characteristics of fermented breads. Therefore, three levels of overall evidence were defined: (i) a high level of evidence (“convincing and sufficient”) if strong evidence was found from the all human studies, the mechanism of action pathways are plausible and bioactive compounds are well described; (ii) a low level of evidence (“neither convincing nor sufficient”) if there was either a strong evidence from human studies but lack of knowledge upon pathways and/or bioactives or a low/very low evidence from human studies but well characterised bioactives and pathways; (iii) a very low level of evidence (“no or very limited”) if both the evidence from human studies was very low and the characterisation of bioactives and pathways was limited.
3. Results and Discussion
To understand how bread consumption could affect glycaemic regulation, we first summarize the characteristic of bread as a food type, then analyse the systematically selected human studies and report on possible mechanisms explaining the observed effects.
3.1. Characterisation of the Food/Constituent
3.1.1. Food Description
Bread is a staple food consumed daily by billions of people worldwide. In many societies, bread is the primary source of carbohydrates as it is easily accessible and inexpensive. Bread is a bakery product; the dough of bread is prepared primarily from flour of cereals and water, with the addition of one or more leavening agents (biological or chemical), and salt. Although Codex Alimentarius does not provide an explicit definition of bread, it classifies bread and similar bakery products under the category “bread and ordinary bakery wares” (Category 07.1) within the General Standard for Food Additives (GSFA). This classification includes specific allowances and restrictions regarding food additives, reflecting bread’s role as a fundamental dietary staple. EU Food Categorization (Annex II of Reg. 1333/2008) classifies bread under Bakery wares – Bread and Rolls as products prepared mainly with cereal flour or cereals that have undergone a treatment, such as baking, steaming or extrusion.
Considering breads that use biological leavening agents, two subtypes of bread can be defined: bread fermented by baker’s yeast and bread fermented using sourdough. Baker’s yeast fermented bread is typically produced from refined wheat flour, water, Saccharomyces cerevisiae, and salt. It is leavened using baker’s yeast and undergoes a relatively short fermentation time. The use of S. cerevisiae as the primary leavening agent in industrial bread production is due to the prioritisation of consistency, speed and uniform texture and flavour.
Sourdough bread is leavened by fermentation with lactic acid bacteria (LAB) and yeasts, either spontaneously or using a starter culture. It has a longer fermentation period than bread produced using baker’s yeast. This typically results in a sour flavour and alters the nutritional profile by producing a range of bioactive compounds that are absent in breads fermented using only baker’s yeast [23]. The microbiota involved in sourdough fermentation varies depending on the ingredients and fermentation conditions, but typically includes species such as Fructilactobacillus sanfranciscensis, Limosilactobacillus fermentum, Lactiplantibacillus plantarum and Levilactobacillus brevis along with yeasts including S. cerevisiae, Candida milleri [24,25]. Recently, a starter culture containing the LAB Companilactobacillus crustorum LMG 23699 and the yeast Wickerhamomyces anomalus IMDO 010110 has been developed for sourdough fermentation [26].
Bread is primarily made from wheat flour (refined or whole; [27,28,29,30,31,32,33]. Additionally, various grains such as rye, barley, oats, millet, spelt, and rice are also incorporated in bread formula [25,29] 34-41]. To enhance quality characteristics and nutritional profile of bread, additional ingredients may be introduced such as malt, ascorbic acid, gluten, flour from pulses, milk powder, flaxseed, semolina, β-glucan, starch, fat, olive oil and sugar [31,35,42,43,44]. The yeast leavened bread may also be acidified by lactic and acetic acid to replicate sensory properties of sourdough [29].
3.1.2. Production Methods
Both S. cerevisiae and sourdough fermented bread involve similar processing steps including mixing, kneading, proofing and baking. However, sourdough bread production includes a longer fermentation period, because sourdough is a co-ferment and the sourdough microbiota requires a relatively long time to adapt [11].
In the industrial process of baker’s yeast-leavened bread, all ingredients like flour, water, S. cerevisiae and salt are mixed to obtain dough prior to proofing. The dough is then kneaded for approximately 5-7 min, followed by a bulk proofing lasting 20-45 min at 28-38 °C and 80-85% relative humidity. After bulk fermentation, the dough is divided, shaped, and subjected to a final proofing stage for 30–60 min at 34–38 °C, maintaining similar humidity levels [29,38,43,45]. Baking is typically carried out at temperatures between 175–250 °C for 20–45 min, depending on the type and size of the bread [38,43,45,46]. To produce a glossy and well-developed crust, a short burst of steam is often applied at the start of baking. Some specialized methods use a single high-temperature holding step (e.g., at 70 °C for about 1 h), followed by baking at lower temperatures such as 165 °C [33]. Achieving consistent and standardized quality is generally more straightforward in bread leavened with baker’s yeast due to its uniform microbial composition.
In sourdough bread production, the basic processing steps are similar to those used in bread fermented by baker’s yeast. However, there is no standard formula or procedure for sourdough fermentation, which leads to significant microbial variation in the sourdough culture. Factors such as the type of flour, water quality, and fermentation temperature contribute to variability in microbial growth, leavening performance, and formation of bioactive compounds, all which in turn influence the final product characteristics and therefore its potential health impact, sensory properties and shelf life.
There are two broad types of sourdough ferment. Type 1 sourdough is the spontaneous fermentation of a mixture comprising flour and water at ambient temperature. Within this type of sourdough ferment, the fermentation process necessitates daily ‘feedings’ at a specific ratio of flour suspension, and it is continued until the pH level reaches approximately 4.0 ± 0.2. The production of type 1 sourdough typically requires a period of 7–15 days [41,47]. Type 2 sourdough ferment aims to expedite the fermentation period by specific LAB and yeast culture. In type 2 fermentation, the desired pH level is achieved within 24-48 h without daily feeding [24,26,48].
Following sourdough ferment preparation, sourdough is incorporated into the final dough mixture along with the remaining bread ingredients and is kneaded. Afterwards, the dough is subjected to a two-step fermentation process. First, bulk fermentation is carried out for approximately 60-120 min at a temperature of 28-29 °C and 66-80% relative humidity, allowing for the initial development of gas retention and flavour compounds [31,42]. After this stage, the dough is divided and shaped, followed by a second proofing phase lasting 30-180 min at 30-38 °C and similar humidity levels [31,41,42]. The proofing period can be reduced to 60 min by using Baker’s yeast in addition to sourdough [24]. Finally, the fully proofed dough is baked at temperature varying between 165 and 250 °C for 30-80 min, depending on loaf size, dough composition, and the desired crust and crumb characteristics [28,29,30,31,33,38,40,42,43].
3.1.3. Analytical Methods
Processing and type of ferment used can alter crumb structure, texture, composition and bioavailability of different compounds in bread, which might affect the glycaemic responses to bread consumption[41].
The main quality characteristics of bread fermented with both sourdough and baker’s yeast include a high specific volume, a brown and glossy crisp crust and a soft and chewy crumb, with a homogeneous structure with small and homogenous pores. Specific volume is measured by calculating the ratio of bread volume (mL) to weight (g) using the rapeseed displacement method AACC 10.05.01 [49]. Porosity and internal microstructure can be examined via X-ray imaging, assessing air cell distribution, integrity of the protein matrix, and the extent of starch gelatinization [43]. Another physical quality measurement technique is texture profile analysis, which uses a texture analyser to evaluate hardness, springiness, cohesiveness, chewiness and resilience of bread crumbs [50].
The physical and microstructural properties of bread play important roles in determining starch digestibility and influencing glycaemic response. Zamaratskaia et al. [41] reported that white bread exhibited greater starch gelatinization and amylose leakage compared to sourdough bread. Furthermore, in the same study rye crispbreads were characterised with a more heterogeneous structure, with bran fragments dispersed throughout the matrix. These fragments were notably larger in unfermented samples than fermented ones. In addition, lamellae in crumb of yeast-fermented wheat and unfermented rye crispbreads were thinner than those observed in sourdough-fermented rye crispbreads. These structural distinctions were proposed by Zamaratskaia et al. to contribute to a slower disintegration rate, increased viscosity, and the presence of larger particles in the digesta of unfermented rye crispbreads, which can ultimately result in delayed glucose absorption and a reduced insulin response. Moreover, increased bread crumb firmness was associated with limited starch digestibility, potentially due to enhanced agglomeration and crystallinity of starch fractions. The development of compact amylopectin–amylose networks may further limit the susceptibility of starch to amylolytic enzymes and hinder enzymatic penetration [51]. Additionally, specific microstructural features such as a dense matrix and an amylose layer surrounding starch granules are thought to play a key role in reducing starch accessibility and digestibility [41].
The chemical composition of bread is determined using standardised analytical methods. Total protein content is quantified by the Kjeldahl method (Method no: 46.12.01), total fat content is measured using ether extraction (Method no: 30.10.01), and total ash content is determined by incinerating the sample at 575-590 °C until a constant weight is obtained (Method no: 08.01.01) 01 [49]. Starch (Method no: 76.13.01), dietary fibre (Method no: 32.07.01), resistant starch and β-glucan content (Method no: 32.22.01) are highly correlated with glycaemic response of bread and they are assessed using the enzymatic hydrolysis methods 01 [49]. Furthermore, fermentation has been shown to increase the content of some bioactive compounds such as phenolic compounds which may contribute to lowering glycaemic and insulin responses [52].
The interactions between starch and different components such as lipids, organic acids, or polyphenols decrease the digestibility rate of starch since these compounds limit the accessibility of amylolytic enzymes to amylose/amylopectin or inhibit amylase activity [53], and their quantification in the breads is therefore important. In sourdough bread, fermentation leads to a decrease in pH and an increase in organic acids concentration, mainly lactic and acetic acid. Therefore, parameters such as pH, total titratable acidity, lactic acid and acetic acid are routinely monitored in sourdough bread. The pH value is measured by a pH meter, and the titratable acidity is determined by titrating a homogenised sample with 0.1N NaOH (Method no: 02.31.01) [49]. Organic acids are quantified by High-Performance Liquid Chromatography (HPLC) [25].
The acidity in sourdough bread contributes to the compositional changes that result in its low GI. The presence of organic acids in sourdough reduces the starch hydrolysis rate by promoting interactions between starch and gluten during starch gelatinization. Moreover, the presence of organic acids supports the debranching of amylopectin moieties during baking and debranched amylopectin may induce a high level of resistant starch. The resistant starch can in turn surround starch granules and form a physical barrier against enzymatic attack by α-amylase [46,54]. Moreover, the organic acids generated in sourdough fermentation could affect satiety by delaying gastric emptying [41,55].
A further characteristic of bread that should be analysed to understand its impact on glycaemia is the solubility of its constituents. Sourdough fermentation, besides increasing resistant starch content as mentioned above, also leads to increased solubility of dietary fibre and protein, and decrease molecular weight of β-glucans in bread [41,56,57]. Higher solubility and lower molecular weight of dietary fibres could increase their fermentability in the colon, which may contribute to increased satiety [41]. On the other hand, high molecular weight of soluble fibre contributes to increased digesta viscosity, which might reduce gastric emptying rate and the digestion and absorption rate of nutrients [28,41].
3.2. Identification of Pertinent Human Efficacy Studies
3.2.1. Overview of Identified Studies
To answer the three specific research questions about the effect of bread consumption on glycaemia, studies from the literature based on pre-defined PICO criteria were selected. Checking them first only for PIO criteria allowed us to identify 65 studies, from which only 27 were included. The main reasons for exclusion at this step were that the effect of bread was compared to a glucose solution. As we wanted to identify the effect of fermented bread as a whole and not the effect of fibre specifically, studies directly comparing two breads only differing in their fibre content were not included, except for long-term studies, in which a change in glycaemia for each bread separately between start and end of intervention was considered.
A criterion on the study design was not defined, as different types of studies could potentially help answer our questions. However, the studies that were included were exclusively intervention studies. The main reasons for the absence of observational studies, were that bread was often pooled in one category with other cereal products, mostly separated into refined and wholegrain, precluding the analysis of the effect of bread alone, and that the outcome assessed was typically the prevalence of T2D without a direct measurement of blood parameters of glycaemia and insulinaemia.
Population:
Following the EFSA guidelines, we considered studies with healthy participants. However, the population characteristics still varied between the studies as we defined ‘healthy’ as not taking medication (with specific exceptions) and the absence of a diagnosed disease. However, we included studies in participants with a high BMI or those with pre-diabetes. Among the 27 selected studies 23 comprised healthy participants, two studies involved participants with pre-diabetes/impaired glucose tolerance and two healthy and prediabetic (one separately, one as a mixed population).
We found 21 studies from Europe (eleven from Nordic countries), three from North America (Canada), one from Middle East, one from China and one from New Zealand, revealing an uneven distribution of data from different continents, not directly related to the importance of bread in the local nutrition.
The mean size of study population considered was rather small (n= 18.1), ranging from 6 participants to 64 participants. Both sexes were represented, either in mixed populations (24 studies) or in studies with only male participants [31,43] and a unique study focusing on postmenopausal women [58]. This led to a total number of 488 participants, among them at least 237 female and 190 male participants (the exact distribution of sex in several studies was not reported).
We considered only adult populations, and therefore all included studies had participants aged above 18. Still, the mean age and the range of age for participants varied between studies (from 22.1 ± 3.6 up to 60.1 ± 12.1 y.).
Outcomes:
Most studies (n=24) assessed both glucose and insulin or C-peptide, some calculated additional parameters of such as insulin resistance or sensitivity, and a few measured other glycaemia related parameters (such as fructosamine, glucose-dependent insulinotropic polypeptide (GIP) or glucagon-like peptide-1 (GLP-1)). Most studies reported postprandial effects on glycaemic parameters after either the intake of a piece of test bread only or a standardized meal containing the test bread (n=20), while one study reported on similar responses after a standard breakfast following an evening meal with the test bread [59]. Only seven studies reported on long-term effects of daily bread consumption, replacing usual bread and/or cereal products by the test bread within the usual diet.
Intervention:
All selected studies were intervention studies in which participants consumed different kinds of bread, during one meal (post-prandial focus) or over several days (from 1 to 12 weeks). Most studies used a cross-over design.
We could assess different aspects of the effect of fermented bread on glycaemia depending on the control used in the studies. We identified twelve studies that compared yeast fermented with sourdough fermented breads based on the same cereal/flour quality, which allowed the effect of the type of fermentation to be evaluated. Ten studies deliver insights on the general effect of fermentation, comparing fermented bread to unfermented cereal products such as unfermented bread, pasta or porridge. Finally, we identified six studies that used long-term interventions allowing a comparison of glycaemic parameters before and after consumption of the tested breads without control
3.2.2. Impact of the Type of Fermentation on the Glycaemic Effects of Bread
Of the twelve studies comparing a sourdough with a similar yeast bread (Table 1), only one intervention did not consider an acute, postprandial response, instead testing the effect of four weeks of daily consumption of the breads [25]. All other studies assessed the postprandial responses after consuming the test breads, either alone (with only a glass of water) or as a breakfast (including same toppings/drinks between groups) [46,60,61]. Test bread portions were mainly matched for carbohydrate content (50g), whereas in three cases test breads were matched on weight per portion (100g for Maioli et al. [61], 126g for Darzi et al.[60] and 150g for Chatonidi et al. [26]). Most studies considered breads made from wheat flour only (n=8), including whole grain flour, white flour or both. One study assessed the effect of gluten-free breads based on rice, corn and buckwheat [24], one study used mostly barley with 20% wheat [46] and another wheat semolina and 30% corn [61] to produce their breads. In one study the information on the type of flour (white or whole meal) was missing [25]. Considering the characterisation of the breads, all included studies gave some information on the chemical composition of their bread, mostly nutritional composition or, for six studies pH or organic acids [24,26,31,46,60,61]. Only Pagliai et al. reported on microbiological analyses of their sourdough [25]. Scazzina et al. [62] and Liljeberg et al. [46] both analysed the in vitro digestibility of starches from their breads, whereas Maioli et al. [61] reported on microstructural analyses using electron microscopy and Novotni et al. [24] on several physical parameters (specific volume, crumb firmness, viscosity).
All twelve studies measured a glycaemia parameter, three also calculated the GI of tested breads [24,45,47] and seven measured an insulinaemia parameter, either C-peptide [26] or insulin [28,31,42,46,60,61]. Pagliai et al. reported that the change in fasting blood glucose (FBG) after a 4 week-intervention was not significatively different between the two groups, even if FBG increased after consumption of the yeast bread while no significant changes on FBG were observed with the sourdough treatment [25]. Among the postprandial response studies that calculated the GI of breads, differences were observed depending on fermentation method in two studies. An incremental effect was observed by Novotni et al., who tested different quantities of sourdough added to a standard yeast-based recipe and, found a significantly lower GI with 15% and 22,5% of sourdough, when compared to a yeast-fermented bread with no sourdough [24]. Similarly, Borczak et al. found a lower GI for their sourdough bread than the yeast control [45]. In contrast, Fredensborg et al. did not identify significant differences between breads prepared using different leavening agent (backer yeast, desem, sourdough) [47].
Differences in other measures of the glucose response based on bread fermentation method were also reported with only Darzi et al. noting no significant difference between control yeast and sourdough bread. All of the other studies found either a significantly lower overall response for sourdough vs yeast bread [31,42,45,62], or at least at some specific time points [24,26,28] or for partial Area Under the Curve (AUC) [46,61].
From the seven studies reporting on insulinemia response, only Najjar et al. and Darzi et al. did not find any significant difference between breads using sourdough and yeast. The other five studies reported significantly lower insulinemia responses after sourdough than yeast breads, at least for some specific time points during the postprandial response [26,28,42,46,61].
Within this specific question of the effect of type of leavening, only Najjar et al. reported on incretin release, measuring both GIP and GLP-1, which stimulate insulin production. Interestingly, even if in their study no significant differences in insulin release or calculated insulin sensitivity were found, the overall response of GLP-1 was significantly lower for sourdough than for yeast and the second meal response of GIP was also reduced after sourdough compared to after yeast bread.
In total ten of the twelve studies, or five from seven, reported some positive effect on glycaemia, or insulin responses respectively, for sourdough compared to yeast bread consumption.
3.2.3. General Impact of Fermentation on the Glycaemic Effects of Bread
From the ten studies comparing fermented bread to a non-fermented control, four used a non-fermented flat bread [27,41,43,63], four used pasta [35,43,59,64], two porridge [36,39] and one boiled kernel [38] as control products (Table 2). The fermented breads were all produced using yeast, except for one study in which a sourdough bread was compared with an unfermented bread [41). Cereals used for the food item preparation differed between studies, wheat [27,35,39,43,59,64] and rye [38,39,41,63] being the most common, with only one study using barley [36]. Similarly, the content of fibre in the test products differed between studies, some comparing food items with white flour without fibre [27,35] or with addition of dietary fibre [43,59] or whole grain flour [36,38,41,63] or both [39,64]. We only considered comparisons between food items from similar composition (cereal type and fibre content). All studies reported on the nutritional composition of the breads, with more or less details on fibre and starches, and for Zamaratskaia et al., on organic acids [41]. Only Rosen et al. performed an in vitro starch hydrolysis in both their studies [38,39]. Only Eelderink et al. analysed the microstructure of their breads (density, porosity) [43].
All studies assessed the postprandial response after a breakfast containing the test products, and, in the case of Liljeberg et al. [35], also after a standard second meal, with the exception of Nilsson et al., who assessed the response after a standard breakfast following an evening meal made of the test products [59]. Test breads were consumed as part of a breakfast, mainly with cheese, in six studies [35,36,41,43,63,64]; in the four other studies they were only accompanied by a glass of water. Most studies adjusted the quantities of tested food to a defined quantity of available starch (from 30 to 50 g) [27,35,36,38,39,43,59,64].
All ten studies measured a postprandial glucose response, five calculated the GI of tested breads [27,35,36,38,39] and eight also measured the insulin response.
The four studies comparing fermented bread to unfermented bread showed variable results. While two studies did not report any significant difference for the glucose response despite a lower insulin response (AUC) after consumption of the unfermented crisp breads compared to either yeast [63] or sourdough fermented breads [41], Eelderink et al. found a lower insulin response (AUC, different time points, peak value) and a lower glucose peak value after unfermented bread consumption [43]. In contrast, fermented arabic bread was found to have a lower GI than unfermented regag bread [27].
Of the four studies comparing fermented bread to pasta, three reported significantly higher postprandial responses after bread consumption: either in glucose peak value [43], total AUC or time-point values for both refined and whole grains [64], or GI and second-meal responses [35]. Similarly, two of these studies, which also assessed insulin showed significantly lower insulin responses after pasta than after bread consumption either as whole AUC [43] or as insulin index at different time points after the second standard meal [35]. In contrast Nilsson et al. did not find a significant difference, neither in glucose nor in insulin response to a standard breakfast following an evening meal containing the test foods [59]. The time between the evening meal and the test breakfast of the study by Nilsson et al. [59] was however longer than the time between the test breakfast and the standard midday meal of the study by Liljeberg et al. [35], which might explain different results observed. Generally, it seems that pasta is rather more favourable than fermented breads on acute glycaemic responses, which is probably due to their high content of resistant starches.
We found two studies meeting our criteria that compared fermented breads to porridges. Both showed a significantly lower insulin response for the breads in the early phase (AUC 0-30 min.), compared to the porridges, with a lower peak value for endosperm rye bread [39] and a lower insulin index for high-fibre barley bread [36]. Whereas the insulin changes were not accompanied by a significant difference in glucose response for Liljeberg et al. [36], Rosén et al. found lower early response (AUC 0-30 min.) of glucose for their rye breads compared to the rye porridges [39].
Finally, Rosén et al. compared a fermented bread to boiled kernels (both prepared from whole grain rye), and did not detect any significant difference in the glucose response (GI, peak glucose and AUC) but found a significantly higher late insulin response (AUC 120-170 min.) for the kernels [38].
To summarize, the effect of fermented bread compared to unfermented cereal products on glycaemia is not generalizable. Few studies compared fermented with unfermented breads limiting the direct assessment of a generic fermentation effect. Where suitable comparators were described, the effects on glycaemia were conflicting and inconsistent perhaps due to specific characteristics of the test products selected. Whereas, most unfermented breads and pasta produced lower glucose responses, particularly on insulin responses, porridges and boiled kernels could be less favourable than fermented breads. Still for each case, the number of studies is too low to draw a clear conclusion.
3.2.4. The Effect of Fermented Bread Consumption on Glycaemia
Finally, we analysed the overall effect of fermented bread consumption, instead of focusing solely on comparisons with unfermented cereal foods or between different fermentation types.
As no observational study comparing low versus high consumption of bread was identified, applying our other selection criteria, we considered studies for which data was available for before and after a longer intervention were identified (Table 3). Even if effects observed in such before-after comparison without a control group eating no bread or a different quantity are to be interpreted carefully, we chose to comprehensively review all relevant evidence. From the six longer intervention studies identified, most tested at least one wheat-based bread [25,33,44,58,65], two considered high fibre/whole grain rye bread [58,65] and one a foxtail millet bread [37]. Nutritional composition of the bread was given only in three studies [44,58,65]. Organic acids and microbial composition were analysed only in Pagliai et al. [25], whereas Todesco et al. reported upon in vitro starch digestion analyses of their breads [33] and Ren et al. referred to previous work for similar analyses [37].
The period for which the participants had to consume the tested bread daily ranged from one week [33] to twelve weeks [37]. The daily dose of bread was either the same for each participant (from 90 g in Ren et al. [37], to an amount of bread corresponding to 150 g carbohydrate in Todesco et al. [33]), or was adapted to local nutrition guideline [44], or defined as a minimum number of portions [58]. For all studies, the participants were advised to maintain their habitual diet and lifestyle, replacing usual breads and cereals products with the test breads. All studies compared at least two different breads for their effect on fasting blood glucose, some also considered fasting insulin [37,44,58,65] and few also analysed the acute response to an oral glucose tolerance test (OGTT) [37,44], a test meal [65] or a frequently sampled intravenous-glucose-tolerance test (FSIGTT) [58] before and after the intervention.
In most cases, the fermented bread interventions did not lead to a significant change on glycaemic outcomes. However, in one case a negative effect was observed: Pagliai et al. detected an increase in FBG after 4 weeks of the control wheat bread, whereas their sourdough bread did not induce a significant change [25]. In few cases a positive effect was found on some outcomes: Lappi et al. observed a decrease in the late insulin response (at 120 min, after a test meal) and an increase in the calculated disposition index after four weeks of wholegrain sourdough rye bread [65]; Todesco et al. detected a lower glucose response after a standard meal after one week of a propionate-enriched white wheat bread [33]; Ren at al. found, after 12 weeks of a foxtail millet bread, a high impact in subject with IGT with a decrease in FBG and 2h-glucose response to an OGTT as well as a decrease in calculated insulin resistance index (HOMA-IR) [37].
To summarize, except for a few specific breads and specific outcomes, bread consumption over several days or weeks was not associated with significant changes on glycaemia parameters in healthy people. However, it must be pointed out that for all these studies the effects observed were not controlled for as we considered only the change within one group. Moreover, participants did consume bread before joining the respective studies and were just advised to replace it with the test breads. None of the identified studies gave details on the consumption of bread before intervention, which minimises the possible interpretation of the effects observed. This is probably due to the fact that all studies except Ren et al. [37] compared different breads with each other. Observational studies comparing people eating variable quantities of bread would have supported better evidence on this research question but no suitable studies were identified, due to the strict criteria of healthy population and glycaemia outcomes as blood parameters.
3.2.5. Risk of Bias (RoB) Assessment
For the 26 studies using a randomised controlled trial design, we assessed the risk of bias using the Cochrane RoB2 tool. Only two (7.7%) were judged to have a low risk of bias across all domains [24,45]. In contrast, five studies (19.2%) were judged to have a high overall risk of bias. The reasons were mainly deviations from intended interventions [25,27,47], selective reporting of results [65], or both [60]. The majority of studies, 19 (73.1%), were classified as having “some concerns” (Figure 2, Figure 3 and Figure 4). For our first specific question on the effect of the type of fermentation, all studies showed a low risk of bias in measurement outcomes (Figure 2), whereas for the general effect of fermentation the strength of included studies concerned missing outcome data, as all were assessed with a low risk of bias in this domain (Figure 3).
Overall, the most frequent concern was related to selective reporting, due to the absence of a publicly available protocol or a pre-specified statistical analysis plan. Due to the crossover design, some issues were identified in domains related to the randomization process, reporting or control of carryover effects and the adequacy/appropriate choice of the control condition. In addition, some studies also raised concerns about missing outcome data [25,61] and the measurement of outcomes [33,35,36,59].
3.2.6. Evaluating the Certainty of the Evidence from Human Studies
Considering the number of identified relevant studies (12), their risk of bias (majority with some concerns) and the consistency of effects (10 out of 12 showing a protective effect on glycaemia, 5 out of 7 on insulinaemia) we estimate overall level of the evidence for the effect of the type of fermentation as ‘low’ for a beneficial effect of sourdough fermentation compared to yeast fermentation on postprandial glycaemia parameters.
For the general effect of fermentation on postprandial glycaemia, due to a low consistency of observed effects, even if ten human studies were found most of them with only some concerns of risk of bias, we estimate the evidence as ‘very low’. The number of studies for subgroups of control products (unfermented breads, pasta, porridge/kernels) were not sufficient to reach a higher level of evidence, even if the effects observed inside each subgroup were more consistent.
Finally, we found only a few studies that contributed evidence on the overall effect of bread consumption on long term glycaemia/insulinaemia parameters. Most had some concerns for risk of bias and highly inconsistent effects, therefore we conclude to ’very low’ evidence for a general effect on bread consumption on glycaemia/insulinaemia in over-weeks interventions. Still, for this specific question, identified studies did not use an appropriate design to respond to our research question, as discussed above
3.3. Biological Plausibility – Bioavailability and Mechanism of Action
The potential role of commonly consumed fermented cereal-based products like bread, in glycaemic regulation is of increasing relevance for public health, considering the pandemic of T2D. While clinical trials in humans have provided supportive evidence for reduced postprandial glucose levels after the consumption of sourdough or lactic-acid-fermented bread, in vitro and in vivo studies have helped to define/uncover the possible mechanisms that contribute to this process, which can be grouped in (i) changes in bread structure that reduce the accessibility of starch to digestive enzymes, slowing glucose release, (ii) the production of organic acids and other bioactive compounds during fermentation, which lower bread pH and may slow gastric emptying and starch digestion and (iii) the potential modulation of gut microbiota and its metabolites (Figure 5).
3.3.1. Bread Structure and Starch Accessibility
Fermentation chemically and structurally modifies the starch and protein content of bread, influencing digestion kinetics and postprandial glucose dynamics. Fermentation increases the formation of resistant starch fractions, which are less bioavailable for enzymatic hydrolysis, thereby decreasing the amount of rapidly digestible starch and contributing to a lower glycaemic potential [66,67,68]. Furthermore, while gelatinisation during baking typically increases starch digestibility, other processes like fermentation and subsequent cooling promote the formation of resistant starch type 3 (retrograded starch), that further resists enzymatic hydrolysis and thereby can contribute to lower glycaemic potential [69]. Moreover, bread fermented with LAB exhibits a denser crumb structure and altered fibre matrix, both of which are physical properties that reduce enzymatic access to starch substrates in vitro [68].
It has been reported that the type of fermentation and the baking conditions also affect the postprandial glycaemic and insulinemic responses by altering gastric emptying rates, starch digestibility, and nutrient bioavailability [25,29]. Specifically, sourdough fermentation has been associated with changes in the composition and functionality of dietary fibre, releasing of bound phenolics, an increase in organic acid content, and reductions in the amount of simple carbohydrates and starch digestibility. All of these outcomes may delay gastric emptying and affect glucose metabolism [25,31,41].
3.3.2. Organic Acids from Fermentation Reduce pH and Delay Starch Digestion
Additionally, several in vitro models simulating human digestion have shown that organic acids produced during fermentation, mainly lactic and acetic acid, slow starch hydrolysis by inhibiting amylase activity and reducing the rate of glucose release [62,70,71]. Besides those effects on carbohydrate digestibility, organic acids produced by fermentation, including several short-chain fatty acids (SCFA), can act on gastric emptying and affect appetite regulation. For example, acetate has been shown to cross the blood-brain barrier and activate hypothalamic pathways that regulate appetite and energy expenditure [72]. This leads to increased satiety hormone levels, reduced food intake, and slower gastric emptying, contributing to more gradual postprandial glucose rises. In an older rodent study, lactic acid was also found to modulate postprandial plasma glucose concentration through delayed gastric emptying due to increased secretin and cholecystokinin gut release [73,74].
Fermentation does not only change the carbohydrate fraction of the cereal. It increases protein digestibility through their degradation by cereal proteases, activated by the organic acids produced by LAB and yeast [23]. This can lead to the formation of bioactive peptides such as ACE-inhibitory peptides, whose primary function is to help lower blood pressure, but they may also influence glucose metabolism by improving insulin sensitivity and glucose uptake and reducing oxidative stress and inflammation, both of which are implicated in insulin resistance [75] and kokumi peptides, with anti-inflammatory and hypoglycaemic effects [76]. Other products of fermentation include free amino acids, some of which are precursors to bioactive compounds such as 4-hydroxyphenyllactic acid, 2-hydroxy-isocaproic acid, vanillic acid, and 3-phenyllactic acid or γ-aminobutyric acid, which might also impact diabetes risk through their antioxidant activities [77].
3.3.3. Modulation of Gut Microbiota and Its Metabolites
The final mechanism that has been proposed to participate in the effect of sourdough bread in glucose regulation is the gut microbiota and its metabolites that are affected by dietary exposure to sourdough bread. Both undigested carbohydrates from cereals but also exopolysaccharides formed by the LAB during fermentation [78] can be an energy source for the gut microbiota, which can metabolise them into SCFA. In vitro fermentation experiments using human faecal inocula have demonstrated that sourdough and LAB-fermented breads yield higher SCFA concentrations compared to conventional breads, with coarse wholemeal rye and wheat-rye breads showing particularly favourable SCFA production patterns [79,80]. These SCFAs, especially butyrate and propionate, have been shown in cell culture to activate AMP-activated protein kinase (AMPK) in skeletal muscle, enhancing GLUT4 translocation and glucose uptake. They also stimulate the secretion of incretin hormones such as GLP-1 and Peptide YY (PYY) from enteroendocrine cells [81] through activation of free fatty acid receptors (FFAR2/3). FFAR2/3, found also in vascular tissue, adipose tissue, pancreas and other organs are associated with improved glucose homeostasis, enhanced insulin sensitivity and modulation of blood pressure. This association has been largely established through gain of function (overexpression) or loss of function (knockout) in transgenic rodents or cell models, often with SCFA administration to activate the receptors, showing that FFAR2/3 play beneficial roles in glucose and insulin regulation [82,83]. Activation of these receptors has also been linked to elevated plasma leptin and reduced non-esterified fatty acid levels [60,61,74]. Moreover, improved endothelial function, partially mediated by SCFA and stimulating nitric oxide production, is closely linked to better vascular insulin sensitivity, which facilitates glucose uptake by tissues [84].
The impact of sourdough on the gut microbiota composition and metabolites have been investigated principally using in vitro systems to simulate food-microbiome interactions [85], with several animal studies, some investigating fermented bread [86,87] while others focus on the effects of isolated sourdough cultures [88] but there is little evidence from human studies [30]. Despite the potential mechanisms by which fermented bread could affect the gut microbiota to improve glucose regulation, in vivo data is inconsistent. Shifts in specific microbial groups were observed for two studies that supplemented mice [87] and rats [86] with fermented bread (sourdough and yeast-fermented) compared to the control group but the effects on glycemia both pre and post meal were minimal for all groups. Consistent changes in the microbiota were found for sourdough and yeast-fermented bread interventions compared to the control within these two studies, but the taxa differed between the studies. Moreover, significant differences were observed in both studies for Mucispirillum genus comparing the two types of fermented breads but the genus was higher for mice in the sourdough group than those in yeast-fermented bread group in the mice study [87], while reduced for rats in the sourdough group relative to the yeast-fermented bread group [86]. Rats fed with diets incorporating sourdough-fermented breads showed significantly improved postprandial glucose profiles compared to those consuming conventionally leavened bread [89]. The study reported reductions in glycemia and insulinemia, as well as lower levels of pro-inflammatory cytokines, suggesting broader metabolic benefit associated with the consumption of sourdough-fermented bread. These results highlight that sourdough fermentation may not only modulate glycemic response but also exert anti-inflammatory effects and improve overall metabolic health in animal models.
Similarly to the described animal studies, effects of sourdough bread on the gut microbiota have been observed in human studies but not in parallel to changes in glycemia. Notably, Korem et al. found significant increases after white bread consumption, relative to sourdough bread consumption on two butyrate producers, (Eubacterium ventriosum species and the Anaerostipes genus), in a short-term crossover intervention [30]. High intraindividual variability in glucose response to the different breads was observed in this study but surprisingly the direction of response (higher in sourdough or yeast-fermented bread) could reliably be predicted from features of the baseline microbiome data. These findings indicate that not only can the gut microbiome be altered by fermented bread to affect glucose homeostasis but the current gut microbiota may play a critical role in mediating the response to different bread interventions.
The role of SCFA in glucose regulation is widely investigated. For example, it has been reported that propionate suppresses gluconeogenesis in hepatocytes by inhibiting phosphoenolpyruvate carboxykinase (PEPCK), while butyrate enhances glycogen synthesis, both contributing to improved postprandial glucose regulation [90,91]. Moreover, in isolated pancreatic islet cells from rodents, butyrate showed the most pronounced effect on inducing insulin secretion in comparison to other SCFA tested [92].
3.3.4. Conclusions on Mechanisms of Action
Together, in vitro and in vivo studies provide mechanistic evidence that supports and complements clinical research on the glucose-lowering potential of fermented breads. By modulating the rate and extent of starch digestion and influencing host metabolic and inflammatory pathways, fermented breads, especially those produced using traditional sourdough or lactic acid, could be a promising dietary intervention for glycaemic control. However, the impact of fermented bread on glycaemia appears to both influence and be influenced by additional individual factors such as the gut microbiome composition itself that should be considered in interventions assessing the role of fermented bread on glycaemia [93]. Additionally, the role of the upper-intestinal tract in glycaemic response is still to be understood. Different food structures have been proven to elicit different postprandial gut hormones and satiety responses via GLP-1, PYY [94]. This suggests that dietary effects might be more complex and interconnected than initially suspected and that it would require integrating person-specific factors with food characteristics.
3.4. Safety of Fermented Breads
None of the studies included in this review reported major safety concerns related to fermented bread intake. Mild, non-serious adverse effects were occasionally observed, such as the flatulence noted by Eelderink et al. [43], which was not linked to any specific test meal and was deemed clinically irrelevant. Similarly, Rave et al. recorded 30 gastrointestinal events during their intervention (15 during wholegrain treatment, 13 with meal replacement, and two during the washout phase), though these effects were attributed to bread ingredients rather than the fermentation process [32]. Three participants experienced transient constipation early in the wholegrain treatment, which resolved without consequence, and no such effects were reported during the meal replacement phase. Available evidence does not indicate any safety issues associated with bread consumption.
From a technological perspective, sourdough fermentation lowers the dough pH and produces organic acids, creating an environment that inhibits the growth of spoilage and pathogenic microorganisms [95]. Moreover, fermentation can reduce levels of potentially harmful compounds such as mycotoxins and acrylamide precursors, further improving product safety [96]. Furthermore, sourdough fermentation can mitigate acrylamide formation by lowering dough pH, which inhibits the Maillard reaction, and by promoting the activity of LAB and yeast that degrade free asparagine, a key acrylamide precursor [97,98]. Studies have demonstrated that the use of specific sourdough starters or extended fermentation time can significantly reduce acrylamide concentrations in bread compared with yeast-leavened controls, with reductions of up to 70% reported in some formulations [99]. Nevertheless, as with other fermented foods, inadequate process control or inappropriate storage conditions may permit the accumulation of biogenic amines or survival of undesirable microbes, highlighting the importance of maintaining good manufacturing practices and controlled fermentation parameters [100].
Other safety issues should be considered for cereal-based foods, particularly wheat foods, such as their potential allergenicity and inflammatory potential. The extent to which fermentation, particularly sourdough, can influence these risks was not the focus of our study and is reviewed elsewhere [12].
3.5. Characterization of the Relationship Between Consumption of Fermented Bread and Functional Effects
Fermented breads, particularly those using sourdough starters with LAB and yeasts, have been studied widely for their potential to modulate postprandial glycaemic and insulinaemic responses. Human dietary intervention studies mostly show that sourdough bread tends to slightly reduce postprandial glucose and/or insulin levels compared to conventional yeast-leavened bread. According to the findings from these studies, sourdough bread is associated with delayed gastric emptying, reduced starch hydrolysis, and lower availability of quickly digestible sugars. These effects are primarily observed in short-term postprandial settings, while longer-term effects remain unclear due to study design limitations. A consistent tendency is observed toward lower glycaemic and/or insulinemic responses after consuming sourdough bread, as demonstrated in acute intervention studies [24,46,61,62]. The mechanisms proposed for these effects include acid-induced delay of gastric emptying and inhibition of amylolytic enzymes, as demonstrated by studies with 13C-octanoic acid labelling [26,101]. According to some studies, such as those conducted by Chatonidi et al. [26] and Liljeberg et al. [46], breads with similar acid contents, whether from fermentation or direct acid addition, produced comparable metabolic responses, highlighting the role of fermentation by-products. However, only part of the selected studies did analyse their test bread for acidity-related parameters, some only reporting pH, or one specific organic acid. This lack of standardized information on the bread characteristics impairs a detailed comparison of studies and reduce the strength of evidence on the relationship between these parameters and effects on glycaemia response.
Beyond the reductions in glucose and insulin peaks, some studies [26,65,101] reported lower C-peptide levels and altered insulin dynamics, suggesting potential improvements in insulin sensitivity underlying the glycaemia changes. However, not all studies have reported consistent outcomes. For example, Dall’Asta et al. found no significant differences in metabolic outcomes, potentially due to variations in flour type, fermentation duration, or microbial strains involved [42]. The lack of reporting on the microbial composition of sourdough used or in bread dough after fermentation in several studies however again impairs comparison between studies and a strong conclusion on its exact effect on observed outcomes.
Dose-response effects of bread consumption were not directly explored in identified studies. Novotni et al. demonstrated a non-linear dose-response, where moderate amounts of sourdough ferment used for bread preparation reduced GI more effectively than bread with higher doses of ferment, possibly due to changes in food matrix viscosity, showing the importance of the structure characterisation of tested breads [24]. Still structural characterisation was absent from most of the selected studies. Liljeberg et al. found that the presence of lactic and propionic acids at defined concentrations significantly lowered glucose and insulin responses, mimicking the effects of sourdough fermentation [46].
Despite the relatively consistent findings in acute interventions, only few studies were identified that assess long-term glycaemia/insulinaemia effects, making it difficult to extrapolate findings to habitual consumption patterns. Moreover, findings from these studies were not consistent, and poorly controlled for factors relevant to our research question. The effects observed in acute interventions were mostly of a small magnitude and thus may not translate to a significant impact on the fasting measures of glycaemia and insulinaemia in relatively short exposures used in the ‘long-term’ intervention studies that we identified. Moreover, while dynamic and variable responses are observed in postprandial glycaemia measures, fasting measures of glycaemia are tightly regulated in healthy individuals reflecting a physiological homeostatic control that should not be perturbed by short-term dietary intervention. Observational studies, considering changes over years of consumption, are better suited to assess the long-term impact of fermented breads. However, we could not identify any such study addressing our blood-measurement based outcomes of interest while also offering sufficient granularity on the dietary assessments to permit such investigation. Bread formulations also vary significantly across studies, where described, with different flour types, fermentation times, pH levels, and inclusion of additives (e.g., gluten, fat, salt), which makes direct comparisons and meta-analysis difficult.
4. Conclusion
Overall, considering the well-studied food characteristics and mechanisms of action there is some evidence for a functional benefit of sourdough fermented bread, in offering modest reduction of postprandial glycaemic and/or insulinemic responses. However, the available evidence remains neither convincing nor sufficient to fulfill the requirements for scientific substantiation according to EFSA standards for a claim about positive impact on glycaemia/insulinaemia maintenance, due to the absence of observational studies, lack of dose-response trials, and insufficient long-term data. For the effect of fermented bread intake in general (compared to non-fermented cereal product or over a longer intervention period), mainly due to inconsistency in observed effects, there is currently no or only very low evidence for a positive effect on glycaemia/insulinaemia homeostasis.
To advance the scientific substantiation of health benefits associated with fermented bread, future studies should focus on long-term (>= 4 weeks) randomized controlled trials with well-characterized (i.e., structural characteristics, for sourdough bread microbial composition of sourdough/dough as well as pH and organic acids content), well described bread formulations and preparations and an adequate number of participants to observe a change in the selected outcome. The inclusion of mechanistic endpoints (e.g., gastric motility, enzymatic hydrolysis, gut microbiota) in such controlled studies could help understand disparity between studies. Finally, data from observational, prospective cohort studies that assess real-world outcomes such as T2D incidence should be used to assess whether the observed short-term metabolic effects in healthy individuals translate into meaningful health benefits at the population level.
Supplementary Materials
The following supporting information can be downloaded at the website of this paper posted on Preprints.org. The supplementary material for this article can be found attached. Supplementary Material S1: strings used for literature search.
Author Contributions
SL, MG, JDS Methodology, Investigation, Data curation, Writing – original draft, Writing – review & editing, Conceptualization, Supervision. EGG, SAT, KJBP, BV, IMI, MFK, MP, VS, PRL, CGR, ZP, OY, TE: Investigation, Data curation, Writing – original draft, Writing - review & editing. BY, FM, GV, SP, CC: Writing – original draft, Writing - review & editing. CC Project administration, Funding acquisition.
Funding
The authors declared that financial support was received for the research, authorship, and publication of this article from PIMENTO CA20128, supported by COST (European Cooperation in Science and Technology; www.cost.eu).
Acknowledgments
This article/publication is based upon work from COST Action PIMENTO CA20128, supported by COST (European Cooperation in Science and Technology). The authors thank the administrative team of PIMENTO for their support. The authors thank Sara Licea Domínguez for her valuable contribution in preparing the drawings and figures included in this paper using Canva. Access to Canva for Education was provided through Universidad Panamericana.
Conflicts of Interest
The authors declare that the research was conducted in the absence of any commercial or financial relationships that could be construed as a potential conflict of interest. The authors JDS, BY and CC declared that they were an editorial board member of Frontiers, at the time of submission. This had no impact on the peer review process and the final decision.
References
- Marco ML, Sanders ME, Gänzle M, Arrieta MC, Cotter PD, De Vuyst L, et al. The International Scientific Association for Probiotics and Prebiotics (ISAPP) consensus statement on fermented foods. Nature Reviews Gastroenterology and Hepatology: Nature Research; 2021. p. 196-208.
- Mukherjee A, Breselge S, Dimidi E, Marco ML, Cotter PD. Fermented foods and gastrointestinal health: underlying mechanisms. Nature Reviews Gastroenterology & Hepatology. 2024;21(4):248-66.
- Ogurtsova K, Guariguata L, Barengo NC, Ruiz PL-D, Sacre JW, Karuranga S, et al. IDF diabetes Atlas: Global estimates of undiagnosed diabetes in adults for 2021. Diabetes Research and Clinical Practice. 2022;183:109118-.
- Sun H, Saeedi P, Karuranga S, Pinkepank M, Ogurtsova K, Duncan BB, et al. IDF Diabetes Atlas: Global, regional and country-level diabetes prevalence estimates for 2021 and projections for 2045. Diabetes Research and Clinical Practice. 2022;183:109119-.
- WHO. Definition and diagnosis of diabetes mellitus and intermediate hyperglycaemia : report of a WHO/IDF consultation: World Health Organization; 2006. 46- p.
- AlEssa HB, Bhupathiraju SN, Malik VS, Wedick NM, Campos H, Rosner B, et al. Carbohydrate quality and quantity and risk of type 2 diabetes in US women. The American Journal of Clinical Nutrition. 2015;102(6):1543-53.
- Gan L, Yang Y, Zhao B, Yu K, Guo K, Fang F, et al. Dietary carbohydrate intake and risk of type 2 diabetes: a 16-year prospective cohort study. Science China Life Sciences. 2025;68(4):1149-57.
- Accurso A, Bernstein RK, Dahlqvist A, Draznin B, Feinman RD, Fine EJ, et al. Dietary carbohydrate restriction in type 2 diabetes mellitus and metabolic syndrome: time for a critical appraisal. Nutrition & Metabolism. 2008;5(1):9-.
- Kelley DE. Sugars and starch in the nutritional management of diabetes mellitus. American Journal of Clinical Nutrition. 2003;78(4):858S-64S.
- Jenkins DJ, Wolever TM, Taylor RH, Barker H, Fielden H, Baldwin JM, et al. Glycemic index of foods: a physiological basis for carbohydrate exchange. The American Journal of Clinical Nutrition. 1981;34(3):362-6.
- Islam MA, Islam S. Sourdough Bread Quality: Facts and Factors. Foods. 2024;13(13):2132-.
- D’Amico V, Gänzle M, Call L, Zwirzitz B, Grausgruber H, D’Amico S, et al. Does sourdough bread provide clinically relevant health benefits? Frontiers in Nutrition: Frontiers Media SA; 2023.
- Ribet L, Dessalles R, Lesens C, Brusselaers N, Durand-Dubief M. Nutritional benefits of sourdoughs: A systematic review. Advances in Nutrition. 2023;14(1):22-9.
- Rolim ME, Fortes MI, Von Frankenberg A, Duarte CK. Consumption of sourdough bread and changes in the glycemic control and satiety: A systematic review. Critical Reviews in Food Science and Nutrition. 2024;64(3):801-16.
- Todorovic S, Akpinar A, Assunção R, Bär C, Bavaro SL, Berkel Kasikci M, et al. Health benefits and risks of fermented foods—the PIMENTO initiative. Frontiers in Nutrition. 2024;11.
- EFSA. Scientific and technical guidance for the preparation and presentation of a health claim application (Revision 3)1. EFSA Journal. 2021;19(3).
- EFSA. Guidance on the scientific requirements for health claims related to appetite ratings, weight management, and blood glucose concentrations. EFSA Journal. 2012;10(3).
- Muka T, Glisic M, Milic J, Verhoog S, Bohlius J, Bramer W, et al. A 24-step guide on how to design, conduct, and successfully publish a systematic review and meta-analysis in medical research. European Journal of Epidemiology. 2020;35(1):49-60.
- Kohl C, McIntosh EJ, Unger S, Haddaway NR, Kecke S, Schiemann J, et al. Online tools supporting the conduct and reporting of systematic reviews and systematic maps: a case study on CADIMA and review of existing tools. Environmental Evidence. 2018;7(1).
- Sterne JAC, Savovic J, Page MJ, Elbers RG, Blencowe NS, Boutron I, et al. RoB 2: a revised tool for assessing risk of bias in randomised trials. BMJ. 2019;366:l4898.
- McGuinness LA, Higgins JPT. Risk-of-bias VISualization (robvis): An R package and Shiny web app for visualizing risk-of-bias assessments. Res Synth Methods. 2021;12(1):55-61.
- GRADE WG. Grading quality of evidence and strength of recommendations. BMJ. 2004;328(7454):1490.
- Wang Z, Wang L. Impact of sourdough fermentation on nutrient transformations in cereal-based foods: Mechanisms, practical applications, and health implications. Grain & Oil Science and Technology. 2024;7(2):124-32.
- Novotni D, Čukelj N, Smerdel B, Bituh M, Dujmić F, Ćurić D. Glycemic index and firming kinetics of partially baked frozen gluten-free bread with sourdough. Journal of Cereal Science. 2012;55(2):120-5.
- Pagliai G, Venturi M, Dinu M, Galli V, Colombini B, Giangrandi I, et al. Effect of consumption of ancient grain bread leavened with sourdough or with baker’s yeast on cardio-metabolic risk parameters: a dietary intervention trial. International Journal of Food Sciences and Nutrition. 2021;72(3):367-74.
- Chatonidi G, Pradal I, De Vuyst L, Courtin CM, Verbeke K. Effect of lactic acid-rich sourdough bread on appetite regulation: A randomized, double-blind controlled trial. Current Research in Food Science. 2025;10:100956-.
- Al Dhaheri AS, Henry CJK, Mohamad MN, Ohuma EO, Ismail LC, Al Meqbaali FT, et al. Glycaemic index and glycaemic load values of commonly consumed foods in the United Arab Emirates. British Journal of Nutrition. 2017;117(8):1110-7.
- Bo S, Seletto M, Choc A, Ponzo V, Lezo A, Demagistris A, et al. The acute impact of the intake of four types of bread on satiety and blood concentrations of glucose, insulin, free fatty acids, triglyceride and acylated ghrelin. A randomized controlled cross-over trial. Food Research International. 2017;92:40-7.
- Juntunen KS, Niskanen LK, Liukkonen KH, Poutanen KS, Holst JJ, Mykkänen HM. Postprandial glucose, insulin, and incretin responses to grain products in healthy subjects. American Journal of Clinical Nutrition. 2002;75(2):254-62.
- Korem T, Zeevi D, Zmora N, Weissbrod O, Bar N, Lotan-Pompan M, et al. Bread Affects Clinical Parameters and Induces Gut Microbiome-Associated Personal Glycemic Responses. Cell Metabolism. 2017;25(6):1243-53.e5.
- Najjar AM, Parsons PM, Duncan AM, Robinson LE, Yada RY, Graham TE. The acute impact of ingestion of breads of varying composition on blood glucose, insulin and incretins following first and second meals. British Journal of Nutrition. 2009;101(3):391-8.
- Rave K, Roggen K, Dellweg S, Heise T, tom Dieck H. Improvement of insulin resistance after diet with a whole-grain based dietary product: results of a randomized, controlled cross-over study in obese subjects with elevated fasting blood glucose. British Journal of Nutrition. 2007;98(5):929-36.
- Todesco T, Rao AV, Bosello O, Jenkins DJ. Propionate lowers blood glucose and alters lipid metabolism in healthy subjects. Am J Clin Nutr. 1991;54(5):860-5.
- Ezenwaka CE, Kalloo R. Glycaemic responses after ingestion of 3 local carbohydrate-based foods in West Indian patients with type-2 diabetes mellitus. Clinical Nutrition. 2004;23(4):631-40.
- Liljeberg HGM, Åkerberg AKE, Björck IME. Effect of the glycemic index and content of indigestible carbohydrates of cereal-based breakfast meals on glucose tolerance at lunch in healthy subjects. The American Journal of Clinical Nutrition. 1999;69(4):647-55.
- Liljeberg HGM, Granfeldt YE, Björck IME. Products based on a high fiber barley genotype, but not on common barley or oats, lower postprandial glucose and insulin responses in healthy humans. Journal of Nutrition. 1996;126(2):458-66.
- Ren X, Yin R, Hou D, Xue Y, Zhang M, Diao X, et al. The glucose-lowering effect of foxtail millet in subjects with impaired glucose tolerance: A self-controlled clinical trial. Nutrients. 2018;10(10).
- Rosén LAH, Östman EM, Björck IME. Effects of cereal breakfasts on postprandial glucose, appetite regulation and voluntary energy intake at a subsequent standardized lunch; Focusing on rye products. Nutrition Journal. 2011;10(1).
- Rosén LAH, Silva LOB, Andersson UK, Holm C, Östman EM, Björck IME. Endosperm and whole grain rye breads are characterized by low post-prandial insulin response and a beneficial blood glucose profile. Nutrition Journal. 2009;8(1):42-.
- Sandberg JC, Björck IME, Nilsson AC. Impact of rye-based evening meals on cognitive functions, mood and cardiometabolic risk factors: a randomized controlled study in healthy middle-aged subjects. Nutrition Journal. 2018;17(1):102-.
- Zamaratskaia G, Johansson DP, Junqueira MA, Deissler L, Langton M, Hellström PM, et al. Impact of sourdough fermentation on appetite and postprandial metabolic responses – a randomised cross-over trial with whole grain rye crispbread. British Journal of Nutrition. 2017;118(9):686-97.
- Dall’Asta M, Dodi R, Pede GD, Marchini M, Spaggiari M, Gallo A, et al. Postprandial blood glucose and insulin responses to breads formulated with different wheat evolutionary populations (Triticum aestivum L.): A randomized controlled trial on healthy subjects. Nutrition. 2022;94.
- Eelderink C, Noort MWJ, Sozer N, Koehorst M, Holst JJ, Deacon CF, et al. The structure of wheat bread influences the postprandial metabolic response in healthy men. Food & Function. 2015;6(10):3236-48.
- MacKay KA, Tucker AJ, Duncan AM, Graham TE, Robinson LE. Whole grain wheat sourdough bread does not affect plasminogen activator inhibitor-1 in adults with normal or impaired carbohydrate metabolism. Nutrition, Metabolism and Cardiovascular Diseases. 2012;22(9):704-11.
- Borczak B, Sikora E, Sikora M, Van Haesendonck I. The impact of sourdough addition to frozen stored wheat-flour rolls on glycemic response in human volunteers. Starch - Stärke. 2011;63(12):801-7.
- Liljeberg HGM, Lönner CH, Björck IME. Sourdough Fermentation or Addition of Organic Acids or Corresponding Salts to Bread Improves Nutritional Properties of Starch in Healthy Humans. The Journal of Nutrition. 1995;125(6):1503-11.
- Fredensborg MH, Perry T, Mann J, Chisholm A, Rose M. Rising methods and leavening agents used in the production of bread do not impact the glycaemic index. Asia Pacific journal of clinical nutrition. 2010;19(2):188-94.
- Becerra-Tomás N, Guasch-Ferré M, Quilez J, Merino J, Ferré R, Díaz-López A, et al. Effect of Functional Bread Rich in Potassium, γ-Aminobutyric Acid and Angiotensin-Converting Enzyme Inhibitors on Blood Pressure, Glucose Metabolism and Endothelial Function. Medicine. 2015;94(46):e1807-e.
- AACC. AACC International Approved Methods of Analysis. St. Paul, M.N. USA2001.
- Wang J, Rosell CM, Benedito de Barber C. Effect of the addition of different fibres on wheat dough performance and bread quality. Food Chemistry. 2002;79(2):221-6.
- Arslan-Tontul S. Correlation of Bread Staling and Starch Digestibility and Role of Carboxymethyl Cellulose. Starch - Stärke. 2023;75(11-12).
- Tian W, Chen G, Tilley M, Li Y. Changes in phenolic profiles and antioxidant activities during the whole wheat bread-making process. Food Chemistry. 2021;345.
- Mutlu C, Candal-Uslu C, Özhanlı H, Arslan-Tontul S, Erbas M. Modulating of food glycemic response by lactic acid bacteria. Food Bioscience. 2022;47:101685-.
- Çetin Babaoğlu H, Arslan Tontul S, Karaduman L, Üzgü Y. The usage of sourdough powder as the natural preservative and glycemic index lowering agent in salty muffins. British Food Journal. 2023;125(10):3573-84.
- Liljeberg H, Björck I. Delayed gastric emptying rate may explain improved glycaemia in healthy subjects to a starchy meal with added vinegar. European Journal of Clinical Nutrition. 1998;52(5):368-71.
- De Angelis M, Rizzello CG, Alfonsi G, Arnault P, Cappelle S, Di Cagno R, et al. Use of sourdough lactobacilli and oat fibre to decrease the glycaemic index of white wheat bread. British Journal of Nutrition. 2007;98(6):1196-205.
- Wolter A, Hager A-S, Zannini E, Arendt EK. Influence of sourdough on in vitro starch digestibility and predicted glycemic indices of gluten-free breads. Food & Function. 2014;5(3):564-.
- Juntunen KS, Laaksonen DE, Poutanen KS, Niskanen LK, Mykkänen HM. High-fiber rye bread and insulin secretion and sensitivity in healthy postmenopausal women 1-3. 2003.
- Nilsson A, Östman E, Preston T, Björck I. Effects of GI vs content of cereal fibre of the evening meal on glucose tolerance at a subsequent standardized breakfast. European Journal of Clinical Nutrition. 2008;62(6):712-20.
- Darzi J, Frost GS, Robertson MD. Effects of a novel propionate-rich sourdough bread on appetite and food intake. European Journal of Clinical Nutrition. 2012;66(7):789-94.
- Maioli M, Pes GM, Sanna M, Cherchi S, Dettori M, Manca E, et al. Sourdough-leavened bread improves postprandial glucose and insulin plasma levels in subjects with impaired glucose tolerance. Acta Diabetologica. 2008;45(2):91-6.
- Scazzina F, Del Rio D, Pellegrini N, Brighenti F. Sourdough bread: Starch digestibility and postprandial glycemic response. Journal of Cereal Science. 2009;49(3):419-21.
- Johansson DP, Lee I, Risérus U, Langton M, Landberg R. Effects of Unfermented and Fermented Whole Grain Rye Crisp Breads Served as Part of a Standardized Breakfast, on Appetite and Postprandial Glucose and Insulin Responses: A Randomized Cross-over Trial. PLOS ONE. 2015;10(3):e0122241-e.
- Kristensen M, Jensen MG, Riboldi G, Petronio M, Bügel S, Toubro S, et al. Wholegrain vs. refined wheat bread and pasta. Effect on postprandial glycemia, appetite, and subsequent ad libitum energy intake in young healthy adults. Appetite. 2010;54(1):163-9.
- Lappi J, Mykkänen H, Knudsen KEB, Kirjavainen P, Katina K, Pihlajamäki J, et al. Postprandial glucose metabolism and SCFA after consuming wholegrain rye bread and wheat bread enriched with bioprocessed rye bran in individuals with mild gastrointestinal symptoms. Nutrition Journal. 2014;13(1):104-.
- Bieniek A, Buksa K. Characteristics of In-Vitro Starch Digestibility in Wheat Bread with Arabinoxylans, Baked Using Sourdough or Postponed Baking Methods. Molecules. 2025;30(8):1722-.
- Demirkesen-Bicak H, Arici M, Yaman M, Karasu S, Sagdic O. Effect of different fermentation condition on estimated glycemic index, in vitro starch digestibility, and textural and sensory properties of sourdough bread. Foods. 2021;10(3).
- Tagliasco M, Boukid F, Renzetti S, Marti A, Bancalari E, Vittadini E, et al. Can fermentation methods and granulometry modulate bread starch digestibility without hindering its technological quality? Journal of Functional Foods. 2024;122:106464-.
- Chen Z, Liang N, Zhang H, Li H, Guo J, Zhang Y, et al. Resistant starch and the gut microbiome: Exploring beneficial interactions and dietary impacts. Food Chemistry. 2024;X(21).
- Diowksz A, Malik A, Jaśniewska A, Leszczyńska J. The Inhibition of Amylase and ACE Enzyme and the Reduction of Immunoreactivity of Sourdough Bread. Foods. 2020;9(5):656-.
- Pérez-Alvarado O, Zepeda-Hernández A, Garcia-Amezquita LE, Requena T, Vinderola G, García-Cayuela T. Role of lactic acid bacteria and yeasts in sourdough fermentation during breadmaking: Evaluation of postbiotic-like components and health benefits. Frontiers in Microbiology. 2022;13.
- Frost G, Sleeth ML, Sahuri-Arisoylu M, Lizarbe B, Cerdan S, Brody L, et al. The short-chain fatty acid acetate reduces appetite via a central homeostatic mechanism. Nature Communications. 2014;5.
- Ebihara K. Effect of lactic acid on postprandial plasma-glucose and -insulin responses in rats administered glucose solution. Nutrition Research. 1996;16(9):1575-85.
- Liljeberg HG, Björck IM. Delayed gastric emptying rate as a potential mechanism for lowered glycemia after eating sourdough bread: studies in humans and rats using test products with added organic acids or an organic salt. The American Journal of Clinical Nutrition. 1996;64(6):886-93.
- Ura N, Higashiura K, Shimamoto K. The mechanisms of insulin sensitivity improving effects of angiotensin converting enzyme inhibitor. Immunopharmacology. 1999;44(1-2):153-9.
- Li J, Yi H-B, Wang P, Wang S-N, Liu H, Zhang N. Current advances in the salt reduction properties of kokumi gamma-glutamyl peptides: A Review. Food Reviews International. 2024;41(2):671-91.
- Shafras M, Sabaragamuwa R, Suwair M. Role of dietary antioxidants in diabetes: An overview. Food Chemistry Advances. 2024;4.
- Xu D, Hu Y, Wu F, Jin Y, Xu X, Gänzle MG. Comparison of the Functionality of Exopolysaccharides Produced by Sourdough Lactic Acid Bacteria in Bread and Steamed Bread. Journal of Agricultural and Food Chemistry. 2020;68(33):8907-14.
- Koc F, Arendt E, Coffey A, Ross RP, Stanton C. Impact of low FODMAP sourdough bread on gut microbiota using an in vitro colonic fermentation model. Frontiers in Microbiology. 2024;15.
- Smith C, Van Haute MJ, Rose DJ. Processing Has Differential Effects on Microbiota-Accessible Carbohydrates in Whole Grains during In Vitro Fermentation. Applied and Environmental Microbiology. 2020;86(21).
- Tolhurst G, Heffron H, Lam YS, Parker HE, Habib AM, Diakogiannaki E, et al. Short-Chain Fatty Acids Stimulate Glucagon-Like Peptide-1 Secretion via the G-Protein–Coupled Receptor FFAR2. Diabetes. 2012;61(2):364-71.
- Bjursell M, Admyre T, Göransson M, Marley AE, Smith DM, Oscarsson J, et al. Improved glucose control and reduced body fat mass in free fatty acid receptor 2-deficient mice fed a high-fat diet. American Journal of Physiology - Endocrinology and Metabolism. 2011;300(1).
- Kimura I, Ozawa K, Inoue D, Imamura T, Kimura K, Maeda T, et al. The gut microbiota suppresses insulin-mediated fat accumulation via the short-chain fatty acid receptor GPR43. Nature Communications. 2013;4.
- Nigro C, Raciti GA, Leone A, Fleming TH, Longo M, Prevenzano I, et al. Methylglyoxal impairs endothelial insulin sensitivity both in vitro and in vivo. Diabetologia. 2014;57(7):1485-94.
- Wang Y, Jian C, Salonen A, Dong M, Yang Z. Designing healthier bread through the lens of the gut microbiota. Trends in Food Science & Technology. 2023;134:13-28.
- Abbondio M, Palomba A, Tanca A, Fraumene C, Pagnozzi D, Serra M, et al. Fecal Metaproteomic Analysis Reveals Unique Changes of the Gut Microbiome Functions After Consumption of Sourdough Carasau Bread. Frontiers in Microbiology. 2019;10.
- Kwon J-G, Park S-H, Kwak J-E, Cho JH, Kim G, Lee D, et al. Mouse feeding study and microbiome analysis of sourdough bread for evaluation of its health effects. Frontiers in Microbiology. 2022;13.
- Zhong H, Wang J, Abdullah, Hafeez MA, Guan R, Feng F. Lactobacillus plantarum ZJUFB2 Prevents High Fat Diet-Induced Insulin Resistance in Association With Modulation of the Gut Microbiota. Frontiers in Nutrition. 2021;8.
- Gil-Cardoso K, Saldaña G, Luengo E, Pastor J, Virto R, Alcaide-Hidalgo JM, et al. Consumption of Sourdough Breads Improves Postprandial Glucose Response and Produces Sourdough-Specific Effects on Biochemical and Inflammatory Parameters and Mineral Absorption. Journal of Agricultural and Food Chemistry. 2021;69(10):3044-59.
- Yoshida H, Ishii M, Akagawa M. Propionate suppresses hepatic gluconeogenesis via GPR43/AMPK signaling pathway. Archives of Biochemistry and Biophysics. 2019;672:108057-.
- Zhang W-Q, Zhao T-T, Gui D-K, Gao C-L, Gu J-L, Gan W-J, et al. Sodium Butyrate Improves Liver Glycogen Metabolism in Type 2 Diabetes Mellitus. Journal of Agricultural and Food Chemistry. 2019;67(27):7694-705.
- Montague W, Taylor KW. Regulation of Insulin Secretion by Short Chain Fatty Acids. Nature. 1968;217(5131):853-.
- Arora K, Ameur H, Polo A, Di Cagno R, Rizzello CG, Gobbetti M. Thirty years of knowledge on sourdough fermentation: A systematic review. Trends in Food Science and Technology: Elsevier Ltd.; 2021. p. 71-83.
- Cai M, Tejpal S, Tashkova M, Ryden P, Perez-Moral N, Saha S, et al. Upper-gastrointestinal tract metabolite profile regulates glycaemic and satiety responses to meals with contrasting structure: a pilot study. Nature Metabolism. 2025;7(7):1459-75.
- Poutanen K, Flander L, Katina K. Sourdough and cereal fermentation in a nutritional perspective. Food Microbiol. 2009;26(7):693-9.
- Axel C, Zannini E, Arendt EK. Mold spoilage of bread and its biopreservation: A review of current strategies for bread shelf life extension. Crit Rev Food Sci Nutr. 2017;57(16):3528-42.
- Gökmen V, Senyuva HZ. A simplified approach for the kinetic characterization of acrylamide formation in fructose-asparagine model system. Food Addit Contam. 2006;23(4):348-54.
- Bartkiene E, Bartkevics V, Pugajeva I, Krungleviciute V, Mayrhofer S, Domig K. Parameters of rye, wheat, barley, and oat sourdoughs fermented with Lactobacillus plantarumLUHS135 that influence the quality of mixed rye–wheat bread, including acrylamide formation. International Journal of Food Science & Technology. 2017;52(6):1473-82.
- Claus A, Carle R, Schieber A. Acrylamide in cereal products: A review. Journal of Cereal Science. 2008;47(2):118-33.
- Gänzle MG. Enzymatic and bacterial conversions during sourdough fermentation. Food Microbiol. 2014;37:2-10.
- Bondia-Pons I, Nordlund E, Mattila I, Katina K, Aura A-M, Kolehmainen M, et al. Postprandial differences in the plasma metabolome of healthy Finnish subjects after intake of a sourdough fermented endosperm rye bread versus white wheat bread. Nutrition Journal. 2011;10(1):116.
Figure 1.
Flow chart showing the methodology and results of study selection.
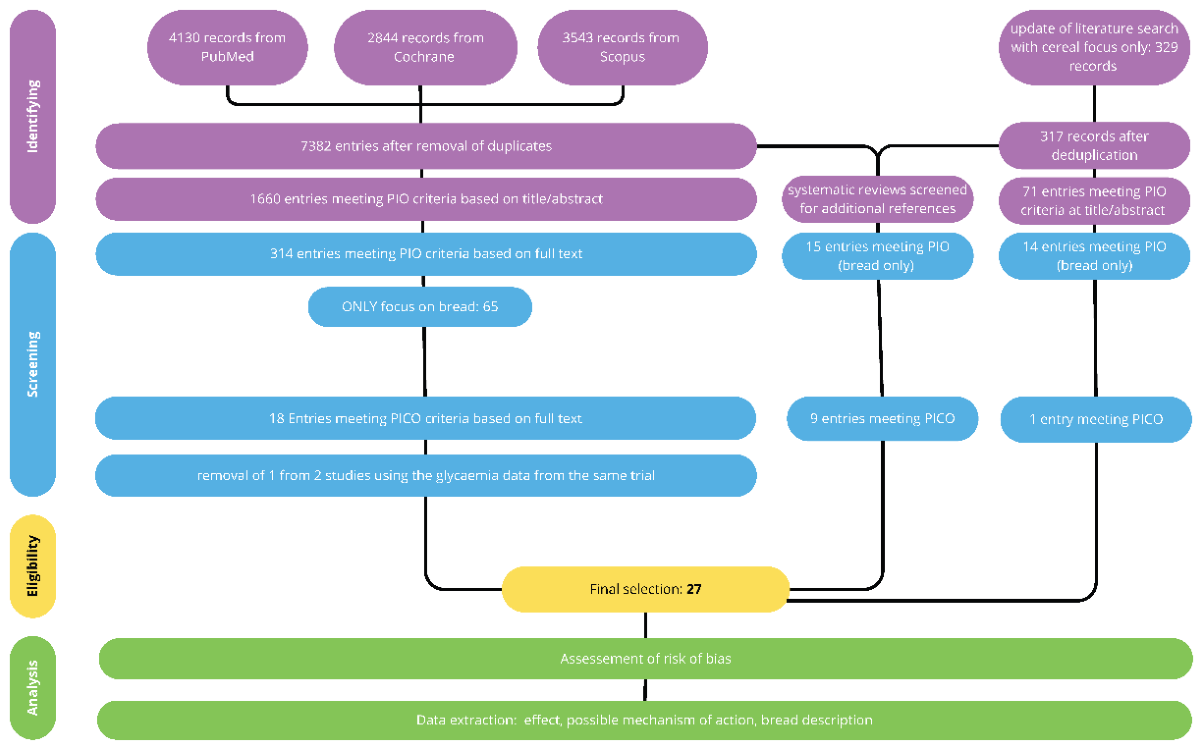
Figure 2.
Risk of Bias Analysis of the studies assessing the impact of the type of fermentation on the glycaemic effects of bread. A: results for each study. B: summary per domain of risk.
Figure 2.
Risk of Bias Analysis of the studies assessing the impact of the type of fermentation on the glycaemic effects of bread. A: results for each study. B: summary per domain of risk.
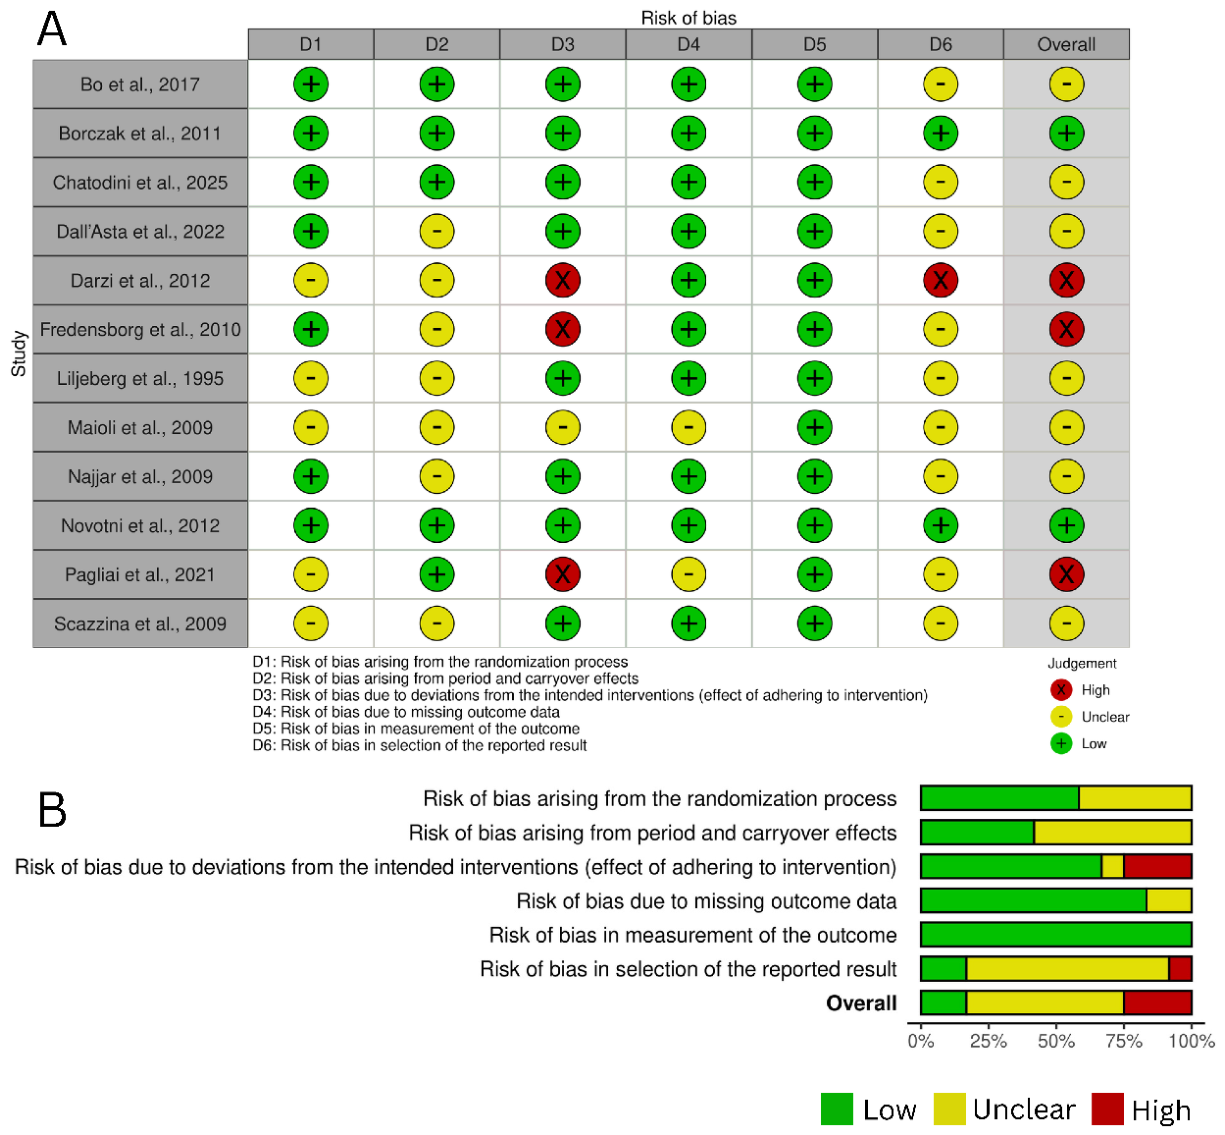
Figure 3.
Risk of Bias Analysis of the studies assessing the general impact of fermentation on the glycaemic effects of bread. A: results for each study. B: summary per domain of risk.
Figure 3.
Risk of Bias Analysis of the studies assessing the general impact of fermentation on the glycaemic effects of bread. A: results for each study. B: summary per domain of risk.
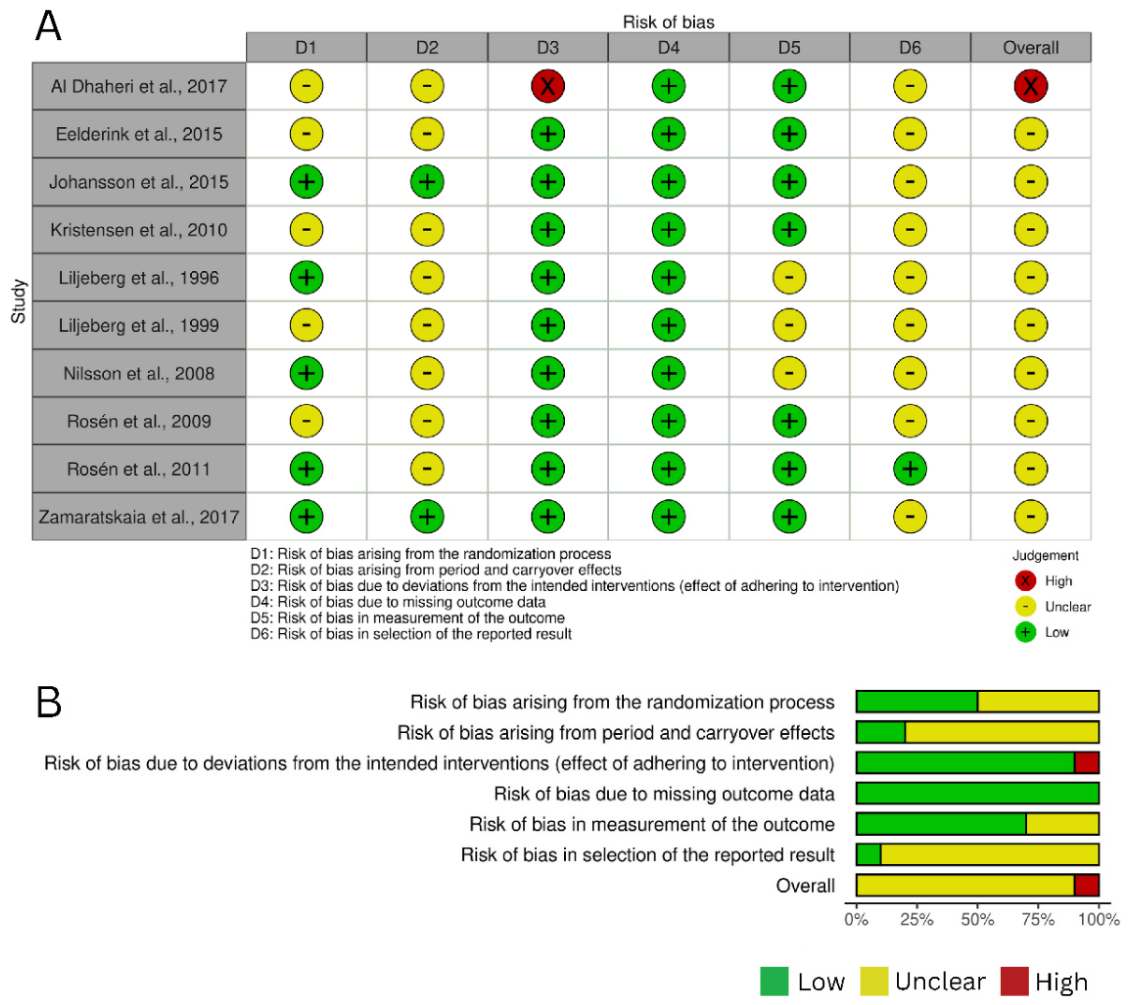
Figure 4.
Risk of Bias Analysis of the randomized studies assessing the effect of fermented bread consumption on glycaemia. A: results for each study. B: summary per domain of risk.
Figure 4.
Risk of Bias Analysis of the randomized studies assessing the effect of fermented bread consumption on glycaemia. A: results for each study. B: summary per domain of risk.
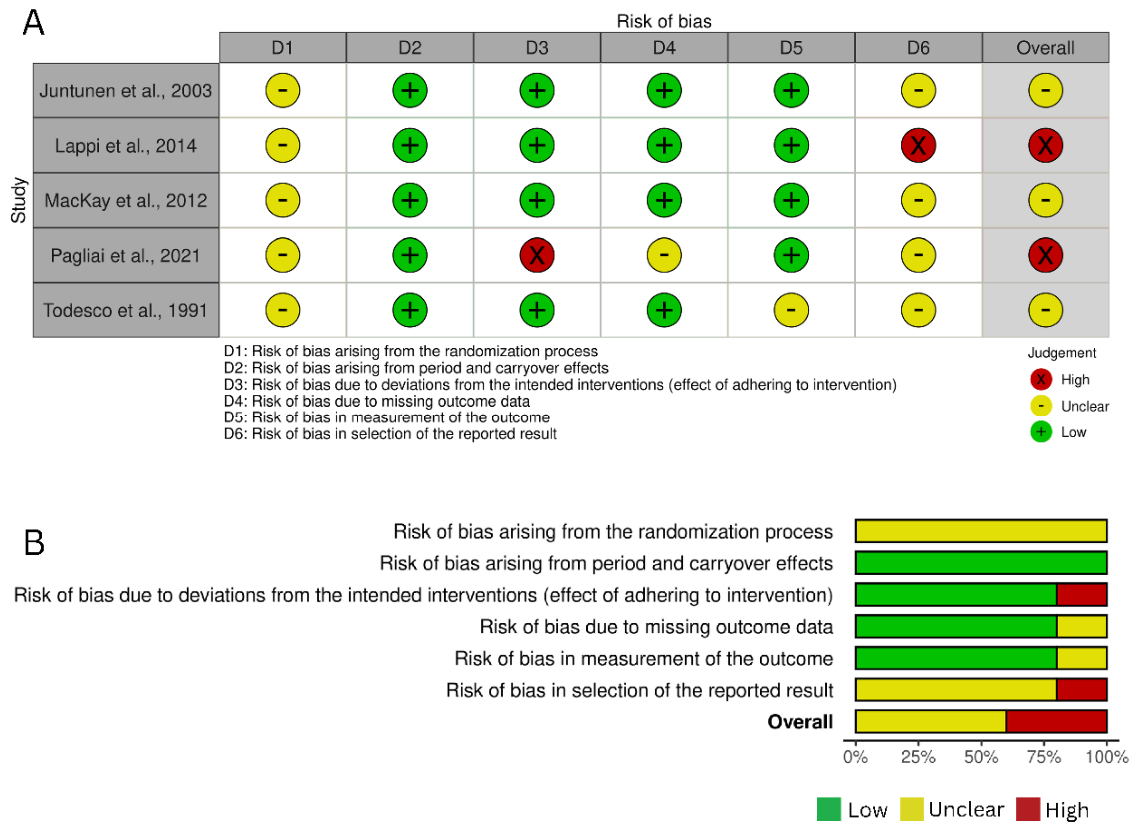
Figure 5.
Overview of possible mechanisms of action A: main pathways behind the glycaemic effects of fermented breads. B: further factors possibly influencing glycaemic effects of fermented breads.
Figure 5.
Overview of possible mechanisms of action A: main pathways behind the glycaemic effects of fermented breads. B: further factors possibly influencing glycaemic effects of fermented breads.
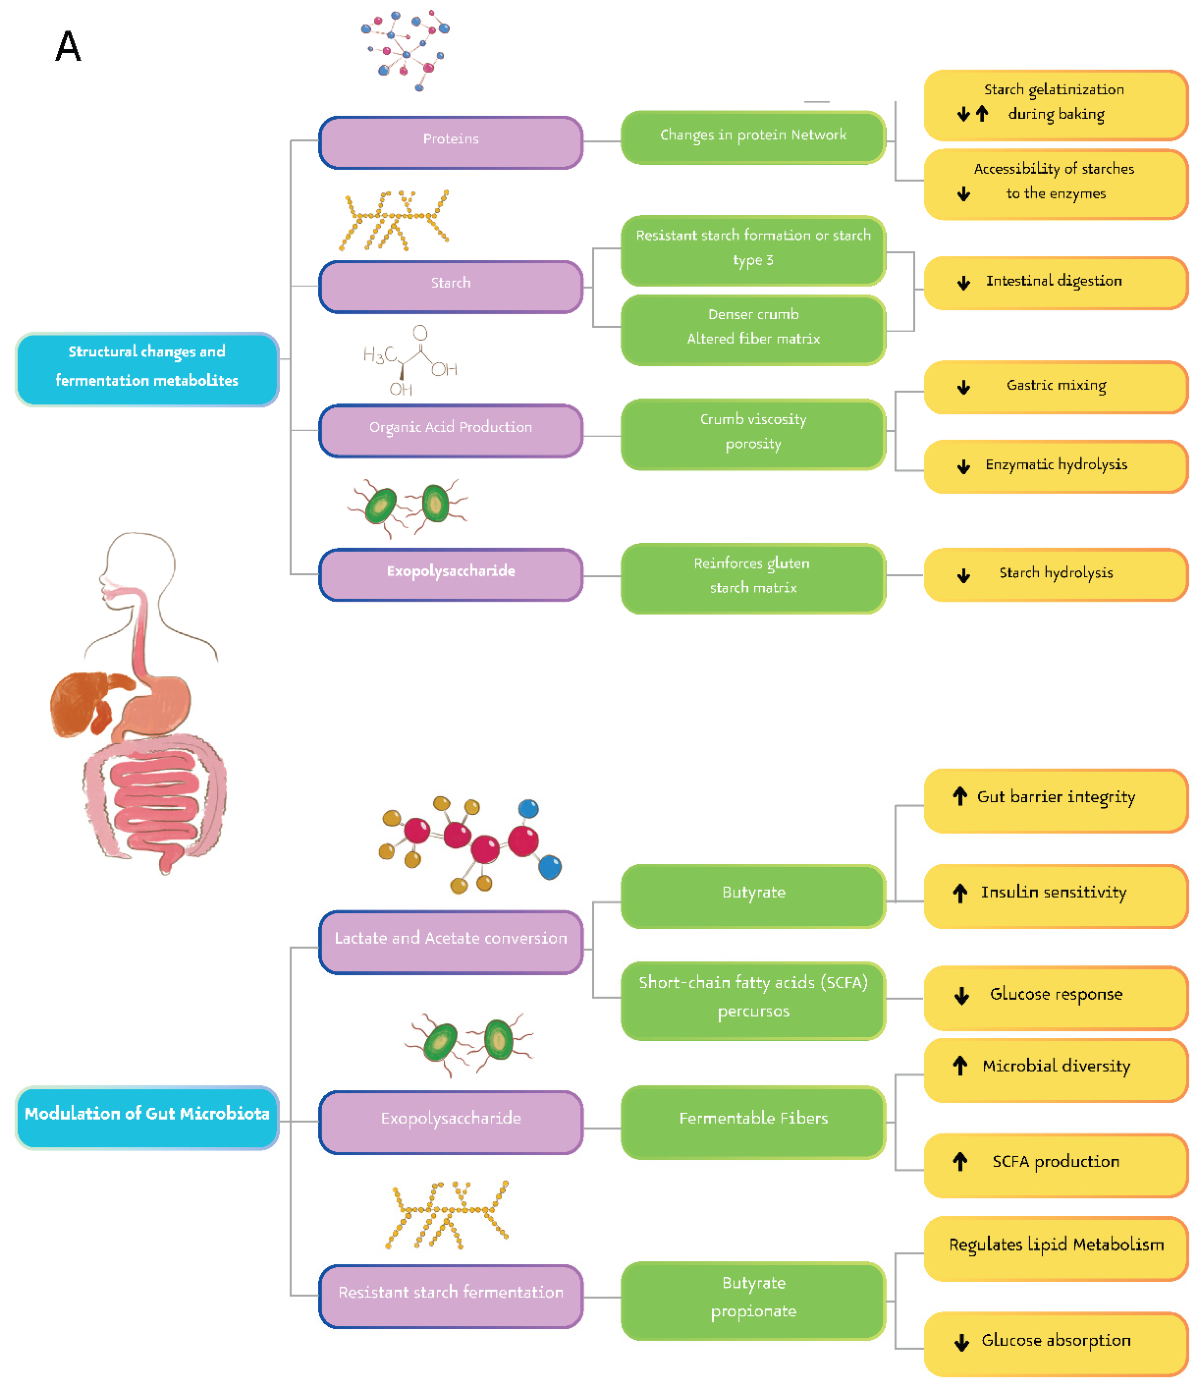
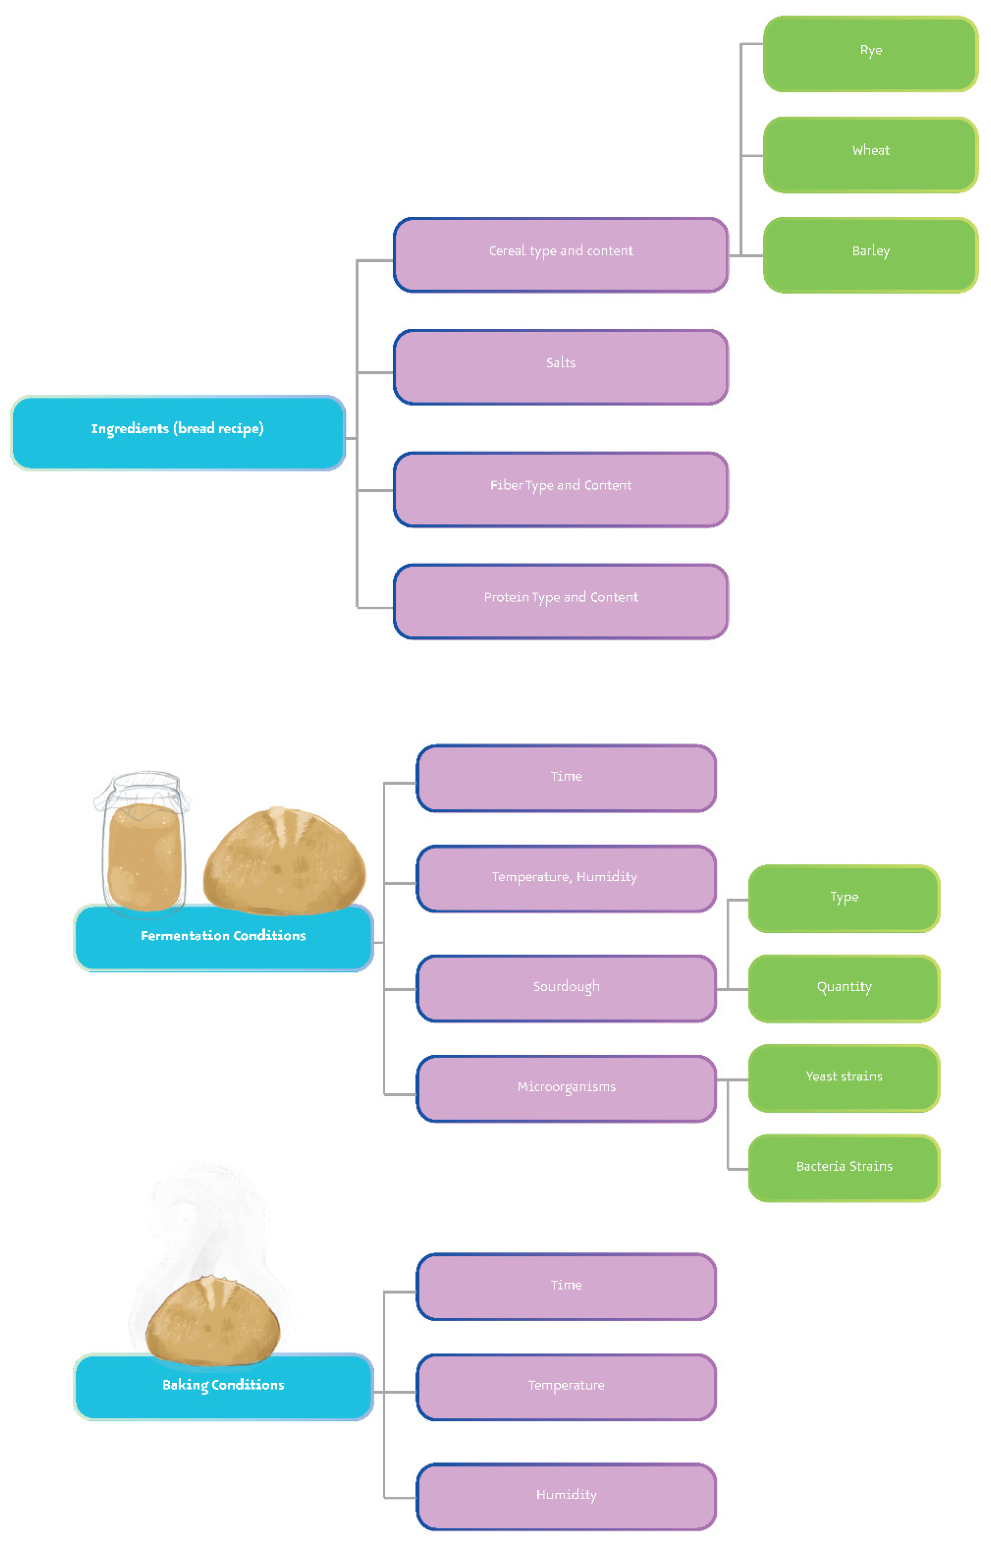

Table 1.
Characteristics of the studies, fermented bread used and main results on glycaemia/insulinaemia outcomes for the impact of the type of fermentation on the glycaemic effects of bread.
Table 1.
Characteristics of the studies, fermented bread used and main results on glycaemia/insulinaemia outcomes for the impact of the type of fermentation on the glycaemic effects of bread.
| First Author, year of publication | Study design, focus | Population (location); final nb participants | Population characteristics (age, BMI, sex distribution) | comparison(s) of interest, cereal, flour quality | Test bread(s) (sourdough; details on production) | Control bread (Yeast) | Bread characterisation | Intervention details (bread intake, context...) | glycaemia/ insulinaemia outcome(s) | Principal effect |
| Pagliai 2020 | RCT, CO; 4 weeks intervention | Florence, Italy; 17 | clinically healthy volunteers (7 F, 10 M) with a mean age of 34.6 ± 9.1 y. and a mean BMI of 22.4 ± 2.5 kg/m2. |
SD (sourdough) vs BY (backer yeast) and change (before-after intervention), wheat | SD: consumed bread made with ancient grain “Verna” (Triticum aestivum) and sourdough (SD), at the bakery Forno Garbo s.r.l (Florence, Italy). All the procedures for the preparation of the transformation were identical both for the intervention breads and for the control breads, with the exception of the type of leavening agent used. Main LAB species: Lactobacillus sanfranciscensis and L.plantarum. | BY: consumed control bread, made with ancient grain “Verna” and baker’s yeast (BY), at the bakery Forno Garbo s.r.l (Florence, Italy) | Sourdough was analysed microbiologically (LAB and yeast counts and genotyping) and chemically (pH, total titratable acidity and organic acids) | Participants were provided 150 g/day of bread. Throughout the study period, all participants were instructed to maintain their usual eating and lifestyle habits and were not allowed to eat other types of bread. | change in fasting blood glucose | a statistically significant increase of fasting blood glucose (+6%; p=.012) was observed only after BY, while no significant variations were observed after SD. |
| Chatonidi 2025 | RCT, CO; postprandial focus |
Belgium, Leuven; 44 | normal weight participants (BMI=23 ±2, from 18.5 to 25 kg/m2), 30 ±10y (from 18 to 50); 15M, 29F |
WYB (yeast) vs WSB (sourdough) breads, both from whole meal, wheat? | Both breads were produced with the same batch of whole meal flour (Ceres Pure Integrale, Brussels, Belgium). Breads were produced by Bio Bakkerij De Trog (Ieper, Belgium), using a starter culture-initiated sourdough produced by a co-culture consisting of the lactic acid bacterium Companilactobacillus crustorum LMG 23699 and the yeast Wickerhamomyces anomalus IMDO 010110. The sourdough was developed and provided by the Research Group of Industrial Microbiology and Food Biotechnology of the Vrije Universiteit Brussel (IMDO). For the sourdough production, a 50:50 (%, m/m) flour-water mixture was fermented at 30°C for 48 h after addition of the starter culture (1%, v/v). Afterwards, a refreshment (50 % refreshment rate) followed by 12 h of fermentation at room temperature was carried out before actual bread making. To produce WSB, whole meal flour was mixed with 20% sourdough (DY 200), 4% gluten (Do IT, Barneveld, The Netherlands), 74% water, and 1.7% salt (Zoutman – Marsel, Roeselare – Belgium). The dough of WSB was first autolyzed for 20 min, followed by kneading for 17 min. The dough was then allowed to bulk proof for 120 min and then underwent an intermediate proofing for 45 min. The dough was then shaped into bread molds, allowing the shaped dough to undergo a final proofing period of 750 min (total fermentation time: 15.6 h, fermentation temperature: 27.1°C). | To produce WYB, whole meal flour was mixed with 6% gluten (Do IT), 74% water, 1.7% salt (Zoutman – Marsel), and 0.1% yeast (Algist Bruggeman, Ghent, Belgium). All values are expressed in % flour-based. The dough of WYB was first autolyzed for 20 min, followed by kneading for 17 min. The dough was then allowed to bulk proof for 120 min. After the first 60 min of bulk proofing, the dough was folded (a method also known as a "rabbat"). Following the folding, the dough underwent an intermediate proofing period of 120 min. The dough was then shaped into bread molds, allowing the shaped dough to undergo a final proofing of 400 min (total fermentation time: 11 h, fermentation temperature: 27.1°C). Both types of bread were finally baked at 200°C for 50 min. | Gastric emptying, chemical analysis: dry matter, nutritional parameters as well as pH, total titratable acidity, and organic acids. | The test breads (150g) were served as breakfast together with 250 mL of water. | Serum C- peptide and plasma glucose responses | WSB induced a lower C-peptide response compared to WYB, after 15 min (padj= 0.010), 30 min (padj = 0.001), 45 min (padj < 0.001), 60 min (padj <0.001), 75 min (padj = 0.007), and 90 min (padj = 0.006). In contrast, the AUC of glucose and C-peptide were not different between the two types of bread (p > 0.05): 296.6 ±90.21 vs 323.9± 98.29 nmol/L*min for WSB vs WYB, p=0.763. Females had higher AUC C-peptide compared to males (padj = 0.001), independent of the type of bread. |
| Dall’Asta 2022 | RCT, CO; postprandial focus |
Parma, Italy; 12 | age: 24±3y; BMI: 21.8±2.8 kg/m² (both SD); no info on sex distribution |
yeast vs sourdough: 3 pairs of breads with different wheat varieties (Bologna, Bio2 and ICARDA); type 1 flour or type0+ middlings (semi- wholemeal) | For sourdough bread, the recipe was: flour (2500g), sourdough (750g), salt (60g), malt (45g), extra virgin olive oil (30 mL), and water (»1250 mL). The sourdough starter, commonly used by the baker in bread making, was fed twice with organic bread wheat flour and left to leaven in a prover under controlled conditions (30°C, 66% RH) for 2 d. All the breads were prepared by mixing the ingredients in a spiral mixer for 10 min at low speed and 8 min at high speed. Bulk fermentation was carried out in a prover under controlled conditions (28°C, 66% RH) for 90 min . The fermented dough was then divided into 1-kg loaves and put back into the prover to rest for 15 to 30 min. Afterwards, the loaves were put into rattan baking molds, proved (28°C, 66% RH) for 80 min , and baked for 60 min at 215°C in an electric oven (EMT 4/6040, Tagliavini S.p.a., Italy). Slices were stored frozen. | For the breads made with S. cerevisiae, the following recipe was used: flour (3000 g), salt (60 g), yeast (60 g), malt (45 g), extra virgin olive oil (30 mL), and water (»1500 mL). All the breads were prepared similarly to sourdough except that bulk fermentation was shorter: for 60 min. | Chemical composition of tested breads was determined (nutritional, minerals and vitamins) | On the test day, test meals were defrosted using a microwave at 600 W for 30 sec before serving and randomly assigned to the volunteers with 500 mL of still water. All the test meals were consumed in isoglucidic portions (containing 50 g of available carbohydrates), following the ISO protocol for GI determination. Subjects were asked to consume the meal within 12 min. | capillary blood glucose (whole curve, iAUC, peak); plasma insulin | A main effect of leavening (P < 0.001) was observed by the comparison of the postprandial glycemic response (Sourdough curves were mainly below yeast curves). But statistical comparison (whole model) among the breads administered to participants showed no effect on IAUCs induced by the leavening technique (common yeast or sourdough) used for baking. Also for blood glucose incremental peak, no sign effect of leavening agent. Analyzing postprandial incremental insulin responses, an effect the leavening (P < 0.05) was observed. However, no effect of the leavening was observed for insulin IAUCs. Also no sign. effect found on insulin peak. |
| Najjar 2009 | RCT, CO; postprandial focus (incl. second meal) |
Guelph, Ontario, Canada; 10 | age: 59,0±2,4y (SE); BMI: 30.8±0.9 kg/m2; male only |
white sourdough vs white yeast breads, white flour, wheat? | Ingredient of sourdough are white flour, sourdough starter, yeast, sucrose, salt, oil, paracetemol, water. These ingredients were mixed, the fully developed dough relaxed at room temperature for 10 min, then the dough was divided into 480 g pieces and proofed at room temperature for 3 h. Baking was performed at 180C for 30 min and then the bread was allowed to cool at room temperature. Crust were removed, slices were frozen till use. | white bread : Similar recipe as sourdough bread except sourdough starter and proofing (60 min at 30C (relative humidity 70 %). | nutrient composition, pH | Volunteers consumed a serving of bread (without any spread, accounting for 50g CHO) together with 250 ml water within 10 min. At 3 h after bread consumption, volunteers consumed a standard, commercially prepared lunch (6-inch Subwayw sandwich on white bread with 300 ml orange juice) within 15 min and were studied for an additional 2 h. | blood glucose; serum insulin and Insulin sensitivity index (calculated); GIP and GLP-1 | There were significant differences in overall glucose and GLP-1 responses to the test breads with sourdough being lower than yeast bread (P<0.05; P=0.0001 resp.) but not for their AUCs. There were no significant differences in overall insulin and GIP responses to the test breads. ISI and insulin AUCs did not differ, GIP AUCs after the first meal did not differ but after the second meal it was lower after sourdough than yeast (P=0.004). |
| Bo et al 2017 | RCT, CO; postprandial focus |
Turin, Italy; 16 | age: 32.3±7.4y (SD), BMI: 21,4±2,7 kg/m2; 6 M, 10 F |
commercial white bread vs sourdough with commercial white flour, wheat, white flour (type 00) | The sourdough bread was made with 1000 g of commercial wheat flour, 700 g of water, 400 g of sourdough, and 25 g of salt. The dough was raised for 4/5 h at 28 °C and 40% of relative humidity and then baked at 230° for 35 min. All wheat flours (commercial and organic), aswell as those of the supermarket bread, were obtained by an extraction rate of 70% (in Italy, these flours are classified as “00” flours). To make the sourdough 1000 g of flour 1000 g of water, and 50 g of starter culture (9.5·105 colony forming units/g flour) were mixed and stored for 10 days during which every 12 h 1000 g of flour and 1000 g of water were added to refresh the mixture that was kept at 14 °C. The sourdough was made up by Saccharomyces cerevisiae and Saccharomyces exiguous in the ratio 1:250 and the domain lactic acid bacteria species were Lactobacillus acidophilus and Lactobacillus casei. Sourdough had lower pH compared to the white bread (5·07 v. 5·77, respectively) which is indicative of the increased level of organic acids in sourdough bread. | Commercial wheat bread, the par-baked frozen dough was subjected to a defrosting period of 6 h at 4 °C and then was cooked at 200 °C for 12 min. Commercial flour has higher amylase activity, higher CHO and lower fiber content. | Chemical (moisture and nutritonal parameters). Viscosity of flour. | Portion of each bread containing 50 g total carbohydrates (86g commercial, 97g Sourdough with commercial flour) had to be consumed by participants 15 min, while sitting; they were allowed to drink 250 mL of tap water during the experiment. | glucose and insulin areas- under-the- curve (AUCs) | Glucose values with sourdough commercial bread were significantly lower than commercial wheat bread at 90 and 120 min post meal but whole AUC not differing. Insulin AUC was significantly lower after the intake of sourdough breads when compared to the commercial bread. Insulin response to sourdough bread was significantly lower than to the commercial bread at 30, 60 and 90 min. |
| Novotni, 2012 | RCT, CO; postprandial focus |
Zagreb, Croatia; 11 | age: 21 to 27 y., BMI: 22.8 kg/m²; 4 M, 7 F |
one yeast versus several sourdough breads differing in quantity of included sourdough, gluten free: rice, corn, wholegrain buckwheat | 4 different sourdough breads: 7.5, 15, 22.5 or 30 g sourdough/100 g of bread batter were made by following the same formulation but with the adjustment of water and flour amount contained in the sourdough. All ingredients (in g):Rice flour (913 g), extruded corn flour (439 g), corn starch (439 g), potato starch (84 g), buckwheat flour (100 g), sugar (40 g), sodium caseinate (4 g) and tap water (1975 g) were mixed in a spiral mixer (Diosna SP12, Osnabrück, Germany) for 2 min at 90 rpm and 5 min at 120 rpm. with a commercial starter PL3 (10.4 g) (Piemonte, Kirchzarten, Germany) containing 1.6 x 10⁷ Lb. fermentum colony forming units per gram. Sourdough was fermented in a fermentation cabinet at 30 °C and 95% relative humidity (RH) until reaching pH 4 +- 0.05. | All ingredients (in g): rice flour (1026), extruded corn flour (492.5), corn starch (492.5), potato starch (94.5), wholegrain buckwheat flour (112.5), sodium caseinate (44.5), inulin (54), guar gum (61), sunflower oil (33), compressed yeast (117), salt (32.5) and tap water (2440) were mixed in a spiral mixer (Diosna SP12, Osnabrück, Germany). Each baking was performed in triplicate from the same sourdough if used. The batter was weighed at 75 g pieces into muffin-like pans and placed in a proofing cabinet at 35°C and 85% RH for 60 min. Breads were partially baked at 190°C for 30 min, cooled at room temperature for 60 min, frozen in a blast freezer until the bread core reached -18°C. Partially baked breads were unfrozen at room temperature for 10 min and finally baked at 210°C for 8 min. |
Chemical analysis: lactic and acetic acids, nutritional parameters. Physical characterisitcs: specific volume, viscosity, crumb firmness | Bread portions containing 50 g of available carbohydrates were consumed by each volunteer over 10 min time period, with 250 mL of water. | postprandial response + glycaemic index | The mean blood glucose was the highest after consumption of control and bread with 7.5% of sourdough but did not significantly differ among breads (P > 0.1). The glucose response in first 60 min was the lowest for breads with 15% of sourdough, having a peak significantly lower than the control. Also, mean blood glucose increase during 120 min after consumption of breads with 15% and 22.5% of sourdough was lower than for other test breads. The calculated glycaemic index value of the control bread belonged to the medium-food group. Sourdough decreased bread’s glycaemic index by 9, 16, 14 or 7 units, depending on its amount (7.5; 15; 22.5 or 30%, respectively). The difference in glycaemic index between all breads was significant at P = 0.09. Breads with 15% and 22.5% of added sourdough had low glycaemic index, and in contrast to control bread were statistically different at P = 0.07. |
| Borczak 2011 | RCT, CO; postprandial focus |
Krakow, Poland; 15 | age: 23.1±1.2 y; BMI: 21.8±2.7 kg/m²; 2 M, 13 F |
FBNF vs FBNF+S and PBF vs PBF+S (FBNF=fully baked, non- frozen or PBF:partially baked and frozen, S=sourdough), wheat, white flour (type 55) |
as for control + dehydrated sourdough (30 g) (Medea PW 145, Puratos, Belgium) mixed with other ingredients | The dough for the wheat rolls was prepared using the following ingredients: wheat flour, type 55 (1000 g) (Moulins Soufflet, Pornic, France), salt (18 g) (Janikosoda S.A., Janikowo, Poland), yeast (10 g) (SAF – Instant red – Lesaffre Group, Strasbourg, France), Freshbake improver (10 g) (Puratos, Belgium) and tap water (580 g). The ingredients were mixed for 9 min in a mixer (DIOSNA SP-12, GETH, Germany), then underwent proofing (60 min, 358C, 95% RH) and baking in an electric oven (MIWE, Germany). The FBNF rolls were baked conventionally (20 min, 2308C). The PBF rolls were partially baked (190–2008C, 30 s; 170–1808C, 16 min and 30 s), frozen in a blast freezer for about 30 min at 308C, and then stored in a freezer at 188C in airtight containers for 14 days. At the end of the storage period, the rolls were defrosted at room temperature for about 10 min, put in the oven and fully baked (8 min at 210–2208C). The applied PBF technology is a modification of the technology previously used in the studies by Borczak et al. [9]. The modifications concern formulation, i.e., lower salt content (from 2% reduced to 1.8%), as well as a different time and temperature used in the final baking. | Chemical analysis (nutritional parameters incl. RS, dry matter) | The rolls were served with 250 mL of low- mineralized water. Subjects were asked to eat the test wheat rolls (50g CHO) within 15 min and to consume the reference food in 10 min. | postprandial response + glycaemic index | The addition of 3% dehydrated sourdough to fresh and frozen wheat rolls resulted in a significant decrease in the glycaemic response, by 24% compared to the samples without sourdough. The rolls prepared without the addition of S (FBNF and PBF) have glycaemic indices of 87± 11% and 67± 3%, respectively, while for the breads prepared with added sourdough they were 63 ±7% (FBNF + S) and 43 ±4% (PBF + S). FBNF classified as high glycaemic index (>70%), PBF and FBNF+S as medium and PBF+S as low (<55%). iAUC of breads with sourdough were significantly lower than for equivalent bread without sourdough. The blood glucose level in participants’ serum in the 15th minute was significantly lower in the case of PBF + S bread than for PBF. |
| Fredensborg, 2010 | RCT, CO; postprandial focus |
Otago, New Zealand; 10 | Group 3 only: Age 27.4 ± 6.6 y., BMI 22.7 ± 2.6 kg/m²; 3 M, 7 F |
yeast vs desem vs sourdough breads wheat, half white and half whole meal. | Breads were prepared specifically for this study by a local bakery. The breads tested by group three (incl. Yeast, Desem, Sourdough) were selected based on differing leavening agents used in the fermentation process. These breads were made with whole meal flour, but were leavened using yeast, yeast and desem, or sourdough. Desem (Dutch for leaven), is a fermented dough, which is added to standard bread ingredients to help the dough rise. The desem is usually made from flour, water, salt, yeast and sometimes honey that ferment to produce carbon dioxide. Sourdough is made from a starter similar to desem, but with a more porridge like consistency made from flour and water only. This slurry is left to capture wild yeasts from the environment. The development of the sourdough starter can take up to two weeks, and extra ingredients must be added regularly to maintain the viability of the culture. The flour used in the production of all of the breads was sourced from the same organic flourmill. |
As for test breads, but with yeast as ferment. | Chemical and Nutritional analysis (CHO; moisture, ash, protein, energy, fat and total fiber) | Participants were instructed to consume the bread (without any spread or filling, just water 300mL) within 10 minutes. Portion size provided 50 g available CHO. | glycaemic index | no significant differences in glycaemic index values were found between sourdough, desem and yeast breads tested. |
| Darzi 2012 | RCT, CO; postprandial focus |
UK; 20 | age: 25.1 ± 4.6 y (18 to 35), normal weight ; 9 M, 11 F |
SOUR (sourdough) vs control (yeast) bread; refined (white) flour, wheat? | Propionate-rich SOUR bread made with 3% Domani starter culture (containing 4.8 mmol propionate per 100 g bread) was used for the clinical intervention. Domani, containing microflora, mainly propionibacteria, favouring propionate production | Control bread using yeast, was made to a similar recipe with the same refined flour used in the baking of both breads. | Sensory analysis, propionate content | The test breakfast comprised jam sandwiches made using SOUR or control bread (126 g, equivalent to three slices), Olivio spread (30 g) and Tesco strawberry, plum or apricot jam (45 g) served with water or sugar free squash (Robinson’s). The jam and drink were selected by the participants at screening, and the same choice was served on both occasions. |
Insulin & glucose responses, Insulin sensitivity | The mean plasma insulin response following ingestion of SOUR remained elevated above control from 45 to 90 min postprandially. A treatment x time effect with a trend approaching significance (P=0.061) was found for the entire 180 min, which was significant for the first 60 min (P=0.033). The overall treatment effect was non significant and the area under the curve did not differ between treatments. The estimated mean postprandial oral insulin sensitivity was lower following SOUR than control. However, the difference between these values were non significant. No effect were found on the postprandial glycaemic response. |
| Liljeberg 1995 | RCT, CO; postprandial focus |
Sweden; 11 | age: 26 to 48 y, with normal BMI; 5M, 6F | Whole-meal bread with or without sourdough, barley whole meal (80%) and white wheat flour (20%) | To make sourdough, 3465 g water, 1540 g whole-meal barley flour and 0.75 g starter culture (5-107 colony forming units/g flour) were mixed and stored for 20 h at 37°C.The starter culture used was a homofermentative lactic acid bacteria, Lactobacillus plantarum strain Al (Clas Lonner AB, Lund, Sweden). The main organic acid formed during fermentation was lactic acid. Sourdough bread was made with 4810 g sourdough starter, 1480 g whole-meal barley flour, 740 g white wheat flour and 200 g yeast. The remaining ingredients and baking procedures were the same as for the basic recipe. | The basic recipe for the whole-meal bread con sisted of 3280 g water, 2960 g whole-meal barley flour, 740 g white wheat flour, 200 g yeast, 50 g NaCl, 50 g sucrose and 37 g monoglycerides. The dough was proofed for 50 min, divided into pieces of 600 g, followed by a second proofing for 20 min (38°C,75% humidity). The bread was baked at 200°Cfor 30 min. | Chemical composition: nutritional parameters, pH and organic acids. In vitro starch hydrolysis. | The bread products (159-161 g) were provided corresponding to 50 g of available carbohydrates and served with 8 g of butter and 20 g of cheese (17% fat, wet weight). In addition, 200 mL of water and 150 mL of coffee or tea were included in each meal. They were asked to eat the meal over a 12-15 min period. | glucose and insulin responses | When the areas under the curves in the initial phase were calculated (0-45 min), significantly lower figures were noted as a result of consumption of the sourdough bread, and the breads with lactic acid or Na-propionate, compared with WMB. However, the 0-95 and 0- 120 min areas under the curves did not differ significantly. Compared with WMB, lower insulin concentrations (P < 0.05) were found at 30 min when subjects consumed the sourdough bread, and the WMB plus lactic acid or Na-propionate. |
| Scazzina 2009 | RCT, CO postprandial focus |
Parma, Italy; 8 | age: 24 ±1 y., BMI: 22.0±0.5 kg/m2 (SD); 4M, 4F |
Sourdough vs yeast breads: 2 pairs, one with white flour and and one with wholemeal, wheat | four experimental breads were obtained, prepared from two different wheat flours (whole or white) by two different leavening techniques (sourdough and with Saccharomyces cerevisiae). | no further info | Starch and fiber content + in vitro starch hydrolysis. | The bread test meal were provided in amounts corresponding to 50 g of available carbohydrates and served with 500 ml of water. | glucose response | Both the response curves and the IAUC values of the sourdough products are lower than the corresponding samples leavened with baking yeast. The statistical analysis shows that the leavening technique significantly affects glucose response when measured as IAUC (p< 0.001), whereas fiber content does not (p= 0.325). |
| Maioli 2008 | RCT, CO, postprandial focus |
Sassari, Italy; 16 | with impaired glucose tolerance, age: 52 to 75 y., BMI: 29.9 ± 4.2 kg/m2; 9M, 7F |
sourdough vs reference (yeast) bread, wheat semolina (70%), cornflour (30%) |
initial dough consisted of a mixture of 70% durum wheat semolina and 30% of cornflour, with the addition of 60% water, 1% NaCl, and 1% industrial baker yeast. After dividing this dough quantity into two exact halves, two different types of leavening agents were used: (2) a sourdough starter consisting of a mixture of well-defined yeast and bacteria. This starter included an autochthonous 5.2 strain of Saccharomyces cerevisiae, Lactobacillus brevis SB3 and Lactobacillus plantarum SB24 [10,11,12,13], isolated from natural sourdough. This acidic starter was prepared according to preliminary bread-making experiments, which were necessary to define the optimal percentage of bacteria, to determine the proportion of ingredients, and incubation time. The dough treated with baker yeast and the one treated with acid starter were proofed for 2 and 8 h, respectively, at 30 C, 90% humidity. The choice of a fermentation time not exceeding 8 h was due to the fact that longer intervals produce a brittle and unpalatable product. The bread containing baker yeast was processed according to the same protocol (manual doughing, baking at 220 C) except for the fermentation time, which was only 2 h. | initial dough consisted of a mixture of 70% durum wheat semolina and 30% of cornflour, with the addition of 60% water, 1% NaCl, and 1% industrial baker yeast. After dividing this dough quantity into two exact halves, two different types of leavening agents were used: (1) the usual baker yeast available on the market, mostly consisting in Saccharomyces cerevisiae | humidity, lactic acid and simple CHO measurements.Microstructure (scanning electron microscopy: granules size, porosity) | Participants were randomly given a standard meal (total energy content about 500 kCal, 58% carbohydrates, 30% lipids and 12% proteins) consisting in: 200 ml semi-skimmed milk to ensure an optimal palatability; 10 g butter, 15 g glucose-free marmalade and 100 g bread. | glucose and insulin responses | decrease? Thirty minutes after the ingestion of sourdough bread blood glucose levels resulted significantly lower (-25%, p = 0.048) in comparison to those obtained with the reference bread. Blood glucose AUC were significantly lower at intervals of D 0–30 min (p = 0.02) and D 0–60 min (p = 0.018) while the difference was no longer significant thereafter. The insulin levels were significantly lower (p = 0.045) 30 min after the ingestion of sourdough bread. Similarly, insulin AUC was significantly smaller at the interval of D 0–30 min (p = 0.018) while no significant difference was found thereafter. |
Table 2.
Characteristics of the studies, bread and control used and main results on glycaemia/insulinaemia outcomes for the general impact of fermentation on the glycaemic effects of bread.
Table 2.
Characteristics of the studies, bread and control used and main results on glycaemia/insulinaemia outcomes for the general impact of fermentation on the glycaemic effects of bread.
| First Author, year of publication | Study design, focus | Population (location); final nb of participants | Population characteristics (age, BMI, sex distribution) | comparison(s) of interest, cereal, flour quality | Test bread (fermented, details on production) | Type of control | Bread characterisation | Intervention details | glycaemia/insulinaemia outcome(s) | Principal effect |
| Johansson, 2015 | RCT-CO, postprandial focus |
Ultuna campus of the SLU, Sweden; 23 | Healthy; Age: from 27 to 70y (mean=60,1±12,1y.), BMI: from 18 to 31,4 kg/m2 (mean=23,8±3,4 kg/m2); 7 M (59.1±14.7 y), 16 F (60.6±11.0 y) |
unfermented vs yeast fermented crisp breads (both whole grain rye) | commercially available crisp breads (Barilla Sweden AB). Flour of the same origin and composition but milled to different particle sizes was used for the production of uRCB and RCB. According to data provided by the manufacturer 30–42% of particles in the flour used for uRCB were below 125 μm and 20–28% above 1040 μm, while the same fractions in the flour used for RCB comprised 51–57% and 3–6% respectively. With the exception of particle size and the yeast added to RCB, the composition of uRCB and RCB was the same. | unfermented whole grain rye crisp bread (uRCB), | Nutrtitional and Chemical Characterization (extractable and unextractable dietary fiber; β-glucan fructan content; content of arabinoxylan and arabino-galactan was calculated; Total fat, protein and aminoacid composition). | The crisp breads (58,5 or 60g for uRCB and RCB resp.) were served with margarine and cheese, a glass of orange juice and a cup of coffee or tea. Participants could choose between coffee and tea but had to adhere to their initial choice on all occasions. Participants were instructed to finish the breakfast within 15 minutes. The test ended four hours after breakfast and participants stayed at the clinic the whole time. Between each test occasion, there was a wash- out period of at least six days. | plasma glucose and serum insulin responses | uRCB induced 13% (P<0.002) lower postprandial insulin response between 0-230 min compared with RCB respectively (also lower response between 0-120min: 12 %, P<0.02). Glucose response did not differ between treatments. |
| Zamaratskaia, 2017 | RCT-CO, postprandial focus |
Uppsala University Hospital, Sweden; 24 | Healthy; Age mean: 30±11y. (SE), BMI: 23± 5.0 kg/m2; 13 M, 11 F |
unfermented vs sourdough fermented crisp breads (both whole grain rye) | commercially available crisp breads (Barilla Sweden AB). The sourdough-fermented rye crispbread (SFRCB) was made using whole grain rye flour, whole grain rye sourdough (19 %), yeast, barley malt, emulsifier (mono- and diglycerides or fatty acids), salt and water. The sourdough, with an in-house culture mixture, was fermented for 40 h and then mixed with the other ingredients. This was followed by a two-step fermentation, first for 120 min at 29°C, followed by 35 min with an increase from 30 to 38°C. | Unfermented Rye Crispbread (uRCB): same ingredients as SFRCB, but no fermentation was applied. Maintains high dietary fiber content, with starch that is more rapidly digestible compared to fermented rye. Unfermented rye crispbread was mixed with water at 12°C and then whipped at 6°C to incorporate air into the dough. According to data provided by the manufacturer, 30–42% of particles in the flour used for the unfermented rye crispbread were <125 μm in diameter and 20–28% were >1040 μm, whereas the corresponding fractions in the flour used for sourdough-fermented rye crispbread comprised 51–57 and 3–6%, respectively. | Nutritional and Chemical Analysis was performed (Extractable and unextractable dietary fiber content. Concentration of arabinoxylan and arabinogalactan was calculated. Molecular weigth and concentration of β-glucan. Concentratin of fructan and resistant starch was analysed. Crude fat, protein. Amounts of L-lactic acid and D-Lactic acid, and acetic acid). | The crisp breads (59,8 or 59,4g for uRCB and SFRCB resp.) were served with margarine and cheese, a glass of orange juice and a cup of coffee or tea | plasma glucose and insulin responses | No significant differences in glucose response between the groups was found. Insulin AUC (0–125 min) was significantly affected by diet (P= 0·01), and was lowest after consumption of unfermented rye crispbread, whereas no differences were observed between sourdough-fermented rye and yeast- fermented refined wheat crispbread. Insulin AUC (0–230 min) was not affected (P=0·06). No significant difference in postprandial insulin response between the different crispbreads was found when modelling the curves (P>0·05). |
| Eelderink 2015 | RCT-CO, postprandial focus |
Netherlands; 10 | Healthy; Age mean: 24 ± 0.6 y.; BMI 22 ± 0.2 kg/m2 (SE); 100% M | control bread (CB) vs pasta (PA) or flat bread (FB) (wheat, white flour+bran) | fermented control bread (CB). Ingredients: 1446 g unlabeled white wheat flour, 240 g 13C-labeled whole meal wheat flour, 314 g wheat bran, 1300 g water, 33.4 g yeast, 36 g salt, 3 g malt, and 70 ppm ascorbic acid. Preparation: dough was kneaded, left to rise for 30 minutes, shaped, and left to rise again for 60 minutes, baked at 240°C for 30 minutes.Porous due to yeast leavening, with large air cells and thin walls (porosity: 83%; density: 0.29 g/mL). All three wheat-based products were prepared at TNO, Zeist, The Netherlands. |
flat bread (FB): compact structure, made without yeast; Ingredients: 1450 g unlabeled white wheat flour, 240 g 13C-labeled whole meal wheat flour, 310 g wheat bran, 1300 g water, 36 g salt, and 3 g malt. Preparation: dough was kneaded, rested for 30 minutes, sheeted to 1.5 mm thickness, and cut into 14 cm disks, baked on a stone plate at 350°C for 30 seconds on each side. Structure: compact due to no leavening agent, with smaller air cells and thicker walls (porosity: 47%; density: 0.47 g/mL). Pasta (PA): 763 g unlabeled white wheat flour, 120 g 13C-labeled whole meal wheat flour, 117 g wheat bran, 390 g water and 20 g salt. Dough was mixed in a z-blade mixer and spaghetti was prepared using a sheeting method, creating an elastic dough sheet after multiple rolling and folding steps. This dough sheet was cut in spaghetti strings which were about 2 × 2 mm and 25 cm long. Portions of pasta dough were stored at −20 °C until use and cooked for 3 min in 2 L water before consumption. |
Chemical and Nutritional Analysis (Starch, dietary fiber and moisture). Bread density was calculatd. Structure through stereomicroscopy and through porosity using desktop X-ray microtomography. | All meals provided 50 g of available carbohydrates (138g for CB, 119g for FB and 127g for PA) and were consumed alongside 10 g margarine light, 2 slices lean ham, and 250 mL tap water. | plasma glucose and insulin responses | Postprandial glucose concentrations did not differ after the consumption of CB, FB and PA based on comparisons (all meals) of iAUC and time points. However, significant differences in glucose peak value between CB-FB (8.3 ± 0.3 vs. 7.5 ± 0.2, P < 0.002) and CB-PA (8.3 ± 0.3 vs. 7.6 ± 0.3, P < 0.003) were found. The insulin response was lower after PA consumption compared to CB at several time points (t = 45, 60, 105 min, p< 0.005), which resulted in a smaller 0–6 h iAUC compared with CB consumption (P < 0.005). FB and PA showed similar low insulin responses, which were lower compared to CB based on the 0–2 h iAUC (P < 0.005). A lower average peak value was observed after FB and PA consumption compared to CB (P < 0.005) as well. At t =210 min (P < 0.005), insulin was higher after PA compared to CB and FB. |
| Rosén 2009 | RCT-CO, postprandial focus |
Sweden; 12 | Healthy; Age mean: 25.3 ± 0.8 y.; BMI 23.1 ± 0.6 kg/m2; 9 M, 3 F |
white wheat porridge (WWP) vs WW bread (WWB), as well as rye breads vs rye porridges (one comparison with endosperm rye (ERP and ERB), one with whole grain rye (WGRP and WGRB))->3 different comparisons, all with the difference of yeast fermentation | Rye breads: dough mixed for 6 minutes, proofed for 30 minutes at RT, shaped, and proofed for another 60 minutes at room temperature. Baked at 250°C for 40 minutes. Storage: cooled for 18 hours, sliced, and frozen until served. WWB: baked in a bread machine: mixed for 30 minutes, proofed for 130 minutes, and baked for 55 minutes. Whole grain rye flour, endosperm rye flour were provided by Lantmännen R&D (Järna, Sweden) and commercial white wheat flour was obtained from Kungsörnen AB (Järna, Sweden). Dry yeast was obtained from Jästbolaget AB (Sollentuna, Sweden). for ERB and WGRB, part white wheat flour (for uniform starch content), part rye flour; for WWB monoglyceride on top. |
WWP, ERP and WGRP. All porridges were cooked from water, white wheat flour and salt+- rye flour in a microwave oven (MM 140-1, Elektro Helios AB, Stockholm, Sweden) at 680 W for 3 min. The porridges were freshly prepared each experimental day and were left to cool under aluminium foil for 15 min before serving | Chemical and Nutritional Analysis (Insoluble and Soluble fibres; fat; protein). Starch hydrolysis using an in vitro model. | all meals contained 40 g of available starch and were served with 250 ml of water. | capillary blood glucose and serum insulin responses; glycaemic and insulinaemic indices calculated | Glucose: When comparing the endosperm products ERP and ERB, a significantly larger incremental area was obtained with the porridge ERP in the early post-prandial phase (iAUC 0-30 min) (+51%) (p < 0.05). Similarly, when comparing the whole grain products, WGRP and WGRB, respectively, the 30 min incremental area (iAUC 0-30 min) was 43% larger following the porridge ( p < 0.05). Both rye porridges, ERP and WGRP, induced significantly higher insulin responses (iAUC 0-30 min) than the corresponding bread products, amounting to +96% and +87%, respectively. Also insulin incremental peak was signifcantly higher for ERP than ERB. For iAUC0-120, there was no significant difference anymore. |
| Al Dhaheri, 2017 | RCT-CO (?), postprandial focus |
United Arab Emirates; 25 | Healthy; only information for the whole cohort (n=88): Age mean: 22.1 ± 3.6 y., BMI 22.15 ± 1.89 kg/m2; 37 M, 51 F |
bread with yeast vs bread without | Arabic bread: Baked bread Baked in a masonry oven. Refined wheat flour, salt, yeast and water | Regag bread: Thin crispy crepe Baked in a pan. Refined wheat flour, salt and water | Chemical and nutritional analysis (moisture, protein, fat, fibre and ash; total carbohydrate content were estimated by difference). The energy content was calculated. | Portions of bread for 50g carbohydrate were given to participants with 200mL water. Participants were encouraged to consume the reference or test foods within 15 min and to minimise physical activity during the testing time. | Glycaemic index: GI=(iAUC for the test food containing 50 g of available carbohydrates)/( iAUC of a reference food with an equal available carbohydrates portion) x 100. glycaemic load: GL =(GI of test food x amount of available carbohydrate in a serving of test food (g))/100 | Arabic bread displayed a lower GI than regag bread ( 67 ± 5 vs 76 ± 7). No statistics were reported. Both breads were classified as low GL. Authors considered a difference in GI classification: medium for Arabic bread and high for Regag bread. |
| Kristensen 2010 | RCT-CO, postprandial focus |
Denmark; 16 | Healthy; Age mean: 24.1± 3.8y.; 6 M, 10 F |
2 comparisons of interest, each time bread vs pasta (once refined once wholegrain) | RWB (refined wheat bread) & WWB (wholegrain wheat bread) were made specifically for the present study by Barilla (BARILLA G. e R. Fratelli S.p.A., Parma, Italy). | RWP & WWP : the pasta products were commercially available products, also from Barilla. | Chemical and Nutritional analysis (macronutrient and micronutrient composition) | The four test meals were given as breakfast meals (with cheese and water) and each provided 50 g of available carbohydrates (total carbohydrates - dietary fiber) and 2MJ. | blood glucose response | The RWB meal resulted in significantly higher glucose concentrations at time points 30, 45, 60 and 90 min (p<0.05, p <0.011, p <0.01 and p<0.05,respectively) than the RWP meal. The AUC for glucose was strongly affected by meal (p <0.01), and was larger for the RWB meal compared to the RWP meal (p <0.01) . WWB result in significantly higher glucose concentrations at time points 45 and 60 min (p< 0.05) than the WWP meal. The AUC for glucose was strongly affected by meal (p <0.01), and was larger for the RWB meal compared to the RWP meal (p <0.01) and similarly larger for the WWB meal compared to the WWP meal (p<0.01). |
| Liljeberg 1999 | RCT-CO, postprandial focus |
Sweden; 10 | Healthy; Age from 22 to 57 y.; 4 M, 6 F | WWB vs. spaghetti. (only serie 2 relevant for us) | WWB A standardized white-wheat reference bread was mixed, kneaded, fermented, and baked in 4 steps in a home baking machine (Elektro Helios BA 10, Sanyo, Tokyo) as described previously (10). The bread was made from 300 g white-wheat flour (Kungsörnen), 200 g water, 3 g dry yeast, 3 g salt, and 3 g monoacylglycerols. |
Spaghetti The spaghetti (Kungsörnen) was made from 100% durum wheat flour with added monoacylglycerols and dried at a high temperature after being mixed and formed with a pasta extruder. The spaghetti was boiled for 12 min in 1 L water (containing 1 g NaCl) before being served. |
Chemical and nutritional analysis (Total starch, protein, fat, total dietary fiber). In vitro determination of amount of resistant starch. | a single breakfast meal (with cheese and olive oil and coffe or tea and 250mL water) was consumed on separate test days for each intervention. All test meals contained 50.0 g starch, 15.3 g protein, and 12.0 g fat and provided 1554 kJ. Four hours after the test and reference breakfast meals in series 1 and 2, the subjects were served a second meal—a standardized high-GI lunch. | Glycemic and insulinaemic indexes, glucose response after a second meal | Low Glycaemic Index and Insulinaemic index were found for spagetthi, both were high for WWB. Moreover, significantly lower glucose (45–70 min after the second meal) and insulin (0– 45 min after the second meal) concentrations were observed after the spaghetti than after the WWB breakfast. |
| Rosén, 2011 | RCT-CO, postprandial focus |
Sweden; 10 | Healthy; mean age 26.0 ± 1.1 y, mean BMI 22.6 ± 0.4 kg/m2; 5 M, 5 F |
whole grain rye breads vs boiled rye kernel (whole grain too) | Whole grain rye bread (WGRB) was made from 5000 g coarse whole grain rye flour, 3661 g water, 84 g dry yeast and 43 g NaCl (containing 5 mg KI/100 g). The dough was mixed for 8 minutes and proofed at room temperature for 30 minutes. It was divided into pieces of 1000 g each and placed in baking tins. The dough was subjected to a second proofing (38°C, 85 % humidity) during 45 minutes . Baking was performed initially at 250°C with 3 sec of steam. The temperature was then immediately lowered to 200°C and the breads were baked for 45 min. Whole grain rye flour was provided by Lantmännen R&D (Järna, Sweden). | The wholegrain rye kernels (RK) were prepared on the day of the experiment. 106.6 g whole rye kernels and 0.5 g NaCl were boiled in 189.5 g water for 35 minutes. All water was absorbed by the kernels. Whole grain rye kernels (commercial blends) were provided by Lantmännen R&D (Järna, Sweden). |
Nutritional and Chemical Analysis was performed (Total Starch, insoluble and soluble fiber, protein and fat content). Measurement of resistant starch. Energy content). Rate of starch hydrolysis (HI) was determined in vitro. |
The test meals (contributing 50g available starch) were provided in the morning with 250mL tap water on six different occasions in random order, separated by approximately 1 week. The subjects finished the bread meals within 14 min and the kernels within 25 min. | blood glucose and serum insulin responses + Glycaemic index, Glycaemic profile and Insulinaemic index calculation | no significant difference in glucose response between the 2 meals were found (neither index nor peak nor AUC). For insulin, only late response (AUC120-270) is significantly higher for RK than for WGRB. |
| Nilsson 2008 | RCT-CO, postprandial focus, effect measured at breakfast after evening meal with test breads |
Lund, Sweden; 20 | Healthy; Age from 19 to 30 y., BMI mean 22.1 ±2 kg/m2; 10 M, 10 F |
WWB+DF vs spaghetti+DF | High-GI white wheat bread (WWB, 122g) +barley dietary fibre (DF) corresponding to the DF content of barley kernels; The WWB was baked according to a standardized procedure in a home baking machine (Severin model no: BM 3983). An amount of 18.8 g of a barley DF extract (Lyckeby Stärkelsen, Kristianstad, Sweden), corresponding to 9.8 g barley DF (dry weight) was mixed with 250 ml water and consumed together with WWB (122 g). | low-GI spaghetti (as more RS) + barley DF. Uncooked spaghetti (70.9 g) (Kungsörnen, Järna, Sweden) was boiled for 7 min in 1 l water with 5 g NaCl. The barley DF extract, 18.8 g, (9.8 g DF, dry weight), was mixed with 250 ml water and consumed together with the spaghetti | Analysis of starch, resistant starch and dietary fibre (Soluble and Insoluble). | Test food were taken in the evening. All meals were based on 50 g potentially available starch. Water, 250 ml, was consumed with all meals. A standardized breakfast consisted of 117.5 g WWB (Jätterasken, Pagen AB, Malmö, Sweden), with the crust removed, was served in the mornings after the test meals | blood glucose and insulin responses (after standard breakfast) | No significant differences in fasting B-glucose or serum insulin concentrations nor in responses to the test breakfast were seen in the mornings after consuming the two evening test meals. |
| Liljeberg, 1996 | RCT-CO, postprandial focus |
Lund, Sweden; 9 but one of the women did not consume the meals with porridge | Healthy; age from 24 to 46, mean BMI 20.9 ± 1.5 kg/m2; 3M, 6 F |
High fiber porridge versus High fiber bread | The breads were baked from 150 g high fiber barley flour, 150 g common barley flour, 350 g water, 25 g baker's yeast and 3 g NaCl. The dough raised for 30 min and was then divided into 14 pieces. The dough pieces were rolled into thin cakes, followed by a second proofing for 10 min. Baking was performed in an ordinary kitchen oven at 250°C for 5 min | Whole-meal porridges were made from high fiber barley mixed with common barley, 50:50 (wet weight basis). The flours were suspended in water, flour-to-water ratio 1:3.5. An amount of flour corresponding to 30 g starch was added with water and NaCl (0.5g) and then boiled to porridge for 2.5 min in a saucepan. |
Chemical analysis of raw materiasl and test products. The raw materials (barley) were analyzed for starch, protein and amylose. Insoluble and soluble dietary fiber (incl. b-glucan) were determined in the raw materials and bread products. The porridges and barley bread products were also characterized with respect to degree of starch gelatinization, by analysis of the proportion of starch. The degree of gelatinization was calculated. | The test products were provided in amounts corresponding to 30 g starch. The portions of cheese (10 g/100 g fat wet weight) and butter were varied to standardize the amount of protein and fat in all of the test meals. Also included was a small amount of apricot puree (7.0 g), eaten as jam with the porridges or as "marmalade" with the breads. Low fat milk (150 mL) was served with the porridges, water (300 mL) with the bread meals, and coffee/tea (150 mL) was included in each meal. All test meals contained 31.5 g carbohydrates, 14.1 g protein and 6.0 g fat, corresponding to 997 kJ. All meals were consumed steadily over a 12- to 15-min period. | capillary blood glucose and insulin responses, Glycaemic index and Insulinaemic index calculation | no difference for glucose (neither response nor index) between the 2 test meals were found. Incremental insulin response at 30' and insulinaemic indexes (both at 95' and 120') were significantly higher for HFP than HFB. |
Table 3.
Characteristics of the studies, fermented bread used and main results on glycaemia/insulinaemia outcomes for effect of fermented bread consumption on glycaemia.
Table 3.
Characteristics of the studies, fermented bread used and main results on glycaemia/insulinaemia outcomes for effect of fermented bread consumption on glycaemia.
| First Author, year of publication | Study design, focus | Population (location); final nb of participants | Population characteristics (age, BMI, sex distribution) | comparison(s) of interest, cereal, flour quality | fermented bread(s) (details on production) | bread characterisation | Intervention details | outcome(s) | Principal effect |
| MacKay, 2012 | originally RCT-CO, long term (6 weeks period) | Ontario, Canada; n=2x14 | normoglycemic/normoinsul inemic (NGI) (n = 14 NGI; age 53 ±6 y; BMI 26.5 ± 2.9 kg/m2; 10 M, 4 F (postmenopausal)) and hyperglycemic/hyperinsulin emic (HGI) (n = 14 HGI; age 57 ±7 y; BMI 35.7 ± 5.7 kg/m2; 10 M, 4 F (postmenopausal)). |
before after for both breads (refined white wheat and whole grain wheat sourdough) | whole grain wheat sourdough bread (Stonemill 11-Grain sourdough, provided by Stonemill Bakehouse, Toronto, Canada). It consisted predominantly of whole grain wheat flour (37% dry weight) and also contained other ingredients including non-wheat grains (18% dry weight: whole grain spelt and rye flours, brown flax seeds, rolled oats, cracked soy, yellow flax seeds, millet seeds, malted barley flour, brown rice flour, millet flour, durum semolina and organic sourdough made from natural bacterial culture, whole grain spelt and rye flours). Refined white bread (Wonder Enriched white bread, Weston Bakeries Limited, Toronto, Canada) | only calculated nutritional composition | Bread quantity was 136.5-163.8 g bread/d (6-7 grain servings/d) for women and 159.3-182.0 g bread/d (7-8 grain servings/d) for men. Participants consumed the treatment bread in place of other bread products, were advised to maintain their habitual diet and activity levels throughout the study, and to avoid natural health products (except multi-vitamin/ mineral supplements). | fasting gluc, insulin and HOMA- IR + OGTT gluc and insulin response before and after intervention period. Insulinogenic index (IGI), an index of early insulin secretion, was calculated as insulin at 30 min post OGTT- fasting insulin/glucose at 30 min post OGTT-fasting glucose |
Fasting glycemic parameters did not significantly differ at either day 1 or day 43 for both bread treatments and within either the NGI or HGI group: as those differences are higher than the differences between day 1 and day 43, probably no significant change eithe (no tests performed). OGTT responses probably also not significantly differing between before and after intervention. |
| Pagliai 2020 | originally RCT-CO, long term (4 weeks period) | Florence, Italy; n=17 | clinically healthy volunteers; mean age 34.6 ± 9.1 y.; mean BMI 22.4 ± 2.5 kg/m2; 10 M, 7F |
SD vs BY and change (before-after), wheat, no info on flour | SD: consumed bread made with ancient grain “Verna” and sourdough (SD). All the procedures for the preparation of the transformation were identical both for the intervention breads and for the control breads, with the exception of the type of leavening agent used. Main LAB species: Lactobacillus sanfranciscensis and L.plantarum. BY: consumed control bread, made with ancient grain “Verna” and baker’s yeast (BY) | Sourdough was analysed microbiologically (LAB and yeast counts and genotyping) and chemically (pH, total titratable acidity and organic acids) | Participants were provided 150 g/day of bread. Throughout the study period, all participants were instructed to maintain their usual eating and lifestyle habits and were not allowed to eat other types of bread. | change in fasting blood glucose | a statistically significant increase of fasting blood glucose (+6%; p=.012) was observed only after BY, while no significant variations were observed after SD. |
| Lappi 2014 | originally RCT-CO, long term (4 weeks period) | Finland; n=21 | healthy population who self- reported gastrointestinal symptoms after ingestion of grain products. Age from 38 to 65 years, BMI from 19 to 30 kg/m2; 9 M, 12 F |
before-after for both breads: wholegrain sourdough rye bread (WGR) and white wheat bread (WW) that was enriched with rye bran bioprocessed with enzymes and yeast (BRB) ( BRB +WW) | For baking the WGR, wholegrain rye flour was fermented with Baker’s yeast and lactic acid bacteria (Lb. brevis, Lb. plantarum) for 22 hours at 30°C. The sourdough was mixed thoroughly at the beginning of fermentation but not during the process. The sourdough was used at the 50% of substitution level in baking. The bran for the BRB + WW was fermented with enzymes and yeast and the bread was baked as previously described [24]. The bread dough were left to rest for 20 min in 28°C and 75% relative humidity, mixing twice for two and four minutes during resting. The breads were prepared in 400 g dough pieces, proofed for 50 min in 35°C and 80% relative humidity, and baked in 225°C for 20 min, with 15 seconds steaming in the beginning. Refined WWs were two commercial breads with 100% white wheat flour (Vaasan Oy, Finland). |
chemical composition analyses with focus on fibers | During the test periods, the subjects were asked to consume 6-10 slices (25-30 g/slice) of the WGR and BRB +WW daily. The subjects were advised to follow their habitual living habits throughout the study. after 4wk run-in with WW |
glucose and insulin, both fasting and postprandial response after a test meal; calculated first phase insulin secretion and disposition index | no difference in fasting glucose between before (=end of WW period) and after for both test bread periods. No differences in the postprandial glucose response. Response of plasma insulin to the meal test was lower after the WGR period than before ( ie after the WW period) at 120 min (p = 0.023, Wilcoxon test). Also, DI differed being higher after the WGR period as compared to before (end of the WW period; 3614 ± 2883 vs. 2500 ± 1336, p = 0.033, Wilcoxon). |
| Todesco 1991 | originally RCT-CO, long term (1 week period) | Guelph, Canada; n=6 | Healthy subjects with ideal body weight. Age: 31.5 ± 10.7 y.; weight: 60.5 ±12.8kg, height: 164.1 ±8.0 cm; 3M, 3F |
before and after effect for normal WW bread and WW+propionate | Each loaf was made from 334 g commercial white flour (Five Roses, Los Minoteries Oglivie Mills Ltd, Montreal), 7 g fastacting yeast (Rapidmix; Fleischmann’s Yeast Limited, Rexdale, Ontario), 7 g sugar, and 300 mL water. The dough was allowed to rise in an oven at 70 °C for 1 h and was then baked at 165°C for 50 mm. Each loaf contained five, 50-g carbohydrate portions, as calculated from food tables. Propionate bread was done similarly, adding 16,5 g sodium propionate to the dough. |
in vitro digestion (starches) | Volunteers were provided with 150g carbohydrate as bread to be consumed each day, maintaining their regular diets throughout the study. | glucose response postprandially of a standard meal | The blood glucose areas for the bread challenges performed at the beginning and the end of the control period were virtually identical, 157 ± 22 and 151 ± 18 mmol/min/ L, respectively. The glucose response to a standard meal challenge was lower after 1 wk propionate bread |
| Ren, 2018 | Open-label, self- controlled clinical trial, long term (12 weeks intervention) | China, n=64 | Free-living subjects with impaired glucose tolerance (IGT). Age 56,0 ± 7,1 y; BMI 26.0 ± 3.5 kg/m2; 27 M, 37 F |
before and after effect, Foxtail millet steamed bread | Foxtail millet steamed bread was cooked and vacuum packaged, according to the instruction by Ren at al. 2016 (375g of foxtail millet flour,125 gof extruded flour,10 g of active dry yeast (Saccharomyces cerevisiae) and 200 mL of water were placed into a YB-108 stand mixer (Yaobang, Zhejiang, China), followed by mixing and kneading for 8 min, fermenting under a temperature of 37 C and a relative humidity of 80% for 90 min in fermentation cabinet, and steaming for 30 min after shaping by hand. Saccharomyces cerevisiae was used as fermentation starter culture. |
none here, but in previous publication: in vitro starch digestibility, degree of gelatinization | 90g of foxtail millet steamed bread, containing 50 g foxtail millet in raw weight, was provided to participants every day throught the 12 weeks of intervention. The administered steamed bread was in addition to their habitual daily diet, and the subjects were encouraged to remain on their normal dietary habit aside from substituting equivalent food by steamed bread. | glucose and insulin, both fasting values + postprandial response to test, calculated HOMA-IR and HOMA-IS, + fasting C-peptide, fructosamine and GLP1 |
The intake of foxtail millet induced significant decrease in FBG (p < 0.001) and 2 h-glucose (p = 0.003) in subjects with IGT. There were no significant difference of fasting insulin and 2 h-insulin concentrations during the intervention period (all p > 0.05) whereas HOMA-IR was significantly decreased from 3.6 ± 2.3 at week 0 to 2.9 ± 1.7 at week 12 (decreased by 19.8 ± 46.1%, p=0.015) and HOMA-IS increased from 0.4 ± 0.2 at week 0 to 0.5 ± 0.6 at week 12 (increased by 36.7 ± 159.1). No significant change for fructosamine, GLP-1 and C-peptide observed. |
| Juntunen, 2003 | originally RCT-CO, long term (8 weeks period) | Kuopio, Findland; n=20 | healthy postmenopausal women, 3 with impaired glucose tolerance. Age 59 ± 6.0 y.; BMI from 20 to 33 kg/m2 |
before-after for both breads: WWB and HFRB | high-fiber rye bread and white-wheat bread. The high-fiber rye bread (17% dietary fiber) was prepared by increasing the content of rye bran in the bread. To increase compliance with consumption of the high-fiber rye bread during the 8-wk bread period, 2 commercial bakeries (Fazer Bakeries Ltd, Lahti, Finland and Vaasan & Vaasan Oy, Helsinki) made from the basic recipe 4 products varying in appearance but with similar nutrient composition. Seven different white-wheat breads (2.8% dietary fiber) produced from refined wheat flour were offered during the wheat bread period. The wheat breads were also supplied from the 2 above-mentioned bakeries |
nutrient composition | The portions of wheat breads weighed 20.8–25.0 g. One portion of wheat bread contained on average 241 kJ (range: 233–249 kJ) and 0.6 g fiber (range: 0.5–0.8 g). A minimum of 4–5 portions of the test breads had to be eaten each day, and the number of portions to be eaten varied according to the daily energy intake of the individual. There was no maximum for the amount of bread to be consumed, but the subjects were advised to eat the bread in amounts corresponding to cereal consumption in their habitual diet. Otherwise, the diet was to be maintained unchanged. | glucose and insulin, both fasting values + response to FSIGTT and resulting insulin sensitivity, glucose effectiveness and calculated acute insulin response (AIR) | Neither plasma glucose nor insulin fasting concentrations did change significantly during the bread periods (P = 0.958 and P = 0.993 resp.). No significant changes were seen in glucose effectiveness nor in insulin sensitivity nor in AIR during the study. |
Disclaimer/Publisher’s Note: The statements, opinions and data contained in all publications are solely those of the individual author(s) and contributor(s) and not of MDPI and/or the editor(s). MDPI and/or the editor(s) disclaim responsibility for any injury to people or property resulting from any ideas, methods, instructions or products referred to in the content. |
© 2026 by the authors. Licensee MDPI, Basel, Switzerland. This article is an open access article distributed under the terms and conditions of the Creative Commons Attribution (CC BY) license (http://creativecommons.org/licenses/by/4.0/).
Copyright: This open access article is published under a Creative Commons CC BY 4.0 license, which permit the free download, distribution, and reuse, provided that the author and preprint are cited in any reuse.


