
Submitted:
06 June 2026
Posted:
08 June 2026
You are already at the latest version
Abstract
Chlorophyll content represents a key growth indicator for maize. The traditional SPAD method, though easy to operate, is inefficient, destructive, and unsuitable for high throughput field monitoring. Unmanned Aerial Vehicle (UAV) remote sensing technology is highly efficient and detects abundant indicators, enabling large-scale SPAD measurement. In this study, 18 vegetation indices and 8 texture features were selected as the indicator system by combining prior knowledge and experimental analysis. In a two-year maize density experiment, multispectral images were collected in the full growth period. The correlations between SPAD values, multispectral indices and texture features were analyzed using Pearson correlation coefficients. Then the detection accuracies of three algorithms i.e. Random Forest (RF), Partial Least Squares Regression (PLSR), and Support Vector Regression (SVR), were compared under this indicator system. Compared with models constructed using single vegetation indices or single texture features, the estimation accuracy of the indicator system at the jointing stage was improved by 0.13 and 0.22, respectively. The results showed that SVR achieved the highest estimation accuracy among the three algorithms, with determination coefficients (R²) of 0.73, 0.77and 0.70 at the jointing, silking, and grain-filling stages, respectively. This study established a non-destructive monitoring framework for chlorophyll content during entire maize growth period based on UAV data.
Keywords:
Zea Mays L.
; planting density maize
; plant density
; SPAD estimation
; UAV
; machine learning
1. Introduction
Maize (Zea mays L.) is an important crop because of its suitability for a variety of purposes, such as food, energy consumption and animal feeds [1]. Leaf nitrogen content is a core indicator for maize nutrition and vigor diagnosis [2]. SPAD (Soil and Plant Analyzer Development) values can quantitatively characterize crop nitrogen nutrition and chlorophyll levels, which is critical for precise nitrogen application and yield regulation [3,4]. Traditional manual measurement is labor-intensive and cannot meet modern agricultural monitoring needs [5], while UAV multispectral remote sensing enables efficient non-destructive SPAD inversion, serving as a key tool for precision agriculture monitoring [6,7].
In recent years, UAV-borne multispectral remote sensing has been increasingly applied in precision agriculture, especially for the inversion of crop SPAD values. It is difficult to construct a stable inversion model for the full growth period relying solely on single spectral information [8]. The key lies in constructing stable and highly generalizable estimation models suitable for multi-variety, multi-region, and multi-climate scenarios. Various VIs derived from canopy reflectance have been successfully applied to chlorophyll estimation and crop growth evaluation [9,10]. However, crop spectral characteristics change continuously throughout the growth period, and their correlation with chlorophyll content also varies accordingly. It is difficult to construct a stable inversion model for the full growth period relying solely on single spectral information. Image texture features can effectively compensate for the deficiencies of spectral information, providing a new approach to solving this problem.
Texture features extracted from remote sensing images can quantitatively describe the spatial distribution and structural heterogeneity of crop canopies [11]. Therefore, in spectral inversion, they effectively alleviate the signal saturation problem of traditional VIs under high canopy closure and compensate for the instability of spectral signals caused by variations in growth stages and environmental conditions. By integrated VIs with texture features, the accuracy, stability, and generalization ability of physiological parameter inversion models can be significantly improved [12]. In agricultural applications, texture features have been widely used in non-destructive monitoring of crop growth, SPAD estimation [13], yield prediction [14] and stress detection. They provide critical spatial structural information that spectra alone cannot capture, especially for dense planting populations. Therefore, integrating texture features into remote sensing inversion has become an important means to promote high-precision and intelligent monitoring in precision agriculture.
However, most existing studies focus on a single growth stage or specific environmental conditions. The limited research on SPAD estimation models for summer maize full growth period on flied conditions is still a core challenge. This study aimed to explore the feasibility of accurately estimating maize canopy SPAD values in the full growth period using multispectral remote sensing. A total of 12,240 UAV multispectral images were collected over two years under different maize planting densities. Based on the correlations among SPAD values, VIs, and texture features, 18 VIs and 8 texture features were extracted to construct an indicator system for SPAD values estimation from UAV remote sensing imagery. The estimation accuracies of three algorithms were compared, confirming the Support Vector Regression (SVR) as the optimal one, and its feasibility for estimating maize canopy SPAD values under field conditions was verified.
2. Materials and Methods
2.1. Experiment Location and Design
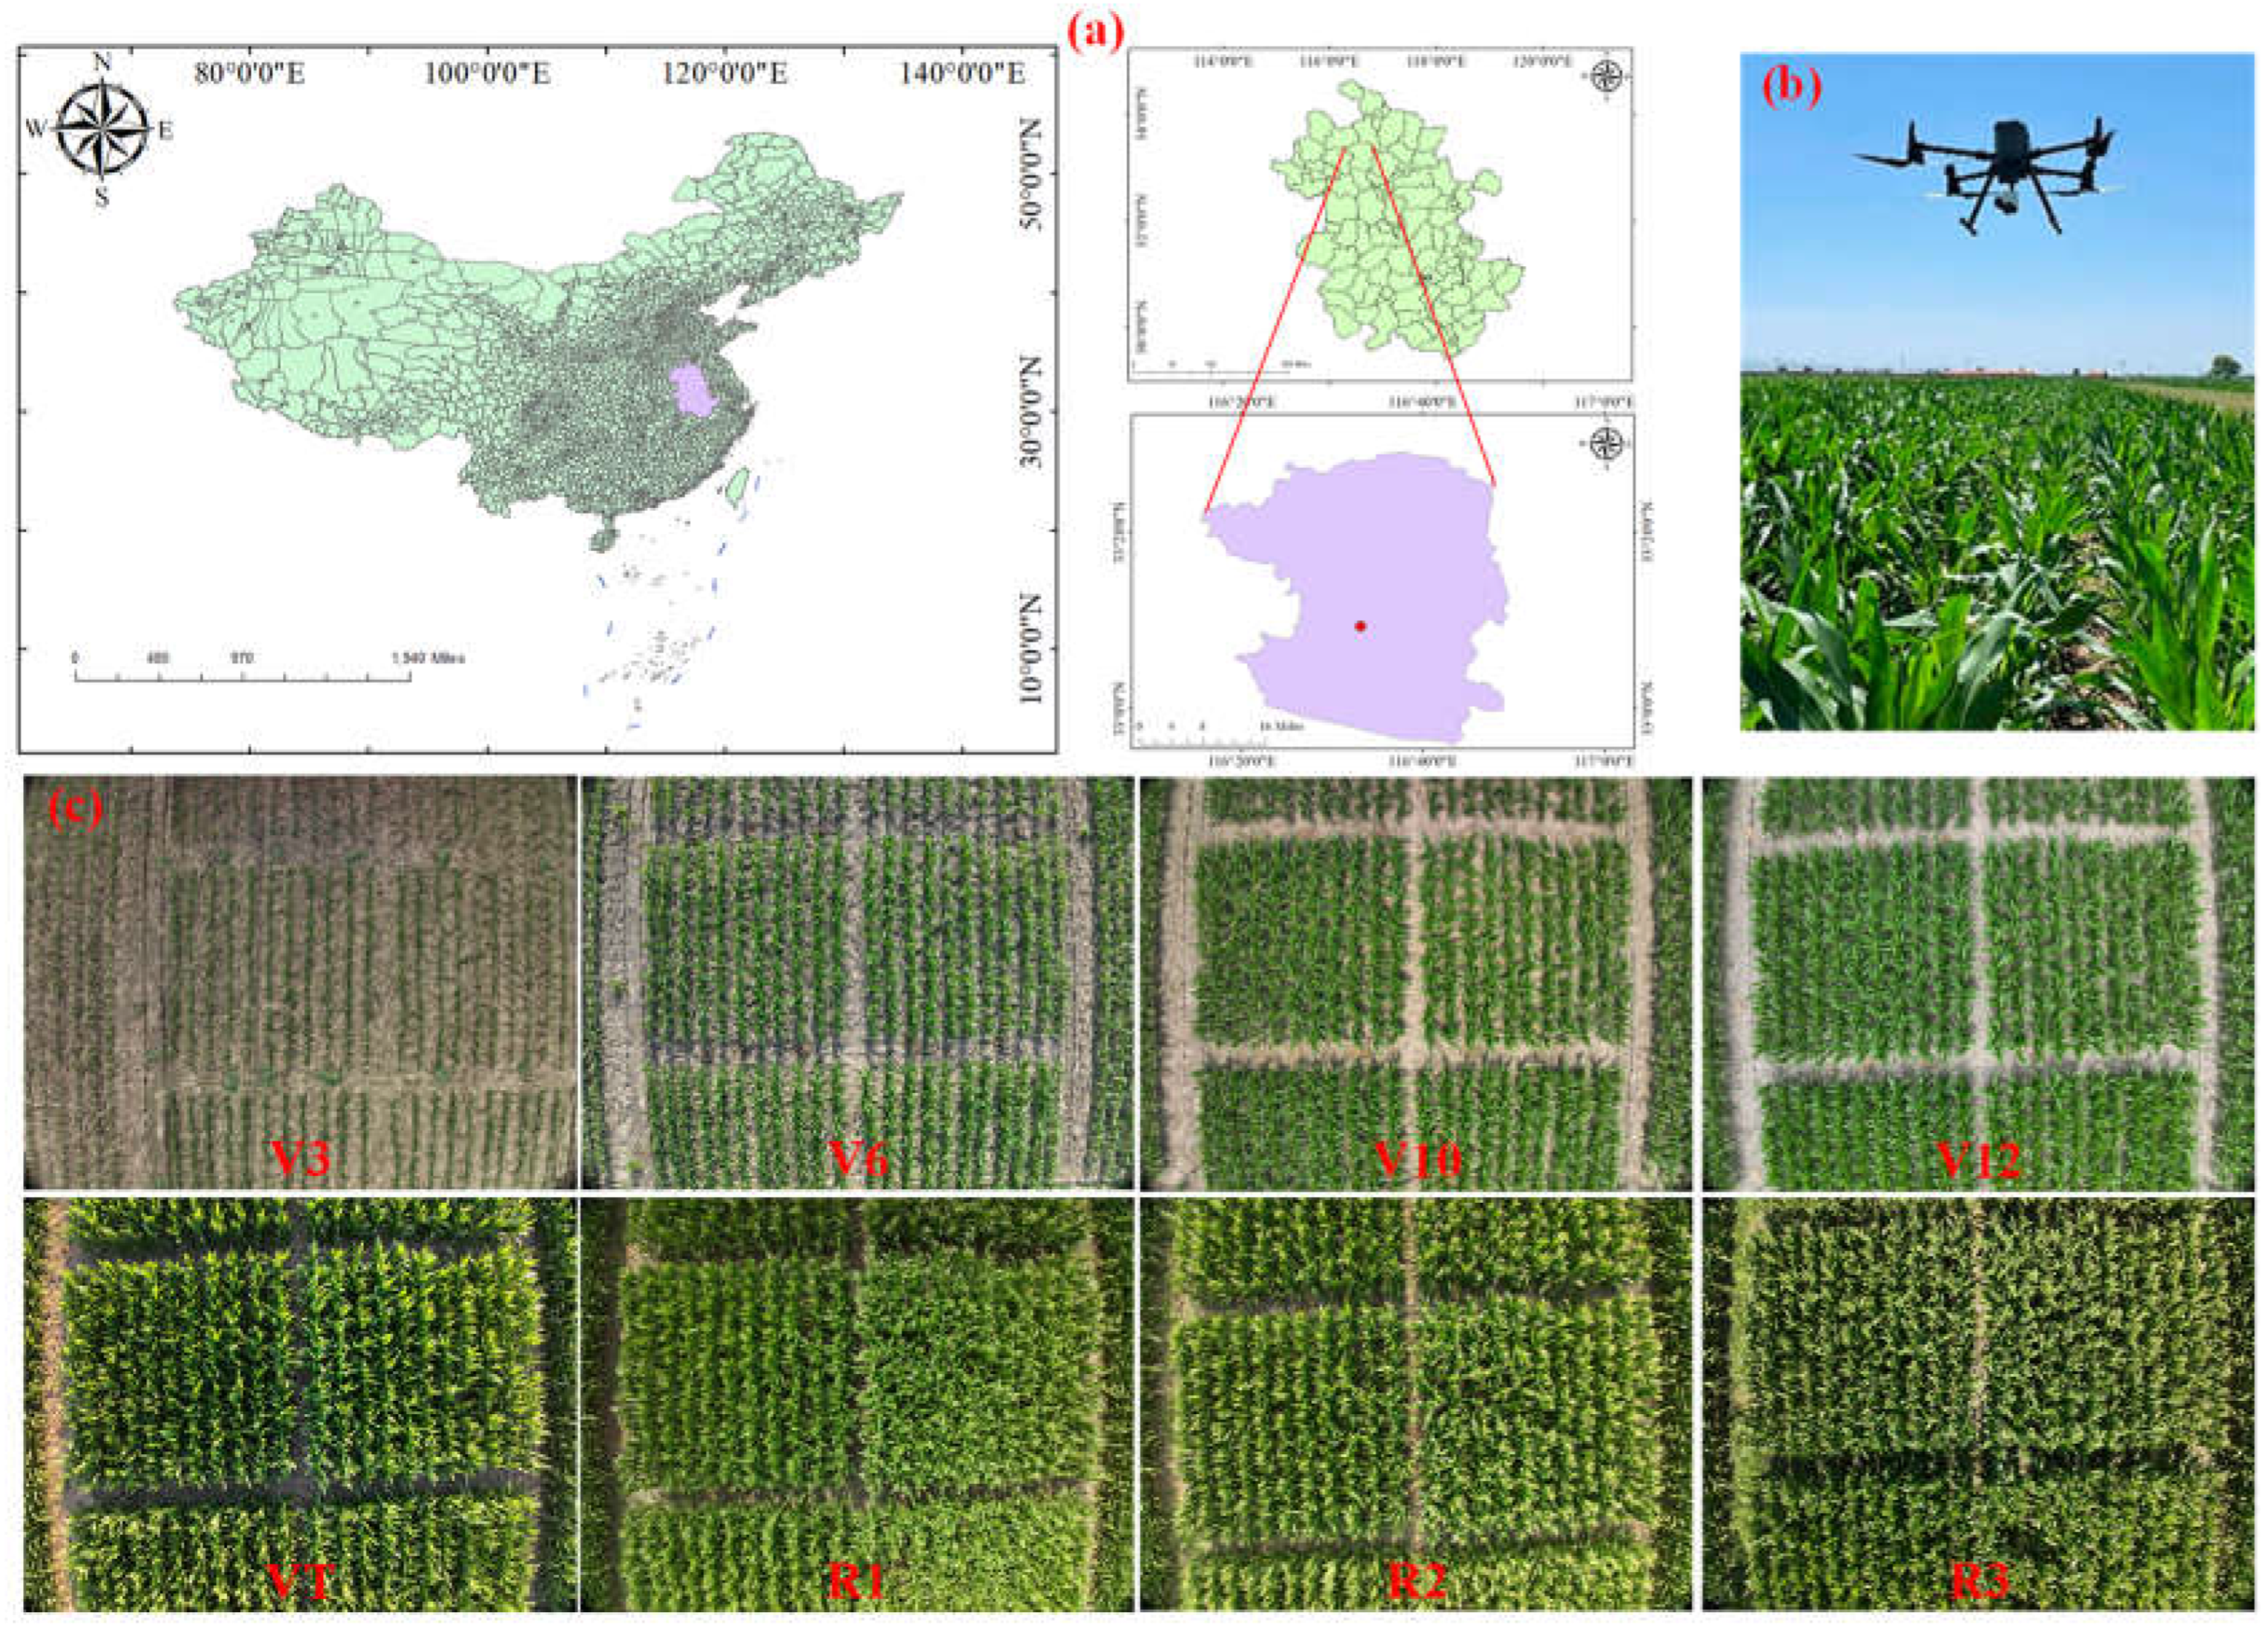
Field trials were conducted Field trials were conducted at the Mengcheng County Agricultural Technology Demonstration Farm in Bozhou City, Anhui Province, China (33°9′N, 116°32′E). In this study, we used two widely grown maize cultivars in the Huang-Huai-Hai region i.e. ZD958 and MY73 and set up four planting densities i.e. PD3 (30,000 plants ha⁻¹), PD6 (60,000 plants ha⁻¹), PD9 (90,000 plants ha⁻¹), and PD12 (120,000 plants ha⁻¹). Image data were collected during the 2023 and 2024 maize growing seasons using a DJI M300 RTK UAV equipped with an AQ600 Pro multispectral sensor. The AQ600 Pro is a standard professional UAV multispectral camera equipped with 5 multispectral channels (3.2 megapixels per channel) and 1 RGB channel (12.3 megapixels). Multispectral data preprocessing was performed using DJI Terra (v5.0.2). Band math, region of interest (ROI) definition and pixel statistics were conducted in ENVI software to extract the average reflectance of each plot, which was used as the spectral reflectance sample for each band. A total of 12,240 multispectral images of maize during the growth period (covering V3, V6, V10, V12, VT, R1, R2, R3) were collected on flied conditions. Then a representative dataset, called SPADmaize_ahau, was established and divided into a training set and a test set at a ratio of 8:2. In the 20% validation set, multispectral images of the growth period of maize under different planting densities are included.
To verify the accuracy of SPAD values retrieved by remote sensing, SPAD-502 chlorophyll meter (Konica Minolta, Ltd, Japan) was used to measure ground-based SPAD values synchronously with remote sensing data acquisition, so as to characterize the chlorophyll content of summer maize. The measurement accuracy of the instrument was ±1.0 SPAD units, and the repeatability error was ±0.3 SPAD units. Three maize plants with uniform growth were randomly selected in each plot under each treatment, and the SPAD values of fully expanded leaves were measured. The SPAD values were measured at the leaf tip, middle, and base of healthy and intact leaves, and the mean value for each treatment was calculated.
Figure 1.
The illustration of the experiment. (A) Field trial in Bozhou, Anhui. (B) UAV multispectral data collection. (C) Multispectral images of maize growth stages.
Figure 1.
The illustration of the experiment. (A) Field trial in Bozhou, Anhui. (B) UAV multispectral data collection. (C) Multispectral images of maize growth stages.
2.2. Indicator System
VIs dominates SPAD inversion by reflecting biochemical information, while texture features supplement spatial structural details and their integrated effectively improves estimation accuracy. Drawing on prior findings and the responsiveness of chlorophyll content to spectral features, this work selected the indices listed in Table 1 to explore their correlation with SPAD values in summer maize. Meanwhile, all feasible texture indicator integrated were constructed across five spectral bands (450, 560, 650, 730, and 840 nm). A total of eight texture features based on the Gray-Level Co-occurrence Matrix (GLCM) were used: mean (mean), variance (var), homogeneity (hom), contrast (con), dissimilarity (dis), entropy (ent), second moment (sm), and correlation (cor) (Yue et al., 2019). Multifeatured integrated effectively compensates for the limitations of single spectral or texture information, which is crucial for improving the accuracy and stability of SPAD simulation. Detailed information on the texture features corresponding to each spectral band is provided in Table 2.
2.3. Model Selection
Multifeatured integrated effectively compensates for the limitations of single spectral or texture information, which is crucial for improving the accuracy and stability of SPAD estimation. Previous studies have widely applied the SVR algorithm to handle multi-feature integrated tasks in the retrieval of vegetation physiological parameters. As a core algorithm branch of Support Vector Machine (SVM) for regression tasks, SVR is a classic machine learning method based on the structural risk minimization principle, which achieves data fitting and continuous value prediction by constructing an ε-insensitive loss function. In the remote sensing inversion modeling of maize canopy SPAD based on multi-feature integrated, the SVR model presents strong adaptability to high-dimensional fused features, fully integrates the complementary information of spectral and texture features. It significantly outperforms conventional regression algorithms in terms of SPAD estimation accuracy, model stability and cross-scene generalization ability. For multi-feature integrated modeling, SVR effectively mitigates the curse of dimensionality and overfitting in small-sample high-dimensional feature space, and its superior nonlinear fitting ability fully exploits the intrinsic relationship between multi-source features and SPAD values to maximize the performance of multi-feature integrated. The model performance was then evaluated using SPADmaize_ahau.
Figure 2.
Flowchart of SPAD Inversion Using VIs and Texture Features.
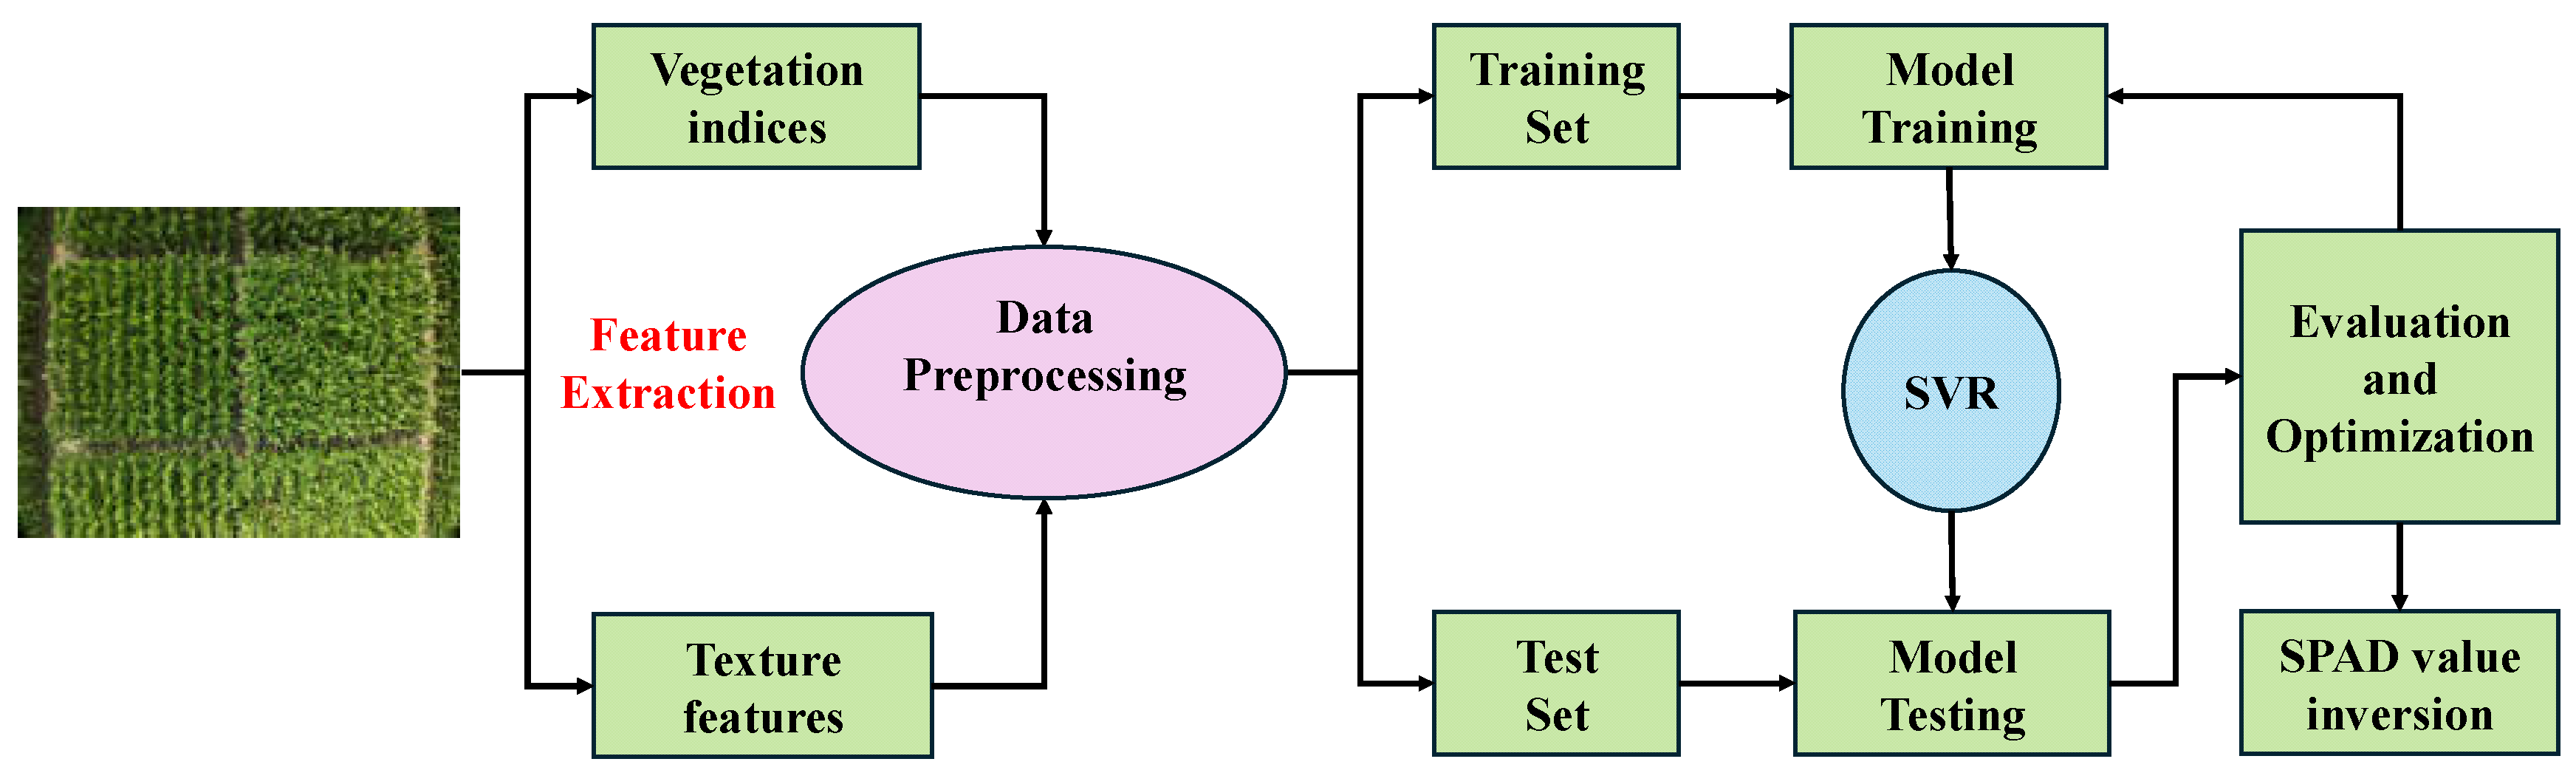
In this study, the performance of the SPAD inversion models was evaluated using two accuracy metrics: Root Mean Squared Error (RMSE) and Coefficient of Determination (R²).A value of R² closer to 1 indicates a better model fit. Meanwhile, a lower RMSE corresponds to smaller prediction errors, representing higher overall accuracy and more robust estimation performance. The calculation formulas are as follows.
Where denotes the measured SPAD value, is the model's prediction, signifies the mean observed value, and n represents the total number of samples. Together, these indices serve to gauge the model's performance, delivering insights into its accuracy and estimation power across multiple dimensions.
3. Result
3.1. Chlorophyll Content at Different Growth Stages
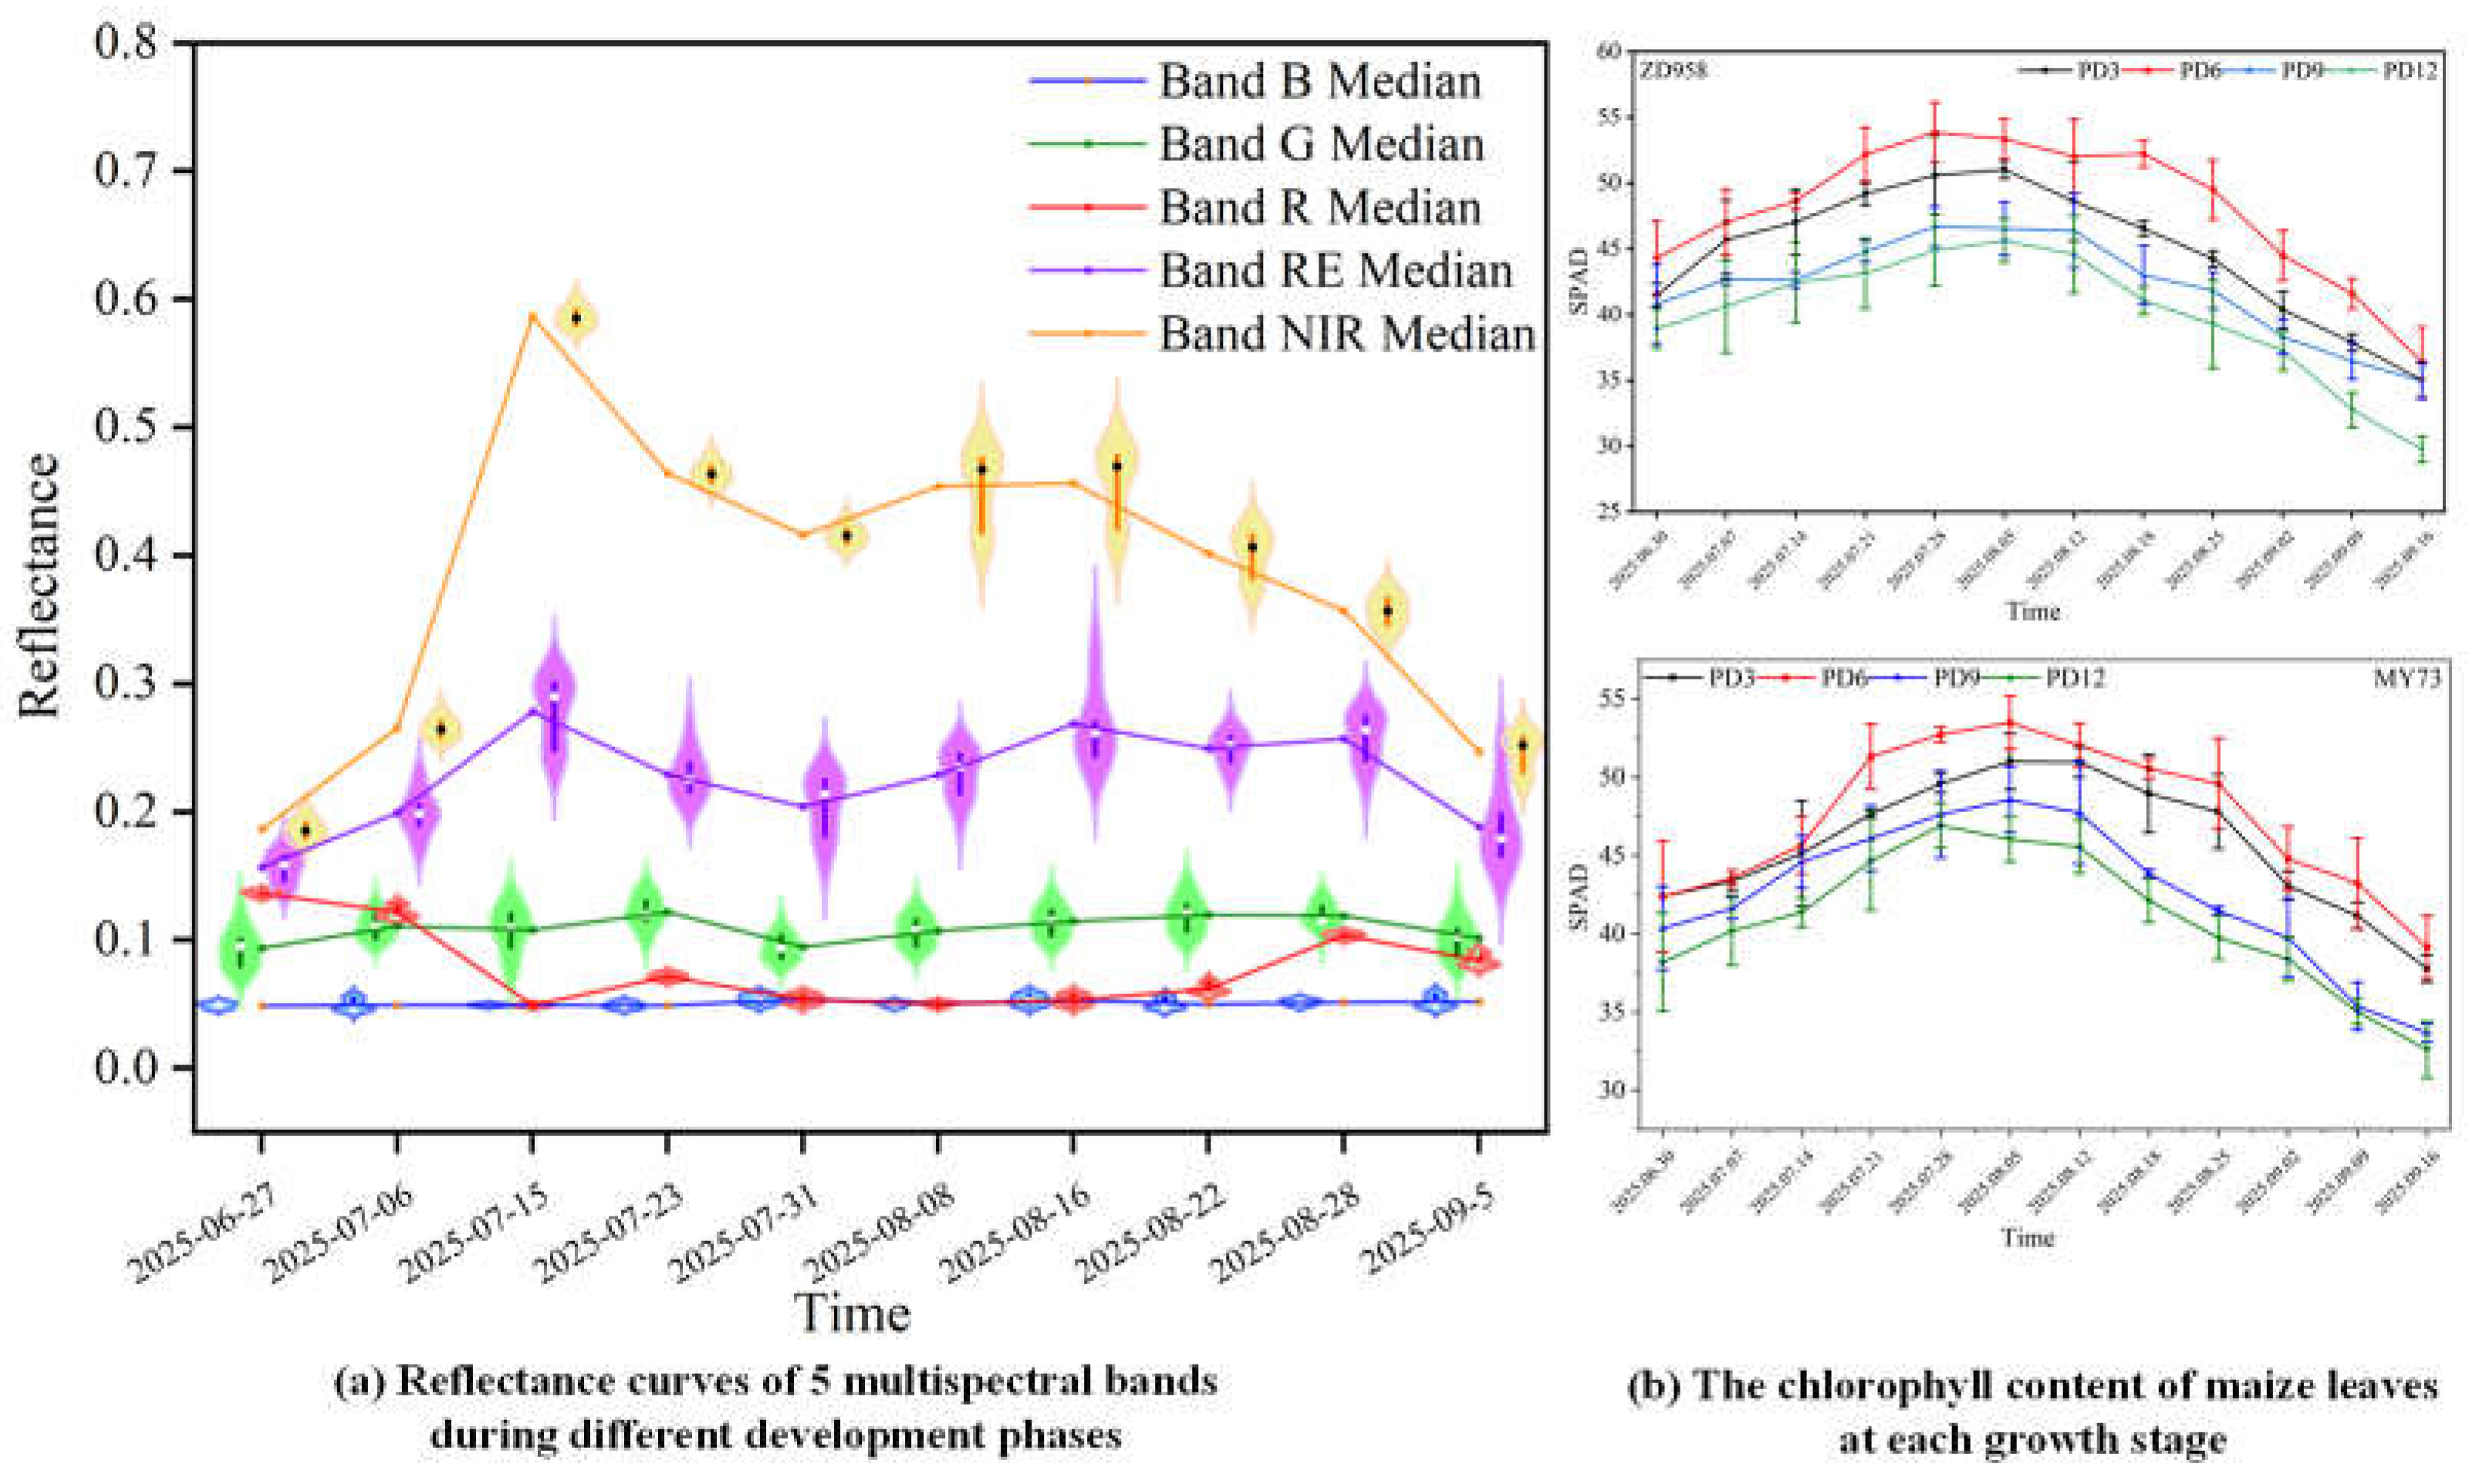
To accurately characterize the dynamic trend of leaf chlorophyll content in summer maize full growth period and facilitate comparative experiments with remote sensing data, the SPAD values measured using the SPAD-502 are presented in Fig.3(b), while the temporal variations in reflectance across five multispectral bands are recorded in Fig.3(a). The SPAD value of summer maize exhibits a unimodal trend throughout the full growth period, increasing initially and peaking at the flowering and grain-filling stage, followed by a rapid decline in the late growth stage. This dynamic pattern is highly coupled with the temporal variation of reflectance across the five multispectral bands. Specifically, the reflectance of the near-infrared (NIR), red-edge (RE), and green (G) bands shows a significant positive correlation with SPAD values, displaying a fully synchronous temporal trend their reflectance remains at a high level with the smallest fluctuation during the SPAD peak period. In contrast, the reflectance of the red (R) and blue (B) bands is negatively correlated with SPAD values, decreasing as SPAD increases and exhibiting an opposite trend in the late growth stage. Since most VIs are constructed from integrated of these chlorophyll-sensitive bands, they can effectively amplify the correlation between spectral signals and SPAD values. Consequently, VIs demonstrates a strong correlation with SPAD values and serves as core input indicators for SPAD remote sensing inversion in summer maize.
Figure 3.
Dynamic in SPAD values and multi-band spectral reflectance characteristics of summer maize during mazie growth period. Note: PD3(30000 plants/ha), PD6(60000 plants/ha), PD9(90000 plants/ha), PD12(120000 plants/ha). Error bars indicate standard deviation.
Figure 3.
Dynamic in SPAD values and multi-band spectral reflectance characteristics of summer maize during mazie growth period. Note: PD3(30000 plants/ha), PD6(60000 plants/ha), PD9(90000 plants/ha), PD12(120000 plants/ha). Error bars indicate standard deviation.
3.2. Correlation Analysis Between VIs, Texture Features and SPAD Values
For scenarios where the canopy closes and VIs generally suffers from spectral saturation during the mid-to-late growth stages of maize, texture features can overcome the limitation of spectral saturation by capturing differences in spatial heterogeneity, thereby enabling effective inversion of chlorophyll content. However, across the entire growth period, the correlation between VIs and SPAD values is significantly stronger than that of texture features. Therefore, to evaluate their correlations, this study conducted correlation analyses between measured SPAD values, VIs and texture features. The results at the jointing stage are presented in Fig. 4 and Table 3, with detailed information provided in Appendix 1. The results showed that most VIs were extremely significantly correlated with SPAD values at each growth stage (P<0.001). Red-edge vegetation indices presented the optimal performance at the jointing stage, with correlation coefficients of DATT and MTCI reaching 0.67, and those of NDRE, CIre and other red-edge indices all exceeding 0.62, while the green band showed an extremely strong negative correlation with SPAD (r=-0.70). Red-edge indices remained sensitive to chlorophyll changes at the silking stage, with correlation coefficients of DATT, NDRE and CIre of 0.55, 0.52 and 0.52, respectively. The correlation between near-infrared integrated vegetation indices and SPAD increased significantly at the grain filling stage, with correlation coefficients of RVI, VIopt, OSAVI and other indices all exceeding 0.75, and the red band showed a strong negative correlation with SPAD (r=-0.71). This study clarified the optimal VIs for SPAD inversion of summer maize at different growth stages and provided reliable technical support for non-destructive field monitoring of nitrogen nutrition throughout the full growth period.
Figure 4.
The interplay of spectral and SPAD features: a correlation assessment during the jointing stage.
Figure 4.
The interplay of spectral and SPAD features: a correlation assessment during the jointing stage.
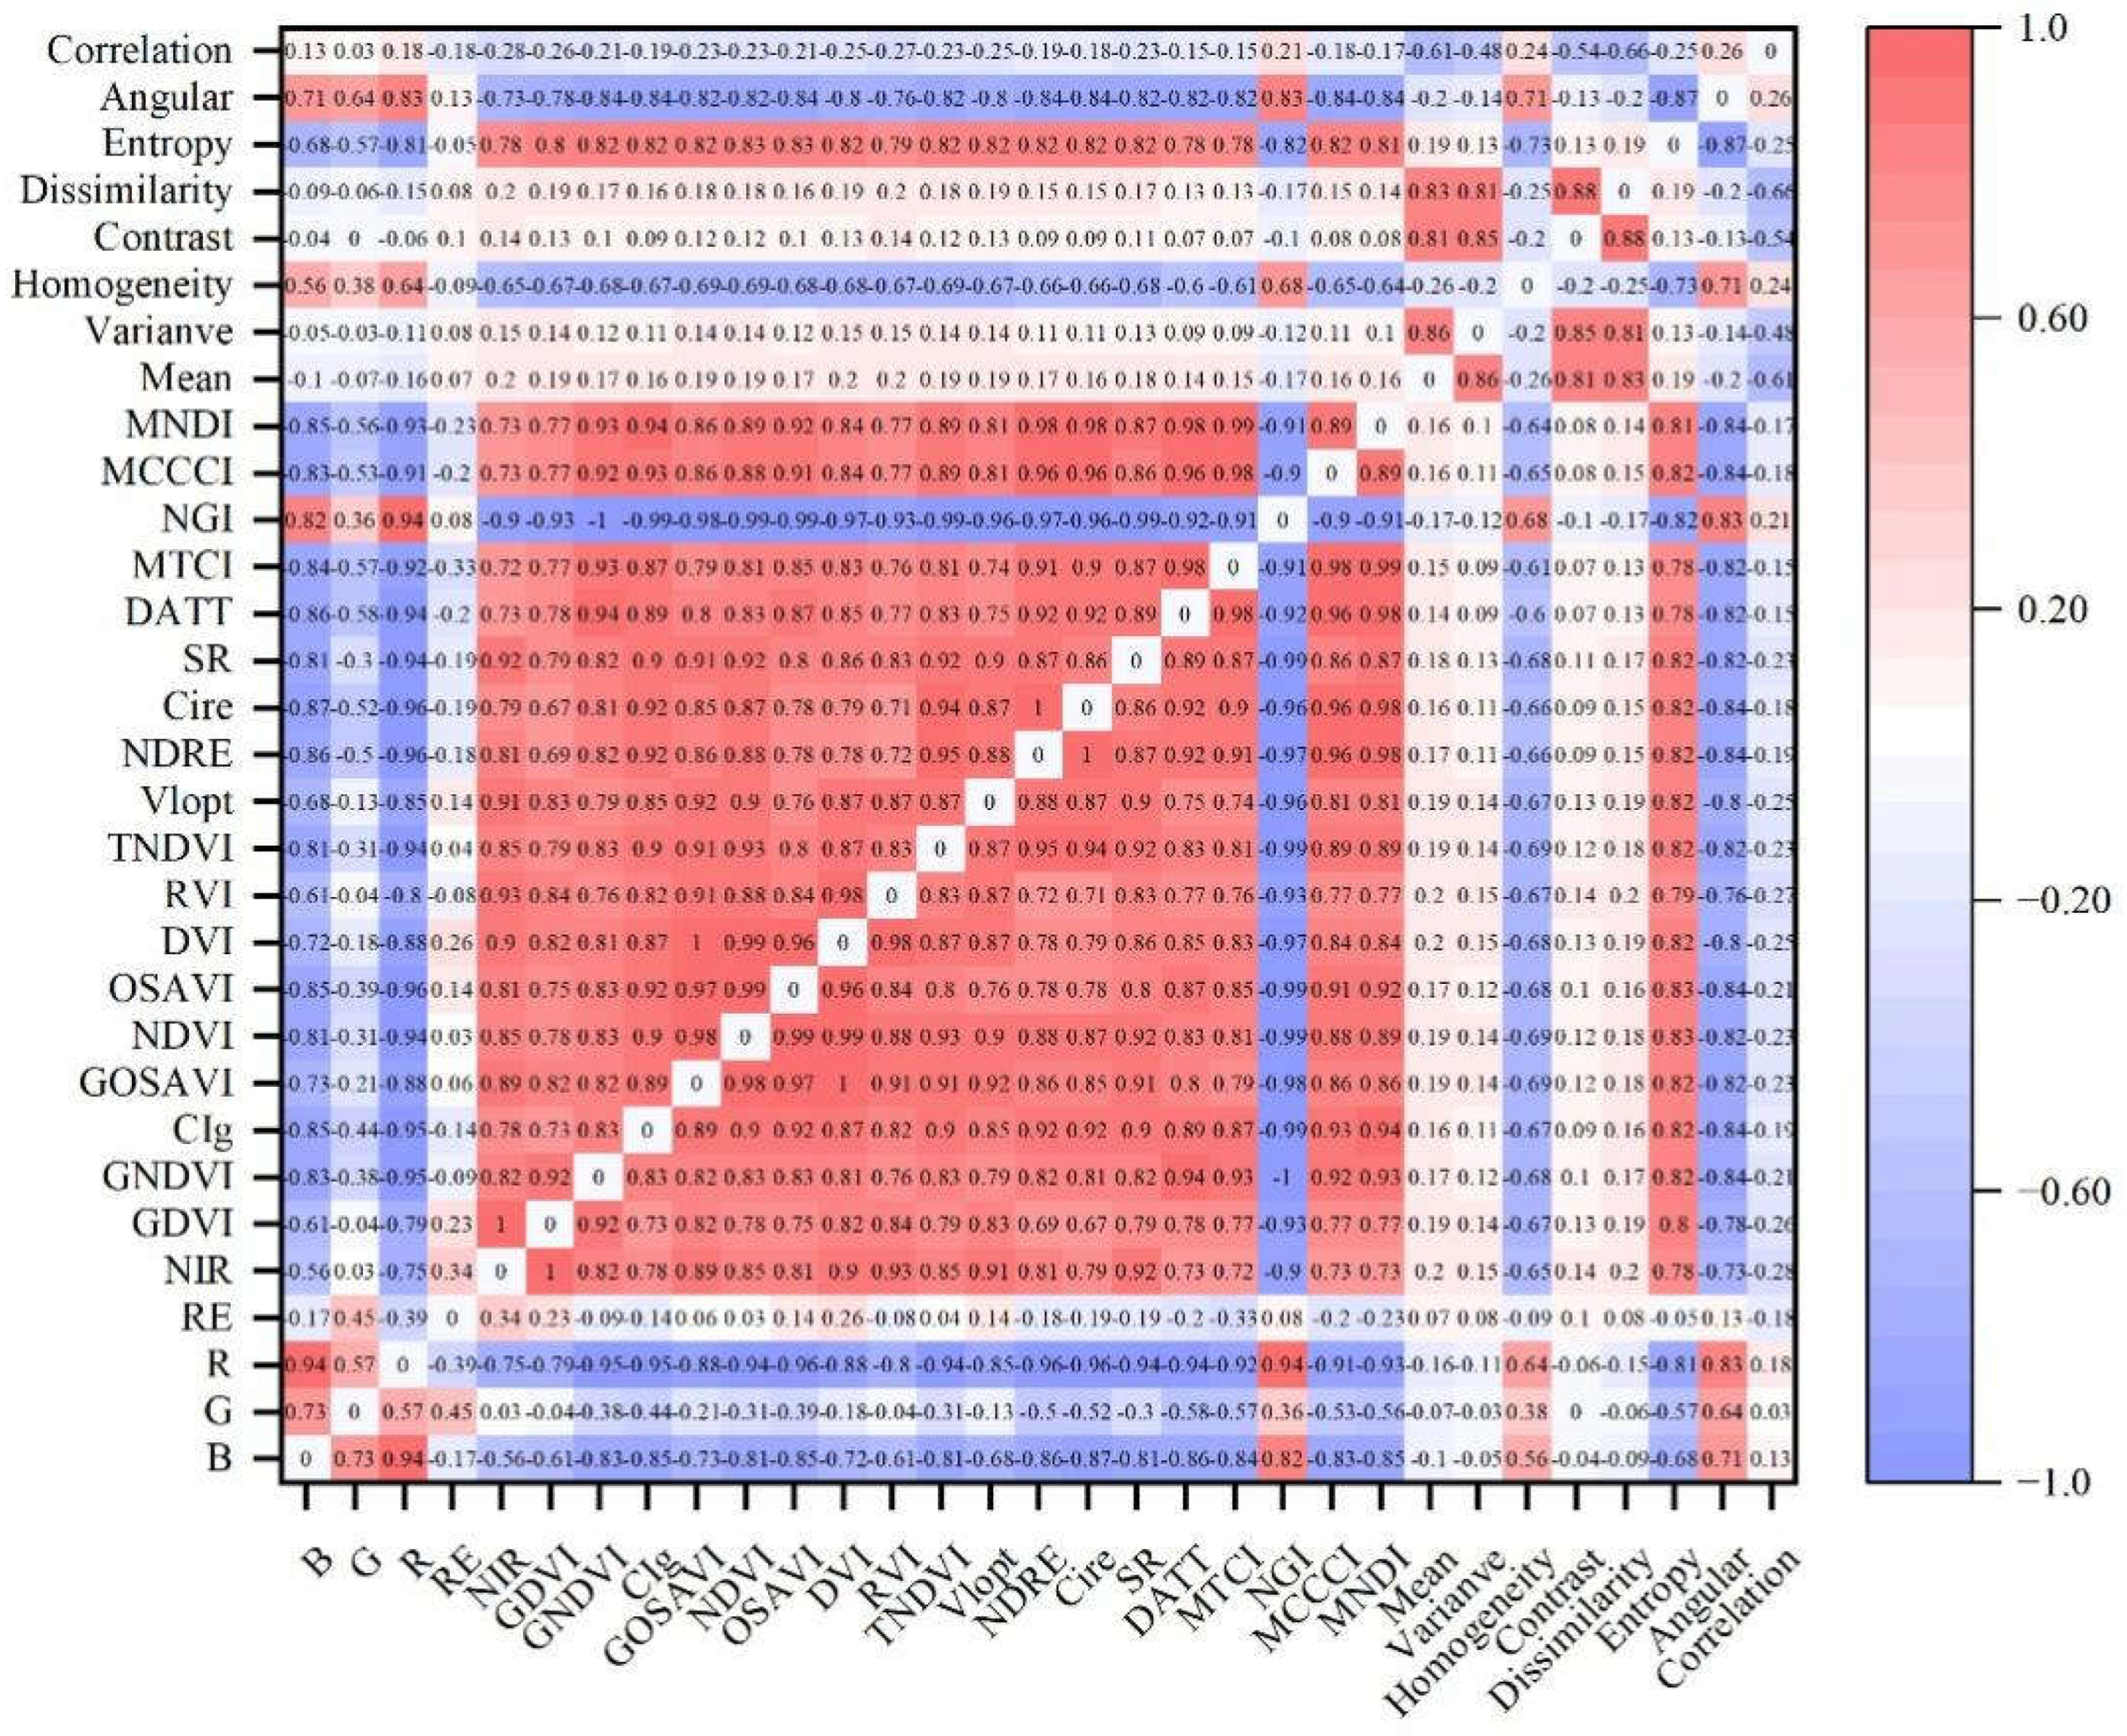
The results of the correlation analysis between canopy SPAD values and texture features at the three key growth stages showed that at the jointing stage, significant redundancy existed among these features, with a correlation coefficient of -0.87 between entropy and angular second moment; entropy achieved the optimal correlation with SPAD (r=0.5) in this period. The overall correlation between texture features weakened at the silking stage, while angular second moment and entropy showed the strongest correlation with SPAD (r=-0.54 and r=0.53, respectively). The correlation between texture features and SPAD decreased overall at the grain filling stage, with a maximum coefficient of only 0.38. Based on redundancy analysis, contrast and entropy were finally selected as the core texture indicators. Comparative verification showed that although both texture features and VIs were significantly correlated with SPAD values.
3.3. SPAD Estimation Model Integrating VIs and Texture Features
Based on correlation analysis, we selected VIs (e.g., MCCCI) and texture features (Contrast, Entropy) strongly correlated with summer maize SPAD values, and constructed canopy SPAD estimation models for jointing, silking and grain-filling stages using multiple machine learning algorithms. The SVR model showed the best overall performance, and the integrated VIs and texture features significantly improved SPAD prediction accuracyof all stages. At the jointing stage, single vegetation features outperformed texture features, and the integrated model further enhanced field stability. The integrated model reached a validation R² of 0.77 at the silking stage, and maintained stable performance (R²=0.70, RMSE=3.83) at the grain-filling stage despite reduced single-feature accuracy caused by leaf senescence. This integrated strategy effectively compensates for single-feature limitations and enhances model generalization.
Figure 5.
Comparison between simulated and measured SPAD simulation results using image texture, vegetation indices, and their integrated across different periods (Blue represents the training set, and red represents the test set).
Figure 5.
Comparison between simulated and measured SPAD simulation results using image texture, vegetation indices, and their integrated across different periods (Blue represents the training set, and red represents the test set).
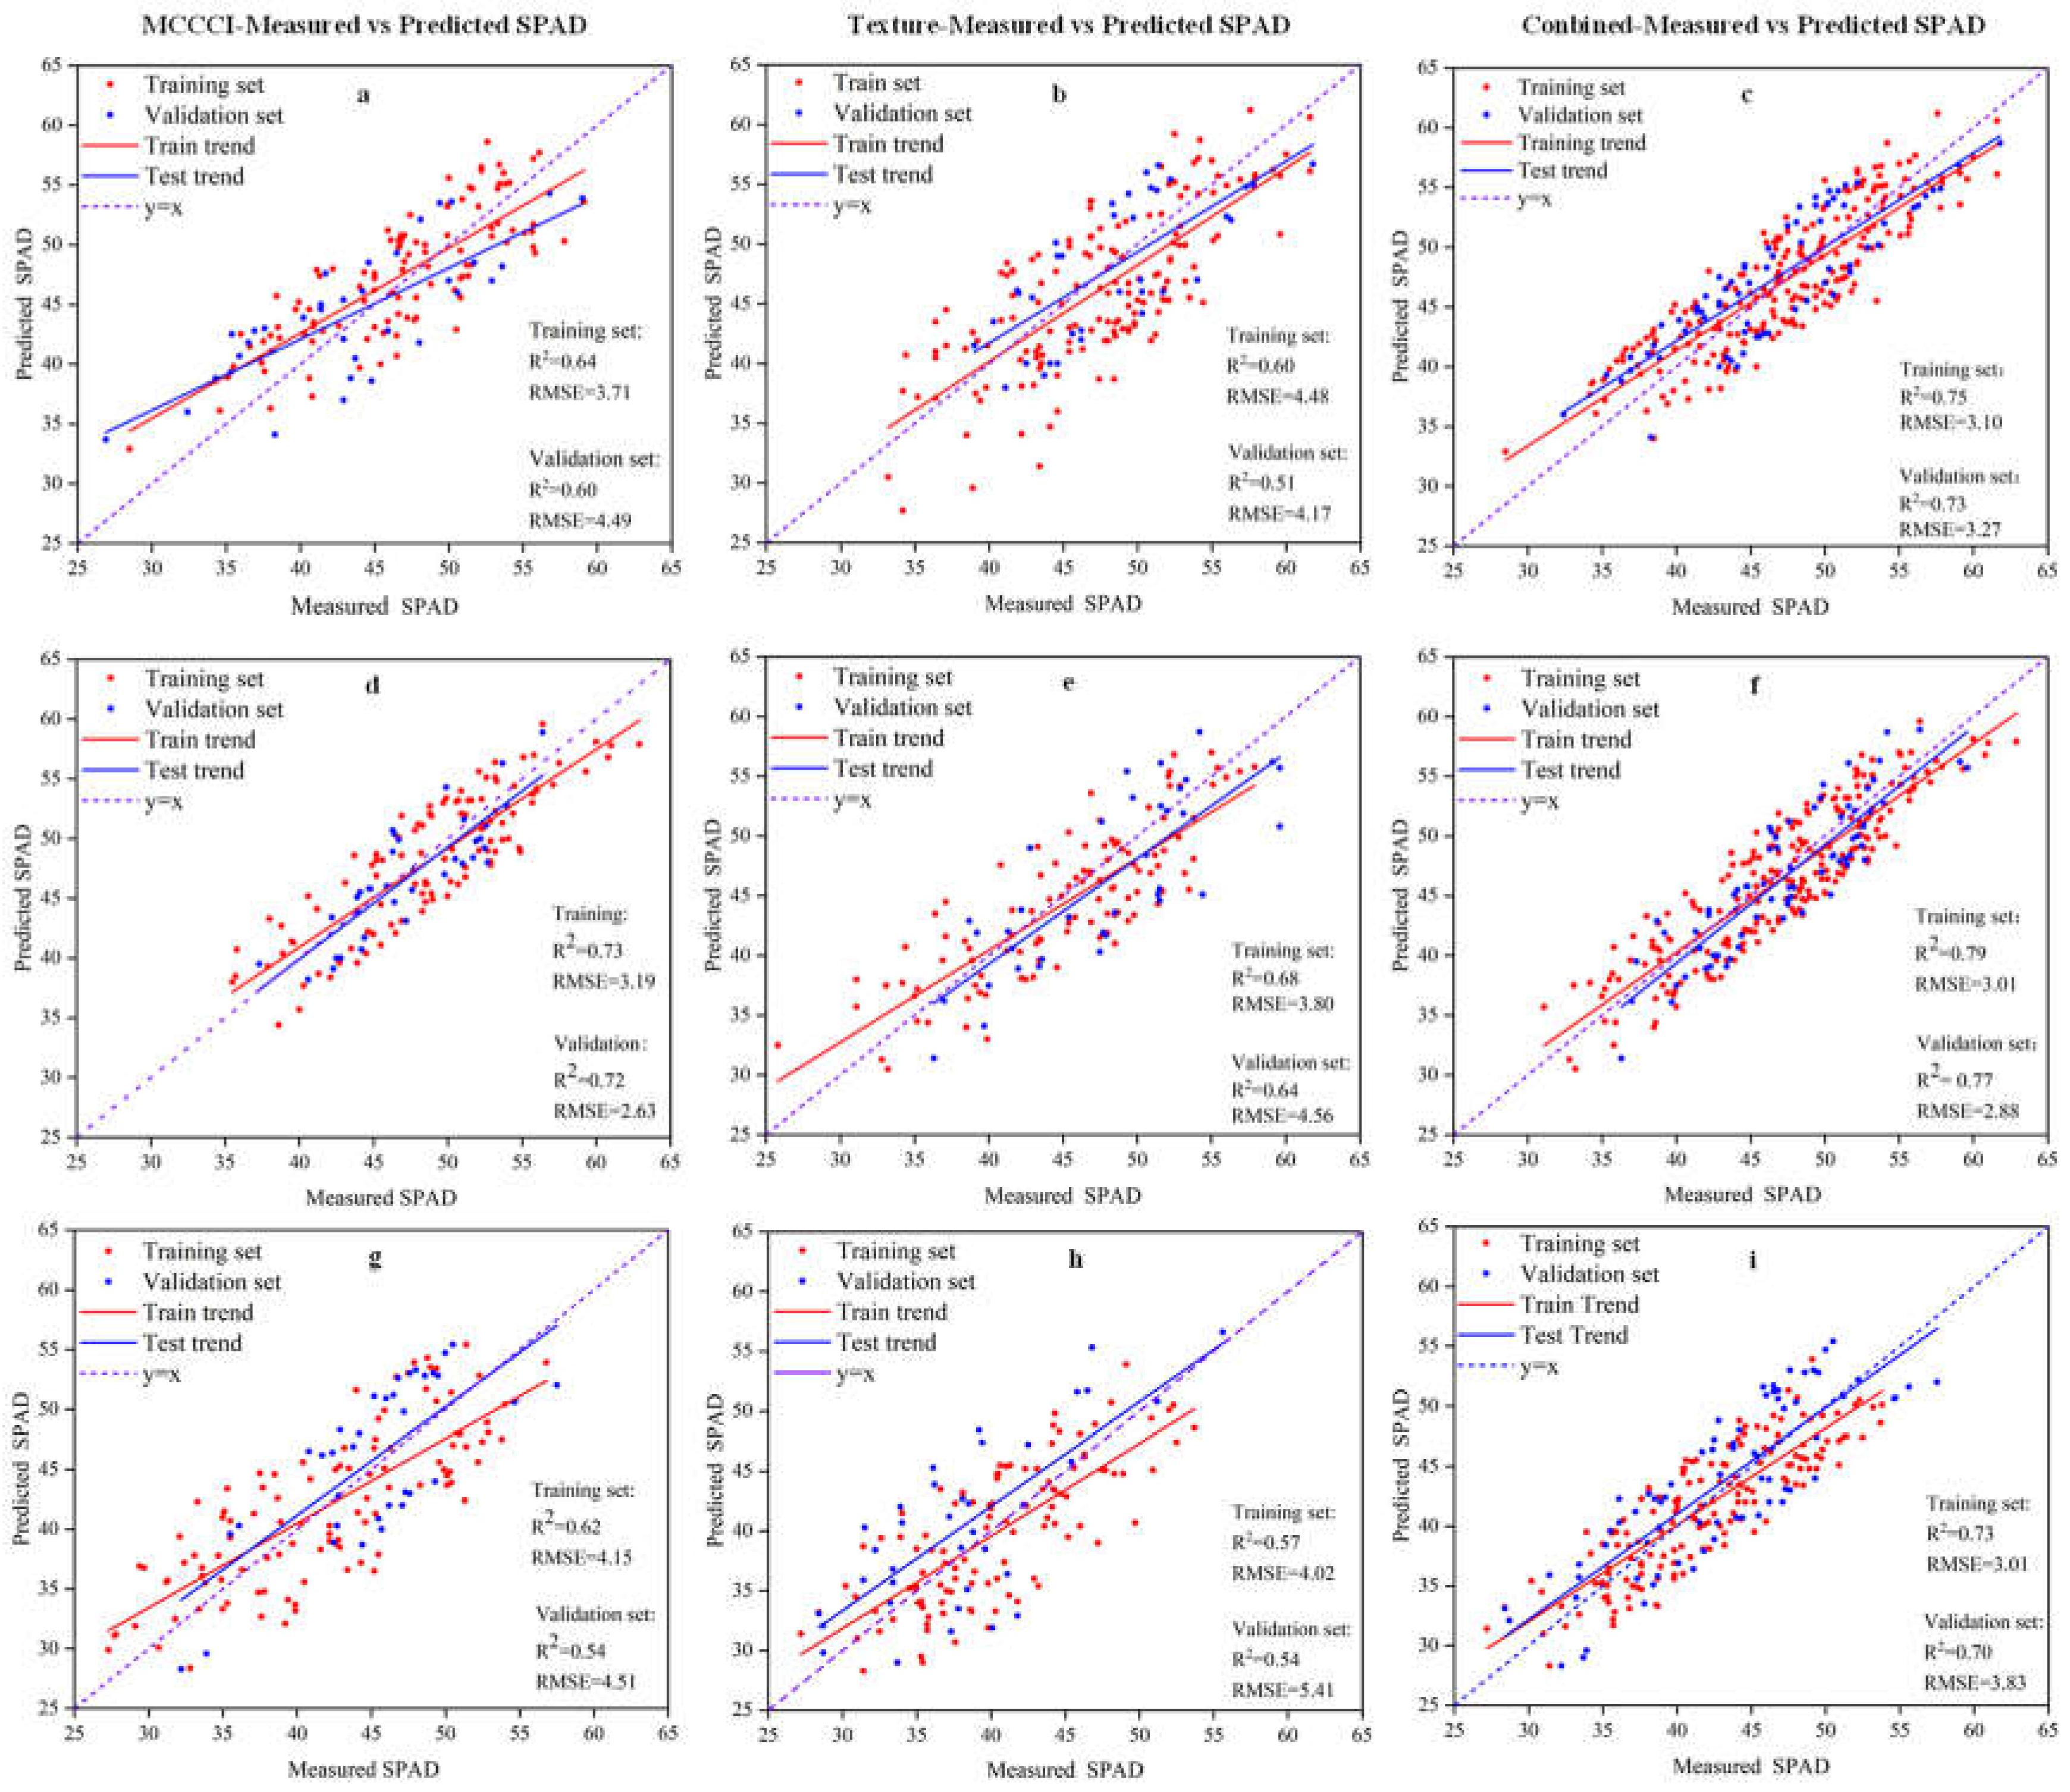

Table 4.
Comparison of SPAD estimation models using vegetation indices and texture Features.
| Stage | Feature | Machine Learning Model | RMSE | R2 |
|
Jointing |
Single vegetation feature |
PLSRegression | 4.30 | 0.45 |
| RandomForest | 5.49 | 0.11 | ||
| Linear Regression | 4.30 | 0.45 | ||
| Support Vector Regression | 4.49 | 0.60 | ||
| Single texture feature |
PLSRegression | 4.88 | 0.42 | |
| RandomForest | 5.15 | 0.41 | ||
| Linear Regression | 5.04 | 0.42 | ||
| Support Vector Regression | 4.17 | 0.51 | ||
| Indictors System |
PLSRegression | 4.25 | 0.45 | |
| RandomForest | 4.16 | 0.42 | ||
| Linear Regression | 3.88 | 0.45 | ||
| Support Vector Regression | 3.27 | 0.73 |
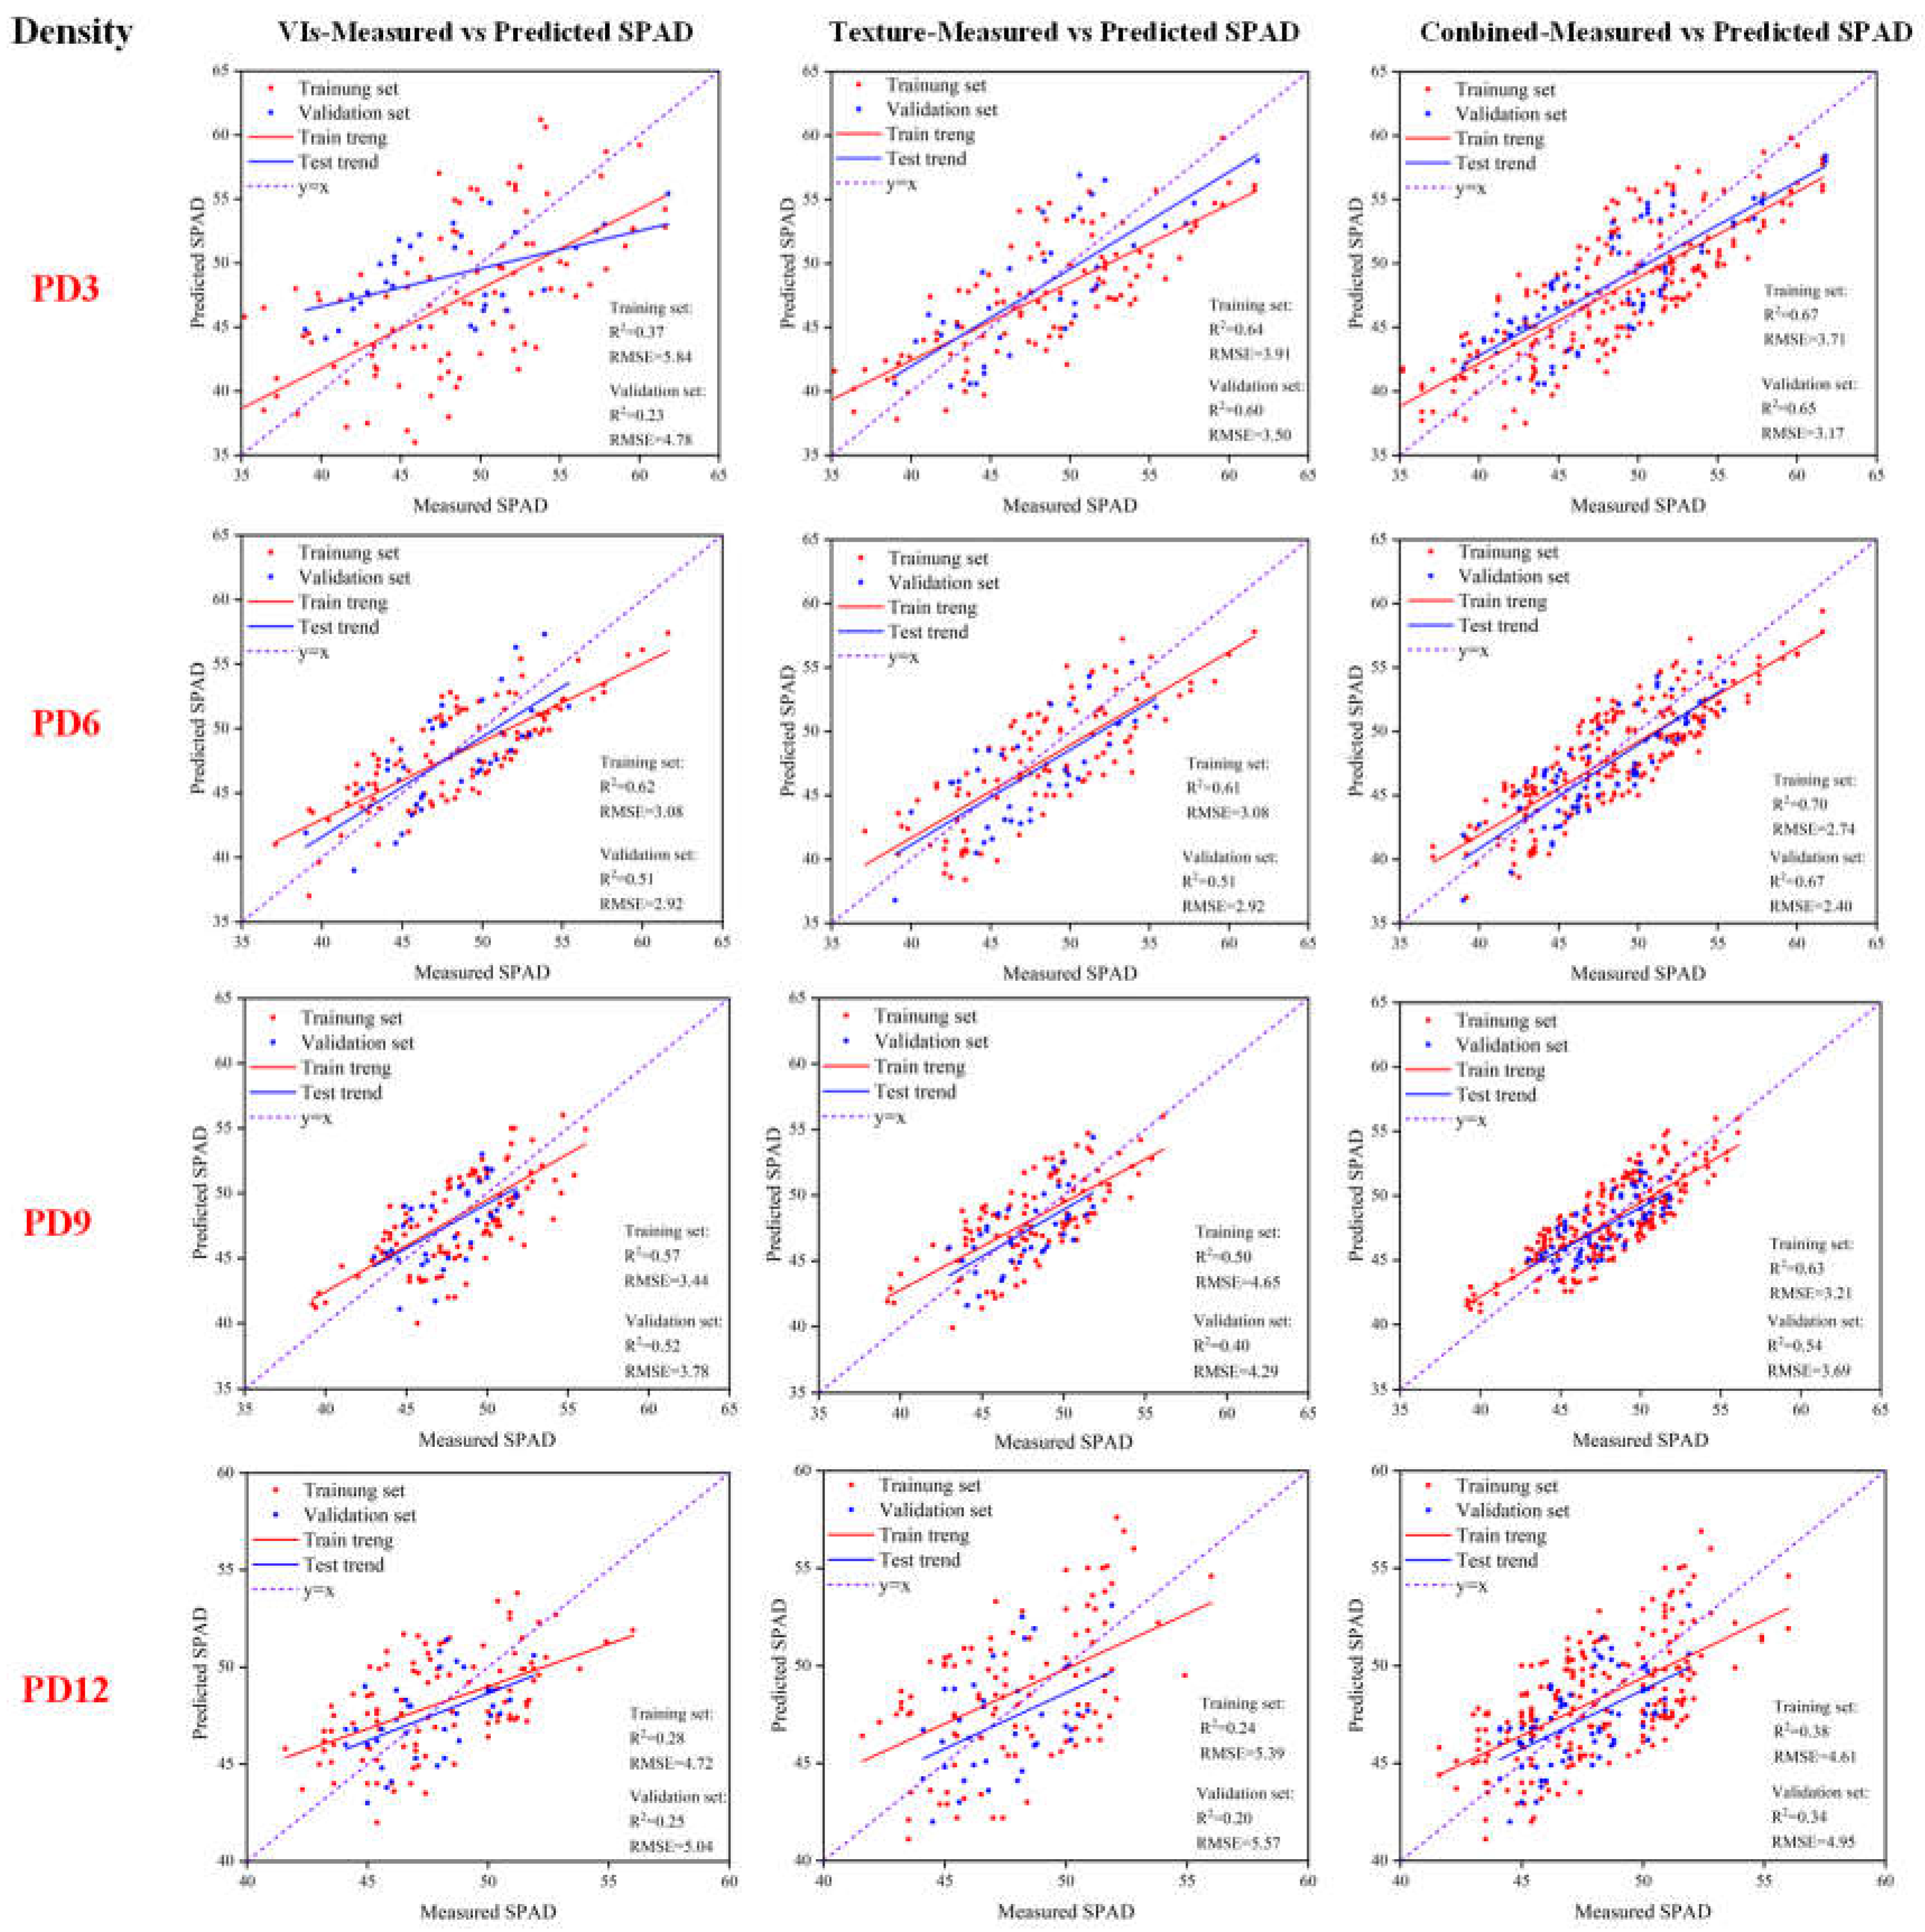
To verify the superiority of the SPAD inversion model constructed in this study, comparative simulation analysis was conducted using jointing-stage data under different planting densities within the validation dataset (Fig.6). All models performed stably under low density (PD6), with single VIs slightly outperforming single texture features. As density increased to PD9 and ultra-high density PD12, the accuracy of single-feature models decreased significantly, especially the single texture feature model, whose inversion ability nearly failed under PD12, as canopy overlap and light heterogeneity from dense planting weakened texture feature sensitivity. In contrast, the integrated feature model showed significant advantages in resisting density stress, with significantly higher R² than single-feature models across all densities. It maintained a stable R² of 0.60-0.70 from PD3 to PD9 and retained an R² of 0.34 even under PD12. This study confirms that planting density is a key factor regulating the applicability of SPAD inversion models. The feature integrated strategy offsets canopy structure interference via information complementarity between VIs and texture features, improving model generalization and anti-interference ability for precise nutrition monitoring of densely planted maize.
Figure 6.
Comparison of Feature Types for SPAD Inversion Models at the Jointing Stage of Maize Under Different Planting Densities. Note: PD3(30000 plants/ha), PD6(60000 plants/ha), PD9(90000 plants/ha), PD12(120000 plants/ha).
Figure 6.
Comparison of Feature Types for SPAD Inversion Models at the Jointing Stage of Maize Under Different Planting Densities. Note: PD3(30000 plants/ha), PD6(60000 plants/ha), PD9(90000 plants/ha), PD12(120000 plants/ha).
4. Discussion
4.1. Modeling the Differences Between VIs and Texture Features
In this study, compared with single indicator methods, the integration of spectral and textural features consistently improves model accuracy across various algorithmic frameworks. When texture features were used for model construction, their prediction accuracy was slightly higher than that of spectral features during the early growth stage and after maize maturity. This improvement can be attributed to the inherent capabilities of texture features, which can amplify subtle spectral differences among ground objects, mitigate interference from background signals, solar angle, and sensor viewing angle, as well as suppress spectral variability. These features can further alleviate the impact of high crop coverage on spectral saturation during the inversion of growth indicators of multiple developmental stages. However, in the correlation analysis, spectral features consistently showed stronger associations with chlorophyll content compared to texture-based metrics. This phenomenon is attributed to the fact that the selected VIs relieves specific spectral bands, particularly the red edge and near-infrared regions, which have a close correlation with chlorophyll content but also exhibit significant collinearity. Therefore, simply selecting highly correlated features as inputs may not improve modeling accuracy. The integration of spectral and textural features effectively alleviates the constraint of multicollinearity and compensates for the weak direct correlation between textural features and leaf chlorophyll content. This multi-feature fusion framework can stably enhance the prediction accuracy and generalization robustness of the SPAD inversion model, both throughout the full maize growth period and under different planting density conditions.
4.2. UAV-Based Maize SPAD Estimation with SVR and Feature Screening
In our experiment, SPAD values estimated from UAV multispectral imagery showed strong agreement with ground measurements, with correlation coefficients exceeding 0.75, indicating good predictive performance. The small deviation between estimated and measured SPAD values may be partly attributable to the reduced influence of outliers when using canopy level image statistics. For crop parameter inversion, both variable selection and the choice of machine learning algorithms are key determinants of model accuracy and stability. Selection strategies and algorithms differ in data processing, feature extraction, and training procedures, which directly affect inversion outcomes. Given the large number of image derived features and potential multicollinearity, the relationships between spectral and texture features and chlorophyll content may shift after background removal. In this study, correlation analysis was used as an initial screening step to retain features closely related to SPAD values, which helped reduce dimensionality and mitigate multicollinearity. Based on the established indicator system, the SVR algorithm adopted in this study achieved a simulation accuracy of SPAD above 0.7 across different growth stages, which was significantly higher than that of single VIs and single texture features. Its estimation performance was also superior to other algorithms, enabling the extended estimation of maize SPAD under various planting densities.
4.3. Generalization of SPAD Inversion Model
In this work, we integrated machine learning approaches with multispectral data analysis to explore the generalization capabilities of the SPAD inversion model. SVR was employed to estimate SPAD values from a set of VIs. Experimental results demonstrated that the SVR model exhibits high reliability in key maize growth stages. While individual VIs offers valuable insights, their utility in SPAD inversion is constrained by limited predictive performance, making over-reliance on any single index a central challenge. Model complexity intensifies with a proliferation of VIs, raising computational expenses while heightening susceptibility to overfitting. To address these issues, we systematically analyzed the relationship of spectral indices and textural features with SPAD values, selecting the most relevant predictors for model construction according to maize growth stage. The resulting SPAD inversion model exhibited strong generalization across different growth stages.
5. Conclusions
This study utilized the UAV multispectral imagery to establish a non-destructive estimating canopy SPAD values during maize growth under various planting densities. This study collected 12,240 multispectral images during the growth period under different planting densities in the two-year experiment and then the dataset called SPADmaize_ahau was established. The indicator system was constructed using 18 VIs and 8 texture features to analyze the correlations with SPAD values. The detection accuracy of three algorithms (SVR,RF,PLSR) was compared under single features and feature integrated. The results show that the red-edge and near-infrared bands are most sensitive to changes in SPAD values estimation. Canopy spectral characteristics vary significantly with growth stage, and no single feature can provide reliable estimation in the full growth period. Based on the SVR algorithm and the constructed indicator system, the proposed model achieves high estimation accuracy and strong generalization capability throughout the maize full growth period . This model effectively improves the inversion accuracy of canopy SPAD values laying a solid technical foundation for precise nitrogen nutrient management in summer maize cultivation. Furthermore, the feasibility of using the SVR algorithm combined with this indicator system to simulate maize SPAD under different planting densities was further validated.
Author Contributions
Writing–review & editing, Formal analysis, C.L.; Data curation, L.D.; Data curation, Z.Z.; Data curation, J.H.; Investigation, Data curation, H.L; Writing–review & editing, Supervision, S.J.; Writing–review & editing, Supervision, Funding acquisition, Y.S.; Writing–review & editing, Supervision, Funding acquisition, J.L.; funding acquisition, Y.S. and J.L. All authors have read and agreed to the published version of the manuscript.
Funding
The authors gratefully acknowledge the financial support provided by the Natural Key Research and Development Program (2023YFD2301500). The authors gratefully acknowledge the financial support provided by the National Key R&D Program of China: Integrated Technical Model and Application for Productivity Improvement of lime concretion black soil in the Huaihe River Basin (2023YFD1901000).
Institutional Review Board Statement
Not applicable.
Informed Consent Statement
Not applicable.
Data Availability Statement
The raw data supporting the conclusions of this article will be made available by the authors on reasonable request.
Conflicts of Interest
The authors declare no conflicts of interest.
References
- Erenstein, O.; Jaleta, M.; Sonder, K.; Mottaleb, K.; Prasanna, B.M. Global maize production, consumption and trade: trends and R&D implications. Food Secur. 2022, 14, 1295–1319. [Google Scholar] [CrossRef]
- Silva, L.; Conceição, L.A.; Lidon, F.C.; Maçãs, B. Remote Monitoring of Crop Nitrogen Nutrition to Adjust Crop Models: A Review. Agriculture 2023, 13, 835. [Google Scholar] [CrossRef]
- Szulc, P.; Bocianowski, J.; Nowosad, K.; Zielewicz, W.; Kobus-Cisowska, J. SPAD Leaf Greenness Index: Green Mass Yield Indicator of Maize (Zea mays L.), Genetic and Agriculture Practice Relationship. Plants 2021, 10, 830. [Google Scholar] [CrossRef] [PubMed]
- Ma, W.; Han, W.; Zhang, H.; Cui, X.; Zhai, X.; Zhang, L.; Shao, G.; Niu, Y.; Huang, S. UAV multispectral remote sensing for the estimation of SPAD values at various growth stages of maize under different irrigation levels. Comput. Electron. Agric. 2024, 227, 109566. [Google Scholar] [CrossRef]
- Ludwig, A.D.; Doktor, D.; Goss, R.; Sasso, S.; Feilhauer, H. The leaf is always greener on the other side of the lab: Optical in-situ indicators for leaf chlorophyll content need improvement for semi-natural grassland areas. Ecol. Indic. 2022, 143, 109424. [Google Scholar] [CrossRef]
- Zhang, Z.; Zhu, L. A Review on Unmanned Aerial Vehicle Remote Sensing: Platforms, Sensors, Data Processing Methods, and Applications. Drones 2023, 7, 398. [Google Scholar] [CrossRef]
- Feng, L.; Chen, S.; Zhang, C.; Zhang, Y.; He, Y. A comprehensive review on recent applications of unmanned aerial vehicle remote sensing with various sensors for high-throughput plant phenotyping. Comput. Electron. Agric. 2021, 182, 106033. [Google Scholar] [CrossRef]
- Wu, Q.; Zhang, Y.; Zhao, Z.; Xie, M.; Hou, D. Estimation of Relative Chlorophyll Content in Spring Wheat Based on Multi-Temporal UAV Remote Sensing. Agronomy 2023, 13, 211. [Google Scholar] [CrossRef]
- Parida, P.K.; Somasundaram, E.; Krishnan, R.; Radhamani, S.; Sivakumar, U.; Parameswari, E.; Raja, R.; Shri Rangasami, S.R.; Sangeetha, S.P.; Gangai Selvi, R. Unmanned Aerial Vehicle-Measured Multispectral Vegetation Indices for Predicting LAI, SPAD Chlorophyll, and Yield of Maize. Agriculture 2024, 14, 1110. [Google Scholar] [CrossRef]
- Kyratzis, A.C.; Skarlatos, D.P.; Menexes, G.C.; Vamvakousis, V.F.; Katsiotis, A. Assessment of Vegetation Indices Derived by UAV Imagery for Durum Wheat Phenotyping under a Water Limited and Heat Stressed Mediterranean Environment. 2017, 8–2017. [Google Scholar] [CrossRef] [PubMed]
- Liu; Feng, H.; Yue, J.; Fan, Y.; Bian, M.; Ma, Y.; Jin, X.; Song, X.; Yang, G. Estimating potato above-ground biomass by using integrated unmanned aerial system-based optical, structural, and textural canopy measurements. Comput. Electron. Agric. 2023, 213, 108229. [Google Scholar] [CrossRef]
- Jamil, M.D.; Abbas, M.Z.; Saeed, M.F.; Jamal, A.; Mubeen, M.; Zakir, A.; Ahmad, I.; Jameel, R.; Pentoś, K.; Dewir, Y.H.; et al. Improved early-stage crop classification using a novel fusion-based machine learning approach with Sentinel-2A and Landsat 8–9 data. Environ. Monit. Assess. 2025, 197, 982. [Google Scholar] [CrossRef] [PubMed]
- Wang, S.; Wang, B.; Zheng, J.; Tuerxun, N.; Wang, R.; Zhang, K.; Xu, Y.; Yang, Y. Contributions of Multiple UAV Features to Cotton SPAD Estimation from the Perspective of Explainable Machine Learning. Agriculture 2026, 16, 325. [Google Scholar] [CrossRef]
- Nguyen, C.; Sagan, V.; Skobalski, J.; Severo, J.I. Early Detection of Wheat Yellow Rust Disease and Its Impact on Terminal Yield with Multi-Spectral UAV-Imagery. Remote Sens. 2023, 15, 3301. [Google Scholar] [CrossRef]
- Huete, A.; Didan, K.; Miura, T.; Rodriguez, E.P.; Gao, X.; Ferreira, L.G. Overview of the radiometric and biophysical performance of the MODIS vegetation indices. Remote Sens. Environ. 2002, 83, 195–213. [Google Scholar] [CrossRef]
- Tian, Y.C.; Yao, X.; Yang, J.; Cao, W.X.; Hannaway, D.B.; Zhu, Y. Assessing newly developed and published vegetation indices for estimating rice leaf nitrogen concentration with ground- and space-based hyperspectral reflectance. Field Crops Res. 2011, 120, 299–310. [Google Scholar] [CrossRef]
- Haboudane, D.; Miller, J.R.; Pattey, E.; Zarco-Tejada, P.J.; Strachan, I.B. Hyperspectral vegetation indices and novel algorithms for predicting green LAI of crop canopies: Modeling and validation in the context of precision agriculture. Remote Sens. Environ. 2004, 90, 337–352. [Google Scholar] [CrossRef]
- Candiago, S.; Remondino, F.; De Giglio, M.; Dubbini, M.; Gattelli, M. Evaluating Multispectral Images and Vegetation Indices for Precision Farming Applications from UAV Images. Remote Sens. 2015, 7, 4026–4047. [Google Scholar] [CrossRef]
- Daughtry, C.S.T.; Walthall, C.L.; Kim, M.S.; de Colstoun, E.B.; McMurtrey, J.E. Estimating Corn Leaf Chlorophyll Concentration from Leaf and Canopy Reflectance. Remote Sens. Environ. 2000, 74, 229–239. [Google Scholar] [CrossRef]
- Liu, J.; Pattey, E.; Jégo, G. Assessment of vegetation indices for regional crop green LAI estimation from Landsat images over multiple growing seasons. Remote Sens. Environ. 2012, 123, 347–358. [Google Scholar] [CrossRef]
- Laosuwan, T.; Uttaruk, Y. Carbon Sequestration Assessment of the Orchards Using Satellite Data. J. Ecol. Eng. 2017, 18, 11–17. [Google Scholar] [CrossRef]
- Sripada, R.P.; Heiniger, R.W.; White, J.G.; Weisz, R. Aerial Color Infrared Photography for Determining Late-Season Nitrogen Requirements in Corn. Agron. J. 2005, 97, 1443–1451. [Google Scholar] [CrossRef]
- Wu, W. The Generalized Difference Vegetation Index (GDVI) for Dryland Characterization. Remote Sens. 2014, 6, 1211–1233. [Google Scholar] [CrossRef]
- Schuerger, A.C.; Capelle, G.A.; Di Benedetto, J.A.; Mao, C.; Thai, C.N.; Evans, M.D.; Richards, J.T.; Blank, T.A.; Stryjewski, E.C. Comparison of two hyperspectral imaging and two laser-induced fluorescence instruments for the detection of zinc stress and chlorophyll concentration in bahia grass (Paspalum notatum Flugge.). Remote Sens. Environ. 2003, 84, 572–588. [Google Scholar] [CrossRef]
- Richardsons, A.J.; Wiegand, A.J.P.E.; Sensing, R. Distinguishing vegetation from soil background information. 1977, 43, 1541–1552. [Google Scholar]
- Chen, J.M. Evaluation of Vegetation Indices and a Modified Simple Ratio for Boreal Applications. Can. J. Remote Sens. 1996, 22, 229–242. [Google Scholar] [CrossRef]
- Graeff, S.; Claupein, W. Quantifying nitrogen status of corn (Zea mays L.) in the field by reflectance measurements. Eur. J. Agron. 2003, 19, 611–618. [Google Scholar] [CrossRef]
- Fitzgerald, G.J. Characterizing vegetation indices derived from active and passive sensors. Int. J. Remote Sens. 2010, 31, 4335–4348. [Google Scholar] [CrossRef]
- Dash, J.; Curran, P.J.J.I.J.o.R.S. The MERIS terrestrial chlorophyll index. 2004, 25, 5403–5413. [Google Scholar] [CrossRef]
- Gitelson, A.A.; Viña, A.; Verma, S.B.; Rundquist, D.; Arkebauer, T.J.; Keydan, G.P.; Leavitt, B.; Ciganda, V.S.; Burba, G.; Suyker, A.E.J.J.o.G.R. Relationship between gross primary production and chlorophyll content in crops: Implications for the synoptic monitoring of vegetation productivity. 2006, 111. [Google Scholar] [CrossRef]
- Reyniers, M.; Walvoort, D.J.J.; De Baardemaaker, J. A linear model to predict with a multi-spectral radiometer the amount of nitrogen in winter wheat. Int. J. Remote Sens. 2006, 27, 4159–4179. [Google Scholar] [CrossRef]
- Datt, B. Visible/near infrared reflectance and chlorophyll content in Eucalyptus leaves. Int. J. Remote Sens. 1999, 20, 2741–2759. [Google Scholar] [CrossRef]
Table 1.
The 18 VIs are used in this study.
| Acronym | Vegetation index | Formula | Reference |
| NDVI | Normalized Difference Vegetation Index | NDVI = (NIR - Red) / (NIR + Red) | [15] |
| NDRE | Normalized Difference Red Edge Vegetation Index | NDRE = (NIR - Red Edge) / (NIR + Red Edge) | [16] |
| MSRI | Modified Simple Ratio Index | MSRI = (NIR / R-1) / sqrt(NIR / R +1) | [17] |
| GNDVI | Green Normalized Difference Vegetation Index | GNDVI = (NIR - Green) / (NIR + Green) | [18] |
| OSAVI | Optimized Soil Adjusted Vegetation Index | OSAVI = (NIR−Red) / (NIR + Red + 0.16) × 1.16 | [19] |
| EVI | Enhanced Vegetation Index | EVI = 2.5 × (NIR - Red) / (NIR + 2.4 × Red +1) | [20] |
| TNDVI | Transformed normalized difference vegetation index | TNDVI=sqrt(NIR- Red Edge)/ (NIR + Red Edge)+0.5 | [21] |
| GOSAVI | Green Optimized Soil Adjusted Vegetation Index | GOSAVI=1.16×(NIR- Green)/ (NIR+Green+0.16) | [22] |
| GDVI | Green Difference Vegetation Index | GDVI= NIR-Green | [23] |
| RVI | Ratio Vegetation Index | RVI= NIR/Red | [24] |
| DVI | Deviation Vegetation Index | DVI= NIR-Red | [25] |
| SR | Simple Ratio(SR) | SR= NIR/Red | [26] |
| NGI | Normalized green vegetation index | NGI= Red/( NIR + Red Edge+ Red) | [27] |
| MCCCI | Modified Climate Change Canopy Vegetation Index | MCCCI=(NIR - Red Edge)/ (NIR + Red Edge) | [28] |
| MTCI | MERIS Terrestrial Chlorophyll Index | MTCI=(NIR - Red Edge)/ (Red Edge - Red) | [29] |
| CIgreen | Green Chlorophyll index | CIgreen= NIR/Red-1 | [30] |
| VIopt | Optimal Vegetation Index | VIopt=1.45*(( Red2+1)/( Red+0.45)) | [31] |
| DATT | Datt1 | DATT=(NIR - Red Edge)/ (NIR - Red) | [32] |
Table 2.
Examining relationships of single texture features to each spectral band in the rise period.
Table 2.
Examining relationships of single texture features to each spectral band in the rise period.
| Texture feature | Correlation coefficient | ||||
| Blue | Green | Red | Red edge | Near IR | |
| Mean(mean) | -0.10 | -0.08 | -0.15 | 0.07 | 0.18 |
| Correlation(corr) | 0 | -0.08 | 0.07 | -0.19 | -0.17 |
| Dissimlarity(dis) | -0.10 | -0.06 | -0.15 | 0.09 | 0.20 |
| Angular(ang) | 0.7 | 0.58 | 0.82 | 0.04 | -0.71 |
| Variance(var) | -0.05 | -0.04 | -0.10 | 0.06 | 0.12 |
| Contrast(con) | -0.06 | -0.03 | -0.08 | 0.07 | 0.12 |
| Entropy(ent) | -0.68 | -0.55 | -0.80 | 0.04 | 0.75 |
| Homogeneity(hom) | 0.56 | 0.34 | 0.62 | -0.16 | -0.62 |
Table 3.
Correlation analysis between each spectral index and maize SPAD during the jointing stage.
| Spectral index | Correlation coefficient | Spectral index | Correlation coefficient |
| B | -0.55*** | DVI | 0.44*** |
| G | -0.70*** | TNDVI | 0.38*** |
| R | -0.60*** | VIopt | 0.49*** |
| RE | -0.45*** | RVI | 0.45*** |
| NIR | 0.33*** | NDRE | 0.62*** |
| GDVI | 0.40*** | Cire | 0.62*** |
| GNDVI | 0.58*** | SR | 0.49*** |
| CIg | 0.60*** | DATT | 0.67*** |
| GOSAVI | 0.50*** | MTCI | 0.67*** |
| NDVI | 0.49*** | NGI | -0.57*** |
| OSAVI | 0.55*** | MCCCI | 0.64*** |
| MNDI | 0.64*** | Mean | 0.05 |
| Entropy | 0.50*** | Varianve | -0.01 |
| Angular | -0.54*** | Homogeneity | -0.40*** |
| Dissimilarity | 0.04 | Contrast | -0.03 |
| Correlation | -0.03 |
Note: P≤0.05(*),P≤0.01(**),P≤0.001(***).
Disclaimer/Publisher’s Note: The statements, opinions and data contained in all publications are solely those of the individual author(s) and contributor(s) and not of MDPI and/or the editor(s). MDPI and/or the editor(s) disclaim responsibility for any injury to people or property resulting from any ideas, methods, instructions or products referred to in the content. |
© 2026 by the authors. Licensee MDPI, Basel, Switzerland. This article is an open access article distributed under the terms and conditions of the Creative Commons Attribution (CC BY) license.
Copyright: This open access article is published under a Creative Commons CC BY 4.0 license, which permit the free download, distribution, and reuse, provided that the author and preprint are cited in any reuse.


