
Preprint
Article

This version is not peer-reviewed.

Variations in Seasonal Precipitation Regime According to the Elevation

Submitted:

04 June 2026

Posted:

05 June 2026

You are already at the latest version

Abstract
Catalonia has a Mediterranean climate with intense, long drought or rainy periods, which are difficult to manage. The variable topographic and sea conditions also contribute to modulating the extreme atmospheric regime. The aim of this research is to model the precipitation regime of the region based on different radar and lightning fields. To conduct the analysis, several points have been selected with different heights to evaluate the monthly values and establish the common yearly patterns. It has been observed that there are two principal behaviours: single and double maxima modes. Single peak usually occurs during warm months (mainly July and August), meanwhile the bimodal maxima are concentrated on Spring (March) and Autumn (October or November).
Keywords: 
;  ;  ;  ;  

1. Introduction

According to the World Meteorological Organisation (WMO), extreme weather in Europe and the Mediterranean Basin in 2025 was marked by significant droughts, extreme wildfires, floods, and severe windstorms [1]. The report also indicates an increasing number of extreme weather cases in the region, associated with the rising average temperature observed over the last few decades. These adverse conditions require taking immediate action. For instance, it is necessary to collect as much information as possible about the current meteorology. Therefore, this allows the comparison of those values with historical data, facilitating the management of hydro-meteorological resources in one of the most densely populated areas [2,3,4].
The Mediterranean Basin countries have historically experienced floods, caused by the meteorological and geographical conditions [5,6,7,8]. Among the meteorological causes, we can find extreme weather conditions. In this way, long dry periods produce warm air masses. The combination of these with some moist advections changes the nature of the lower-level atmosphere. Then, the instability produced by cold air at high levels or the irruption of an extra-tropical cyclone is the triggering element that develops highly efficient thunderstorms [9,10,11]. The large rainfall cumulated values combined with arid soil conditions and small, rapid response basins cause dramatic floods that affect infrastructure, such as highways or buildings, but can also impact the population [12,13,14].
Several authors have shown that topography has been revealed as one of the conditionings that modulate rainfall regimes [15,16,17,18]. Precipitation usually increases with height, but only until a certain altitude, which is considered the breaking point in the rainfall trend. This behaviour does not coincide in all regions, and it depends on the climatic conditions [19,20,21]. Besides, other factor that directly participates in the water cycle is the oceanic or sea waters, particularly in those cases of warm waters, such as the Caribe, the Chinese Sea, the Australian Seas, or the Mediterranean [22,23,24,25,26].
The aim of this Research is to show the changes on the precipitation regime along the year in Catalonia. To do this, it has been selected different radar and lightning parameters. These parameters have been evaluated for different points considering the altitude to categorize them. The variables have been evaluated daily for each category, considering the mean value for the different points.

2. Materials and Methods

2.1. Area of Study

Catalonia is in the northeastern Iberian Peninsula, covering 32,000 km2 (Figure 1a). The region's topography is abrupt, ranging from 0 m at the coast to over 3000 m ASL (Above Sea Level) in the north (Figure 2a). Several valleys and plains are surrounded by different ranges. These features are like those of other Mediterranean areas [27,28,29,30]. From a hydro-meteorological viewpoint, heavy rainfall events are frequent in Catalonia, producing flashfloods or floods, depending on the nature of the rainfall event [31,32]. Catastrophic episodes have historically caused large damage and casualties throughout the years, with important affectation in hydrologic structures [33,34]. Furthermore, long drought episodes have recurrently implied societal problems [35,36].

2.2. Data

As many previous works have shown [37,38], the Region of Study is well-covered by two remote-sensing networks, used in the present work (Figure 1b). Both networks belong to the Meteorological Service of Catalonia (SMC, Servei Meteorològic de Catalunya in Catalan), which has operated both since the early 2000s [39]. First, the weather radar network (XRAD) is composed of four C-band single-pol systems that produce volumetric scans every 6 minutes, with 15 elevation angles from 0.6 to 30º, with a range of 130 km from the radar. The composite of all four radars provides a complete vision of the atmospheric conditions from surface to nearly 20 km ASL, with a horizontal grid of 1km x 1km.
The second network is a passive remote sensing system, which only provides information in the case of lightning activity [40]. The Lightning Location System (XDDE, Xarxa de Detecció de Descàrregues Elèctriques) operates in two frequency ranges (Low Frequency, LF, and Very High Frequency, VHF) to generate solutions of the locations of Cloud-to-Ground (CG) and Intra-Cloud (IC) flashes produced by thunderstorms. The detection efficency (DE) is close to 95% of CG and 80% of IC over the Catalan terrain, decreasing the quality of detection as far is the thunderstorm from the network. The precision in the location is close to 500 m in the case of CG, while in the case of IC ranges between 1000 and 2000 m, over the Catalan territory. Figure 1b shows the location of the four detectors.
The Research has consisted of the analysis of different radar products [41,42,43,44], from reflectivity at the surface (ZSF) and the maximum value for the complete column (ZTO), the echo top (or the maximum height where an echo exceeds a certain reflectivity threshold) for 12 dBZ, 35 dBZ, and 45 dBZ (T12, T35, and T45), the quantitative precipitation estimation at daily and 30-minute time resolutions (RNN and R30), and the VIL (Vertically Integrated Liquid) density (VILD). Reflectivity provides an estimation of the instantaneous rainfall intensity, echo tops give information about the vertical development of the precipitation structures, rainfall estimation produces an accurate map of the precipitation distribution, and VIL density estimates whether hail is possible in a thunderstorm. Except for rainfall products, the time resolution is 6 minutes (10 fields hourly). The period of analysis go from 2016 to 2025, both included (a total of 10 years).
In the case of lightning data, it has considered CG flashes exclusively to reduce the location problems associated with IC lightning. Therefore, thunderstorm activity has been analyzed considering those flashes reaching ground level, similarly to Taszarek et al. (2019) [45].

2.3. Methodology

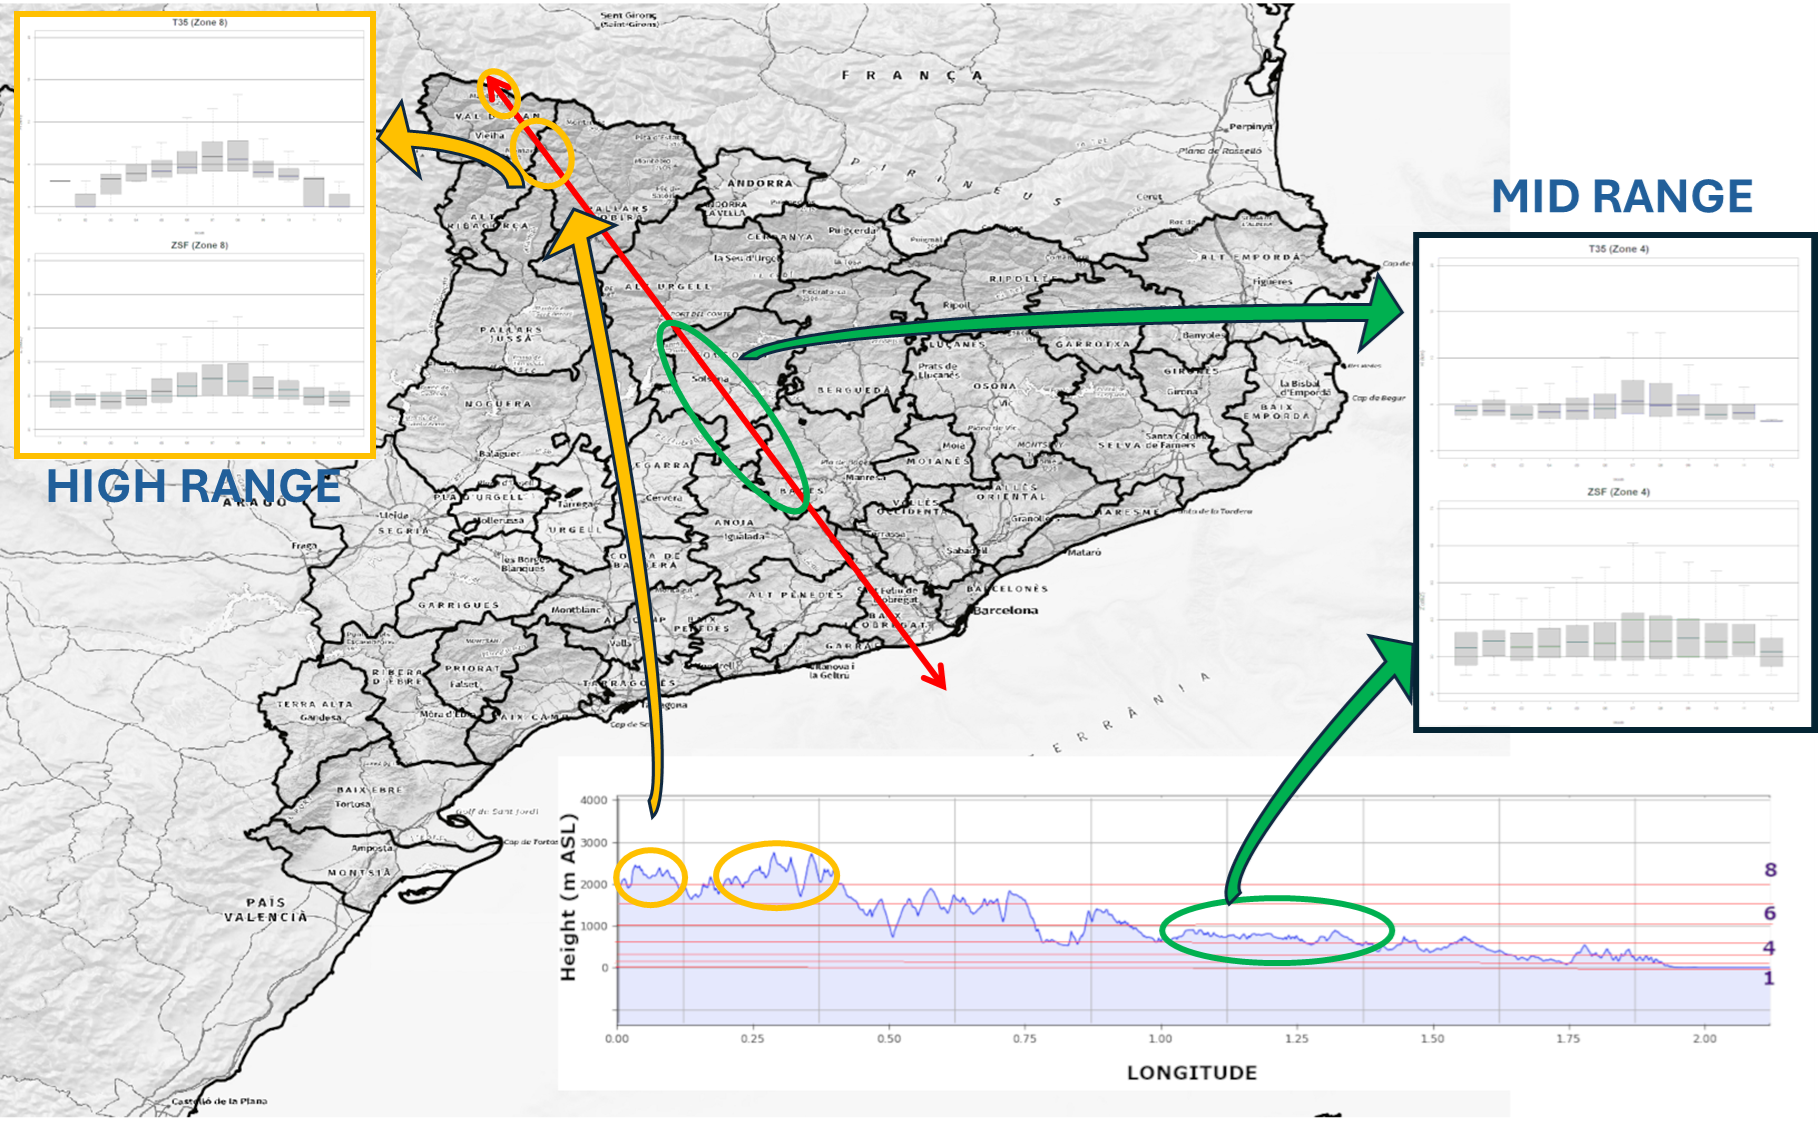
To evaluate the different radar and lightning fields depending on the topography, a series of points (Figure 2b) has been selected, placed at heights of eight different ranges:
* Zone 1: between 0 and 5 m ASL (coastal plain);
* Zone 2: between 5 and 100 m ASL (coastal line or valleys);
* Zone 3: between 100 and 250 m ASL (low prelitoral ranges or internal planes);
* Zone 4: between 250 and 500 m ASL (high prelitoral ranges or elevated planes);
* Zone 5: between 500 and 1000 m ASL (very high prelitoral ranges);
* Zone 6: between 1000 and 1500 m ASL (mid internal ranges);
* Zone 7: between 1500 and 2000 m ASL (mid Pyrenees and high internal ranges);
* Zone 8: over 2000 m ASL (high Pyrenees)
We considered different segments (see Figure 1b), ranging from the Mediterranean Sea to the Pyrenees (A to E), and included an additional segment in the Southern area (F). This selection ensures that we obtain enough points from the various zones to validate the Research goal. We obtained a daily value for each point for each of the different radar and lightning products from the period 2016 to 2025. Therefore, each field produces 1336 outputs for 51 selected points (3 from zone 1, 5 from zone 8, 6 from zones 2 and 3, 7 from zones 4 and 7, 8 from zone 5, and 9 from zone 6, respectively). The selection of fewer points for zones 1 and 8 corresponds to the smaller area of those regions. However, it was important to consider the rest because of their nature.
The general behaviour of each variable has been evaluated globally for the different regions to identify some discriminating characteristics associated with the changing altitude. Then, the monthly evolution of some parameters has helped to reach important conclusions regarding the changes for the different variables and zones. This variability has been related to the precipitation regimes and topography.

3. Results

3.1. General Results

The different panels of Figure 3 are associated with the precipitation regime: surface reflectivity (a) can be associated with the ground precipitation intensity, total reflectivity (b) is the maximum intensity in the full radar column, daily quantitative precipitation estimation (c) estimates the total precipitation during a day, and 30-minute quantitative precipitation estimation (d) measures the semi-hourly intensity. The violin plot [46] from R software [47] visualizes the combination of a box plot with a kernel density estimate. Therefore, it is like a box plot, but the different widths at various heights of the sample marks indicate the more typical values. It can be observed that in the case of the reflectivity fields (top panels), the values increase with the height until zone 4. This is the breakpoint, and from here, reflectivity values gradually decrease. Similarly, quantitative precipitation estimation also increases. However, the breakpoint is zone 6 for the daily field and zone 5 for the 30-minute product.
Figure 4 shows variables associated with the development of the precipitating systems (Echo top for three different reflectivity thresholds: 12 dBZ for all precipitation, 35 dBZ for mid-intense rainfall, and 45 dBZ for high-rain rate precipitation, according to the experience of the Catalan Meteorological Service staff) and with the probability of hail in thunderstorms (VIL density). In all cases, higher TOP values occur in zone 3. However, the maximum median value for the violin plot is located between zones 7 and 8. This means that the higher development of thunderstorms occurs when the systems are in low regions, but the systems observed in higher regions tend to be more developed in general. Finally, the diagnosis of hail shows the largest values of DVIL between zones 3 and 4, while the largest median values are recorded in zones 5 and 6. Then, mid-topography has a main role in hail occurrence, particularly at the highest peaks.
Figure 5 provides a summary of the electrical activity for the different zones. In this case, two principal regions are distinguished: the first is the flattest one, zone 1, indicating the high contribution of the Mediterranean Sea in the electrification of precipitation systems. The second one corresponds to the top zones (6 to 8), where the electrical activity is notably more important than in the mid-topographic regions.
To go more in depth with the previous results, table 1 shows the upper level of the internal black box around the median (white dot), corresponding to the 90th quantile. This parameter has been estimated for the eight zones for the nine products. In general, higher values are concentrated in the upper regions (zones 6 to 8) for most variables (TOP12, TOP35, TOP45, RNN, RN30, and ZTO). On the other hand, XDD (electrification) is more important in flat areas, while VIL density and surface reflectivity have the predominant range between zones 3 and 6.

3.3. Outliers

Outliers identify those extreme values for a data sample. This identification is very important to determine the limits associated with extreme events. To select the outliers of the different samples by zones, the “extremevalues” R package has been used [48]. It is important to note that the analyzed values correspond to sets with several samples per day, smoothing the daily value for each zone. This is more evident for fields of variables that usually are concentrated in relatively small areas, caused by deep convection (VIL Density, heavy rainfall, TOP45 or lightning activity), meanwhile other parameters (mainly TOP35 and TOP12) are less affected by this circumstance.
One of the first points of the comparison between previous Table 1 and the following Table 2, which contains the outlier upper limits, is that in some cases (Echo top for 12 dBZ, and the surface and total reflectivity) the outlier is below the third quantile of the sample used. In those cases, the probability of observing extraordinary values is higher than for the rest of the parameters. So, very short-term intensities (reflectivity) and very large vertical development of precipitating systems are more frequent that the other variables: tops associated with mid and high intense reflectivity, lightning activity, or 30-minute and daily quantitative precipitation estimation.
Another point of interest resides in the high fitting of the datasets for those three variables (TOP12, ZSF, and ZTO), in comparison to the rest, according to the R-squared value (values inside the parentheses). In those cases, the value exceeds 0.97 in all cases, only comparable with the TOP45 ones (near 0.96). For the rest of variables fit is worst, in special for lightning activity (R2 between 0.12 and 0.54).
Regarding the breaking point, there are many similarities between both tables, predominating zones 5, 6 and 7 (ZSF, ZTO, DVIL, RN30, RNN, TOP35 and TOP12). This confirms that highest convective activity occurs in the immediate areas to the most elevated ranges, at altitudes between 500 and 2000 m ASL.

3.3. Monthly Behavior

The combination of the Mediterranean Sea and the different Catalan ranges play a principal role in the modulation of the precipitation regime along the different seasons of the year. In this section the different variables from a monthly point of view are analyzed, based on boxplot graphics.

3.3.1. Surface Reflectivity

Figure 6 shows the variation between the different zones regarding the surface reflectivity: meanwhile for zones 1 to 4 (altitude below 500 m) the variation between months is not evident and only hidden maxima can be detected (June and November in zone 1, October in zone 2, and September in zones 3 and 4). In the opposite case, zones 5 to 8 present a clear maximum for the Summer months, mainly for July and August. The maximum is more evident for the highest zones. The same behaviour is observed for total reflectivity (ZTO, not shown).

3.3.2. Echo Top

Figure 7 and Figure 8 show the evolution of Echo Top for 12 and 45 dBZ along the year for the different zones, respectively. In the first case, TOP12, there is a total agreement between all the regions, with a similar monthly pattern: a maximum between July and August, while the minimum occurs during the period between November and March. This is an indicative that deep convection occurrence is more usual during the summer months than in the cold season. In the same line, TOP45 shows highest values during the same period of the year. This parameter is indicative of the presence of hail, or large hail, especially when values are close or over 4 km. This threshold is exceeded generally during the warmest period (June to September), and more usually for the more elevated zones (4 to 8).

3.3.3. VIL Density

VIL density can be associated with hail occurrence. For instance, values exceeding 2.5 g/m3 have been revealed as severe hail (diameter over 2 cm) diagnostician in the region of study, meanwhile 1 g/m3 is highly correlated with hail of diameter exceeding 0.5 cm. Figure 9 shows how the probability of hail occurrence in zone 1 is concentrated between August and November. From here, the length of the hail season (this is, with probability of hail occurrence) increases: from April to November (zone 5), decreasing again from this point, with a new minimum in zone 8 (from May to August). Besides, it can be observed as the height increases the influence of the warm season (June to August) is also higher.

3.3.4. Quantitative Precipitation Estimation

The last figures of the monthly analysis refer to precipitation estimation, daily (Figure 10) and 30-minute (Figure 11). Regarding the first one, the pattern is similar in all cases, with a bimodal distribution, but with differences depending on the zone (this is, the altitude): zones 1 to 5 show values generally below 5 mm and the peaks in January and November, with very scarce precipitation in summer months (June to August). Even the pattern is similar for zones 6 to 8, the maxima shift to February or March on one hand, and October or November on the other hand. Besides, the values are larger for all months.
In the case of 30-minute precipitation, which is the cause of flash-floods in many events, the behavior differs respect on the daily field. Again, there are two clear differentiated patterns, with the break point again between zones 5 and 6. While for the zones below 500 m ASL of altitude there are two peaks (on March and September/November, respectively) and the values are below 2.5 mm, in the case of top zones there is only one maximum, in the summer months (June to August), where the value is over 2.5 mm.

4. Discussion

The daily analysis of different points for eight zones with similar heights across several radar fields and lightning data for the period 2016-2025 has revealed important conclusions regarding the yearly precipitation regime associated with sea and topographical influences. Gnann et al. [15] made an extensive review of the factors associated with topography that contribute to the precipitation regime of a mountainous region. Similarly, Schneider et al. [17] demonstrated that low-mountain zones are highly influenced by topography. In the present analysis, from a global perspective, rainfall intensity and cumulation increased with height up to an altitude of 500 or 1000 m ASL, respectively. Virts et al. [19] showed the discrimination between regions below and over 500 m in the case of thunderstorm activity. Moreover, Tan et al. [20] observed that 1000 m was a breaking point in the precipitation regime of the South-Eastern Asian region. Taszarek et al. [45] have demonstrated that lightning activity varies throughout the year, affecting coastal or mountainous regions depending on the season. A similar result was observed in the current study, with maxima in the flattest area (zone 1) and in the upper ranges (zones 6-8).
Taszarek et al. [45] also demonstrated single-mode or bi-modal monthly behaviour, depending on the region, for convection. The analysed variables associated with convection in the present study also showed this variability, with a single mode for ZSF, TOP12, TOP45, or DVIL; meanwhile, for daily cumulated rainfall, a double mode was observed. A case in point is the 30-minute cumulated rainfall, which exhibits a bimodal pattern at 500 m and a unimodal pattern at higher altitudes.
Abel et al. [16] showed that precipitation in coastal areas has a high dependence on the elevation gradient of the region and, besides, how the topography blocks precipitation in some circumstances, allowing high amounts of rainfall in elevated areas, coinciding with Godart et al. [21]. This is coincidental with the current results for the 90th quantile or the outliers analyses, with breakpoints at 1000 and 2000 m, respectively.
Miglietta et al. [9] analysed the influence of the Mediterranean Sea on cyclogenesis, which has a peak in the region of study during the Summer and Autumn, according to Campins et al. [11]. However, this Mediterranean cyclogenesis is very variable depending on the year (Almazouri et al. [10]), coinciding with the high variability of the Mediterranean precipitation regime associated with the atmospheric conditions that occurred in the region (Dayan et al. [23]). Water conditions have been revealed as one of the main ingredients in the precipitation regime in a coastal region (Caine et al. [26]). All those factors influence the previous results because of the high variability of the weather conditions. However, considering an analysis such as the current one, it is possible to understand better the situations that can lead to a critical scenario, with an excess of precipitation or, on the other hand, with a dramatic drought.
To sum up, this type of Research is important to combine with the results of historical analysis of floods (such as Benito et al. [12]) and of the input of hydrological models (Tramblay et al. [5]; Zoccatelli et al. [6]; Dottori et al. [7]), to avoid or reduce the high impact of floods in the region of study (Hochman et al. [4]; Vinet et al. [8]; Llasat et al. [13]; Stamos and Diakakis [14]). Besides, it is important to bear in mind that droughts and floods are expected to increase in the area of analysis in the future due to climate change because of the meteorological conditions (Granata et al. [2]; Raymond et al. [3]). Furthermore, these conditions are applicable to other regions, such as the Caribbean Sea (Martinez et al. [24]) or South China (Peng et al. [25]; Ummenhofer et al. [22]).

5. Conclusions

Catalonia, like many other Mediterranean Regions, has a climate with a high dependance on the atmospheric conditions, but modulates by the combination of the complex topography and the Mediterranean Sea. These factors make the precipitation regime is highly variable and can produce very long dry or wet seasons. Some reports verified by recent observations have indicated that Global Warming has a major impact on the Mediterranean Basin, with an intensification of droughts and high rain, with the increase also of extreme wildfires and floods and flash floods. Therefore, the current analysis intends to give some clues to the current state of the precipitation regime to help on the management of the water resources of the region.
From the study of daily values of different radar and lightning parameters for different altitudes, it has been observed that: first, there is a high relationship between the precipitation and the height of the observation, until an altitude between 500 m and 1000 m. Moreover, lightning occurrences are bigger in coastal areas and very high zones. Topography also plays a major role in the development of deep convection, which initiates at highest altitudes to move to moderate height zones.
Considering the monthly data, it has observed double behaviour: on one hand, a single maximum mode, generally concentrated on warm months for convective parameters (T45, ZSF, DVI or RN30, only for heights over 1000 m). On the other hand, a double maxima pattern with peaks near March and November, mainly.
Identifying disruptions of this behaviour for a period of three or more months can warn of anomalous atmospheric conditions that can anticipate a long wet or dry period.

Funding

This research received no external funding.

Institutional Review Board Statement

Not applicable.

Data Availability Statement

The data presented in this study are available on request from the corresponding author due to internal processes applied to the raw data, which are not publicly available.

Acknowledgments

The Author wants to thank the Meteorological Service of Catalonia for the data provided.

Conflicts of Interest

The author declares no conflicts of interest.

Abbreviations

The following abbreviations are used in this manuscript:
WMO World Meteorological Organisation
ASL Above Sea Level
XDDE Lightning Location System (Xarxa de Detecció de Descàrregues Elèctriques)
LF Low Frequency
VHF Very High Frequency
CG Cloud-to-Ground flashes
IC Intra-Cloud flashes
DE Detection efficiency
XRAD Catalan weather radar network
ZSF Reflectivity at the surface
ZTO Maximum reflectivity value for the complete column
T12, T35, and T45 Echo top (or the maximum height where an echo exceeds a certain reflectivity threshold) for 12 dBZ, 35 dBZ, and 45 dBZ
RNN and R30 Quantitative precipitation estimation at daily and 30-minute time resolutions
VIL Vertically Integrated Liquid
VILD VIL density

References

  1. C3S/ECMWF and WMO. C3S-WMO European State of the Climate 2025. In Copernicus Climate Change Service; accessed; World Meteorological Organization, 2026; (accessed on 10 May 2026). [Google Scholar] [CrossRef]
  2. Granata, F.; Zhu, S.; Di Nunno, F. Hydrological extremes in the Mediterranean basin: interactions, impacts, and adaptation in the face of climate change. Reg. Environ. Change 2025, 25(3), 100. [Google Scholar] [CrossRef]
  3. Raymond, F.; Ullmann, A.; Camberlin, P.; Oueslati, B.; Drobinski, P. Atmospheric conditions and weather regimes associated with extreme winter dry spells over the Mediterranean basin. Clim. Dyn. 2018, 50(11), 4437–4453. [Google Scholar] [CrossRef]
  4. Hochman, A.; Marra, F.; Messori, G.; Pinto, J. G.; Raveh-Rubin, S.; Yosef, Y.; Zittis, G. ESD reviews: extreme weather and societal impacts in the eastern Mediterranean. Earth Syst. Dyn. Discuss. 2021, 1–53. [Google Scholar] [CrossRef]
  5. Tramblay, Y.; Mimeau, L.; Neppel, L.; Vinet, F.; Sauquet, E. Detection and attribution of flood trends in Mediterranean basins. Hydrol. Earth Syst. Sci. 2019, 23(11), 4419–4431. [Google Scholar] [CrossRef]
  6. Zoccatelli, D.; Marra, F.; Armon, M.; Rinat, Y.; Smith, J. A.; Morin, E. Contrasting rainfall-runoff characteristics of floods in desert and Mediterranean basins. Hydrol. Earth Syst. Sci. 2019, 23(6), 2665–2678. [Google Scholar] [CrossRef]
  7. Dottori, F.; Alfieri, L.; Bianchi, A.; Skoien, J.; Salamon, P. A new dataset of river flood hazard maps for Europe and the Mediterranean Basin. Earth Syst. Sci. Data 2022, 14(4), 1549–1569. [Google Scholar] [CrossRef]
  8. Vinet, F.; Bigot, V.; Petrucci, O.; Papagiannaki, K.; Llasat, M. C.; Kotroni, V.; Boissier, L.; Aceto, L.; Grimalt, M.; Llasat-Botija, M.; Pasqua, A. A.; Rossello, J.; Kılıç, Ö.; Kahraman, A.; Tramblay, Y. Mapping Flood-Related Mortality in the Mediterranean Basin. Results from the MEFF v2.0 DB. Water 2019, 11(10), 2196. [Google Scholar] [CrossRef]
  9. Miglietta, M. M.; Flaounas, E.; González-Alemán, J. J.; Panegrossi, G.; Gaertner, M. A.; Pantillon, F.; Pasquero, C.; Schultz, D. M.; D’Adderio, L. P.; Dafis, S.; Husson, R.; Ricchi, A.; Carrió Carrió, D. S.; Davolio, S.; Fita, L.; Picornell, M. Á.; Pytharoulis, I.; Raveh-Rubin, S.; Scoccimarro, E.; Bernini, L.; Cavicchia, L.; Conte, D.; Ferretti, R.; Flocas, H.; Gutiérrez-Fernández, J.; Hatzaki, M.; Homar Santaner, V.; Jansà, A.; Patlakas, P. Defining Medicanes: Bridging the Knowledge Gap between Tropical and Extratropical Cyclones in the Mediterranean. Bull. Am. Meteorol. Soc. 2025, 106(9), E1955–E1971. [Google Scholar] [CrossRef]
  10. Almazroui, M.; Awad, M.M.; Nazrul Islam, M. Characteristics of the internal and external sources of the Mediterranean synoptic cyclones for the period 1956–2013. Theor. Appl. Climatol. 2017, 133, 811–827. [Google Scholar] [CrossRef]
  11. Campins, J.; Genovés, A.; Picornell, M.A.; Jansà, A. Climatology of Mediterranean cyclones using the ERA-40 dataset. Int. J. Climatol. 2011, 31, 1596–1614. [Google Scholar] [CrossRef]
  12. Benito, G.; Sanchez-Moya, Y.; Medialdea, A.; Barriendos, M.; Calle, M.; Rico, M.; Sopeña, A.; Machado, M.J. Extreme Floods in Small Mediterranean Catchments: Long-Term Response to Climate Variability and Change. Water 2020, 12, 1008. [Google Scholar] [CrossRef]
  13. Llasat, M. C.; Llasat-Botija, M.; Petrucci, O.; Pasqua, A. A.; Rosselló, J.; Vinet, F.; Boissier, L. Towards a database on societal impact of Mediterranean floods within the framework of the HYMEX project. Nat. Hazards Earth Syst. Sci. 2013, 13(5), 1337–1350. [Google Scholar] [CrossRef]
  14. Stamos, I.; Diakakis, M. Mapping Flood Impacts on Mortality at European Territories of the Mediterranean Region within the Sustainable Development Goals (SDGs) Framework. Water 2024, 16, 2470. [Google Scholar] [CrossRef]
  15. Gnann, S.; Baldwin, J. W.; Cuthbert, M. O.; Gleeson, T.; Schwanghart, W.; Wagener, T. The influence of topography on the global terrestrial water cycle. Rev. Geophys. 2025, 63, e2023RG000810. [Google Scholar] [CrossRef]
  16. Abel, M. R.; Hall, A.; Fovell, R. G. Blocking in Areas of Complex Topography, and Its Influence on Rainfall Distribution. J. Atmos. Sci. 2009, 66, 508–518. [Google Scholar] [CrossRef]
  17. Schneider, L.; Barthlott, C.; Barrett, A.I.; Hoose, C. The precipitation response to variable terrain forcing over low mountain ranges in different weather regimes. Q. J. R Meteorol. Soc. 2018, 144, 970–989. [Google Scholar] [CrossRef]
  18. Sylla, M. B.; Gaye, A. T.; Jenkins, G. S. On the Fine-Scale Topography Regulating Changes in Atmospheric Hydrological Cycle and Extreme Rainfall over West Africa in a Regional Climate Model Projections. Int. J. Geophys. 2012, 2012, 981649, 15 pp. [Google Scholar] [CrossRef]
  19. Virts, K.; Wallace, J.M.; Hutchins, M. L.; Holzworth, R. H. Highlights of a New Ground-Based, Hourly Global Lightning Climatology. Bull. Amer. Meteor. Soc. 2013, 94, 1381–1391. [Google Scholar] [CrossRef]
  20. Tan, H.; Ray, P.; Barrett, B.; et al. Understanding the role of topography on the diurnal cycle of precipitation in the Maritime Continent during MJO propagation. Clim. Dyn. 2022, 58, 3003–3019. [Google Scholar] [CrossRef]
  21. Godart, A.; Anquetin, S.; Leblois, E.; Creutin, J. The Contribution of Orographically Driven Banded Precipitation to the Rainfall Climatology of a Mediterranean Region. J. Appl. Meteor. Climatol. 2011, 50, 2235–2246. [Google Scholar] [CrossRef]
  22. Ummenhofer, C. C.; Sen Gupta, A.; Taschetto, A. S.; England, M. H. Modulation of Australian Precipitation by Meridional Gradients in East Indian Ocean Sea Surface Temperature. J. Clim. 2009, 22, 5597–5610. [Google Scholar] [CrossRef]
  23. Dayan, U.; Nissen, K.; Ulbrich, U. Review Article: Atmospheric conditions inducing extreme precipitation over the eastern and western Mediterranean. Nat. Hazards Earth Syst. Sci. 2015, 15, 2525–2544. [Google Scholar] [CrossRef]
  24. Martinez, C.; Goddard, L.; Kushnir, Y.; Ting, M. Seasonal climatology and dynamical mechanisms of rainfall in the Caribbean. Clim. Dyn. 2019, 53, 825–846. [Google Scholar] [CrossRef]
  25. Peng, D.; Zhou, T.; Hu, S.; Zheng, J. Ocean-driven shifts in circulation regime frequency modulate South China rainfall. npj Clim. Atmos. Sci. 2025, 8, 379. [Google Scholar] [CrossRef]
  26. Caine, S.; Jakob, C.; Siems, S.; May, P. Objective Classification of Precipitating Convective Regimes Using a Weather Radar in Darwin, Australia. Mon. Wea. Rev. 2009, 137, 1585–1600. [Google Scholar] [CrossRef]
  27. Llasat, M. C.; del Moral, A.; Cortès, M.; Rigo, T. Convective precipitation trends in the Spanish Mediterranean region. Atmos. Res. 2021, 257, 105581. [Google Scholar] [CrossRef]
  28. Degiacomi, T.; Zonato, A.; Davolio, S.; Miglietta, M. M.; Giovannini, L. Deep banded orographic convection over an idealized mountain range: influence of upstream atmospheric conditions. J. Atmos. Sci. 2025, 82(6), 1033–1055. [Google Scholar] [CrossRef]
  29. Sindosi, O. A.; Bartzokas, A.; Kotroni, V.; Lagouvardos, K. Influence of orography on precipitation amount and distribution in NW Greece; a case study. Atmos. Res. 2015, 152, 105–122. [Google Scholar] [CrossRef]
  30. Erdoğan, M. Y.; Yavuz, V.; Kara, Y. Characterization of convective weather and atmospheric environments over Turkish airports. Acta Geophys. 2026, 74(2), 130. [Google Scholar] [CrossRef]
  31. Llasat, M. C.; Marcos, R.; Turco, M.; Gilabert, J.; Llasat-Botija, M. Trends in flash flood events versus convective precipitation in the Mediterranean region: The case of Catalonia. J. Hydrol. 2016, 541, 24–37. [Google Scholar] [CrossRef]
  32. Amengual, A.; Romero, R.; Gómez, M.; Martín, A.; Alonso, S. A hydrometeorological modeling study of a flash-flood event over Catalonia, Spain. J. Hydrometeorol. 2007, 8(3), 282–303. [Google Scholar] [CrossRef]
  33. Llasat, M. D. C.; Rigo, T.; Barriendos, M. The “Montserrat-2000” flash-flood event: A comparison with the floods that have occurred in the northeastern Iberian Peninsula since the 14th century. Int. J. Climatol. 2003, 23(4), 453–469. [Google Scholar] [CrossRef]
  34. Llasat, M. C.; Llasat-Botija, M.; Pardo, E.; Marcos-Matamoros, R.; Lemus-Canovas, M. Floods in the Pyrenees: a global view through a regional database. Nat. Hazards Earth Syst. Sci. 2024, 24(10), 3423–3443. [Google Scholar] [CrossRef]
  35. Lopez-Bustins, J. A.; Pascual, D.; Pla, E.; Retana, J. Future variability of droughts in three Mediterranean catchments. Nat. Hazards 2013, 69(3), 1405–1421. [Google Scholar] [CrossRef]
  36. Llasat, M. C.; Llasat-Botija, M.; Barnolas, M.; López, L.; Altava-Ortiz, V. An analysis of the evolution of hydrometeorological extremes in newspapers: the case of Catalonia, 1982–2006. Nat. Hazards Earth Syst. Sci. 2009, 9(4), 1201–1212. [Google Scholar] [CrossRef]
  37. Pineda, N.; Peña, J. C.; Soler, X.; Aran, M.; Pérez-Zanón, N. Synoptic weather patterns conducive to lightning-ignited wildfires in Catalonia. Adv. Sci. Res. 2022, 19, 39–49. [Google Scholar] [CrossRef]
  38. Bech, J.; Arús, J.; Castán, S.; Pineda, N.; Rigo, T.; Montanyà, J.; van der Velde, O. A study of the 21 March 2012 tornadic quasi linear convective system in Catalonia. Atmos. Res. 2015, 158, 192–209. [Google Scholar] [CrossRef]
  39. del Moral, A.; Weckwerth, T.M.; Rigo, T.; Bell, M.M.; Llasat, M.C. C-Band Dual-Doppler Retrievals in Complex Terrain: Improving the Knowledge of Severe Storm Dynamics in Catalonia. Remote Sens. 2020, 12, 2930. [Google Scholar] [CrossRef]
  40. Pineda, N.; Montanyà, J. Lightning detection in Spain: the particular case of Catalonia. In Lightning: Principles, Instruments and Applications: Review of Modern Lightning Research; Springer: Dordrecht, 2009; pp. 161–185. [Google Scholar] [CrossRef]
  41. Delobbe, L.; Holleman, I. Uncertainties in radar echo top heights used for hail detection. Meteorol. Appl. 2006, 13(4), 361–374. [Google Scholar] [CrossRef]
  42. Pilorz, W.; Zięba, M.; Szturc, J.; Łupikasza, E. Large hail detection using radar-based VIL calibrated with isotherms from the ERA5 reanalysis. Atmos. Res. 2022, 274, 106185. [Google Scholar] [CrossRef]
  43. Germann, U.; Berenguer, M.; Sempere-Torres, D.; Zappa, M. REAL—Ensemble radar precipitation estimation for hydrology in a mountainous region. Q. J. R. Meteorol. Soc. 2009, 135(639), 445–456. [Google Scholar] [CrossRef]
  44. Ortega, K. L. Evaluating multi-radar, multi-sensor products for surface hailfall diagnosis. E-J. Sev. Storms Meteorol.> 2018, 13(1), 1–36. [Google Scholar] [CrossRef]
  45. Taszarek, M.; Allen, J.; Púčik, T.; Groenemeijer, P.; Czernecki, B.; Kolendowicz, L.; Lagouvardos, K.; Kotroni, V.; Schulz, W. A Climatology of Thunderstorms across Europe from a Synthesis of Multiple Data Sources. J. Clim. 2019, 32(6), 1813–1837. [Google Scholar] [CrossRef]
  46. Adler, D.S.; Kelly, T.; Elliott, T.; Adamson, J. vioplot: violin plot. R package version 0.5.1, 2025. Available online: https://github.com/TomKellyGenetics/vioplot. (accessed on 1 May 2026).
  47. R Core Team. _R: A Language and Environment for Statistical Computing_. R Foundation for Statistical Computing, Vienna, Austria, 2025; Available online: https://www.R-project.org/ (accessed on 18 April 2026).
  48. van der Loo, M. Distribution Based Outlier Detection for Univariate Data. Technical Report 10003 2010, Statistics Netherlands, The Hague. Available online: https://www.cbs.nl/ (accessed on 19 April 2026).
Figure 1. (a) European map with Catalonia inside a red rectangle. (b) Zoom to Catalonia with blue dots indicating Lightning Location Systems and red points showing the radar positions.
Preprints 217055 g001
Figure 2. (a) Topography of the area of study. (b) Different selected zones with the black dots indicating the location of the positions selected for the analysis. The white lines indicate the transects (labeled from A to F, from North to South) considered for selecting the points from sea to inland.
Preprints 217055 g002
Figure 3. Violin plots for the different zones presented in Figure 2, for surface reflectivity -ZSF- (a), total reflectivity -ZTO- (b), daily quantitative precipitation estimation -RNN- (c), and 30-minute quantitative precipitation estimation -RN30- (d). Black boxes indicate the box plots, and the white dots correspond to the median value.
Preprints 217055 g003
Figure 4. Same as Figure 3, but for Echo Top 12 -T12- (a), 35 -T35- (b), and 45 -T45- (c), and VIL density -DVIL- (d).
Preprints 217055 g004
Figure 5. Same as Figure 3, for CG lightning.
Preprints 217055 g005
Figure 6. Monthly box plots for the surface reflectivity (ZSF) for the different zones (from 1 -top left- to 8 -bottom right-).
Preprints 217055 g006
Figure 7. Same as Figure 6, but for T12.
Preprints 217055 g007
Figure 8. Same as Figure 6, but for T45.
Preprints 217055 g008
Figure 9. Same as Figure 6, but for DVI.
Preprints 217055 g009
Figure 10. Same as Figure 6, but for RNN.
Preprints 217055 g010
Figure 11. Same as Figure 6, but for RN30.
Preprints 217055 g011
Table 1. Values of the 90th quantile for the different variables and zones.
Variable. Zone 1 Zone 2 Zone 3 Zone 4 Zone 5 Zone 6 Zone 7 Zone 8
TOP45 7.8 8.8 8.9 9.4 10.0 10.2 11.0 10.2
TOP35 8.3 9.5 9.6 10.1 10.9 11.8 11.6 11.2
TOP12 15.3 14.2 14.6 14.6 14.6 15.2 14.9 14.7
XDD 3.5 1.0 1.0 1.0 1.0 1.0 1.0 1.0
RNN 2.9 3.0 4.4 4.4 5.0 9.3 9.4 9.9
RN30 2.3 2.5 3.7 3.2 3.3 4.8 4.2 3.3
DVIL 1.7 1.9 2.1 2.0 2.0 2.1 2.0 1.7
ZSF 52.5 52.3 53.1 53.0 53.2 53.0 50.6 47.5
ZTO 53.1 53.4 53.9 53.7 54.1 55.0 52.7 49.5
Table 2. Same as Table 1, but for the outliers.
Variable Zone 1 Zone 2 Zone 3 Zone 4 Zone 5 Zone 6 Zone 7 Zone 8
TOP45 7.6 (0.96) 8.4 (0.97) 9.1 (0.95) 8.7 (0.94) 8.8 (0.96) 9.3 (0.96) 9.7 (0.96) 8.8 (0.97)
TOP35 9.1 (0.88) 9.1 (0.91) 10.0 (0.94) 9.4 (0.92) 9.9 (0.94) 10.4 (0.94) 10.4 (0.95) 10.0 (0.94)
TOP12 12.8 (0.98) 12.0 (0.98) 12.1 (0.98) 12.1 (0.98) 12.3 (0.98) 12.9 (0.98) 12.6 (0.98) 12.1 (0.97)
XDD 4.5 (0.54) 2.0 (0.19) 2.0 (0.35) 2.0 (0.22) 2.0 (0.32) 2.0 (0.22) 2.0 (0.26) 2.5 (0.12)
RNN 25.5 (0.77) 24.3 (0.77) 26.5 (0.77) 25.7 (0.78) 26.4 (0.79) 29.2 (0.84) 24.8 (0.85) 27.3 (0.84)
RN30 8.4 (0.86) 8.3 (0.87) 10.6 (0.87) 10.1 (0.86) 11.3 (0.85) 13.5 (0.84) 12.0 (0.85) 7.6 (0.87)
DVIL 2.3 (0.89) 1.9 (0.94) 2.4 (0.90) 2.2 (0.89) 2.3 (0.91) 2.1 (0.93) 2.0 (0.93) 2.0 (0.92)
ZSF 45.8 (0.99) 46.2 (0.99) 47.6 (0.99) 47.2 (0.99) 47.7 (0.98) 47.0 (0.99) 46.1 (0.99) 43.9 (0.99)
ZTO 46.8 (0.99) 47.6 (1.00) 48.5 (0.99) 48.6 (0.99) 48.8 (0.99) 49.0 (0.99) 48.1 (0.99) 45.7 (0.97)
Disclaimer/Publisher’s Note: The statements, opinions and data contained in all publications are solely those of the individual author(s) and contributor(s) and not of MDPI and/or the editor(s). MDPI and/or the editor(s) disclaim responsibility for any injury to people or property resulting from any ideas, methods, instructions or products referred to in the content.
Copyright: This open access article is published under a Creative Commons CC BY 4.0 license, which permit the free download, distribution, and reuse, provided that the author and preprint are cited in any reuse.
Prerpints.org logo

Preprints.org is a free preprint server supported by MDPI in Basel, Switzerland.

Subscribe

© 2026 MDPI (Basel, Switzerland) unless otherwise stated

Accessibility

Disclaimer

Terms of Use

Privacy Policy

Privacy Settings