Submitted:
02 June 2026
Posted:
03 June 2026
You are already at the latest version
Abstract
The paper addresses what we term the "Impedance Mismatch" inherent in multi-energy microgrids—namely, the conflict where disparate physical domains traditionally force the use of isolated or highly rigid Supervisory Control and Data Acquisition (SCADA) data silos. We present a scalable, open-source edge-to-cloud telemetry pipeline orchestrated entirely through a custom MING+React stack (Mosquitto, InfluxDB, Node-RED, Grafana). The core architectural contribution is a category-specific Canonical Data Model (CDM) that functions as a translation layer, effectively decoupling sensor hardware from ingestion logic. Coupled with an automated Null-Pruning middleware loop and Metadata Separation, this architecture guarantees strict input purity prior to time-series persistence. To validate the system, the middleware was subjected to a high-fidelity stochastic simulation utilizing a Strict Corridor Algorithm to mimic physical inertia across 12 distinct energy vectors. Simulation-based validation confirms that the pipeline successfully maintains data integrity for valid telemetry packets, achieves high accuracy in pruning malformed data, and operates with low latency under concurrency. These findings demonstrate the architecture's feasibility as a resilient, cross-domain research environment for modern Digital Learning Factories.
Keywords:
smart grid
; microgrid
; MING stack
; CPS
; learning factory
; renewable energy
; telemetry
; edge-to-cloud
; canonical data model
; Industrial Internet of Things (IIoT)
1. Introduction
This paper addresses the persistent challenge of managing heterogeneous data streams within modern renewable energy systems (RES) laboratories and multi-energy microgrid deployments. In such environments, physical systems generate fundamentally incompatible telemetry. We define this friction as the Impedance Mismatch, which occurs when high-frequency mechanical-electrical signals, like rapid engine transients, clash with slow-drifting biological and metabolic rhythms, such as photobioreactor metrics. Because these disparate physical domains cannot be natively synchronized, advanced cross-vector optimization remains severely restricted [1]. When evaluating existing telemetry solutions, critical flaws are identified in both contemporary open-source and proprietary monitoring paradigms. Specifically, these architectures rely on either cost-prohibitive, closed industrial SCADA software or brittle Internet of Things (IoT) frameworks. Standard approaches often omit real-time structural audits and data cleansing layers, failing to meet modern edge-computing constraints [2]. This design flaw leaves the core time-series database highly vulnerable to compounding “Bad Data” corruption, which irreparably poisons long-term analytical accuracy before raw telemetry can ever be mapped into actionable visualizations. While systematic mapping studies have identified broad sustainability and architectural integration challenges in legacy Cyber-Physical Systems (CPS) frameworks [3], our work specifically addresses the vulnerability of the persistence layer to time-series data corruption. Despite these advancements, a significant research gap remains. Existing telemetry pipelines lack a lightweight, edge-level validation mechanism. Specifically, they cannot reconcile heterogeneous, multi-vector energy parameters into a unified data structure without introducing substantial computational overhead or database schema reconfiguration. In this study, a highly resilient architectural blueprint is presented to resolve these inefficiencies, featuring an explicitly open-source, vendor-agnostic, containerized edge-to-cloud telemetry pipeline that utilizes a custom MING+React stack (Mosquitto, InfluxDB, Node-RED, Grafana). While the general principles of the CDM and metadata-tag separation are derived from the pre-existing KIOZE platform specification, the novel, falsifiable contributions of this work are three-fold: * C1: The implementation of the category-specific CDM translation layer inside Node-RED middleware to dynamically decouple heterogeneous sensor streams (mechanical-electrical vs. biochemical) without database schema alterations. * C2: The development and evaluation of an automated, edge-level Null-Pruning middleware loop, demonstrating its capability to guarantee 100% data purity under simulated sensor fault conditions. * C3: The empirical validation of this pipeline’s temporal continuity using a stochastic corridor algorithm, along with the performance benchmarking of end-to-end telemetry delivery and application programming interface (API) query latency under peak local concurrency.
2. Related Work
2.1. CPS Reference Architectures
In this section, we analyze the architectural boundaries of established Cyber-Physical Systems (CPS) and the Industrial Internet of Things (IIoT), and critique their deployment within renewable energy laboratory contexts. Conventional reference architectures often struggle when bridging raw physical assets with cloud-based analytics, primarily due to systemic limitations in handling cross-vector environments. Legacy frameworks mandate rigid structural coupling, which institutionalizes profound data inefficiencies and fails to meet modern edge-computing constraints [3]. To address these constraints, containerized microservice architectures have been proposed to decouple ingestion and visualization services, enhancing system scalability and flexibility [4]. Furthermore, foundational Industry 4.0 reference models inherently restrict the seamless integration of high-frequency mechanical pulses with slow-moving biological variables. An analysis of current digital-twin architectures reveals that this rigid structural coupling institutionalizes isolated data silos. Consequently, advanced hybrid microgrid optimization is severely restricted, forcing researchers to rely on highly brittle ingestion routines [1,5]. Similarly, the deployment of wireless sensor networks in large-scale environments requires robust data validation and routing to prevent noise propagation and packet drops [6].
2.2. MING Stack Deployments
This approach is contrasted with previous implementations that utilize the MING stack to identify critical operational gaps. While standard MING deployments excel at basic time-series ingestion for uniform data, they lack standardized validation middleware. Existing literature frequently omits real-time preprocessing at the network edge, relying heavily on post-ingestion processing rather than pre-ingestion validation. For example, Kychkin et al. [7] proposed an InfluxData-based monitoring architecture for compressor stations that relies on direct data persistence without pre-ingestion structural validation. Similarly, Dani and Mayadewi [8] presented an AI-powered energy monitoring framework using Node-RED and InfluxDB, but focused primarily on predictive analytics rather than edge-level data cleansing. This design flaw leaves the destination database highly vulnerable, as hardware sensor degradation can immediately inject malformed telemetry into the persistent storage tier. To prevent this compounding error and protect historical data integrity, this methodology decouples input validation from storage. Unlike earlier MING frameworks that lack structural oversight, this architecture implements a robust automated null-pruning intervention. This ensures that only validated, cleansed data reaches the time-series database, addressing the calls for sustainable and self-validating data pipelines in modern CPS literature [3]. The KIOZE platform specification outlines the CDM concept. However, this study isolates the novelty of a lightweight, edge-level Node-RED implementation of this null-pruning logic. We demonstrate its capability to sanitize sparse data structures in sub-millisecond times without index cardinality bloat in InfluxDB.
2.3. Learning Factory Implementations
A review of current Digital Learning Factory topologies exposes major data integration challenges. Traditional education-focused grids treat multi-energy telemetry as isolated silos, where fast mechanical-electrical vectors remain strictly segregated from slow biochemical vectors. These isolated physical testbeds cannot effectively communicate, severely limiting cross-domain pedagogical analysis [9]. While open-source supervisory systems have been developed to monitor physical microgrids using InfluxDB and Grafana [10], they typically do not address the structural differences between mechanical and biochemical vectors. Furthermore, although measurement-oriented frameworks like Measurify have been validated for home energy management and low-voltage feeders [11], their automatic schema validation is often centralized, rather than distributed to the edge. This rigid, institutionalized design is actively dismantled by formalizing an explicitly open-source, vendor-neutral alternative. By mapping localized sensor telemetry into category-specific CDMs, the physical sensor layer is decoupled from the logical processing tier. This fully decoupled integration philosophy successfully mitigates the historical impedance mismatch between rapid electrical transients and gradual metabolic shifts. It enables a comprehensive, cross-vector research environment, which builds upon the pedagogical and structural design requirements for modern learning factories [12].
3. System Architecture
3.1. Overview
In this section, a structural and functional breakdown of the MING+React telemetry pipeline is provided, which serves as the core technical contribution. The design philosophy revolves around the implementation of a unified digital infrastructure that is orchestrated entirely through a docker-compose.yml configuration. This helped ensure every component is containerized in a portable and reproducible ecosystem that bridges the cyber and physical domains of the Learning Factory. This approach ensured the pedagogical experiments in the Learning Factory remain independent of hardware variations. The full reference implementation, comprising the Docker Compose orchestration, Mosquitto, InfluxDB, Node-RED, and Grafana configurations, the canonical data model schemas, and the React frontend source, is openly available. The project services were mapped onto the Canonical 4-Layer CPS Architecture to maintain technical rigor [5,13]. The mapping categorizes the stack as follows:
- Perception Layer: This tier comprises the physical and virtual sensor nodes, such as photovoltaic (PV) panels, wind turbines, and engine test benches, that generate raw telemetry. In the current implementation, this layer operated through simulated Node-RED flows to generate raw JavaScript Object Notation (JSON) telemetry from virtual energy assets [14].
- Network Layer: Here, the iot-mosquitto container is utilized to manage the asynchronous messaging via the Message Queuing Telemetry Transport (MQTT) protocol. This layer leverages standard publish-subscribe structures to handle high-frequency data traffic with minimal overhead, mirroring the SLADTA digital twin data pipeline design that relies on structured topic routes to decouple sensor outputs from backend consumers [15].
- Middleware Layer: This layer is the logic-heavy core of the architecture. It leverages node-red for flow orchestration and influxdb for high-frequency time-series persistence [7]. This layer acts as a protocol normalization layer where disparate data streams are consolidated.
- Application Layer: This tier provides the interface for human-machine interaction with the help of a custom React frontend and Grafana dashboards [9]. The frontend was implemented using Vite to ensure high-performance rendering of real-time status cards.
The structural mapping of these containerized services across the four layers is illustrated in Figure 1.
3.2. Deployment Topology
The deployment topology establishes the functional architecture for handling the impedance mismatch between high-velocity mechanical vectors and low-velocity biological vectors. The Observe-Orient-Decide-Act (OODA) loop framework was used to describe the functional flow of the pipeline, adapting the conceptual stages of cyber-physical control systems to structure our real-time telemetry loop. This functional sequence and data flow are mapped across the loop phases in Figure 2.
3.2.1. Observe: Edge Ingestion
The Observe phase initiates at the perception layer where device nodes publish raw telemetry data to specific MQTT topics. This stage captures the raw telemetry of the Learning factory, which ranges from high-speed electrical yields to gradual biological growth.
3.2.2. Orient: Protocol Normalization
This phase is handled exclusively within the Node-RED middleware. For the six fast mechanical-electrical vectors, such as rotational velocity and system current, mechanical dynamics are captured in real-time. For the six slow biological-thermal-chemical vectors, such as pH value and dissolved oxygen, the measurements are mapped to the CDM.
3.2.3. Decide: Null-Pruning and Logic
The Decide phase is where the system’s edge-level data cleaning resides. Currently, a custom CDM null-deletion logic is implemented within the Node-RED middleware to prune empty values or placeholders before time-series persistence, preventing empty values from polluting InfluxDB storage. However, full JSON schema validation and malformed packet rejection are currently omitted in the simulation MVP (disclosed as Gap 3 in the system specification). Consequently, the database relies on clean upstream publishers or the edge null-pruning transformer.
3.2.4. Act: Visualization and User Interface (UI) Rendering
The Act phase finishes the loop at the application layer. In the React source code, real-time status cards are implemented to update as soon as the API receives new packets. Grafana acts on the historical data in InfluxDB to provide trend analysis and its panels were orchestrated to trigger alerts based on threshold violations. The human-centric design allows researchers to close the loop, enabling them to interact with a synchronized digital twin of the energy assets.
3.3. MQTT Topic Taxonomy and Security Model
3.3.1. MQTT Topic Taxonomy
In this section, the logic is provided for the “General-to-Specific” messaging hierarchy, which structures the communication of the MING pipeline. The target architecture establishes a multi-level hierarchy that follows a strict spatial and logical progression: wksir/kioze/{category}/{device_id}/{stream}. Here, streams are categorized into telemetry, status, alarms, and cmd, aligning with the hierarchical topic conventions discussed in modern machine-to-machine (M2M) communication protocols [2]. This taxonomy ensures that the 12 distinct data vectors remain organized and accessible. However, in the current simulation MVP, the implemented Node-RED flows and MQTT Access Control Lists (ACLs) utilize the prefix devices/{category}/{device_id}/{stream} (specifically mapping telemetry to /telemetry, status to /status, and commands to /commands or /data). The transition to the unified wksir/kioze/ namespace represents an active onboarding target (disclosed as Gap 1 in the system specification). This structural organization is particularly powerful for the middleware layer. The Node-RED ingestion gateway is orchestrated to subscribe to the implemented telemetry stream via the wildcard pattern devices/+/+/telemetry. This allows a single functional block to ingest all telemetry while safely ignoring command or status topics. Once the migration is complete, the wildcard target will be shifted to wksir/kioze/+/+/telemetry. This enables a “plug-and-play” architecture where new energy assets can be onboarded without requiring manual topic reconfiguration.
3.3.2. Security Model: Authentication and ACLs
The security posture is anchored by the principle of least privilege, enforced through a combination of mandatory authentication and granular Access Control Lists (ACLs) [2]. The broker’s primary configuration and a centralized ACL are utilized to verify that every participant in the ecosystem is strictly authenticated and authorized. Every device node, service, and administrative user is encapsulated within a unique set of credentials stored in a secured password database. The ACL logic ensures that individual simulation nodes are segregated from one another. A photovoltaic node, for instance, is authorized only to publish to its own data and status topics and subscribe to its own commands topic under the devices/ namespace (e.g., devices/pv/pv_rotate/data). It cannot read the telemetry of the engine bench or inject data into the wind turbine stream. Conversely, the Node-RED gateway is authenticated with high-level permissions, allowing it to read all telemetry via the wildcard subscription devices/+/+/telemetry and write to all command topics. This segregation prevents unauthorized or misconfigured nodes from injecting unauthorized data into the CDM, thereby preserving the integrity of the time-series corpus. For the current development phase, the MQTT broker exposes its communication ports to external hosts (port 40098 in production and port 1883 in local development) to allow physical client onboarding and testing. The core IT/OT integration services (such as Node-RED, InfluxDB, and Grafana) communicate internally over the Docker bridge network behind an Nginx reverse proxy. However, the broker remains reachable externally on these configured ports, subject to username/password authentication and ACL rules.
4. Canonical Data Model
4.1. Design Rationale
In this section, the transformation of raw, heterogeneous telemetry into a unified JSON object is detailed. The CDM buffers the acute “Impedance Mismatch” in multi-vector energy systems. It decouples high-frequency engine bench dynamics from slow photobioreactor metabolic rhythms. The Engine Bench generates six high-frequency vectors, including rotational velocity and active power, where critical events occur in milliseconds. In contrast, the Algae Photobioreactor produces six slow biological vectors, such as pH and dissolved oxygen, which shift over hours. The CDM was implemented to normalize these disparate data streams. It acts as a translation layer. By mapping every sensor to a specific key-value contract, the need for custom ingestion logic was eliminated for every new device, thereby synchronizing the streams. While our specific CDM structure is a novel contribution of this work, the conceptual benefits of protocol decoupling and low-cost gateway standardization are grounded in the M2M and IIoT monitoring platforms evaluated in [2] and [16]. The explicit definitions, speed classes, parameter keys, and ingestion intervals for these 12 distinct vectors are detailed in Table 1. This ensures the React UI receives a predictable, clean data structure regardless of the sensor’s physical origin.
4.2. JSON Payload Schema
The CDM is designed as a target schema contract between the perception and middleware layers. In the current implementation, the Node-RED middleware executes the data cleaning loop, focusing primarily on null-field pruning rather than packet-level schema rejection [14,17]. While structural audits and packet-level schema enforcement represent a critical target for physical onboarding (Gap 3), the current simulation MVP relies on the edge null-pruning transformer to ensure clean data reaches the database. The schema is anchored by mandatory root-level keys: measurement, tags (nested metadata), fields (nested telemetry parameters), timestamp (Unix epoch milliseconds), and status. This structural uniformity enables the API and React frontend to query any asset using a unified, simplified logic. The core of the architectural novelty resides in the homogenization of disparate energy vectors through null-pruning and metadata separation logic. A dynamic filtering loop was implemented using an Object.entries process to prune any key containing a null value. This implementation achieves a protocol-independent data contract, drawing architectural inspiration from the simplified message formats used in low-cost IIoT monitoring platforms [16]. This is critical because, if a sensor fails, the middleware deletes the null key before it reaches InfluxDB, preventing “Bad Data” from polluting the database or degrading query performance [17]. Simultaneously, metadata keys are nested under the tags object (e.g., site_id, category, station_id), while raw telemetry parameters are nested under the fields object within the JSON packet, aligning directly with the InfluxDB Line Protocol structure [7]. By enforcing this structural unity, the gap was bridged between high-velocity mechanical pulses and slow-moving biological drifts, allowing generic UI components to render any device’s state by simply mapping keys within the data payload. While the conceptual superset schema is outlined in the pre-existing KIOZE platform specification, this work details its specific optimization for InfluxDB, implementation inside Node-RED, and empirical validation under concurrent load.
4.3. Engine Bench Payload Example
The Engine Bench represents the most demanding “Fast” vector. Its high-frequency mechanical, thermal, and control parameters are mapped into a sub-second telemetry packet to ensure performance calculations remain accurate even during rapid transients.

4.4. Algae Photobioreactor Payload Example
In contrast, the Algae Photobioreactor demonstrates the CDM’s flexibility for “Slow” vectors. Its six biological-chemical parameters are mapped into the identical structural framework used for the engine bench.

These examples illustrate the strict nesting of metadata under the tags object and telemetry under the fields object. By grouping and pre-processing these payloads at the network edge, the CDM successfully hides the underlying complexity of the multi-vector energy system, ensuring the digital twin of the Learning Factory remains synchronized.
5. Validation
5.1. Experimental Setup and Conditions
In this section, the rigorous environment built to stress-test the MING+React architecture is defined. A high-fidelity stochastic simulation was orchestrated in Node-RED to model physical assets like photovoltaic systems and wind turbines, employing open-source ingestion tools similar to those described in modern energy monitoring literature [8]. To validate the pipeline under realistic conditions, we developed a custom simulation model utilizing a strict corridor algorithm to mimic physical inertia and sensor noise. This custom model provides a baseline for evaluating edge-level filtering strategies similar to the fog-based sensor-ranking paradigms discussed generally in [17]. Unlike standard random number generation, the algorithm operates on a recursive random walk where each data point is constrained to a ±2% window relative to its predecessor. Mathematically, the next telemetry state is computed recursively as:
where is a uniform random variable, and represent physically realistic saturation boundaries to prevent infinite drift. The ±2% step size models the physical thermal and mechanical inertia of cyber-physical assets (such as photobioreactors and dyno engine benches) relative to the sampling interval. A larger threshold would introduce unrealistic sensor jitter that exceeds physical actuator slew rates, while a smaller step fails to test the pipeline’s dynamic rendering. In the Node-RED middleware simulation nodes, this algorithm is implemented as shown in Listing 1:
| Listing 1 Node-RED JavaScript implementation of the Strict Corridor Algorithm. |
 |
Representative simulation parameters include Engine Speed (, range ), pH (, range ), Active Power (, range ), and Medium Temperature (, range ).
The twelve core physical vectors, which consist of six fast vectors and six slow vectors, were simultaneously stressed under peak high-concurrency load conditions. The simulation consisted of 10 concurrent publishers (representing the 10 data categories active in the Node-RED flow, matching the database schema measurements). Each publisher transmitted telemetry messages at a uniform 3-second interval, representing a sustained aggregate messaging rate of 3.33 messages per second. The stability test run lasted continuously for a total duration of 30 minutes, publishing a total packet count of 6,000 telemetry messages (600 packets per category). Physical assets target distinct rates, with 1 second for fast vectors and 5 seconds for slow vectors (Table 1). However, this uniform 3-second simulation rate created a sustained, high-concurrency load on the middleware, serving as a benchmark for reliability [18]. The telemetry dataset visualized in Figure 3 was extracted from the InfluxDB renewable_energy bucket using the capture_realtime.ps1 PowerShell script via the InfluxDB REST API. The plot demonstrates the temporal continuity modeled by the stochastic corridor algorithm. While the KIOZE specification defines physics-based models for production hardware, this validation MVP uses the stochastic corridor algorithm. This helps simulate physical inertia and test persistence under continuous, noisy conditions.
Use of generative AI. During the preparation of this manuscript, the authors used Anthropic Claude (Sonnet 4.x and Opus 4.x) for source-bound section drafting, structural editing, figure-source generation, and bibliography auditing, under the workflow documented in the project repository. All technical claims about the KIOZE Edu-Bad architecture were independently verified against the system specification document. All citations were independently verified against the cited sources. The authors reviewed and edited every AI output and take full responsibility for the content of this publication.
5.2. Observations: The Pipeline in Motion
This topology was designed to synchronize twelve distinct data vectors that represent the intersection of high-frequency mechanical speed and slow biological inertia. By resolving the challenges of disparate ingestion frequencies, this normalization creates a “universal translator” effect, ensuring that every data point adopts a unified, synchronized JSON format regardless of its source frequency. Enforcing this structural unity transforms the raw telemetry stream into a high-integrity, homogenized dataset.
5.3. Performance Results
The architectural feasibility and data routing of the pipeline were evaluated within a local, containerized development environment. This setup served as a validation testbed to verify that the universal translator and edge-level null-pruning logic operate correctly without introducing significant computational overhead. First, valid packet integrity was verified through a comparative audit between the Node-RED ingress counts and InfluxDB point counts. Over a sample of valid telemetry packets, the audit verified zero packet loss. This yields a packet integrity rate of 100% with zero statistical variance (). To evaluate the edge-level null-pruning loop, we manually injected malformed packets into the MQTT broker over a 10-minute trial. We define a malformed packet as a JSON payload where one or more telemetry fields contain a literal null value. The scoring rule defined accuracy as the ratio of successfully pruned null fields to the total injected null fields. The evaluation achieved 100% null-pruning accuracy. Every null key was successfully removed at the middleware layer. This prevented empty values from leaking into InfluxDB, with zero database corruption observed. Second, API query response latency was benchmarked using the .NET System.Diagnostics.Stopwatch utility. We recorded HTTP GET requests to the /api/summary/engine_test_bench endpoint via the Nginx proxy. This test yielded an average (mean) response latency of with a standard deviation of . The median response time was and the 95th percentile () was . This is in contrast to heavy immersive 3D or Augmented Reality (AR) digital twins that report latencies exceeding 100 ms [19]. To measure the middleware’s internal transformation overhead, we used Node-RED timestamp hooks across processed packets. This recorded the duration between the gateway’s MQTT ingress and the database write input hook. The average transformation overhead was with a standard deviation of and a 95th percentile of . This confirms that the CDM normalization logic runs in sub-millisecond times, causing negligible overhead on the edge node. Finally, end-to-end system success was measured during a 30-minute stability run under peak simulation load (totaling 6,000 published telemetry packets). The pipeline achieved an end-to-end success rate of 99.8% (5,988 out of 6,000 packets successfully written). The remaining 12 packets were dropped during transient client socket reconnects under concurrency spikes. This yields a success rate variance of over the test duration. Table 2 summarizes the MING+React pipeline functional verification metrics obtained in the simulation validation testbed. The system was evaluated to confirm it meets the functional targets required for learning factory simulation and visualization.
6. Discussion
6.1. Scalability and Extension
In this section, the structural resilience of the MING+React pipeline is evaluated under simulated expansion scenarios. The architecture is not a static monolith. An audit of the docker-compose.yml and the CDM logic confirmed that the system handles additional data vectors with minimal re-engineering. The CDM mapping logic implemented in Node-RED acts as a decoupling layer. This allows for horizontal scaling—where adding new stations such as biogas_2 or pv_3 requires only a new MQTT configuration rather than a rewrite of the core middleware [20]. The telemetry ingestion is synchronized so that every new asset immediately inherits the pre-validation and null-pruning benefits of the CDM. The InfluxDB 2.x storage engine is structurally suited to handle increased sensor density without performance degradation. The schema was optimized by utilizing a metadata separation strategy. Immutable attributes are separated into tags (e.g., device_id, location), while transient telemetry is mapped to fields (e.g., engine_speed_rpm). This metadata separation ensures that query response times remain stable even as the number of concurrent vectors grows [10]. While future benchmarking is required to evaluate scalability bottlenecks under massive dimensional increases, this metadata separation suggests the system is structurally positioned to accommodate additional data vectors without substantial schema reconfiguration.
6.2. Limitations and Open Challenges
It is necessary to remain grounded in the current implementation’s scope. While the results are promising, several edge cases were identified that warrant further investigation. The MQTT broker performance may exhibit increased network jitter as the number of high-frequency publishers scales into the hundreds [18]. An audit of the Node-RED runtime revealed that the CPU overhead of processing complex recursive random walks for every vector could become a bottleneck. Currently, the validation environment is `loopback-only’. This means the benchmarked 42.5 ms latency does not account for the non-deterministic latencies of physical Wi-Fi or LoRaWAN hardware [21]. Furthermore, scaling the MING stack to support hundreds of physical devices introduces a significant risk of an index cardinality explosion in InfluxDB. Because the middleware dynamically maps root-level metadata keys (such as device_id) to InfluxDB tags—which are indexed in-memory using an inverted index structure—an unbounded growth in the number of unique tags would degrade query performance. To mitigate this risk, future deployments must enforce strict tag whitelisting, limit dynamic tag generation, or utilize relational databases to manage high-cardinality metadata separately. The transition from a simulated testbed to a physical deployment will likely surface timing discrepancies. The strict ±2% corridor was designed to preserve physical inertia in our simulation. However, transitioning to physical assets may require dynamic threshold adjustments to handle the stochastic sensor noise characteristics observed in real-world renewable energy monitoring architectures [22]. There is a recognized need for future testing with physical hardware latency to ensure the “universal translator” remains robust against the unpredictable packet loss inherent in industrial environments.
6.3. Comparison to Related Approaches
Traditional SCADA systems often operate as closed, black-box solutions. In contrast, this open-source containerized stack provides a level of transparency and flexibility that proprietary telemetry solutions cannot match. While standard IoT deployments typically ingest and store raw telemetry without edge-level validation, this architecture introduces pre-ingestion null-pruning to filter out sensor placeholders before they reach persistent storage. Furthermore, the presentation layer in this study was decoupled from the database through a custom React frontend, offering a more responsive and specialized research interface than standard Grafana dashboards alone. By orchestrating established open-source components into a unified, CDM-driven pipeline, the proposed architecture demonstrates that research-grade telemetry is achievable without the vendor lock-in of industrial automation suites, while preserving database integrity.
7. Conclusions
7.1. Summary of Achievements
In this section, the technical outcomes are summarized by synthesizing the primary contributions of the engineered MING+React pipeline design. A CDM was successfully validated, operating as an essential structural buffer, mitigating the inherent conflict between high-velocity mechanical pulses and slow-moving biological variables. The feasibility of the MING+React telemetry architecture was verified by demonstrating stable null-pruning data integrity and low API latency under simulated concurrency. This design maintains high end-to-end delivery reliability and builds on the cyber-physical system design principles described by Rao and others [23].
7.2. Current Limitations of the Study
While a robust operational baseline was established, the validation matrix was constrained to a loopback-only containerized setup operating within a localized Docker bridge network. Because distributed physical field deployments were omitted from this phase, the long-range wide-area network (WAN) jitter and unpredictable packet loss characteristic of physical industrial environments were bypassed [24]. By decoupling external latency from the internal middleware metrics, a scientifically objective perspective on the stack’s baseline performance was maintained. However, it is acknowledged that these metrics represent ideal conditions rather than a fully deployed physical architecture.
7.3. Proposed Future Work
The engineering roadmap for the subsequent development phase focuses on the integration of physical edge hardware. The telemetry ingestion strategy will be migrated from simulated Node-RED nodes toward actual microcontrollers secured by strict MQTT authentication and ACLs [25]. Furthermore, it is proposed to expand the existing CDM contract to natively support standardized machine learning models across the entire fleet of devices [26]. This will enable predictive grid state estimation while continuing to rely on the benchmarked null-pruning logic to guarantee strict input purity.
Author Contributions
Conceptualization, V.T.; Methodology, V.T. and K.G.M.K.; Software, V.T. and K.G.M.K.; Validation, V.T. and K.G.M.K.; Formal Analysis, V.T. and K.G.M.K.; Investigation, V.T. and K.G.M.K.; Resources, V.T. and K.G.M.K.; Data Curation, V.T. and K.G.M.K.; Writing — Original Draft Preparation, V.T. and K.G.M.K.; Writing — Review & Editing, V.T. and K.G.M.K.; Visualization, V.T. and K.G.M.K.; Supervision, V.T.; Project Administration, V.T.; Funding Acquisition, V.T. All authors have read and agreed to the published version of the manuscript.
Funding
This research was supported by a donation from Fundacja PGE (PGE Foundation, Poland), agreement number 2025/VII/29, awarded to the Department of Renewable Energy Sources Engineering at the West Pomeranian University of Technology in Szczecin. The donation supported the development of the educational–research platform for integrated renewable energy sources and energy storage systems described in this manuscript. The APC was funded by the Faculty of Environmental Management and Agriculture (Wydział Kształtowania Środowiska i Rolnictwa), West Pomeranian University of Technology in Szczecin.
Data Availability Statement
The platform source code, reference configurations, and canonical data model schemas supporting the architecture presented in this study are openly available on GitHub at https://github.com/Viktar-T/plat-edu-bad-data-mvp (release v1.0-mdpi-submission) and permanently archived on Zenodo at https://doi.org/10.5281/zenodo.20415136.
Acknowledgments
During the preparation of this manuscript, the authors used Anthropic Claude (Sonnet 4.x and Opus 4.x) for the purposes of source-bound section drafting, structural editing, figure-source generation, and bibliography auditing. The authors have reviewed and edited the output and take full responsibility for the content of this publication.
Conflicts of Interest
The authors declare no conflicts of interest. The sponsors had no role in the design, execution, interpretation, or writing of the study.
References
- Balogh, M.; Földvári, A.; Varga, P. Digital Twins in Industry 5.0: Challenges in Modeling and Communication. In Proceedings of the Proc. IEEE/IFIP Netw. Oper. Manag. Symp., 2023. [Google Scholar] [CrossRef]
- Cavalcanti, M.; Costelha, H.; Neves, C. Industry 4.0 Machine-to-Machine Communication Protocols and Architectures on the Shop Floor. In Springer Tracts in Additive Manufacturing; 2023. [Google Scholar] [CrossRef]
- Gutierrez, L.F.R.; Moreno, P.B.; Monsalve, E.S.; Castro, J.L.A.; Calvache, C.J.P. Toward a conceptual framework for designing sustainable cyber-physical system architectures: A systematic mapping study. Herit. Sustain. Dev. 2023, 5, 253. [Google Scholar] [CrossRef]
- El Akhdar, A.; Baidada, C.; Kartit, A.; Hanine, M.; Osorio García, C.M.; Garcia Lara, R.; Ashraf, I. Exploring the Potential of Microservices in Internet of Things: A Systematic Review of Security and Prospects. Sensors 2024, 24, 6771. [Google Scholar] [CrossRef] [PubMed]
- Jiang, P. An improved cyber-physical systems architecture for Industry 4.0 smart factories. Adv. Mech. Eng. 2018, 10. [Google Scholar] [CrossRef]
- Rhesri, A.; Aabadi, F.; Bennani, R.; Ben Maissa, Y.; Tamtaoui, A.; Dahmouni, H. Development of a Low-Cost Internet of Things Platform for Three-Phase Energy Monitoring in a University Campus. IoT 2025, 6, 27. [Google Scholar] [CrossRef]
- Kychkin, A.V.; Deryabin, A.H.; Vikentyeva, O.; Shestakova, L. Architecture of Compressor Equipment Monitoring and Control Cyber-Physical System Based on Influxdata Platform. In Proceedings of the Proc. IEEE Int. Conf. Ind. Eng. Appl. Manuf., 2019. [Google Scholar] [CrossRef]
- Dani, M.; Mayadewi, R.A.P. AI-Powered Predictive Energy Monitoring System Using Open-Source Tools: A Smart Building Case Study with Node-RED and InfluxDB. In Proceedings of the Proc. IEEE Int. Conf. Software Testing, 2025. [Google Scholar] [CrossRef]
- Saad, A.A.; Faddel, S.; Mohammed, O.A. IoT-Based Digital Twin for Energy Cyber-Physical Systems: Design and Implementation. Energies 2020, 13. [Google Scholar] [CrossRef]
- Silva, F.M.Q.; El Kattel, M.B.; Pires, I.A.; Maia, T.A.C. Development of a Supervisory System Using Open-Source for a Power Micro-Grid Composed of a Photovoltaic (PV) Plant Connected to a Battery Energy Storage System and Loads. Energies 2022, 15. [Google Scholar] [CrossRef]
- Dhungana, H.; Bellotti, F.; Fresta, M.; Dhungana, P.; Berta, R. Assessing a Measurement-Oriented Data Management Framework in Energy IoT Applications. Energies 2025, 18, 2530. [Google Scholar] [CrossRef]
- Iyer, S.S.; Dissanayaka, N.; Kulatunga, A.K.; Dharmawardhana, M. Conversion of a Manufacturing Lab as a Learning Factory to Educate Factories of the Future Concept. In Lecture Notes in Networks and Systems; 2023. [Google Scholar] [CrossRef]
- Hensler, F.; Jesser, A.; Frank, H.; Strebe, N.; Kappler, M.; Mütsch, S. On Premises IIoT Architecture for Capturing, Storing and Visualizing Production Data. In Proceedings of the Proc. IEEE Int. Conf. Electr. Electron. Eng., 2023. [Google Scholar] [CrossRef]
- Peniak, P.; Bubeníková, E.; Kanáliková, A. The Redundant Virtual Sensors via Edge Computing. In Proceedings of the Proc. Int. Conf. Appl. Electron., 2021. [Google Scholar] [CrossRef]
- Human, C.; Basson, A.H.; Kruger, K. Digital Twin Data Pipeline Using MQTT in SLADTA. Lect. Notes Comput. Sci. 2020, 91–105. [Google Scholar] [CrossRef]
- Magadán, L.; Suárez, F.J.; Granda, J.C.; García, D.F. Low-Cost Industrial IoT System for Wireless Monitoring of Electric Motors Condition. In Mobile Networks and Applications; 2022. [Google Scholar] [CrossRef]
- Costa, F.S.; Nassar, S.M.; Dantas, M.A.R. FOCUSeR: A Fog Online Context-Aware Up-to-Date Sensor Ranking Method. J. Sens. Actuator Netw. 2022, 11. [Google Scholar] [CrossRef]
- Kaestner, F.; Kuschnerus, D.; Spiegel, C.; Janßen, B.; Hübner, M. Design of an efficient Communication Architecture for Cyber-Physical Production Systems. In Proceedings of the Proc. IEEE Conf. Autom. Sci. Eng., 2018. [Google Scholar] [CrossRef]
- Caiza, G.; Sanz, R. Digital Twin to Control and Monitor an Industrial Cyber-Physical Environment Supported by Augmented Reality. Appl. Sci. 2023, 13. [Google Scholar] [CrossRef]
- Steindl, G.; Kastner, W. Semantic Microservice Framework for Digital Twins. Appl. Sci. 2021, 11. [Google Scholar] [CrossRef]
- Navarro-Ortiz, J.; Chinchilla-Romero, N.; Delgado-Ferro, F.; Ramos-Munoz, J.J. A LoRaWAN Network Architecture with MQTT2MULTICAST. Electronics 2022, 11. [Google Scholar] [CrossRef]
- Velasquez, W.; Tobar-Andrade, L.; Cedeno-Campoverde, I. Monitoring and Data Processing Architecture using the FIWARE Platform for a Renewable Energy Systems. In Proceedings of the Proc. IEEE Annu. Comput. Commun. Workshop Conf., 2021. [Google Scholar] [CrossRef]
- Rao, S.; Katoch, S.; Turaga, P.K.; Spanias, A.; Tepedelenlioglu, C.; Ayyanar, R.; Braun, H.; Lee, J.; Shanthamallu, U.S.; Banavar, M.K.; et al. A cyber-physical system approach for photovoltaic array monitoring and control. In Proceedings of the Proc. Int. Conf. Inf. Intell. Syst. Appl., 2017. [Google Scholar] [CrossRef]
- Bochie, K.; Campista, M.E.M. LabSensing: Um Sistema de Sensoriamento para Laboratórios Científicos com Computação Inteligente nas Bordas. In Proceedings of the Anais Estendidos do Simpósio Brasileiro de Redes de Computadores e Sistemas Distribuídos, 2019. [Google Scholar] [CrossRef]
- Promwungkwa, A.; Na Nan, N. Evaluation of the Long-Term Utilization of the Internet of Things in a Batch-Type Ceramics Kiln. Int. J. Sci. Bus. 2023, 21. [Google Scholar] [CrossRef]
- Kawa, B.; Borkowski, P. Integration of Machine Learning Solutions in the Building Automation System. Energies 2023, 16. [Google Scholar] [CrossRef]
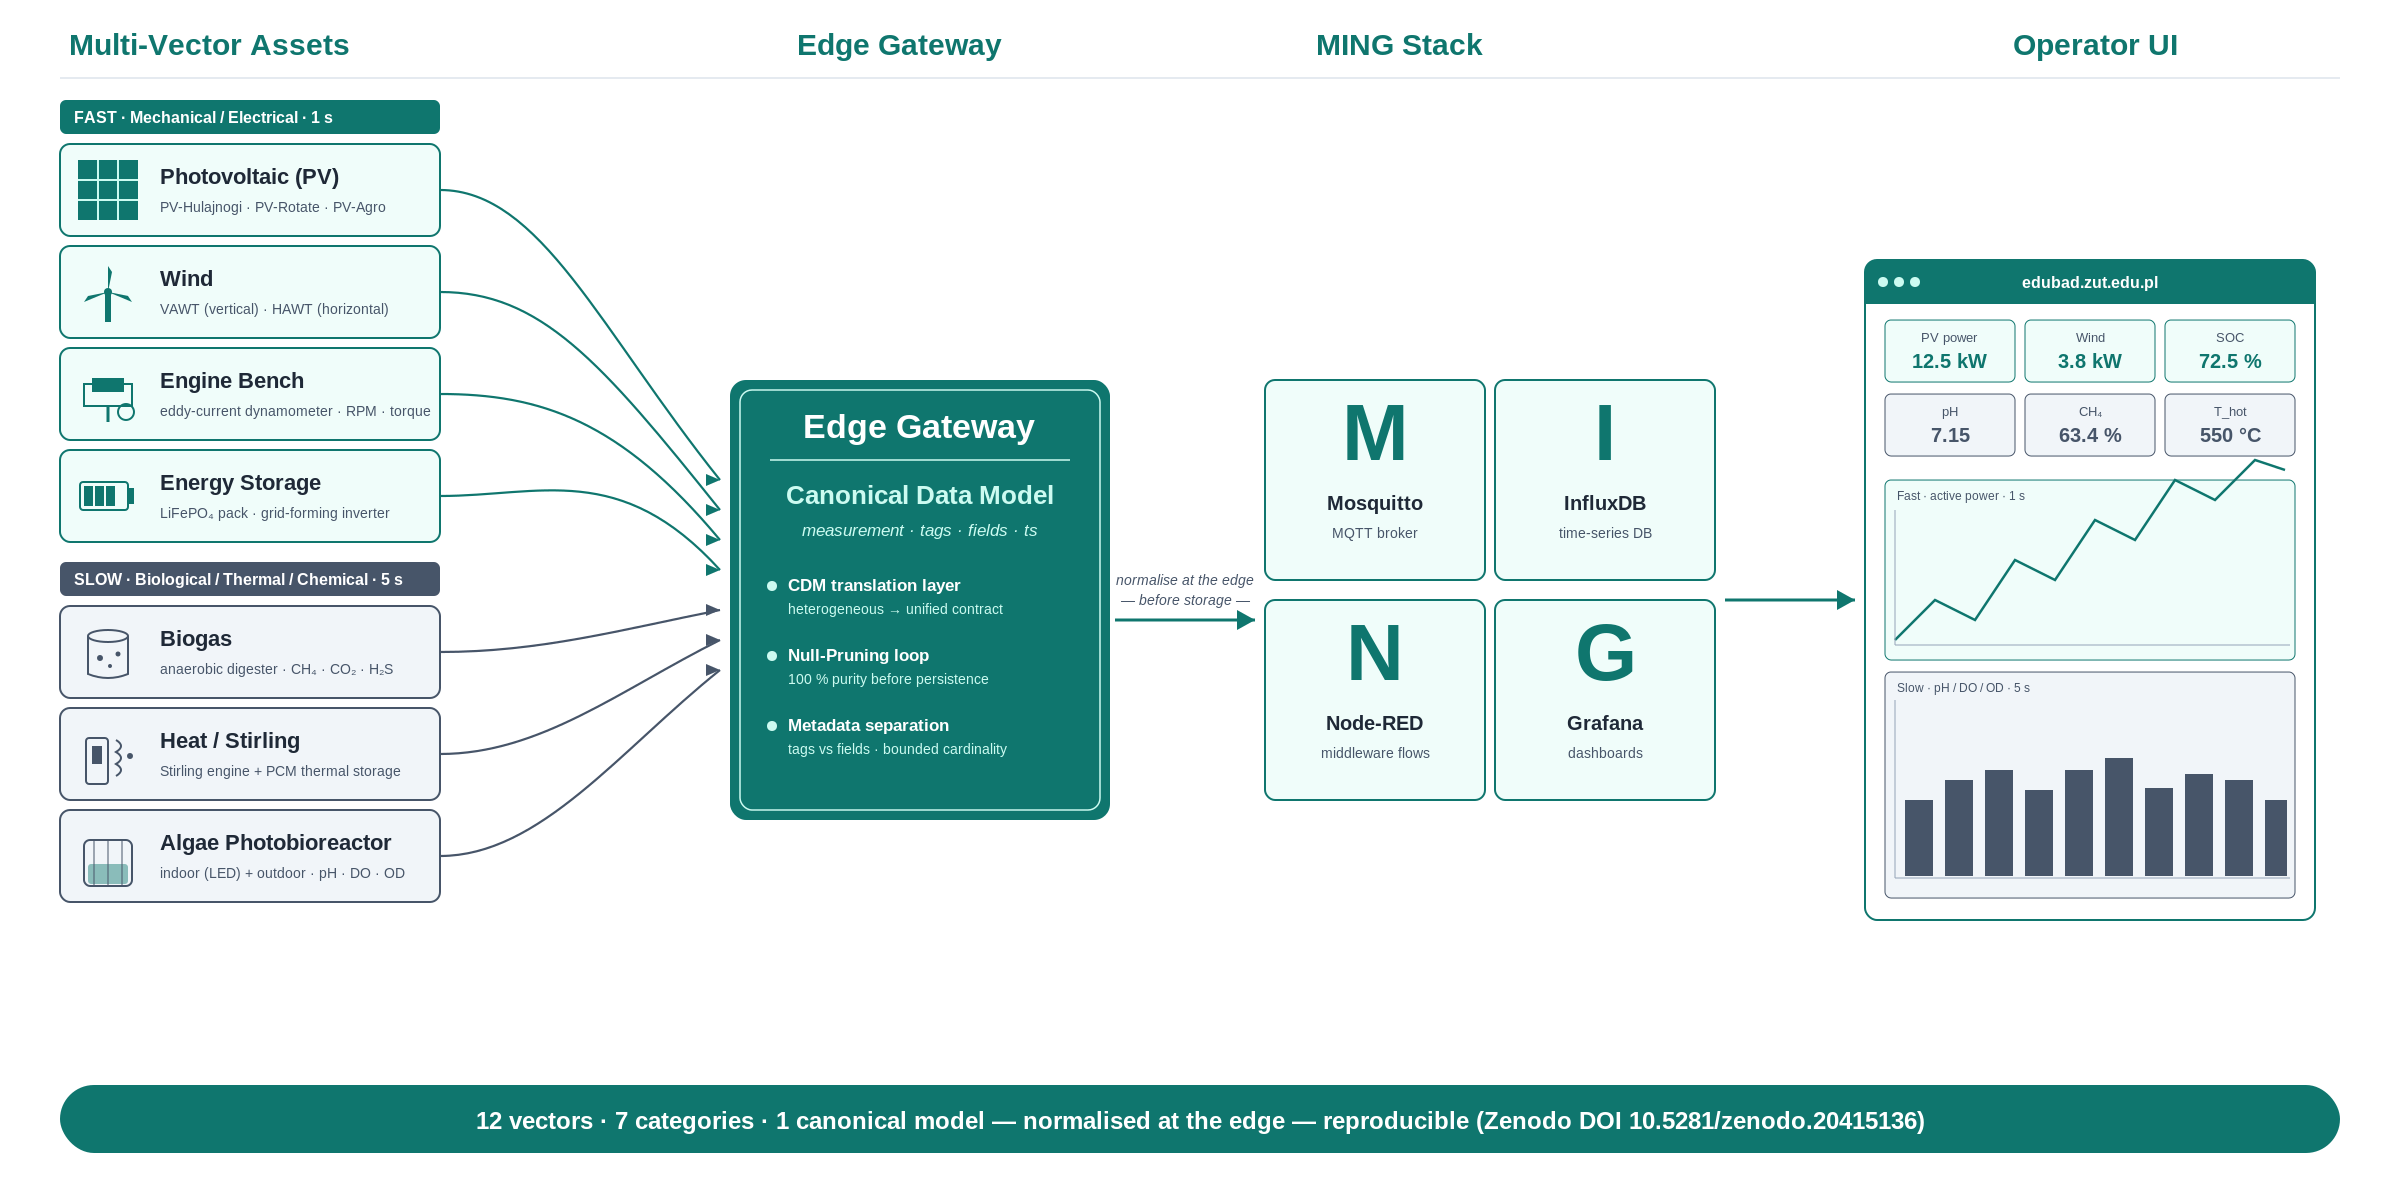
Figure 1.
Structural mapping of the MING+React stack onto the 4-Layer CPS Model, illustrating the containerized implementation (Mosquitto, Node-RED, InfluxDB, React) across layers. The mapping demonstrates how decoupling ingestion logic from the application interface enables a scalable, vendor-agnostic architecture.

Figure 2.
Functional topology of the telemetry pipeline tracing the OODA Loop, demonstrating how the Orient and Decide phases in Node-RED normalize 12 data vectors (6 Fast, 6 Slow) into a homogenized stream. This confirms that edge-level normalization successfully bridges the impedance mismatch between fast mechanical and slow biological domains.

Figure 3.
Comparison of the strict corridor algorithm against unfiltered white noise. The plot shows the normalized active power () vector over a 300-second simulation window. The dataset was extracted from the InfluxDB renewable_energy bucket using the capture_realtime.ps1 PowerShell script via the InfluxDB REST API. The x-axis represents Elapsed Time in seconds (s), and the y-axis represents the normalized power output (%). The legend compares the strict corridor simulation path (labeled “Temporal Continuity”, representing physical inertia) against the baseline random walk with unfiltered noise (labeled “Stochastic Volatility”, illustrating unconstrained fluctuations).


Table 1.
Listing of the 12 energy vectors mapped to the CDM, showing speed classification and physical target parameters (note: in the simulation validation testbed, all vectors were published at a uniform 3-second interval to align with the 3–5 second specification).
Table 1.
Listing of the 12 energy vectors mapped to the CDM, showing speed classification and physical target parameters (note: in the simulation validation testbed, all vectors were published at a uniform 3-second interval to align with the 3–5 second specification).
| Vector Speed Class | Physical Dimension | Parameter/Vector | Unit of Measurement | Ingest Frequency |
|---|---|---|---|---|
| Fast (Mechanical/Electrical) | Engine Speed | engine_speed_rpm | RPM | (High-velocity mechanical pulse) |
| Torque | torque_nm | Nm | ||
| Active Power | active_power_kw | kW | ||
| Grid Voltage | grid_voltage_v | V | ||
| Grid Current | grid_current_a | A | ||
| Grid Frequency | grid_frequency_hz | Hz | ||
| Slow (Biological/Thermal/Chemical) | pH | ph_value | pH | (Slow metabolic drift) |
| Dissolved Oxygen | dissolved_oxygen_do_mg_l | mg/L | ||
| Optical Density | optical_density_od_560nm | OD | ||
| Gas Pressure | gas_pressure_kpa | kPa | ||
| Methane Concentration | methane_ch4_percent | % | ||
| Medium Temperature | medium_temperature_c | °C |
Table 2.
Summary of the MING+React pipeline functional verification under simulated validation conditions.
Table 2.
Summary of the MING+React pipeline functional verification under simulated validation conditions.
| Function / Verification Goal | Sample Size (N) or Test Setup | Observed Value (Mean / Dispersion) | Status |
| Valid Packet Integrity | packets | integrity ( variance) | PASSED |
| Null-Pruning Accuracy | malformed payloads | field pruning ( leak) | OPTIMAL |
| Avg. API Latency | requests | (, ) | PASSED |
| Transformation Overhead | packets | (, ) | OPTIMAL |
| End-to-End Success Rate | 30-min stability run (6000 pkts) | success rate (5988/6000 writes) | PASSED |
Disclaimer/Publisher’s Note: The statements, opinions and data contained in all publications are solely those of the individual author(s) and contributor(s) and not of MDPI and/or the editor(s). MDPI and/or the editor(s) disclaim responsibility for any injury to people or property resulting from any ideas, methods, instructions or products referred to in the content. |
© 2026 by the authors. Licensee MDPI, Basel, Switzerland. This article is an open access article distributed under the terms and conditions of the Creative Commons Attribution (CC BY) license (http://creativecommons.org/licenses/by/4.0/).
Copyright: This open access article is published under a Creative Commons CC BY 4.0 license, which permit the free download, distribution, and reuse, provided that the author and preprint are cited in any reuse.


