

Submitted:
21 May 2026
Posted:
01 June 2026
You are already at the latest version
Abstract
This study provides valuable and salutary insightsabout the works on AEM Electrolysis. In the world today, most ofthe usable energy is provided by fossil fuels which can be listed asoil, natural gas and coal. However, these sources are notenvironmentally friendly and as a result, carbon emissionsoccurred. As a result, renewable energy sources such as sun, windand hydro energy are to be implemented in energy generation in amore profitable manner for the environment. In recent years,another energy source has taken a step which is hydrogen, due toits high energy density and abundancy. Hydrogen can begenerated through electrolysis method. Electrolysis method hasfour sub-methods which are proton exchange membrane waterelectrolysis (PEMWE), alkaline water electrolysis (AWE), solidoxide water electrolysis (SOWE) and anion exchange membranewater electrolysis (AEMWE). In recent years, AEMWEtechnology is a popular choice for studying due to its cost-efficientconstruction and hydrogen production capacity. In literature,several experiment studies conducted on AEMWE systems can befound however, modeling of AEMWE systems are under-developed and this creates a research gap in this area. In thisstudy, an AEMWE system is modeled through mathematicalmodeling to obtain laboratory-like result. In modeling, MATLABsoftware is implemented and several numerical methods are usedto simulate the electrolysis method behavior. As a result, the modelshowed a decent performance which is near laboratory conditions.It is anticipated that this study will contribute to the future of AEMWE Electrolysis modeling and show a useful pathway.
Keywords:
anion exchange membrane
; electrolysis
; hydrogen generation
; mathematical modeling
I. Introduction
Energy demand is increasing day by day and meeting this demand while reducing emissions of greenhouse gases is an ongoing challenge for today’s energy systems. Energy supply mostly depends on fossil fuels and energy obtained from fossil fuels is used in industry for electrical demands, which results in carbon emissions [1]. According to the report published by International Energy Agency (IEA) [2], energy demand is increased 1.3% when it compared with 2025 and in terms of carbon emissions, same report states that carbon emissions rose by 0.4%, equivalent of 38 billion tones (Gt) in 2025. Furthermore, energy demand supplied by renewable sources is sufficiently increased when it compared with last year, which is promising for future of the energy. As a result of these developments in energy sector, near-zero carbon energy solutions are becoming more urgent for more sustainable and clean energy generation. Renewable energy sources can be listed as photovoltaic (sun) energy, wind energy, geothermal energy, hydro potential and biomass [3]. In
Figure 1, the percentages of the energy demand supplied by various energy sources.
However, in recent years, another energy source has earned its place, which is hydrogen. Hydrogen is a promising renewable energy solution which plays a crucial role in solving sustainable energy generation [4]. The use of hydrogen as an alternative energy carrier is studied worldwide because hydrogen has high energy density per unit mass. Furthermore, the variety of hydrogen production techniques make hydrogen available. Moreover, the ability to use energy obtained from hydrogen in many sectors is another advantage but most importantly, the possibility of being produced by renewable energy sources makes the hydrogen popular in terms of energy generation [5]. Hydrogen is obtained a special procedure called electrolysis and electrolysis. Electrolysis is a process that separates hydrogen and oxygen in a solution. There are different electrolysis technologies, however, electrolysis technology includes four main aspects which are proton exchange membrane water electrolysis (PEMWE), solid oxide water electrolysis (SOWE), alkaline water electrolysis (AWE) and recently emerging anion exchange membrane water electrolysis (AEMWE) [6]. AWE technology has advantages of low operating cost and high operational effectiveness. In AWE technology, hydrogen purity is between 55-70% [7]. PEMWE technology on the other hand is another hydrogen production technology which uses a proton exchange membrane to separate hydrogen and oxygen [8]. High flexibility and power regulation can be considered as significant advantages of the PEMWE technology. However, one of the major disadvantages of PEMWE systems is the potential gas crossover of hydrogen and oxygen [9]. In the PEMWE systems, hydrogen purity can reach up to 99.999% in industrial water electrolysis and efficiency generally between the interval of 70-90% [10]. Unlike PEMWE and AWE technologies, SOWE electrolysis systems are considered as high temperature systems which are more suitable for industry usage. Working temperature of these systems can reach up to 600 and exceed beyond. SOWE systems’ efficiency is near 100% [11] which results in hydrogen production rate is very high as 99.999%. However, this electrolysis method requires stable power supply to work efficiently, and such relatively big electrolysis systems are more suitable for specific applications such as nuclear power plants. These reasons put SOWE systems behind other electrolysis systems [12]. AEMWE electrolysis systems can be defined as the combination of the AWE and PEMWE systems [13]. AEMWE systems use advantageous sides of both PEMWE and AWE such as working with alkaline solutions (generally 1M KOH) and membrane electrode assembly (MEA), which makes AEMWE systems more cost efficient. Furthermore, AEMWE systems can produce hydrogen with high purity at lower current densities (99.999%@1-2 A/cm2) [14]. Moreover, AEMWE systems are compatible with energy sources. Also, they can be stopped or started immediately [15]. AEMWE technology is still under development and ongoing studies are referring to promising results for future work [16]. However, despite these advantages that AEMWE electrolysis systems have, system performance is prohibited due to fundamental electrochemical losses. Theoretical electrolysis voltage is determined and not changeable as 1.229 V as open-circuit voltage of the cell, but AEMWE systems always works higher than this value. At lower current densities, voltage stays at a closer to theoretical voltage levels, however, as the current increases, ohmic losses and mass transport prevents the cell to operate at this level, resulting increase in voltage [17]. These problems explain why AEMWE systems work ideally in the voltage interval of 1.6-2.0 V [18]. Even though AEM electrolysis systems have significant advantages over other electrolysis systems, while experimental studies conducted so far provides the understanding of working behavior of AEMWE systems, absence of numerical and simulation-based studies prevents the connection between the real life and simulations. Experimental studies provide best results possible to acknowledge about a study, however, time consuming construction of the setup and limited data, especially in AEMWE systems, put experimental studies in an unwanted position [19]. The absence of studies based on simulation related with AEMWE technology creates a research gap among hydrogen studies. However, there are some studies related with other hydrogen electrolysis technologies. In article [20], a PEM Electrolyzer is modeled by using MATLAB and Simulink by using the parameters of water pump, storage tanks, and power supply. At first, general equations of a PEMWE system are determined in order to implement the MATLAB. Then, determined equations are put into MATLAB environment to develop a Simulink model. In simulink model, anode and cathode sides, voltage calculation and membrane layers are separated with the aim of the estimation to the reality. As a result, according to the authors, simulated model showed a consistent performance when it compared with real experimental datas. In Table 1, general comparison of the electrolysis systems is given.
Authors of another article [21] conducted a study on matghematical modeling of an Alkaline Electrolyzer in order to investigate the I-V characteristics of the electrolyzer on MATLAB. Same steps were used to model the electrolyzer on MATLAB environment. As a first step, general equations and constant parameters are determined to be used in the model and equations and constants are coded on MATLAB environment. In another article [22], a solid oxide electrolyzer system is modeled in order to adress various voltage losses. System is investigated in three mods: endothermics, thermoneutral and exothermic. In each mode, equations that will be used in the model is determined and coded on the MATLAB environment. Furthermore, effects of temperature and current density on voltage is discussed. According to the results, authors stated that high reaction temperature and low current density are beneficial for overpotentials and heat loss. Another study [23] introduced a PV/PEM Electrolyzer hybrid system to produce pure hydrogen. In this study, different algorithms were developed and simulated in Simulink environment. In modeling part of the study, authors firstly introduced the equations that will be used for modeling. PV and PEM Electrolyzer parts are separately given. Then, introduced system is modeled with MPP using neural networks and configurated in simukation settings. After this step, modeled system is simulated in simulink environment. According to simulation results, introduced system showed improved performance in terms of hydrogen production, showing higher hydrogen production rates at all working conditions. In literature, simulation-based studies are limited when it compared with other electrolysis systems. By introducing this study, it is anticipated that a new pathway for the future works related with AEM electroysis system will be shown and fill the research gap in the literature in the field. In this study, mathematical modeling of an AEM Electrolysis system is introduced. In the next part, fundamental equations of the system will be given. Furthermore, which mathematical modeling techniques are implemented will be discussed with reasons. Additionally, how MATLAB software is implemented to simulate different conditions and simulation results will be shared. Finally, conclusion of this study and what can be conducted in the future works will be discussed.
II. Methodology
In this section of the study, fundamental equations of a typical AEM Electrolysis system and crucial numerical method equations that are used in this study will be given. Furthermore, why these numerical method equations are applicable for this type of system will be explained in detail.
All of water electrolysis systems have anode and cathode sides. In each side different reaction occurs depend on the electrolysis technology. In the context of this study, AEM Electrolysis has equations in cathode and anode side as follows [21]:
Cathode: 2H2O + 2e-←→ 2H2(g) + 2OH-(aq) Ec0 (298K) =0
Anode: 2OH-(aq)←→ H2O + ½O2 + 2e- Ea0 (298K) = 1.229 V
Overall: H2O(l)←→ H2(g) + ½O2(g). E0rev (298K) = 1.229 V
Reversable voltage of a AEM Electrolysis cell is determined by Nernst Equation. These equations determine theoretical minimum cell voltage to run electrolysis reaction [22]:
In real life, partial pressure of hydrogen, oxygen and water vapor influence the theoretical voltage. When they are accounted for, Nernst Equation becomes:
where R is the gas constant (8.314 J*mol-1*K-1), T is the operating cell temperature (K), F is the Faraday constant (96485 J*mol-1*K-1), is the entropy change (-163 J*mol-1*K-1) and , and are the partial pressures of hydrogen, oxygen and water vapor, respectively.
Arhenius equation is used for temperature dependent current change, which characterizes the dynamic behavior of the cell. Equation is given by [23]:
where i0,ref is the reference current change (K), is the reference temperature (333.15 K) and is the activation energy of the reaction (J*mol-1). In this equation, dynamic temperature change is present, and this equation is evaluated numerically in each iteration. Butler-Volmer Equation is used for relating current density and overpotential. The equations are given by [24]:
where is the charge transfer coefficient, is the number of electrons that are transferred per mole (, activation overpotential (V). In this equation, current density changes with activation overpotential. Consequently, it cannot be rearranged to a closed form. At this point, Newton-Raphson method can be used to determine the result iteratively. The function is dependent on . So, function can be rewritten as:
Newton-Raphson method needs the first derivative of the function. As a result, first derivative of the function can be written as:
Newton-Raphson method can be applied with the given formula below:
Convergence is achieved when V. Due to quadratic convergence resulting in rapid and accurate solutions, Newton-Raphson Method is chosen for this equation in iterations.
In AEM Electrolysis, due to ion transport, ohmic resistance occurred and this resistance strongly depends on temperature. This equation can be expressed as [25]:
where is the membrane resistance at () and is the temperature sensitivity constant (K). As equation (6), since it is temperature dependent function, it needs to be solved with iterations to obtain accurate results. In the end, resultant ohmic potential can be expressed as:
Total cell voltage can be expressed with the given equation below [26]:
Another important formula to introduce is Faraday Efficiency. Faraday Efficiency represents the effectiveness of electrical charge into hydrogen production. In this study, formula is modified with empirical model as mentioned in the article [27]. By modification, Faraday efficiency formula becomes temperature dependent as it is in real life. Temperature dependent Faraday efficiency formula can be expressed as:
where is the temperature sensitivity constant and is the reference cold start temperature (K). To prevent unwanted results, a lower bound should be set. Lower bound equation can be expressed as:
This bounding process prevents Faraday efficiency to go outside the interval of , which is a physically meaningful interval for AEMWE systems.
Mass flow rates of hydrogen, oxygen and water consumption can be found through Faraday’s Law [24]:
where is the number of electrolysis cell, , and are the molar masses of hydrogen, oxygen and water, respectively and is the stoichiometric ratio of water. By using equation (16) combined with numerical rectangular integration combined, total hydrogen production can be obtained by:
where is the total number of iterations and is the simulation time (seconds).
Dynamic thermal behavior of the AEM Electrolysis system can be expressed by given equations below [28]:
where is the thermal capacitance of the cell (J*K-1). This equation does not yield a closed loop solution due to time variance term. It needs to be evaluated numerically. By using Forward Euler integration, this equation can be manipulated as:
where is the iteration number. By using this equation, advance in cell temperature can be simulated and make it efficient for simulation time that is preset. In this project, simulation time is set 4 hours initially, but longer and shorter scenarios will be studied.
Electrochemical heat generation is expressed as:
where is the thermoneutral voltage which equals to 1.48 V. This value is also a threshold for electrolysis process starts to generate heat.
Inlet and outlet mass flow rates are given by:
Heat loss towards the environment can be calculated with:
where is the convective heat transfer coefficient (W*K-1) is the ambient temperature (K).
III. Results
In this study, the effects of active area, inlet temperature of and inlet flow rate of the is investigated in simulation. Simulation setup is based on real experimental environment which has the parameters the given in the Table 2 given below.
The modeled electrolysis system is evaluated through different parameters which are the effect of temperature on current density and hydrogen generation. Other parameter is the flow rate effect of KOH to current density and hydrogen generation. Furthermore, higher heating value (HHV) and lower heating value (LHV) efficiencies are calculated as will be presented as how accurate does the proposed model is working under given conditions.
A. Temperature Effect
Temperature is the main input parameter in an electrolysis system due to the reason that in every electrolysis system, there is an interval of optimal working temperature. In this case, ideal working temperature interval of 40-80 C [29,30,31,32]. So, in the given tables below, the effect of temperature on current density and hydrogen generation are given separately and tables show that modeled system gives promising results when it compared with real life experimental data. Experimental data to be compared with are selected as [33,34,35]. In Figure 2, the current density change with respect to temperature is given. Furthermore, in Figure 3, total hydrogen production with respect to temperature is given.
Proposed electrolysis system model shown that the results were applicable with the real experimental data, especially in lower temperatures, however, after temperatures of 60 C, introduced model start to deviate to further values. This situation happens especially in temperature effect on current density. In terms of hydrogen production, proposed system shown a decent performance, 7.7 ml at 80 C in one hour, which is a realistic result when it compared with the experimental data in the literature. Furthermore, in some studies, it can be observed that results came better than this modeled system.
B. Flow Rate Effect
In theory, flow rate has no effect on either current density or hydrogen generation. This can be validated with the study [36]. Furthermore, this phenomenon is validated with this proposed electrolysis system. In the given tables below, the effect of flow rate of KOH on current density and hydrogen production can be observed, and it can be clearly seen that, flow rate has a very slightly effect on the current density and hydrogen production, however, this difference can be neglected. In Figure 4, the flow rate effect on current density is given. In Figure 5, flow rate effect on total hydrogen production is given.
As mentioned before, changing flow rate does not influence current density and hydrogen production. This phenomenon can be validated with cited experimental study before.
C. Higher Heating Value (HHV)
High heating value (HHV) can be defined as the amount of energy that is released by unit mass or volume by a fuel [37]. This parameter can be used as an efficiency parameter. This parameter includes the heat of water condensation and can be used when the water product is liquid. For this study, in Figure 6, for each temperature value, higher heating value is calculated and in the given table below.
As it can be seen from the table, HHV efficiency can be up to 71%, which is acceptable for a AEMWE system. The meaning of this can be explained as the proposed model successfully works under given conditions and according to the literature, the HHV efficiency can be up to 75% [35] and proposed model showed a near performance. Also, this parameter is more useful for AEMWE systems, especially at lower temperatures [32].
D. Lower Heating Value (LHV)
E. Polarization Curve
Polarization curve can be used to represent how an AEMWE system behaves under certain conditions. Under a four-hour simulation time, for each temperature value, polarization curves for corresponding temperatures are obtained. In Figure 8, Figure 9, Figure 10, Figure 11 and Figure 12, polarization curves for 40 C, 50 C, 60 C, 70 C and 80 C, respectively.
As it can be seen from the polarization curves, thermoneutral voltage parameter is always same due to the reason that it is obtained through mathematical equation. The maximum voltage value is limited at 2.60 V because especially in AEM Electrolysis systems, high voltage operations are avoided due to the reason that it can be very harmful for the membrane which is a very vital part of an electrolysis system. Most problems that are faced can be listed as the degradation of the membrane [41], ionomer oxidation at anode side [42], membrane thinning and gas crossover [43]. In terms of open circuit voltage, in all the simulations, open circuit voltage is consistently same and recorded as 1.51 V which is a perfect result. Furthermore, it can be clearly seen that as the temperature increases, the current increases which resulting in the increase in current density.
IV. Conclusions
To conclude everything that has been considered, in this study, mathematical modeling of an AEMWE system through MATLAB software is introduced. In this study, equations that are going to use are given and since this process needs iterations to go on, by using several numerical analysis methods such as newton-raphson method, forward euler method, trapezoidal rules, introduced equations are modified and used in the coding process of the system. System is coded through MATLAB software. Proposed system is investigated in terms of effects of two different parameters which are temperature effect and flow rate effect on current density and hydrogen production. For temperature effect, it is expected that as the temperature increases, the production and current density increases and in the simulation results, expected results are obtained. In maximum working temperature, simulated model showed a performance of 7.7 ml at 80 C, which is validated through several studies. As mentioned before, flow rate effect is also investigated. According to the simulation results and the literature studies that are used for validating the result, flow rate has nearly no effect on both hydrogen production and current density. Furthermore, in the name of calculating the efficiency of the model, lower heating value (LHV) and higher heating value (HHV) simulation is conducted. As a result of the simulation, it can be observed that at the maximum working temperature of the proposed system (80 C), a LHV efficiency of 60.37% and HHV efficiency of 71.41% values are obtained. These values are found to be acceptable when the literature is served for the validation of these values. Moreover, polarization curves of each temperature are given in separate tables. All the polarization curves for each temperature values are fit perfectly when it compared with the literature studies, and it is obtained that all the open circuit voltages are equal and calculated as 1.51V which is an applicable value for AEMWE systems. To conclude everything, simulated model shows laboratory-like results.
V. Future Works
As a future work, all the resistances such as bubble formation, ohmic resistance and contact resistances are not constant. In this study, these values are kept constant. So, in the future, a full dynamic model of these resistances can be added to the model to obtain more realistic results. Another important parameter is membrane thickness. Membranes can become narrower as the electrolysis system is under work and as the time passes, membrane thickness can be lower, which resulting in lower performance and overall efficiency. In this study, membrane thickness is not considered in the process of modeling and as a future work, the effect of membrane thickness can be added. The modeled is simulated at laboratory environment which has a temperature of 12 C, however, normal temperatures (25 C) and more hotter environment temperature scenarios are not also considered. So, in the future, this can be also added. Another important parameter can be considered in the future is the cell number. In this study, cell number is kept at one always, however, for two and more than two cells, the hydrogen production can be significantly increase when it compared with the single cell. As a result, a simulation test can be also considered for future work.
Acknowledgments
In this study, artificial intelligence help is taken in the process of debugging and arranging of the code that is used for this study.
References
- Ashraf and M. Sagheer, “Renewable energy capacity and technological innovations: A review of global trends and future directions,” Nov. 01, 2025, John Wiley and Sons Inc. [CrossRef]
- ”Global Energy Review 2026.” [Online]. Available: www.iea.org.
- S. N. Dodić, T. Z. Vasiljević, R. M. Marić, A. J. R. Kosanović, J. M. Dodić, and S. D. Popov, “Possibilities of application of waste wood biomass as an energy source in Vojvodina,” Jun. 2012. [CrossRef]
- Celebi, C. O. Colpan, and Y. Devrim, “Performance assessment of anion exchange electrolyzer with PBI-BASED membrane through 0-D modeling,” Int. J. Hydrogen Energy, vol. 143, pp. 1295–1306, Jul. 2025. [CrossRef]
- M. Humayun, E. Chikhaoui, F. Saleem, C. Wang, and M. Bououdina, “Global hydrogen economy and hydrogen technologies: A new path to economic sustainability in the era of renewable energy,” May 01, 2026, Elsevier B.V. [CrossRef]
- Y. Wang et al., “Potential technology for seawater electrolysis: Anion-exchange membrane water electrolysis,” Jul. 20, 2023, Cell Press. [CrossRef]
- Schmidt, A. Gambhir, I. Staffell, A. Hawkes, J. Nelson, and S. Few, “Future cost and performance of water electrolysis: An expert elicitation study,” Int. J. Hydrogen Energy, vol. 42, no. 52, pp. 30470–30492, Dec. 2017. [CrossRef]
- Z. Chen et al., “Advances in Oxygen Evolution Electrocatalysts for Proton Exchange Membrane Water Electrolyzers,” Apr. 01, 2022, John Wiley and Sons Inc. [CrossRef]
- P. Trinke, B. Bensmann, and R. Hanke-Rauschenbach, “Experimental evidence of increasing oxygen crossover with increasing current density during PEM water electrolysis,” Electrochem. commun., vol. 82, pp. 98–102, Sep. 2017. [CrossRef]
- S. Al-Amshawee, M. Y. B. M. Yunus, A. A. M. Azoddein, D. G. Hassell, I. H. Dakhil, and H. A. Hasan, “Electrodialysis desalination for water and wastewater: A review,” Jan. 15, 2020, Elsevier B.V. [CrossRef]
- S. Dresp et al., “Direct Electrolytic Splitting of Seawater: Activity, Selectivity, Degradation, and Recovery Studied from the Molecular Catalyst Structure to the Electrolyzer Cell Level,” Adv. Energy Mater., vol. 8, no. 22, Aug. 2018. [CrossRef]
- J. Kim et al., “Hybrid-solid oxide electrolysis cell: A new strategy for efficient hydrogen production,” Nano Energy, vol. 44, pp. 121–126, Feb. 2018. [CrossRef]
- Q. Xu et al., “Anion Exchange Membrane Water Electrolyzer: Electrode Design, Lab-Scaled Testing System and Performance Evaluation,” Sep. 01, 2022, Elsevier B.V. [CrossRef]
- S. Palmas, J. Rodriguez, L. Mais, M. Mascia, M. C. Herrando, and A. Vacca, “Anion exchange membrane: A valuable perspective in emerging technologies of low temperature water electrolysis,” Feb. 01, 2023, Elsevier B.V. [CrossRef]
- R. Abbasi et al., “A Roadmap to Low-Cost Hydrogen with Hydroxide Exchange Membrane Electrolyzers,” Advanced Materials, vol. 31, no. 31, Aug. 2019. [CrossRef]
- Y. Liu, P. Vijayakumar, Q. Liu, T. Sakthivel, F. Chen, and Z. Dai, “Shining Light on Anion-Mixed Nanocatalysts for Efficient Water Electrolysis: Fundamentals, Progress, and Perspectives,” Dec. 01, 2022, Springer Science and Business Media B.V. [CrossRef]
- N. N. M. Kamal and M. H. Azami, “Computational Modeling for Performance Characterization of Anion Exchange Membrane (AEM) Electrolyzers,” 2025, pp. 191–201. [CrossRef]
- J. Hou and M. Yang, “Green Hydrogen Production by Water Electrolysis.”.
- L. Liu, H. Ma, M. Khan, and B. S. Hsiao, “Recent Advances and Challenges in Anion Exchange Membranes Development/Application for Water Electrolysis: A Review,” Apr. 01, 2024, Multidisciplinary Digital Publishing Institute (MDPI). [CrossRef]
- T. Yigit and O. F. Selamet, “Mathematical modeling and dynamic Simulink simulation of high-pressure PEM electrolyzer system,” Int. J. Hydrogen Energy, vol. 41, no. 32, pp. 13901–13914, Aug. 2016. [CrossRef]
- S. C. Chang, R. E. Gu, and Y. H. Chan, “Parameter Analysis of Anion Exchange Membrane Water Electrolysis System by Numerical Simulation,” Energies (Basel)., vol. 17, no. 22, Nov. 2024. [CrossRef]
- W. Li, H. Tian, L. Ma, Y. Wang, X. Liu, and X. Gao, “Low-temperature water electrolysis: fundamentals, progress, and new strategies,” May 17, 2022, Royal Society of Chemistry. [CrossRef]
- N. N. S. B. M. Musa and A. S. Tijani, “Effect of exchange current density and charge transfer coefficient on performance characteristics of voltage of alkaline electrolysis,” Appl. Energy, vol. 394, Sep. 2025. [CrossRef]
- Gomez Vidales, N. C. Millan, and C. Bock, “Modeling of anion exchange membrane water electrolyzers: The influence of operating parameters,” Chemical Engineering Research and Design, vol. 194, pp. 636–648, Jun. 2023. [CrossRef]
- K. Yassin, R. Attias, Y. Tsur, and D. R. Dekel, “Identifying and Quantifying Loss Sources in Anion-Exchange Membrane Water Electrolyzers,” ACS Electrochemistry, vol. 1, no. 5, pp. 655–666, May 2025. [CrossRef]
- M. Gunuru and M. Paravada, “Mathematical modeling of an AEMWE: Investigating optimum operating conditions of an alkaline-fed AEM electrolyzer,” Int. J. Hydrogen Energy, vol. 157, Aug. 2025. [CrossRef]
- Ulleberg, “Modeling of advanced alkaline electrolyzers: a system simulation approach,” 2003. [Online]. Available: www.elsevier.com/locate/ijhydene.
- T. Adibi, A. Sojoudi, and S. C. Saha, “Modeling of thermal performance of a commercial alkaline electrolyzer supplied with various electrical currents,” International Journal of Thermofluids, vol. 13, Feb. 2022. [CrossRef]
- R. Bernat, J. Milewski, O. Dybinski, A. Martsinchyk, and P. Shuhayeu, “Review of AEM Electrolysis Research from the Perspective of Developing a Reliable Model,” Oct. 01, 2024, Multidisciplinary Digital Publishing Institute (MDPI). [CrossRef]
- V. Pushkareva, A. S. Pushkarev, S. A. Grigoriev, P. Modisha, and D. G. Bessarabov, “Comparative study of anion exchange membranes for low-cost water electrolysis,” Int. J. Hydrogen Energy, vol. 45, no. 49, pp. 26070–26079, Oct. 2020. [CrossRef]
- S. A. Lee, J. Kim, K. C. Kwon, S. H. Park, and H. W. Jang, “Anion exchange membrane water electrolysis for sustainable large-scale hydrogen production,” Jun. 01, 2022, John Wiley and Sons Inc. [CrossRef]
- M. I. Noor Azam et al., “Investigation of Performance of Anion Exchange Membrane (AEM) Electrolysis with Different Operating Conditions,” Polymers (Basel)., vol. 15, no. 5, Mar. 2023. [CrossRef]
- Vincent, E. C. Lee, and H. M. Kim, “Comprehensive impedance investigation of low-cost anion exchange membrane electrolysis for large-scale hydrogen production,” Sci. Rep., vol. 11, no. 1, Dec. 2021. [CrossRef]
- W. Ahmed, A. Dobson, S. Habibpour, and M. Fowler, “Enhanced NiFe2O4 Catalyst Performance and Stability in Anion Exchange Membrane Water Electrolysis: Influence of Iron Content and Membrane Selection,” Molecules, vol. 30, no. 15, Aug. 2025. [CrossRef]
- S. Nuggehalli Sampathkumar et al., “Combinatorial Use of Reference Electrodes and DRT for Disentangling AEM Electrolyzer Losses,” Energy and Fuels, vol. 39, no. 34, pp. 16485–16500, Aug. 2025. [CrossRef]
- V. Pushkareva, M. A. Solovyev, S. I. Butrim, M. V. Kozlova, D. A. Simkin, and A. S. Pushkarev, “On the Operational Conditions’ Effect on the Performance of an Anion Exchange Membrane Water Electrolyzer: Electrochemical Impedance Spectroscopy Study,” Membranes (Basel)., vol. 13, no. 2, Feb. 2023. [CrossRef]
- Lamy and P. Millet, “A critical review on the definitions used to calculate the energy efficiency coefficients of water electrolysis cells working under near ambient temperature conditions,” Jan. 31, 2020, Elsevier B.V. [CrossRef]
- T. H. Nufus, N. Hidayati, A. Ekayuliana, D. M. Kamal, and D. Saputra, “Analyzing the Lower Heating Value (LHV) in Urban Waste Management: Optimizing Energy Efficiency in Urban Areas,” in IOP Conference Series: Earth and Environmental Science, Institute of Physics, 2025. [CrossRef]
- S. Ha et al., “Solar-Powered AEM Electrolyzer via PGM-Free (Oxy)hydroxide Anode with Solar to Hydrogen Conversion Efficiency of 12.44%,” Advanced Science, vol. 11, no. 25, Jul. 2024. [CrossRef]
- M. I. Noor Azam et al., “Parametric Study and Electrocatalyst of Polymer Electrolyte Membrane (PEM) Electrolysis Performance,” Polymers (Basel)., vol. 15, no. 3, Feb. 2023. [CrossRef]
- N. Carboni, M. A. Navarra, S. Passerini, and J. Garche, “Durability and Degradation of Anion Exchange Membranes in Water Electrolyzers,” J. Mater. Chem. A Mater., 2026. [CrossRef]
- P. Godel, D. Eom, and S. Park, “Recent advances in Anion Exchange Membrane Water Electrolysis: catalysts, membranes, and MEA engineering,” JMST Advances, vol. 8, no. 1, pp. 9–19, Mar. 2026. [CrossRef]
- Lei et al., “Understanding and resolving the heterogeneous degradation of anion exchange membrane water electrolysis for large-scale hydrogen production,” Dec. 01, 2024, Springer. [CrossRef]
Figure 1.
Energy demand supply percentages.
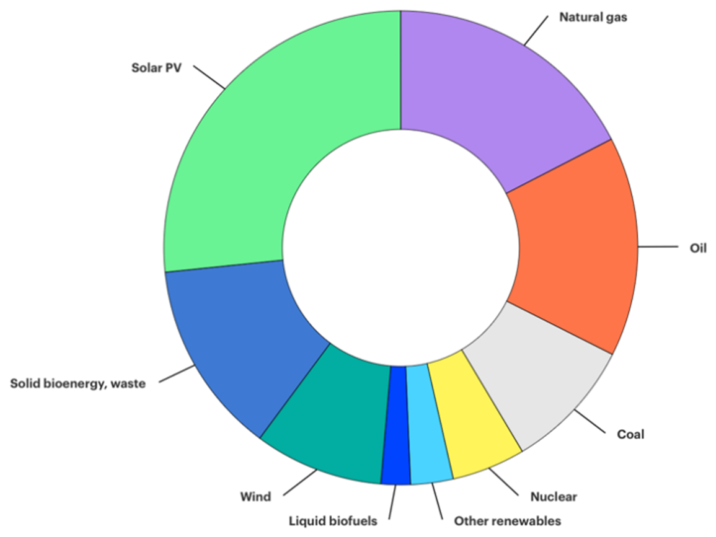
Figure 2.
Temperature effect on current density.
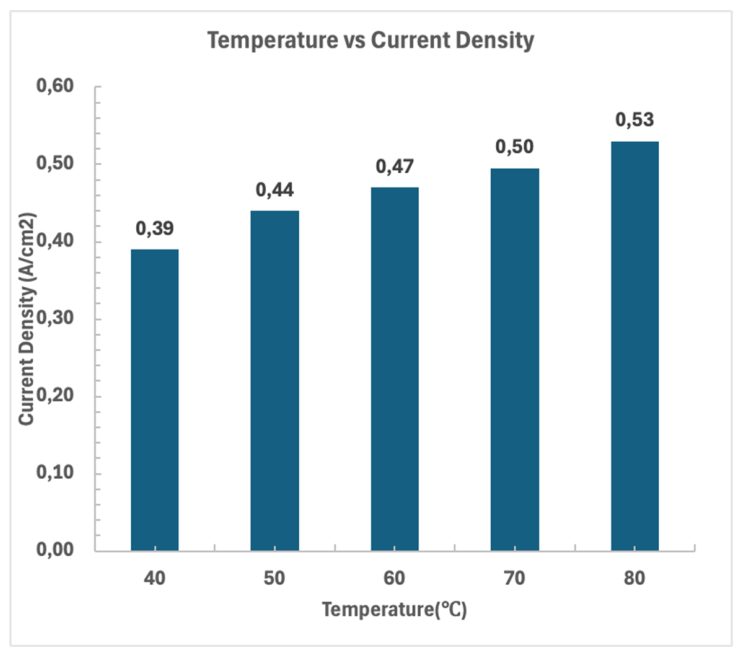
Figure 3.
Temperature effect on hydrogen production.
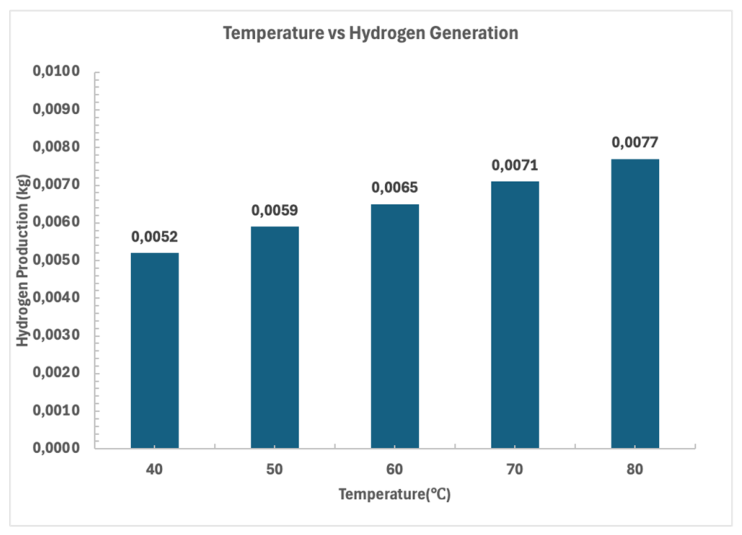
Figure 4.
Flow rate effect on current density.
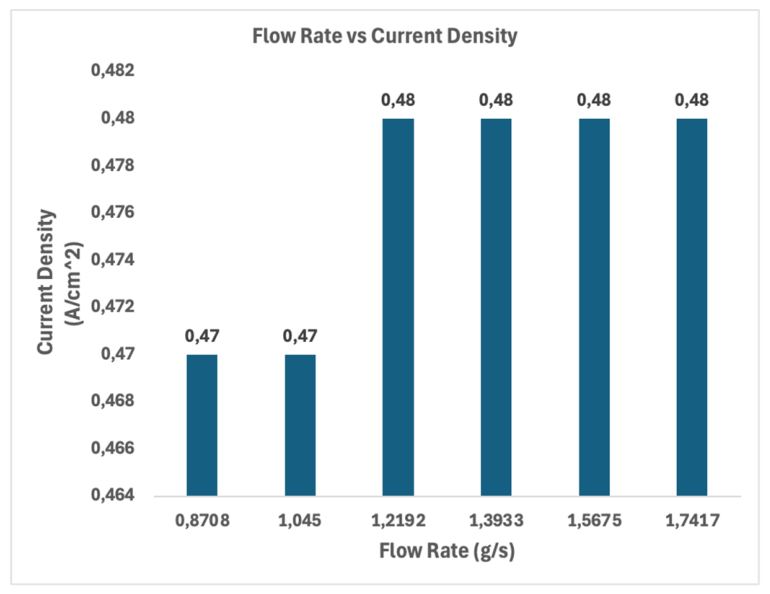
Figure 5.
Flow rate effect on hydrogen production.
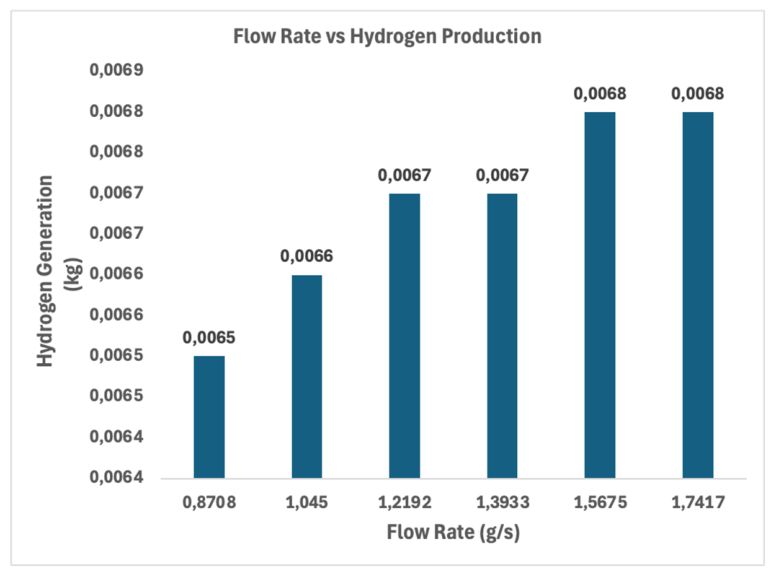
Figure 6.
Temperature effect on hydrogen production.
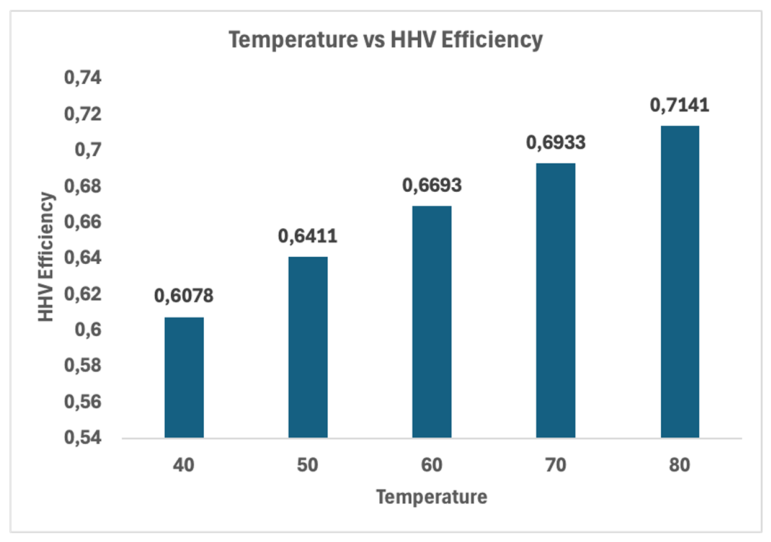
Figure 7.
Temperature effect on hydrogen production.
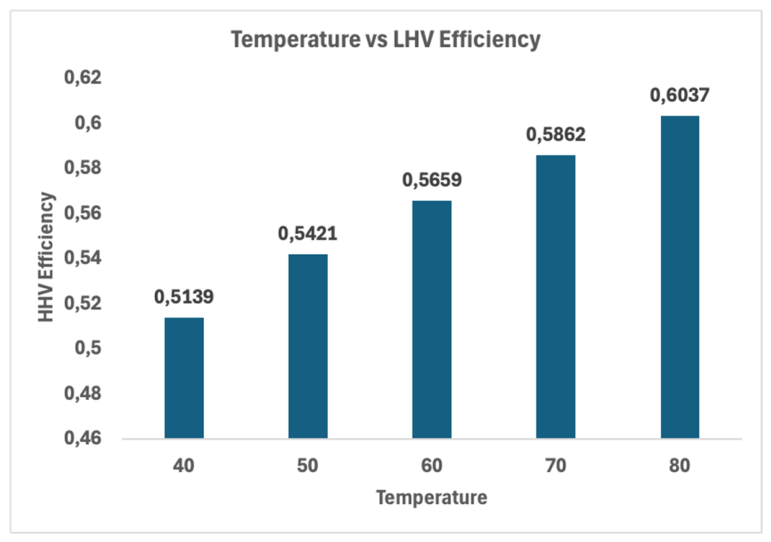
Figure 8.
Polarization curve of 40 C.
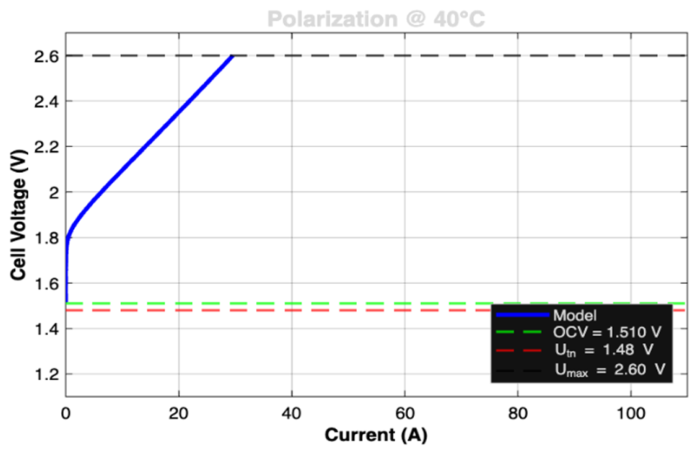
Figure 9.
Polarization curve of 50 C.
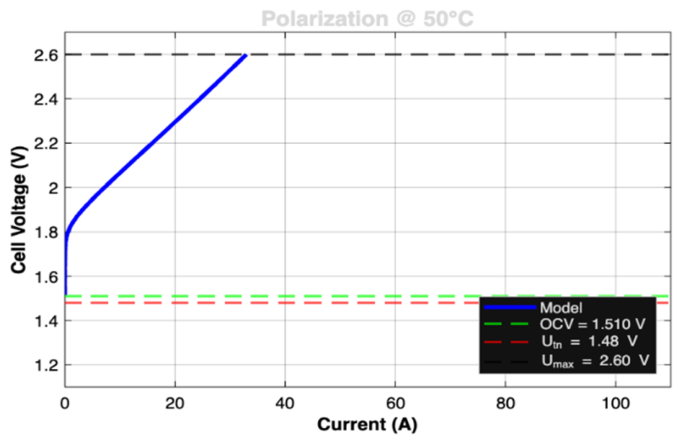
Figure 10.
Polarization curve of 60 C.
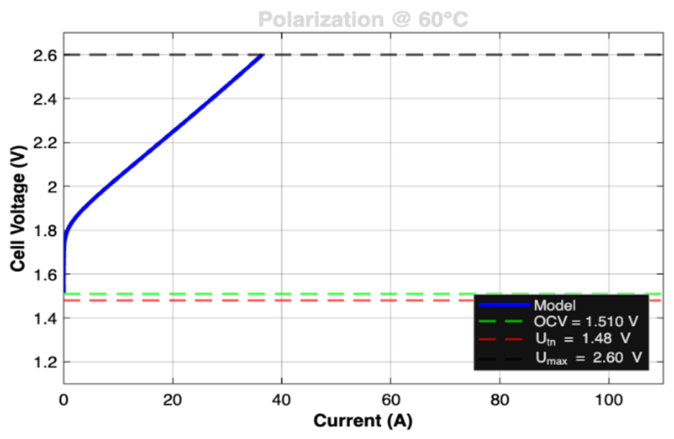
Figure 11.
Polarization curve of 70 C.
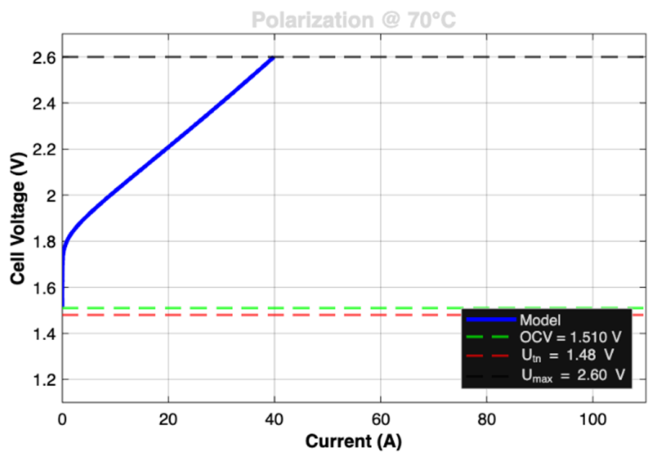
Figure 12.
Polarization curve of 80 C.
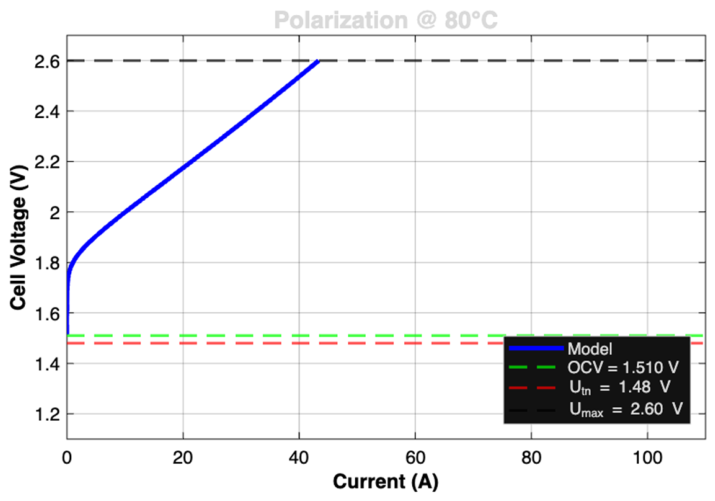

Table 1.
Comparison of the Electrolysis Systems.
| AWE | PEMWE | SOWE | AEMWE | |
| Feed | Alkaline water | Pure water | Pure water (vapor) | Alkaline or pure water |
| Electrolyte | KOH | Proton exchange membrane | Solid oxide | Anion exchange membrane |
| Operating Temperature | 70-90 | 65-85 | 600-1000 | 60-80 |
| Current Density (A/cm2) | < 0.4 | 1-2 | 8-10 | 1-2 |
| Efficiency (%) | 55-70 | 70-90 | 85-100 | 70-90 |
| Hydrogen Purity (%) | > 99.5 | > 99.99 | > 99.99 | > 99.99 |
Table 2.
Experiment Environment Conditions.
| Parameter | Ambient Temperature | Max Voltage | Pressure |
| Value | 12 C | 2.60V | 1 atm |
Disclaimer/Publisher’s Note: The statements, opinions and data contained in all publications are solely those of the individual author(s) and contributor(s) and not of MDPI and/or the editor(s). MDPI and/or the editor(s) disclaim responsibility for any injury to people or property resulting from any ideas, methods, instructions or products referred to in the content. |
© 2026 by the authors. Licensee MDPI, Basel, Switzerland. This article is an open access article distributed under the terms and conditions of the Creative Commons Attribution (CC BY) license.
Copyright: This open access article is published under a Creative Commons CC BY 4.0 license, which permit the free download, distribution, and reuse, provided that the author and preprint are cited in any reuse.


