Submitted:
23 May 2026
Posted:
01 June 2026
You are already at the latest version
Abstract
Local taxation is often examined as a technical component of public finance, but its administrative significance also depends on how citizens connect local taxes with visible public services, institutional transparency and fiscal trust. This study analyses Romania as a Central and Eastern European (CEE) case of local fiscal governance and asks how local public services, fiscal trust and tax morale shape the conditions for voluntary tax compliance. The article uses a comparative conceptual-empirical design based on a harmonized dataset for eleven CEE countries over 2014–2024. The empirical core relies on Eurostat and European Commission fiscal indicators, while Eurobarometer and WVS/QoG indicators are used contextually for trust and tax morale. The findings show that Romania is broadly aligned with the CEE average in local government revenue and expenditure, but records substantially lower values for local tax revenue as a share of Gross domestic product (GDP), total tax revenue and local government revenue. Recurrent taxes on immovable property remain relatively visible, although their fiscal weight declined over time. The article contributes by reframing local taxation as a governance relationship, showing that voluntary compliance conditions depend not only on fiscal rules or enforcement, but also on local fiscal autonomy, visible services, transparency and trust.
Keywords:
local taxation
; fiscal trust
; tax morale
; local fiscal autonomy
; local public services
1. Introduction
Local taxation is often approached as a technical component of public finance, concerned with revenue collection, fiscal decentralization and the allocation of resources across levels of government. While this perspective is necessary, it is not sufficient for understanding the administrative and institutional meaning of local taxes. Local taxation also creates a visible point of contact between citizens and local public authorities. Through local taxes, citizens may evaluate not only the fiscal obligations imposed on them, but also the quality, transparency and credibility of local governance.
This broader interpretation is particularly relevant in Central and Eastern Europe, where local governments have developed within post-socialist administrative systems marked by decentralization reforms, changing intergovernmental fiscal arrangements and uneven administrative capacity. In such contexts, the relationship between local responsibilities and local fiscal autonomy is not always straightforward. Local governments may perform visible public functions while depending substantially on transfers, shared revenues or centrally regulated fiscal instruments. Therefore, analysing local fiscal governance requires attention not only to the size of local government revenue and expenditure, but also to the structure of local revenues and the extent to which local governments rely on own tax resources (OECD, 2021; OECD, 2022).
Romania provides a relevant case for examining this issue. As a Central and Eastern European country, Romania combines visible local public responsibilities with a comparatively constrained structure of local own-source revenues. This makes it suitable for analysing how local public services, institutional transparency and fiscal trust may shape the conditions under which local taxation can be associated with voluntary tax compliance. The Romanian case is not treated here as an isolated national example, but as a case located within a broader CEE comparative framework. This regional framing allows the analysis to distinguish between country-specific patterns and wider features of local fiscal governance in post-socialist administrative settings (Gherghina & Volintiru, 2023; Plaček et al., 2020).
The article builds on the fiscal federalism and local public goods literature, which emphasizes the importance of matching local responsibilities with appropriate fiscal instruments and accountability mechanisms (Oates, 1999; Tiebout, 1956). It also draws on research concerning local fiscal autonomy, property taxation, institutional trust, tax morale and voluntary tax compliance. Property taxation is especially relevant because recurrent taxes on immovable property are territorially anchored, visible and commonly discussed as suitable local tax instruments, although they remain politically and administratively sensitive (Bahl & Bird, 2008; Mitu & Mitu, 2022; Slack & Bird, 2014). At the same time, the tax compliance literature shows that voluntary compliance cannot be explained only by enforcement, tax rates or penalties. Trust, perceived fairness, institutional legitimacy, tax morale, tax literacy and perceptions regarding the use of public revenues are also important (Appiah et al., 2024; Kirchler et al., 2008; Luttmer & Singhal, 2014; Mitu et al., 2026; OECD, 2019).
Despite these contributions, several gaps remain. First, studies of local fiscal decentralization often focus on fiscal structures, expenditure responsibilities or intergovernmental finance, without sufficiently connecting these dimensions to citizens’ perceptions of public value and fiscal trust. Second, research on tax morale and voluntary compliance often emphasizes national-level taxation or individual-level attitudes, while the local dimension of taxation receives less systematic attention. Third, in the Romanian and broader CEE context, there is still a need for research that links local fiscal autonomy, visible public services, institutional trust and tax morale within a single conceptual-empirical framework. This article addresses these gaps by examining local taxation not merely as a revenue mechanism, but as part of the wider governance relationship between citizens and local public authorities.
The research question guiding the article is the following: How do local public services, institutional transparency and fiscal trust shape the relationship between local taxation and voluntary tax compliance in Romania, considered as a Central and Eastern European case of local fiscal governance?
Accordingly, the article does not seek to measure voluntary tax compliance directly. Instead, it examines the fiscal, administrative and institutional conditions under which voluntary compliance may be strengthened. This distinction is important because the empirical analysis relies on secondary macro-level data and contextual survey-based indicators. The purpose is not to estimate causal effects, but to interpret Romania’s local fiscal governance profile in relation to local fiscal autonomy, visible public services, fiscal trust and tax morale.
The objectives of the article are fourfold. First, it develops a conceptual framework that links local taxation, visible local public services, fiscal trust, tax morale and the conditions for voluntary tax compliance. Second, it positions Romania within a selected CEE sample by using harmonized fiscal and budgetary indicators for the period 2014-2024. Third, it distinguishes between HARD fiscal indicators and SOFT contextual indicators in order to avoid treating survey-based trust and tax morale evidence as a balanced annual panel. Fourth, it discusses the implications of Romania’s local fiscal governance profile for the broader study of local taxation, public value and voluntary compliance in CEE contexts.
The article makes three main contributions. Theoretically, it connects local taxation to public value, fiscal trust and tax morale rather than treating it as a purely fiscal instrument. Methodologically, it proposes a parsimonious conceptual-empirical design that separates annual fiscal indicators from contextual trust and tax morale indicators. Empirically, it provides a comparative assessment of Romania’s position within a selected CEE group, showing how local fiscal capacity, local tax autonomy, property taxation and selected local expenditure functions can be interpreted together.
The remainder of the article is organized as follows. Section 2 reviews the literature and develops the theoretical framework, including the conceptual model and research propositions. Section 3 presents the data, indicators, operationalization and analytical strategy. Section 4 reports the empirical results for Romania in comparison with the CEE average. Section 5 discusses the findings in relation to fiscal trust, tax morale and the research propositions. Section 6 concludes by summarizing the main contributions, limitations and directions for future research.
2. Literature Review and Theoretical Framework
2.1. Local Taxation as a Relationship of Governance
Local taxation can be approached from two complementary perspectives. The first is fiscal and concerns the ability of local governments to mobilize revenue for financing public responsibilities. The second is institutional and concerns the relationship between citizens and local public authorities. In this article, we argue that the second perspective is essential, because local taxes are not only budgetary instruments. They are also visible points of contact between citizens and the local state (Cifuentes-Faura et al., 2024).
The classical literature on local public goods provides a useful starting point for this argument. Local governments are institutionally closer to citizens and may therefore be better placed to connect public services with local preferences. Tiebout’s model emphasized the link between local public services, local taxation and citizen choice, while the fiscal federalism literature later refined this argument by focusing on the allocation of functions and fiscal instruments across levels of government (Tiebout, 1956; Oates, 1999). We do not treat these models as direct descriptions of contemporary Central and Eastern European administrative systems. Rather, we use them as conceptual anchors for a broader governance problem: local responsibilities become meaningful when they are connected to adequate fiscal resources and to citizens’ perceptions that local public services generate value.
From this perspective, the institutional relevance of local taxation lies in its connection with service delivery, transparency and public value. Citizens do not evaluate local taxation only through the amount paid. They may also evaluate whether local taxes are connected to visible services, whether local institutions are transparent, and whether local authorities appear capable of transforming public revenue into public value. This interpretation is consistent with public administration research that connects government performance, citizen satisfaction and trust (Christensen & Lægreid, 2005; Van Ryzin, 2007). It is also relevant for local government systems in which formal decentralization may coexist with limited effective fiscal autonomy.
This point is particularly important in Central and Eastern Europe. In this region, decentralization and local autonomy have often been shaped by post-socialist administrative reforms, changing intergovernmental fiscal arrangements and uneven local administrative capacity. Comparative research on CEE local government has shown that decentralization reforms did not produce uniform outcomes across countries, especially when formal responsibilities were not matched by sufficient fiscal autonomy or administrative capacity (Plaček et al., 2020). Recent work on discretionary transfers and budgetary clientelism in Hungary and Romania further confirms that the relationship between central and local governments remains crucial for understanding local fiscal governance in the region (Gherghina & Volintiru, 2023). We therefore consider Romania analytically relevant not as an isolated national case, but as a CEE case in which local government responsibilities, local tax revenue and trust-related conditions can be examined together.
2.2. Fiscal Decentralization, Local Fiscal Autonomy and Own-Source Revenues
Fiscal decentralization refers to the distribution of revenue and expenditure responsibilities across levels of government. In principle, decentralization can improve responsiveness when local governments are able to provide services that reflect local needs and preferences. However, fiscal decentralization should not be assessed only through expenditure responsibilities. It must also be examined through the revenue instruments available to local authorities and through the degree to which they can rely on own-source revenues.
This distinction is central to the present article. A local government may have visible public responsibilities but limited fiscal autonomy if it depends heavily on transfers, shared taxes or centrally regulated revenue sources. The OECD’s work on fiscal federalism emphasizes that subnational finance should be assessed not only through expenditure shares, but also through the autonomy and structure of subnational revenue (OECD, 2021). The OECD World Observatory on Subnational Government Finance and Investment reinforces this perspective by treating subnational fiscal space, revenue structure, expenditure responsibilities and resilience as core elements of multi-level governance analysis (OECD, 2022). In this sense, local fiscal governance requires attention to both sides of the local public finance relationship: what local governments spend and how they finance that spending.
Own-source revenue is important because it can strengthen the link between local decision-making and local accountability. When local governments finance a meaningful part of their activities through local taxes, citizens may more clearly perceive the connection between local fiscal effort and local public services. Conversely, when local governments depend mainly on transfers or centrally controlled sources, this connection may become weaker. We do not suggest that transfers are inherently problematic. In many systems, transfers are necessary for equalization, territorial cohesion and the financing of delegated responsibilities. The problem arises when expenditure decentralization is not accompanied by sufficient local fiscal discretion, because this may weaken the perceived relationship between local taxes, local services and local public value.
For this reason, the article distinguishes between general local fiscal capacity and local tax autonomy. Local government revenue and expenditure as percentages of GDP describe the size of local public finance. The local share of general government expenditure captures the relative weight of local government within the public sector. However, these indicators do not show by themselves whether local governments have a strong own-tax base. We therefore consider it necessary to include indicators on local tax revenue as a percentage of GDP, local tax revenue as a share of total tax revenue and local tax revenue as a share of local government revenue. This combination allows the analysis to move from the general scale of local finance to the more specific question of local fiscal autonomy.
2.3. Property Taxation and the Visibility of Local Public Services
Property taxation occupies a particular position in the literature on local finance. Unlike many national taxes, recurrent taxes on immovable property are territorially anchored, relatively visible and often associated with local public services. The literature frequently treats property taxes as suitable local taxes because immovable property is difficult to relocate, the tax base is connected to local territory, and the benefits of local services may be reflected in property values (Bahl & Bird, 2008; Slack & Bird, 2014).
At the same time, property taxation is politically sensitive. Its visibility can support accountability, but it can also generate resistance when citizens do not perceive a fair connection between tax payments and service quality. We interpret this double character as one of the reasons why property taxation is especially relevant for the present article. It is not only a revenue instrument. It is also a visible fiscal signal through which citizens may assess the performance, fairness and legitimacy of local authorities.
Recent policy-oriented research has renewed interest in property taxation as a potentially underused local revenue source, while also emphasizing the administrative and political difficulties of reforming it (Grote & Wen, 2024). For Romania, recent legal-fiscal analysis confirms the relevance of distinguishing central and local dimensions of property taxation and of understanding property-related taxation through the allocation of revenue to different public budgets (Costea & Ilucă, 2024; Mitu & Mitu, 2022). These contributions are consistent with the article’s decision to treat recurrent taxes on immovable property as a specific and analytically relevant local fiscal indicator.
The visibility of local taxation matters because local fiscal trust is likely to depend on more than formal tax rules. It also depends on whether citizens can recognize the public value produced by local government. Local services such as administrative services, environmental protection, housing-related services, community amenities and the maintenance of public spaces can influence how citizens perceive local taxation. Public administration research suggests that perceptions of government performance and satisfaction with services are connected to trust, although this relationship is not automatic and may depend on institutional and political context (Christensen & Lægreid, 2005; Van Ryzin, 2007).
From this perspective, local public services represent a conceptual bridge between local taxes and fiscal trust. We do not assume that higher expenditure automatically produces higher trust. Rather, we argue that the perceived connection between local taxes and visible local services can shape the institutional conditions under which fiscal trust may emerge. This is why the empirical framework later includes selected local expenditure functions: general public services, environmental protection, and housing and community amenities. These categories do not exhaust the universe of local public services, but they capture visible and administratively meaningful areas of local government activity.
2.4. Institutional Transparency, Fiscal Trust, Tax Morale and Voluntary Compliance
Trust is a central concept in the study of public administration and tax compliance. In local fiscal governance, trust can be understood as citizens’ confidence that local authorities use public resources responsibly, provide services with reasonable effectiveness and act in a manner consistent with the public interest. Fiscal trust is more specific: it concerns the trust dimension of the fiscal relationship between taxpayers and public authorities.
Institutional transparency is closely connected to this relationship, but its role should be formulated carefully. Transparency can support accountability by making information about decisions, budgets and performance more accessible. In local government, transparency is often expected to improve responsiveness and trust. However, empirical research shows that the relationship between transparency and trust is complex and sometimes conditional on context, prior expectations and the way information is communicated (Grimmelikhuijsen et al., 2013; Porumbescu, 2015). More recent evidence reinforces this cautious interpretation. Hsu (2024) shows that the relationship between fiscal transparency and tax morale may be shaped by citizens’ perceptions of government performance and corruption. For this reason, we treat transparency as a conceptual and interpretive dimension rather than as a separate empirical indicator in the final matrix.
The relationship between trust and tax morale is also important. Tax morale refers to the intrinsic motivation to pay taxes and to comply with tax obligations beyond purely deterrence-based explanations. The tax compliance literature has shown that compliance cannot be explained only by audits, penalties and tax rates. Social norms, institutional legitimacy, trust in public authorities and perceptions of fairness also matter (Alm & Torgler, 2006; Frey & Torgler, 2007; Luttmer & Singhal, 2014; OECD, 2019). The slippery slope framework similarly distinguishes between enforced compliance, based on power and deterrence, and voluntary compliance, supported by trust and legitimacy (Kirchler et al., 2008).
Recent empirical studies continue to support this broader interpretation. Appiah et al. (2024) show that voluntary tax compliance is associated with tax knowledge, perceived tax fairness and trust in government. Mebratu (2024) similarly finds that government trust, tax knowledge, tax system fairness and perceived benefits are relevant for voluntary tax compliance, while compliance costs may weaken it. Giaccobasso et al. (2025) add an especially relevant perspective for this article by showing that taxpayers’ perceptions of how tax dollars are used can influence willingness to pay taxes in a property tax setting. Recent systematic review evidence also highlights the importance of tax literacy and tax education stakeholders for tax morale and voluntary compliance (Mitu et al., 2026). These findings strengthen the article’s conceptual assumption that fiscal trust and tax morale are partly connected to how citizens perceive the use and value of public revenues.
These considerations are essential for the article. We do not claim to measure voluntary tax compliance directly. Instead, we examine the fiscal, administrative and institutional conditions under which voluntary compliance may be supported. Local fiscal autonomy, visible public services, institutional transparency, fiscal trust and tax morale are therefore treated as connected elements of a governance framework. The argument is not that local taxes automatically produce compliance. Rather, we argue that the relationship between local taxation and compliance becomes more intelligible when local taxes are interpreted through the public value citizens perceive from local government.
In this framework, tax morale is not reduced to an individual attitude detached from institutions. It is understood as partly embedded in the institutional environment. If citizens perceive that public authorities are competent, transparent and able to convert tax revenue into meaningful services, the conditions for fiscal trust and tax morale may be stronger. If the connection between taxes and public value is weak or unclear, voluntary compliance may become harder to sustain, even when formal legal obligations remain unchanged.
2.5. Conceptual Model and Research Propositions
The theoretical framework developed above connects four analytical dimensions: local taxation, visible local public services, fiscal trust and tax morale. We do not present these dimensions as a deterministic causal chain. Instead, we consider them a conceptual pathway through which local fiscal governance can be interpreted.
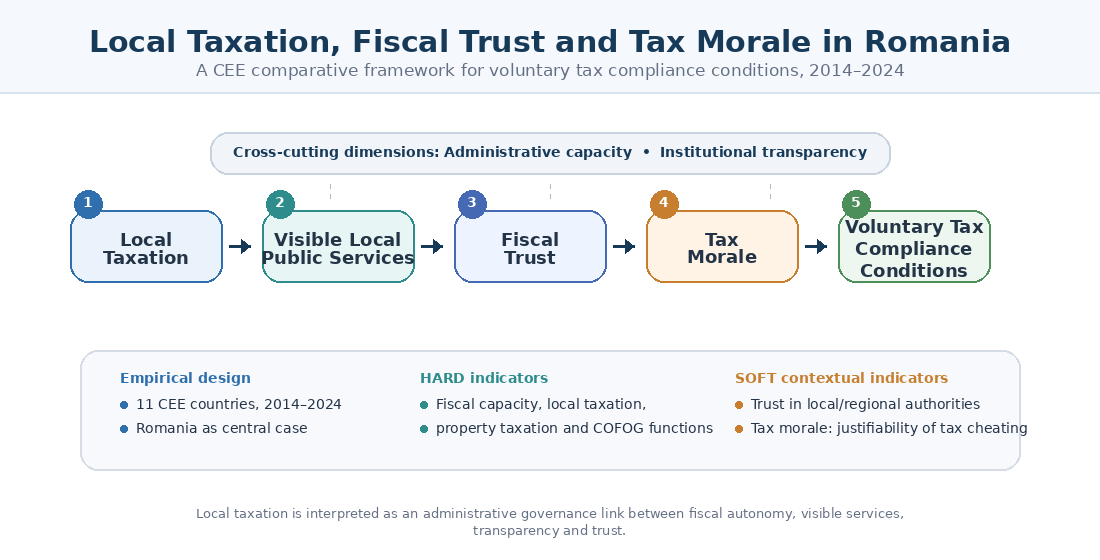
The proposed model is as follows: local taxation → visible local public services → fiscal trust → tax morale → voluntary compliance conditions.
This pathway is shaped by two institutional dimensions: administrative capacity and institutional transparency. Administrative capacity influences the ability of local governments to transform fiscal resources into services. Institutional transparency influences how citizens perceive the use of public resources and the legitimacy of local fiscal decisions.
The conceptual structure of the article is summarized in Figure 1. The model links local taxation, visible local public services, fiscal trust and tax morale to the conditions for voluntary tax compliance, while administrative capacity and institutional transparency are treated as cross-cutting dimensions of local fiscal governance.
The model has two implications. First, local taxation should not be analysed only by looking at revenue levels. It should also be connected to the visibility and perceived value of local public services. Second, voluntary compliance should not be presented as a direct outcome of local taxation. In our view, it is more appropriate to analyse the conditions under which local taxation may support fiscal trust, tax morale and compliance-oriented attitudes.
Based on this framework, the article advances the following research propositions:
- P1. Perceived quality of local public services is associated with fiscal trust.
- P2. Institutional transparency strengthens the relationship between local taxation and fiscal trust.
- P3. Fiscal trust contributes to tax morale and voluntary compliance.
- P4. Limited local fiscal autonomy may weaken the perceived connection between local taxes and local public value.
- P5. In CEE contexts, administrative capacity mediates the relationship between local fiscal resources and citizens’ willingness to comply voluntarily.
These propositions are conceptual rather than econometric hypotheses. They guide the interpretation of the empirical evidence and structure the link between the descriptive Results section and the Discussion section. In this sense, the article’s theoretical contribution lies in connecting local taxation, fiscal autonomy, visible services, institutional transparency and trust-related attitudes within a framework that explains the conditions for voluntary tax compliance
3. Materials and Methods
3.1. Research Design and Empirical Logic
The empirical design follows directly from the conceptual model developed above. The study used a comparative conceptual-empirical approach designed to connect local fiscal autonomy, visible public services, fiscal trust, tax morale and the conditions for voluntary tax compliance. The empirical component operationalized this framework through a harmonized dataset covering local government finance, local taxation, selected local expenditure functions and contextual trust-related indicators.
The study was designed as a descriptive and interpretive comparative analysis, not as an econometric test of causal effects. We considered this approach appropriate because the research question required the positioning of Romania within a Central and Eastern European framework and the interpretation of this position in relation to local fiscal governance. The purpose was not to estimate whether a specific fiscal indicator causes voluntary compliance, but to examine whether Romania’s fiscal and institutional profile is consistent with conditions that may support or weaken fiscal trust and tax morale.
Romania was treated as the central case study. The comparative sample included Bulgaria, Croatia, Czechia, Estonia, Hungary, Latvia, Lithuania, Poland, Romania, Slovakia and Slovenia. These eleven countries were selected because they form a relevant CEE reference group for analysing local public finance, fiscal decentralization and local administrative capacity. The article did not use the EU-27 aggregate as an empirical benchmark. Instead, the CEE average used in the tables and figures was calculated as the unweighted arithmetic mean of the eleven countries included in the sample. We considered this preferable because the objective was to compare Romania with peer countries, not to contrast it with a broad EU-level aggregate.
The empirical period covered 2014-2024. This interval was selected because it allowed the analysis to capture medium-term developments before, during and after major fiscal and administrative shocks affecting European public finance. For the main fiscal and budgetary indicators, annual data were collected for the entire period. For the survey-based indicators, the article used only the available survey years or waves and did not transform them into an annual balanced panel.
3.2. Data Sources and Country-Year Structure
The dataset was constructed from official, public and internationally comparable secondary sources. Local government revenue, local government expenditure and general government aggregates were taken from Eurostat gov_10a_main, which reports government revenue, expenditure and main aggregates under the ESA 2010 framework (Eurostat, 2025). Local and general government tax receipts were taken from Eurostat gov_10a_taxag, which reports detailed national accounts tax aggregates by type of tax and by subsector of general government (Eurostat, 2026a). Local expenditure by function was taken from Eurostat gov_10a_exp, which reports government expenditure according to the COFOG classification (Eurostat, 2026b).
Data on recurrent taxes on immovable property were taken from the European Commission’s Data on Taxation Trends, specifically from the property tax tables reporting recurrent taxes on immovable property as a percentage of GDP (European Commission, 2026). Contextual evidence on trust in local or regional public authorities was drawn from Standard Eurobarometer waves corresponding to 2014, 2019 and 2024 (European Commission, 2017, 2019, 2024). Evidence on the justifiability of cheating on taxes was drawn from the QoG/WVS variable wvs_jacot, based on World Values Survey data. Lower values on this scale indicate lower perceived acceptability of cheating on taxes and, by implication, stronger tax morale (The Quality of Government Institute, 2026; World Values Survey Association, 2022).
All data were organized into a common country-year-indicator structure. For each observation, the dataset retained the country, year, indicator code, indicator name, value, unit of measurement, source and analytical role. This structure allowed the article to preserve the distinction between annual fiscal indicators and survey-based contextual indicators while keeping all variables in a single traceable empirical matrix.
3.3. Indicator Matrix and Operationalization
The empirical matrix included twelve indicators. Their selection followed three criteria: relevance to the conceptual model, comparability across the selected CEE countries and analytical parsimony. Additional indicators were not retained merely to increase the empirical volume of the article. Instead, we retained only indicators that could be clearly linked to the research question and interpreted consistently within the article’s conceptual-empirical design.
The distinction between HARD and SOFT indicators is methodologically central. HARD indicators refer to harmonized fiscal and budgetary measures derived from Eurostat and European Commission datasets. They are annual, comparable across countries and used as the empirical basis of the Results section. SOFT indicators refer to survey-based contextual measures. They are not available as a balanced annual panel and are therefore used only in the Discussion section to support the interpretation of fiscal trust and tax morale.
This distinction helped to avoid two methodological risks. The first risk would have been to treat perception-based survey indicators as if they had the same annual structure and comparability as fiscal data. The second risk would have been to infer direct causal relationships between local taxation and voluntary compliance. We avoided both risks by using the HARD indicators to describe fiscal and budgetary structures and the SOFT indicators to contextualize trust-related and tax morale-related interpretations. Table 1 summarizes the final indicator matrix, including the operationalization, data sources, indicator type and analytical role of each variable.
Three indicators were calculated from source components.
Local government expenditure as a percentage of total general government expenditure was calculated as:
I03 = (local government expenditure as % of GDP / general government expenditure as % of GDP) × 100
Local government tax revenue as a percentage of total tax revenue was calculated as:
I05 = (local government tax receipts as % of GDP / general government total tax receipts as % of GDP) × 100
Local tax revenue as a percentage of local government revenue was calculated as:
I06 = (local government tax receipts as % of GDP / local government total revenue as % of GDP) × 100
These calculated indicators were necessary because direct levels alone would not fully capture the structure of local fiscal governance. I01 and I02 measured the size of local government finance relative to GDP. I03 captured the relative weight of local government within total public expenditure. I04 measured local tax revenue relative to the economy. I05 placed local tax revenue within the broader tax system. I06 was particularly relevant because it showed the extent to which local government revenue depended on local tax receipts rather than on other revenue sources, including transfers.
3.4. Analytical Procedure
The analysis proceeded in four stages. First, the dataset was checked for country coverage, time coverage, indicator consistency and missing values. This step confirmed that I01-I10 formed a balanced country-year panel for the eleven CEE countries over 2014-2024. I11 and I12 were retained in their original survey-based structure.
Second, descriptive statistics were calculated for Romania and for the CEE sample. For the HARD indicators, the analysis used means over 2014-2024, starting values, ending values and changes over time. These statistics were not treated as causal estimates, but as descriptive evidence of Romania’s relative fiscal position.
Third, Romania was compared with the CEE average. The comparison was organized around the four empirical blocks derived from the conceptual framework: fiscal capacity and decentralization; local taxation and fiscal autonomy; recurrent property taxation; and selected local public service functions. The sequence moved from the general scale of local public finance to the narrower question of local tax autonomy, then to property taxation as a visible local tax, and finally to expenditure functions that can be connected to visible local public services.
Fourth, the contextual indicators were used only in the Discussion section. Trust in local or regional public authorities was used to interpret the institutional context in which local taxation may be perceived. The justifiability of cheating on taxes was used as a cautious proxy for tax morale. We did not use these indicators to estimate annual relationships with fiscal variables, because their structure and meaning differ from the HARD indicators.
3.5. Methodological Boundaries and Limitations
The methodological boundaries of the study were clearly defined. The article did not measure voluntary tax compliance directly. Instead, it examined fiscal, administrative and institutional conditions that may support or weaken voluntary compliance. This distinction is important because the available data capture fiscal structures, public expenditure patterns and contextual attitudes, not the actual behaviour of individual taxpayers.
The article also did not estimate causal effects. The analysis was descriptive, comparative and interpretive. It compared Romania with the selected CEE sample and used the findings to discuss the relationship between local fiscal autonomy, visible public services, institutional trust and tax morale. The results should therefore be read as evidence of structural and contextual conditions, not as proof that a given level of local taxation causes a specific level of voluntary compliance.
The SOFT indicators had additional limitations. Eurobarometer data on trust were available only for selected years in the dataset, while WVS/QoG data on the justifiability of cheating on taxes were wave-based and not available annually for all countries. Their role was therefore interpretive, not explanatory in a statistical sense.
The analysis was based on secondary and aggregated data. It could not capture within-country variation across municipalities, counties or categories of taxpayers. This limitation is especially relevant for Romania, where local fiscal capacity and administrative performance may vary considerably across localities. Nevertheless, the aggregated comparative approach was appropriate for the article’s purpose, namely to position Romania within the CEE context and to interpret local taxation within the broader logic of local fiscal governance.
Finally, transparency was not retained as a separate empirical indicator. This was a methodological precaution rather than a theoretical exclusion. As explained in the theoretical framework, transparency remains relevant for understanding fiscal trust and perceived legitimacy. However, the final empirical matrix prioritized indicators with clearer comparability and more consistent territorial and temporal coverage. We consider that this choice strengthened the internal coherence of the study and reduced the risk of overstating what the available data could support
4. Results
The empirical analysis positions Romania within the selected Central and Eastern European sample by examining ten annual fiscal and budgetary indicators related to local government finance, local taxation and selected local expenditure functions. The results are structured around four analytical dimensions: fiscal capacity and decentralization, local taxation and fiscal autonomy, recurrent taxation of immovable property, and selected local public service functions.
Table 2 reports the main descriptive evidence for Romania in comparison with the CEE average over the period 2014-2024. It combines period averages, initial and final values, changes over time and Romania’s rank within the sample. This structure allows the analysis to distinguish between the general scale of local government finance and the more specific issue of local fiscal autonomy.
As Table 2 shows, Romania’s local government revenue and expenditure are relatively close to the CEE average. The most visible divergence appears not in the overall size of local government finance, but in the tax component of local government revenue. This distinction is central for interpreting Romania’s local fiscal governance profile.
4.1. Fiscal Capacity and Decentralization
Romania’s general local public finance profile is broadly aligned with the regional pattern. During 2014-2024, local government revenue averaged 9.15% of GDP in Romania, compared with 9.76% in the CEE sample. Local government expenditure averaged 9.08% of GDP in Romania and 9.69% in the CEE sample. These differences are limited and do not support interpreting Romania as an outlier in terms of the aggregate size of the local government sector.
The temporal evolution provides a more nuanced picture. Local government revenue in Romania decreased from 9.70% of GDP in 2014 to 8.90% in 2024. Over the same period, local government expenditure increased slightly, from 9.20% to 9.40% of GDP. This suggests that Romania maintained a local government finance profile close to the regional average, but without a clear consolidation of local fiscal capacity during the analysed period.
The expenditure share of local government within total general government expenditure adds an important decentralization perspective. Romania recorded an average of 24.05%, slightly above the CEE average of 22.94%. However, this indicator decreased from 25.84% in 2014 to 21.71% in 2024. The evidence therefore suggests that local government retained a meaningful role in public expenditure, but that this role became less pronounced by the end of the period.
Figure 2 illustrates these dynamics by comparing Romania with the CEE average for local government revenue, local government expenditure and the local share of total general government expenditure.
Taken together, these indicators suggest that Romania’s local government sector is not unusually small when assessed through aggregate revenue and expenditure measures. The more relevant distinction appears when the analysis moves from the size of local public finance to the structure of local tax revenue.
4.2. Local Taxation and Fiscal Autonomy
The fiscal autonomy indicators reveal a more pronounced divergence between Romania and the CEE average. Local government tax revenue averaged 0.85% of GDP in Romania during 2014-2024, compared with 1.89% of GDP in the CEE sample. This gap indicates a comparatively weaker local tax base.
A similar pattern appears when local tax revenue is assessed within the broader tax system. In Romania, local government tax revenue represented 5.07% of total tax revenue on average, compared with a CEE average of 8.35%. The indicator declined from 5.29% in 2014 to 4.71% in 2024. This evolution suggests that local taxation did not gain relative weight within the overall Romanian tax system during the analysed period.
The clearest difference concerns the share of local tax revenue in total local government revenue. Romania recorded an average of 9.34%, while the CEE average was 18.03%. In 2024, local tax revenue represented 8.99% of local government revenue in Romania, compared with 19.05% for the CEE average. This is one of the central empirical findings of the article: Romania is relatively close to the regional average in terms of local government revenue and expenditure, but substantially below the regional average in terms of the tax component of local government revenue.
Figure 3 makes this divergence visible by comparing Romania and the CEE average across the three indicators of local taxation and fiscal autonomy.
The evidence therefore points to a structural distinction between fiscal decentralization understood as expenditure responsibility and fiscal autonomy understood as reliance on own tax revenue. In Romania, local public finance has a visible expenditure dimension, but the local tax base remains comparatively limited. This finding is analytically relevant because it suggests a weaker connection between local responsibilities and local fiscal resources.
4.3. Recurrent Taxes on Immovable Property
The analysis of recurrent taxes on immovable property introduces an important nuance. Romania averaged 0.53% of GDP over 2014-2024, slightly above the CEE average of 0.49%. By this indicator, Romania ranked fourth among the eleven countries included in the sample. This result contrasts with the broader local tax revenue indicators, where Romania remained below the CEE average.
The Romanian case therefore displays a mixed profile. On the one hand, the overall local tax base is comparatively weak. On the other hand, recurrent taxes on immovable property occupy a relatively visible position in Romania’s local fiscal structure. This suggests that the weakness of local fiscal autonomy does not apply uniformly to all local tax instruments.
The trend, however, is downward. Recurrent taxes on immovable property declined in Romania from 0.64% of GDP in 2014 to 0.44% in 2024. The CEE average also decreased, from 0.55% to 0.43% of GDP. Romania thus remained close to the regional pattern, but the fiscal weight of this visible local tax instrument weakened over time.
Figure 4 places Romania’s recurrent taxes on immovable property within the broader CEE distribution and shows that Romania remained slightly above the regional average over 2014-2024.
This result should be interpreted with caution. The indicator measures the macro-fiscal weight of recurrent immovable property taxation, not citizens’ perceptions of property taxes or the administrative quality of local tax collection. Even so, it refines the interpretation of Romania’s local fiscal profile. Property taxation appears more visible than the aggregate indicators of local tax revenue would suggest, although its relative importance declined during the analysed period.
4.4. Selected Local Public Service Functions
The final empirical block examines three selected local expenditure functions: general public services, environmental protection, and housing and community amenities. These indicators do not measure service quality directly. Instead, they indicate the fiscal weight of expenditure categories that are relevant for local administrative activity and visible public services.
Romania’s local expenditure on general public services averaged 1.05% of GDP, close to the CEE average of 1.00%. It increased from 0.90% in 2014 to 1.20% in 2024. This pattern suggests that general administrative and public service functions retained a stable and slightly increasing fiscal role in Romania.
Environmental protection shows a stronger relative position. Romania averaged 0.49% of GDP, above the CEE average of 0.40%, and ranked third in the sample. The indicator increased from 0.50% in 2014 to 0.60% in 2024. This suggests that environmental protection represented a comparatively more important local expenditure function in Romania than in most countries in the sample.
Housing and community amenities also place Romania above the CEE average. Romania recorded an average of 0.86% of GDP, compared with a CEE average of 0.65%, and ranked fourth among the selected countries. The value remained stable at 1.00% of GDP in both 2014 and 2024. This indicates that housing and community amenities represented a visible area of local expenditure throughout the analysed period.
Figure 5 compares Romania and the CEE average for the three selected COFOG expenditure functions and shows that Romania is close to or above the regional average in all three cases
These findings further nuance Romania’s fiscal profile. The country is not consistently below the CEE average in visible local expenditure functions. Rather, it combines relatively visible local expenditure responsibilities with a comparatively weak local tax revenue base. This combination is central for the interpretation developed in the Discussion section.
4.5. Synthesis of Results
Taken together, Table 2 and Figure 2, Figure 3, Figure 4 and Figure 5 indicate a differentiated profile of Romanian local fiscal governance. Romania is broadly aligned with the CEE average in terms of local government revenue and expenditure as shares of GDP. It also records a slightly higher average local share in total general government expenditure, although this share decreased between 2014 and 2024.
The main divergence concerns local taxation. Romania records substantially lower values than the CEE average for local government tax revenue as a percentage of GDP, local government tax revenue as a share of total tax revenue, and local tax revenue as a share of local government revenue. This indicates a weaker local fiscal autonomy profile, even though the aggregate scale of local government finance is not unusually low.
The property tax indicator adds an important nuance. Romania is slightly above the CEE average for recurrent taxes on immovable property, but this indicator declined over time. This suggests that recurrent property taxation has relative visibility in Romania’s local fiscal structure, although its macro-fiscal weight weakened during the analysed period.
The selected local expenditure functions complete this profile. Romania is close to or above the CEE average in general public services, environmental protection, and housing and community amenities. The evidence therefore points to a structural tension: Romania has visible local expenditure responsibilities and relevant local public service functions, but a comparatively limited local tax revenue base. This tension provides the empirical basis for the Discussion section, where the results are interpreted in relation to fiscal trust, tax morale and the conditions for voluntary tax compliance
5. Discussion
The descriptive evidence presented above points to a differentiated profile of Romanian local fiscal governance. Romania is not substantially below the Central and Eastern European average in terms of the aggregate size of local government revenue and expenditure. However, it records a weaker position when local fiscal autonomy is assessed through the tax component of local government revenue. This distinction is central to the argument developed here. The Romanian case suggests that local fiscal governance cannot be evaluated only by examining the scale of local public finance. It must also be interpreted through the structure of local revenues, the visibility of local expenditure functions and the institutional conditions under which citizens may connect local taxes with local public value.
5.1. Local Fiscal Governance in Romania: A Structural Tension
The main empirical pattern is the coexistence of visible local expenditure functions and a comparatively limited local tax revenue base. Romania is close to the CEE average for local government revenue and expenditure as percentages of GDP. It is also close to or above the CEE average for the selected local expenditure functions: general public services, environmental protection, and housing and community amenities. At the same time, Romania is below the CEE average for local government tax revenue as a percentage of GDP, local tax revenue as a share of total tax revenue, and local tax revenue as a share of local government revenue.
We interpret this configuration as a structural tension within Romanian local fiscal governance. Local administrations perform visible expenditure functions, but the fiscal base directly linked to local taxation remains comparatively narrow. This does not mean that local public finance is insignificant. Rather, it suggests that local fiscal autonomy is weaker than the expenditure profile alone would indicate. In this respect, the Romanian case illustrates the difference between local fiscal decentralization understood as expenditure responsibility and local fiscal autonomy understood as reliance on own tax revenue.
This distinction is consistent with the broader fiscal federalism literature, which emphasizes that subnational finance should be assessed not only through expenditure shares, but also through the autonomy, composition and resilience of subnational revenue (OECD, 2021; OECD, 2022). A local government may have meaningful responsibilities and visible expenditure functions while still depending heavily on revenue sources that do not fully strengthen the local tax-service-accountability link. From this perspective, the Romanian pattern is analytically relevant because the institutional meaning of local taxation depends not only on how much local governments spend, but also on how much of their revenue is generated through local tax instruments.
The results on recurrent taxes on immovable property refine this interpretation. Romania is slightly above the CEE average for this indicator, which suggests that property taxation has a relatively visible role within its local fiscal structure. However, the downward trend observed between 2014 and 2024 indicates that the macro-fiscal weight of this instrument has weakened over time. This is important because property taxation is one of the local tax instruments most likely to be perceived by citizens as directly connected to local territory and local services. If its fiscal weight declines, its potential role as a visible fiscal signal may also become weaker.
5.2. Fiscal Trust and Tax Morale as Contextual Dimensions
Trust and tax morale are not treated here as annual explanatory variables. Instead, it uses them as contextual dimensions that help interpret the governance implications of the fiscal results. This is methodologically important This matters methodologically because the survey-based indicators are not available as a balanced annual panel and cannot support causal claims about the relationship between local taxation and voluntary compliance.
Table 3 presents the contextual evidence used in this section. The trust indicator reports the share of respondents expressing trust in local or regional public authorities in 2014, 2019 and 2024. The tax morale indicator reports the latest available value of the WVS/QoG variable on the justifiability of cheating on taxes, where lower values indicate lower acceptability of tax cheating and, by implication, stronger tax morale.
As shown in Table 3, Romania’s trust in local or regional public authorities increased from 39% in 2014 to 54% in 2024. This improvement is relevant, but it should not be overinterpreted. Romania remained below several CEE countries in 2024, including Slovakia, Poland, Hungary, Czechia, Latvia and Lithuania. The Romanian value therefore points to improvement, rather than to a particularly high level of local institutional trust.
Figure 6 further illustrates the evolution of trust in local or regional public authorities by comparing Romania with the CEE average for the three available reference years: 2014, 2019 and 2024.
The tax morale indicator adds another contextual layer. Romania’s latest available I12 value is 2.49, recorded in 2018. Since lower values indicate lower perceived justifiability of cheating on taxes, the Romanian value does not indicate an extremely weak tax morale position in the regional context. However, because the values refer to different survey years across countries, they should be interpreted as contextual evidence rather than as a strict cross-sectional ranking.
These contextual indicators help refine the interpretation of the fiscal findings. The results do not show that Romania lacks local expenditure visibility. They show that this visibility coexists with a limited local tax revenue base. In such a context, fiscal trust may depend less on the aggregate size of local government finance and more on whether citizens perceive a credible connection between local taxes, service quality, transparency and public value. This interpretation is consistent with the tax compliance literature, which shows that voluntary compliance is shaped not only by enforcement, but also by trust, perceived fairness, legitimacy, tax knowledge and perceptions about the use of public revenues (Appiah et al., 2024; Kirchler et al., 2008; Luttmer & Singhal, 2014; Mebratu, 2024; OECD, 2019).
The role of transparency also requires a cautious interpretation. Transparency is conceptually relevant because it can make fiscal decisions and service outcomes more visible to citizens (Mitu & Stanciu, 2018). However, it does not automatically produce trust. Recent evidence suggests that the relationship between fiscal transparency and tax morale may be shaped by perceptions of government performance and corruption (Hsu, 2024). This supports the article’s methodological choice to treat transparency as an interpretive dimension rather than as a separate empirical indicator.
5.3. Interpretation of the Research Propositions
The research propositions formulated in the theoretical framework are not treated as econometric hypotheses. They are revisited here as interpretive propositions that connect the descriptive evidence with the conceptual model of the article. Table 4 summarizes how the empirical findings and contextual indicators inform the interpretation of each proposition.
The interpretation of P1 is necessarily cautious. The article does not measure perceived service quality directly. However, Romania’s position in selected local expenditure functions suggests that local public services represent a meaningful fiscal dimension. The increase in trust in local or regional authorities provides contextual support for the proposition that local service visibility and fiscal trust may be connected, but the available data do not allow a direct assessment of perceived quality.
P2 remains conceptually important, although it was not directly operationalized as an empirical indicator. This does not weaken the theoretical argument, but it does define a limitation of the final dataset. Transparency is relevant for fiscal trust because it shapes how citizens access and interpret information about budgets, taxes and services. Nevertheless, the article avoids overstating this relationship because transparency indicators with sufficiently consistent CEE coverage were not retained.
P3 can be discussed at the level of interpretation, not causal testing. The contextual indicators suggest that fiscal trust and tax morale can be discussed together, but they do not allow the article to claim that trust directly determines voluntary compliance. The literature supports this conceptual link, but the empirical design of this article is not behavioural and does not measure compliance decisions at the individual level.
P4 receives the strongest descriptive support. Romania’s local tax revenue indicators are substantially below the CEE average, especially when local tax revenue is measured as a share of local government revenue. This indicates that the fiscal connection between local taxes and local public finance is comparatively weak. From the perspective of local public value, this may reduce the visibility of the tax-service relationship and weaken the conditions under which local taxation supports trust.
P5 is conceptually plausible, but it cannot be tested directly with the available data. The selected COFOG indicators show that Romania has visible local expenditure responsibilities, but administrative capacity is not measured at the municipal or county level. The proposition therefore remains relevant as an interpretive bridge between local fiscal resources, service delivery and compliance-oriented attitudes. Future research would need local-level administrative data, survey evidence and behavioural indicators to assess this relationship more directly.
5.4. Implications for Local Fiscal Governance in CEE
The Romanian case also has broader implications for the study of local fiscal governance in Central and Eastern Europe. First, it shows that local fiscal decentralization should not be assessed only by looking at the scale of local expenditure. A country may have visible local expenditure responsibilities while still displaying limited local fiscal autonomy. This distinction is important for CEE countries, where local governments may perform significant administrative functions but remain dependent on revenue structures shaped by central fiscal arrangements.
Second, the findings suggest that local tax autonomy matters for the governance meaning of local taxation. When local tax revenue represents a small share of local government revenue, citizens may find it more difficult to perceive a direct connection between local taxes and local public value. This does not mean that transfers or shared revenues are undesirable. They may be necessary for redistribution, equalization and territorial cohesion. However, a weak local tax base may reduce the accountability potential of local taxation and limit its role in strengthening fiscal trust.
Third, the Romanian case highlights the specific relevance of property taxation. Recurrent taxes on immovable property are more visible in Romania than the broader local tax revenue indicators would suggest, but their fiscal weight declined during 2014-2024. This creates a policy-relevant tension. Property taxation may serve as a visible local fiscal instrument, yet its contribution to local fiscal autonomy may remain limited if its macro-fiscal weight decreases or if citizens do not perceive a credible link between property taxes and local services.
Fourth, the findings suggest that visible local services should be interpreted together with institutional trust and tax morale. Romania’s selected local expenditure functions are close to or above the CEE average, while trust in local or regional authorities improved between 2014 and 2024. This does not prove that higher expenditure produces trust. It suggests instead that local public services may provide the institutional setting in which fiscal trust and tax morale can be strengthened, especially if citizens perceive transparency, fairness and administrative competence.
In our view, the discussion supports the article’s central claim that local taxation should be interpreted as a governance relationship rather than as a purely fiscal mechanism. Romania’s case shows that the conditions for voluntary tax compliance are not determined only by tax rules, rates or enforcement. They also depend on whether local taxes are embedded in a credible relationship between fiscal autonomy, visible public services, institutional transparency and trust. This interpretation is consistent with recent evidence showing that taxpayers’ willingness to comply may be influenced by trust in government, perceived fairness and perceptions of how public revenues are used (Appiah et al., 2024; Giaccobasso et al., 2025; Mebratu, 2024).
6. Conclusions
This research sought to analyse how local public services, institutional transparency and fiscal trust may shape the conditions under which local taxation can be associated with voluntary tax compliance in Romania, considered as a Central and Eastern European case of local fiscal governance. Rather than treating local taxes only as instruments of revenue collection, the study approached them through their administrative and institutional link with citizens and local public authorities.
The main conclusion is that Romania displays a differentiated local fiscal governance profile. At the aggregate level, Romania is broadly aligned with the CEE average for local government revenue and expenditure as shares of GDP. The local government sector is therefore not unusually small when assessed through the general scale of local public finance. However, the picture changes when the analysis focuses on local taxation and fiscal autonomy. Romania records substantially lower values than the CEE average for local government tax revenue, for the share of local government tax revenue in total tax revenue, and especially for local tax revenue as a share of local government revenue. This indicates that Romania’s local public finance has a visible expenditure dimension, but a comparatively limited own-tax base.
This pattern is central to the article’s contribution. We argue that the Romanian case illustrates a structural tension between local expenditure responsibilities and local fiscal autonomy. Local governments perform visible expenditure functions, including general public services, environmental protection, and housing and community amenities, while the revenue base directly linked to local taxation remains comparatively weak. This tension may reduce the perceived connection between local taxes and local public value, especially if citizens do not clearly associate local tax payments with service outcomes, institutional transparency and administrative performance.
The analysis of recurrent taxes on immovable property adds an important nuance. Romania is slightly above the CEE average for this indicator, which suggests that property taxation retains a visible role in the local fiscal structure. At the same time, its macro-fiscal weight declined between 2014 and 2024. This indicates that property taxation may remain institutionally relevant as a local fiscal instrument, but its contribution to strengthening local fiscal autonomy should not be overstated. In policy terms, this points to the need for careful reform rather than simple tax expansion. Property taxation can support accountability only when it is administratively credible, socially understandable and visibly connected to local public services.
The contextual indicators on trust and tax morale require a cautious interpretation of the governance dimension. Trust in local or regional public authorities increased in Romania between 2014 and 2024, but this improvement does not by itself demonstrate a direct link between local taxation and voluntary compliance. Similarly, the tax morale indicator provides useful contextual evidence, but it cannot be treated as an annual panel measure or as behavioural proof of compliance. For this reason, the article does not claim that local taxation determines voluntary compliance. Rather, it argues that local fiscal autonomy, visible public services, institutional transparency and fiscal trust shape the conditions under which voluntary compliance may be strengthened.
The article contributes theoretically by integrating fiscal decentralization, local fiscal autonomy, public service visibility, trust and tax morale into a single conceptual-empirical framework. This approach strengthens the administrative interpretation of local taxation without reducing it to a revenue instrument alone. The article also contributes methodologically by distinguishing between HARD fiscal indicators and SOFT contextual indicators. This distinction helps avoid overstating what the data can support and provides a clearer structure for interpreting Romania’s position within the CEE context.
The policy implications follow directly from this interpretation. Strengthening local fiscal governance in Romania does not require only increasing local revenues. It also requires improving the credibility of the link between local taxes and local public value. This implies clearer communication about how local revenues are used, stronger budget transparency, better administrative capacity and a more visible connection between local fiscal effort and service delivery. Transfers and shared revenues remain important for territorial cohesion and equalization, but they cannot fully substitute for a credible local tax-service relationship.
Several limitations should be acknowledged. It relies on secondary and aggregated data and therefore cannot capture variation across municipalities, counties or categories of taxpayers. It does not measure service quality directly, nor does it measure actual voluntary tax compliance at the individual level. The trust and tax morale indicators are contextual and survey-based, not annual balanced panel indicators. Transparency was treated conceptually and interpretively, not as a separate empirical variable, because no sufficiently consistent CEE-wide transparency indicator was retained in the final matrix.
Future research should address these limitations by combining macro-comparative fiscal indicators with local-level administrative data and citizen survey evidence. For Romania, future studies could examine differences between municipalities and counties in local tax collection, service quality, transparency practices and citizens’ willingness to comply voluntarily. Comparative CEE research could also test whether similar structural tensions exist in other post-socialist local government systems. Such work would help clarify how local fiscal autonomy, administrative capacity and perceived public value interact in shaping fiscal trust and tax morale.
Overall, the findings suggest that the relationship between local taxation and voluntary compliance cannot be understood only through fiscal rules, tax rates or enforcement mechanisms. In Romania, as in other CEE contexts, the more relevant question is whether local taxes are embedded in a credible local governance relationship. From this perspective, voluntary compliance is more likely to be supported when citizens can perceive those local taxes finance visible services, that local institutions act transparently and competently, and that fiscal obligations are connected to local public value.
Supplementary Materials
The following supporting information can be downloaded at: https://www.mdpi.com/article/doi/s1,s2,s3 Supplementary File S1: local_taxation_CEE_master_I01_I12_2014_2024.xlsx; Supplementary File S2: local_taxation_CEE_descriptive_tables_I01_I12.xlsx; Supplementary File S3: local_taxation_CEE_figures_I01_I12.xlsx.
Author Contributions
Conceptualization, N.E.M. and G.T.M.; methodology, N.E.M. and G.T.M.; software, G.T.M.; validation, N.E.M.; formal analysis, N.E.M. and G.T.M.; investigation, N.E.M.; resources, N.E.M. and G.T.M.; data curation, N.E.M. and G.T.M.; writing—original draft preparation, G.T.M.; writing—review and editing, N.E.M.; visualization, N.E.M. and G.T.M.; supervision, N.E.M.; project administration, N.E.M. All authors have read and agreed to the published version of the manuscript.
Funding
This research received no external funding.
Institutional Review Board Statement
Not applicable.
Informed Consent Statement
Not applicable.
Data Availability Statement
The data used in this study are derived from publicly available sources cited in the manuscript. The consolidated dataset and descriptive tables are proposed as supplementary materials.
Conflicts of Interest
The authors declare no conflicts of interest.
Abbreviations
The following abbreviations are used in this manuscript:
| CEE | Central and Eastern Europe |
| COFOG | Classification of the Functions of Government |
| ESA 2010 | European System of Accounts 2010 |
| EU-27 | European Union, 27 Member States |
| GDP | Gross Domestic Product |
| GF01 | COFOG function: General public services |
| GF05 | COFOG function: Environmental protection |
| GF06 | COFOG function: Housing and community amenities |
| HARD indicators | Harmonized annual fiscal and budgetary indicators used as the empirical basis of the Results section |
| SOFT indicators | Survey-based contextual indicators used for interpretive purposes in the Discussion section |
| I01–I12 | Indicator codes used in the empirical matrix |
| QoG | Quality of Government |
| WVS | World Values Survey |
| WVS/QoG | World Values Survey variable as reported through the Quality of Government data infrastructure |
| gov_10a_main | Eurostat dataset: Government revenue, expenditure and main aggregates |
| gov_10a_taxag | Eurostat dataset: Main national accounts tax aggregates |
| gov_10a_exp | Eurostat dataset: General government expenditure by function |
| OECD | Organisation for Economic Co-operation and Development |
References
- Alm, J., & Torgler, B. (2006). Culture differences and tax morale in the United States and in Europe. Journal of Economic Psychology, 27(2), 224‐246. [CrossRef]
- Appiah, T., Domeher, D., & Agana, J. A. (2024). Tax knowledge, trust in government, and voluntary tax compliance: Insights from an emerging economy. SAGE Open, 14(2). [CrossRef]
- Bahl, R. W., & Bird, R. M. (2008). Subnational taxes in developing countries: The way forward. Institute for International Business Working Paper No. 16. [CrossRef]
- Christensen, T., & Lægreid, P. (2005). Trust in government: The relative importance of service satisfaction, political factors, and demography. Public Performance & Management Review, 28(4), 487‐511. Available online: https://www.tandfonline.com/doi/pdf/10.1080/15309576.2005.11051848. [CrossRef]
- Cifuentes‐Faura, J., Benito, B., & Guillamón, M.‐D. (2024). The influence of transparency on municipal taxation: An empirical analysis. Administration & Society, 56(5), 653–682. [CrossRef]
- Costea, I. M., & Ilucă, D.‐M. (2024). Central and local fiscal jurisdiction in Romania: A taxonomy of property taxation. Financial Law Review, 34(2), 1‐22. [CrossRef]
- European Commission. (2017). Eurobarometer 81.2: Europeans in 2014, financial and economic crisis, European citizenship, and European values, March 2014. GESIS & ICPSR. [CrossRef]
- European Commission. (2019). Standard Eurobarometer 91: Public opinion in the European Union, Spring 2019. Publications Office of the European Union. Available online: https://data.europa.eu/doi/10.2775/718901.
- European Commission. (2024). Standard Eurobarometer 101: Spring 2024. Available online: https://europa.eu/eurobarometer/surveys/detail/3216 (accessed on 22 May 2026).
- European Commission. (2026). Data on taxation trends. Directorate‐General for Taxation and Customs Union. Available online: https://taxation-customs.ec.europa.eu/taxation/economic-analysis/data-taxation-trends_en (accessed on 22 May 2026).
- Eurostat. (2025). Government revenue, expenditure and main aggregates (gov_10a_main) [Data set]. Available online: https://ec.europa.eu/eurostat/databrowser/view/gov_10a_main/default/table (accessed on 22 May 2026).
- Eurostat. (2026a). Main national accounts tax aggregates (gov_10a_taxag) [Data set]. Available online: https://ec.europa.eu/eurostat/databrowser/view/gov_10a_taxag/default/table (accessed on 22 May 2026).
- Eurostat. (2026b). General government expenditure by function (COFOG) (gov_10a_exp) [Data set]. Available online: https://ec.europa.eu/eurostat/databrowser/view/gov_10a_exp/default/table (accessed on 22 May 2026).
- Frey, B. S., & Torgler, B. (2007). Tax morale and conditional cooperation. Journal of Comparative Economics, 35(1), 136‐159. [CrossRef]
- Gherghina, S., & Volintiru, C. (2023). Budgetary clientelism and decentralization in Hungary and Romania. Journal of Developing Societies, 39(1), 40‐62. [CrossRef]
- Giaccobasso, M., Nathan, B. C., Perez‐Truglia, R., & Zentner, A. (2025). Where do my tax dollars go? Tax morale effects of perceived government spending. American Economic Journal: Applied Economics, 17(4), 223‐259. [CrossRef]
- Grimmelikhuijsen, S., Porumbescu, G., Hong, B., & Im, T. (2013). The effect of transparency on trust in government: A cross‐national comparative experiment. Public Administration Review, 73(4), 575‐586. [CrossRef]
- Grote, M., & Wen, J.‐F. (2024). How to design and implement property tax reforms. IMF How‐To Notes, 2024(006). International Monetary Fund. [CrossRef]
- Hsu, H.‐Y. (2024). Fiscal transparency and tax morale: Is the relationship shaped by perceptions of government performance and corruption? International Review of Administrative Sciences, 90(3), 563‐580. [CrossRef]
- Kirchler, E., Hoelzl, E., & Wahl, I. (2008). Enforced versus voluntary tax compliance: The slippery slope framework. Journal of Economic Psychology, 29(2), 210‐225. [CrossRef]
- Luttmer, E. F. P., & Singhal, M. (2014). Tax morale. Journal of Economic Perspectives, 28(4), 149‐168. [CrossRef]
- Mebratu, A. A. (2024). Theoretical foundations of voluntary tax compliance: Evidence from a developing country. Humanities and Social Sciences Communications, 11, Article 443. [CrossRef]
- RMitu, N. E., & Mitu, G. T. (2022). Reforming the property tax system in Romania: A necessity. Revista de Științe Politice. Revue des Sciences Politiques, 73, 99‐113. Available online: https://cis01.ucv.ro/revistadestiintepolitice/files/numarul73_2022/10.pdf (accessed on 22 May 2026).
- Mitu, N. E., Mitu, G. T., & Zglavoci, M. (2026). Stakeholders in tax literacy and tax education in the European Union: Schools, communities, and public institutions in relation to tax morale and voluntary tax compliance: A systematic review. Social Sciences, 15(4), Article 256. [CrossRef]
- Mitu, N. E., & Stanciu, C. (2018). Tax principles between theory, practice and social responsibility. In S. O. Idowu, C. Sitnikov, D. Simion, & C. G. Bocean (Eds.), Current issues in corporate social responsibility (pp. 11–24). Springer. [CrossRef]
- Oates, W. E. (1999). An essay on fiscal federalism. Journal of Economic Literature, 37(3), 1120‐1149. [CrossRef]
- OECD. (2019). Tax morale: What drives people and businesses to pay tax? OECD Publishing. [CrossRef]
- OECD. (2021). Fiscal federalism 2022: Making decentralisation work. OECD Publishing. [CrossRef]
- OECD. (2022). 2022 Synthesis Report World Observatory on Subnational Government Finance and Investment. OECD Publishing. [CrossRef]
- Plaček, M., Ochrana, F., Půček, M. J., & Nemec, J. (2020). Fiscal decentralization reforms: The impact on the efficiency of local governments in Central and Eastern Europe. Springer. [CrossRef]
- UPorumbescu, G. A. (2015). Using transparency to enhance responsiveness and trust in local government: Can it work? State and Local Government Review, 47(3), 205‐213. [CrossRef]
- Slack, E., & Bird, R. M. (2014). The political economy of property tax reform. OECD Working Papers on Fiscal Federalism, No. 18. OECD Publishing. [CrossRef]
- The Quality of Government Institute. (2026). QoG Data: wvs_jacot, Justifiable: Cheating on taxes. University of Gothenburg. Available online: https://datafinder.qog.gu.se/variable/wvs_jacot (accessed on 21 May 2026).
- Tiebout, C. M. (1956). A pure theory of local expenditures. Journal of Political Economy, 64(5), 416‐424. [CrossRef]
- Van Ryzin, G. G. (2007). Pieces of a puzzle: Linking government performance, citizen satisfaction, and trust. Public Performance & Management Review, 30(4), 521‐535. [CrossRef]
- World Values Survey Association. (2022). World Values Survey Wave 7 (2017‐2022) cross‐national data‐set. [CrossRef]
Figure 1.
Conceptual framework of local taxation, fiscal trust and voluntary tax compliance conditions. The figure links local taxation, visible local public services, fiscal trust and tax morale to the conditions for voluntary tax compliance, while administrative capacity and institutional transparency are treated as cross-cutting dimensions of local fiscal governance. Source: Authors’ elaboration.

Figure 2.
Fiscal capacity and decentralization: Romania versus the CEE average, 2014-2024. Panel (a) shows local government revenue as % of GDP; panel (b) shows local government expenditure as % of GDP; panel (c) shows local government expenditure as a share of total general government expenditure. Source: Authors’ calculations based on Eurostat (2025), gov_10a_main; indicator definitions and data processing are described in Section 3.

Figure 3.
Local taxation and fiscal autonomy: Romania versus the CEE average, 2014-2024. Panel (a) shows local government tax revenue as % of GDP; panel (b) shows local government tax revenue as a share of total tax revenue; panel (c) shows local tax revenue as a share of local government revenue. Source: Authors’ calculations based on Eurostat (2025, 2026a), gov_10a_main and gov_10a_taxag; indicator definitions and data processing are described in Section 3.

Figure 4.
Recurrent taxes on immovable property: CEE country averages, 2014-2024. Bars show country averages for recurrent taxes on immovable property as % of GDP over 2014-2024. Source: Authors’ calculations based on European Commission (2026), Data on Taxation Trends; indicator definitions and data processing are described in Section 3.

Figure 5.
Selected local public service functions: Romania versus the CEE average, 2014-2024. The figure compares Romania and the CEE average for local expenditure on general public services, environmental protection, and housing and community amenities, expressed as % of GDP. Source: Authors’ calculations based on Eurostat (2026b), gov_10a_exp; indicator definitions and data processing are described in Section 3.

Figure 6.
Trust in local/regional public authorities: Romania versus the CEE average, 2014, 2019 and 2024. Values represent the percentage of respondents expressing trust in local or regional public authorities. The CEE average is calculated as the unweighted average of the eleven countries included in the sample. Source: Authors’ calculations based on European Commission (2017, 2019, 2024); indicator definitions and data processing are described in Section 3.


Table 1.
Indicator matrix, data sources and analytical role.
| Code | Indicator | Unit / Operationalization | Source | Type | Analytical use |
|---|---|---|---|---|---|
| I01 | Local government revenue | % of GDP | Eurostat gov_10a_main | HARD | Results |
| I02 | Local government expenditure | % of GDP | Eurostat gov_10a_main | HARD | Results |
| I03 | Local government expenditure as a share of total general government expenditure | Calculated ratio, % | Eurostat gov_10a_main | HARD | Results |
| I04 | Local government tax revenue | % of GDP | Eurostat gov_10a_taxag | HARD | Results |
| I05 | Local government tax revenue as a share of total tax revenue | Calculated ratio, % | Eurostat gov_10a_taxag | HARD | Results |
| I06 | Local tax revenue as a share of local government revenue | Calculated ratio, % | Eurostat gov_10a_taxag; Eurostat gov_10a_main | HARD | Results |
| I07 | Recurrent taxes on immovable property | % of GDP | European Commission Taxation Trends | HARD | Results |
| I08 | Local expenditure on general public services | % of GDP; COFOG GF01 | Eurostat gov_10a_exp | HARD | Results |
| I09 | Local expenditure on environmental protection | % of GDP; COFOG GF05 | Eurostat gov_10a_exp | HARD | Results |
| I10 | Local expenditure on housing and community amenities | % of GDP; COFOG GF06 | Eurostat gov_10a_exp | HARD | Results |
| I11 | Trust in local/regional public authorities | Survey-based percentage | Standard Eurobarometer | SOFT/contextual | Discussion |
| I12 | Justifiability of cheating on taxes | Survey-based score; lower values indicate stronger tax morale | WVS/QoG | SOFT/contextual | Discussion |
Note: HARD indicators were used as the empirical basis of the Results section. SOFT/contextual indicators were used only for interpretive purposes in the Discussion section and were not treated as a balanced annual panel. Source: Authors’ elaboration based on Eurostat (2025, 2026a, 2026b), European Commission (2017, 2019, 2024, 2026), The Quality of Government Institute (2026) and World Values Survey Association (2022); see Section 3.2 for data sources and Section 3.3 for indicator operationalization.
Table 2.
Romania compared with CEE averages, 2014-2024.
| Indicator | Unit | Romania mean | CEE mean | Romania 2014 | Romania 2024 | Change 2014-2024 | Romania rank |
|---|---|---|---|---|---|---|---|
| Local government revenue | % of GDP | 9.15 | 9.76 | 9.70 | 8.90 | -0.80 | 6 |
| Local government expenditure | % of GDP | 9.08 | 9.69 | 9.20 | 9.40 | 0.20 | 6 |
| Local government expenditure as a share of total general government expenditure | % | 24.05 | 22.94 | 25.84 | 21.71 | -4.13 | 6 |
| Local government tax revenue | % of GDP | 0.85 | 1.89 | 1.00 | 0.80 | -0.20 | 6 |
| Local government tax revenue as a share of total tax revenue | % | 5.07 | 8.35 | 5.29 | 4.71 | -0.59 | 5 |
| Local tax revenue as a share of local government revenue | % | 9.34 | 18.03 | 10.31 | 8.99 | -1.32 | 6 |
| Recurrent taxes on immovable property | % of GDP | 0.53 | 0.49 | 0.64 | 0.44 | -0.20 | 4 |
| Local expenditure on general public services, GF01 | % of GDP | 1.05 | 1.00 | 0.90 | 1.20 | 0.30 | 6 |
| Local expenditure on environmental protection, GF05 | % of GDP | 0.49 | 0.40 | 0.50 | 0.60 | 0.10 | 3 |
| Local expenditure on housing and community amenities, GF06 | % of GDP | 0.86 | 0.65 | 1.00 | 1.00 | 0.00 | 4 |
Note: The CEE mean is the unweighted average of the eleven countries included in the sample. Romania rank refers to the ranking by country mean over 2014-2024, where 1 indicates the highest value among the CEE countries. The ranking is descriptive and does not imply a normative assessment. Source: Authors’ calculations based on Eurostat (2025, 2026a, 2026b) and European Commission (2026); indicator definitions and data processing are described in Section 3.
Table 3.
Contextual indicators of fiscal trust and tax morale.
| Country | Trust 2014 | Trust 2019 | Trust 2024 | Trust change 2014-2024 | I12 latest year | I12 latest value |
|---|---|---|---|---|---|---|
| Bulgaria | 27 | 42 | 48 | 21 | 2017 | 1.64 |
| Croatia | 19 | 20 | 37 | 18 | 2017 | 2.01 |
| Czechia | 44 | 60 | 62 | 18 | 2022 | 3.29 |
| Estonia | 50 | 56 | 51 | 1 | 2018 | 2.14 |
| Hungary | 48 | 57 | 64 | 16 | 2018 | 1.52 |
| Latvia | 49 | 49 | 59 | 10 | 2021 | 2.27 |
| Lithuania | 37 | 52 | 58 | 21 | 2018 | 2.70 |
| Poland | 37 | 53 | 65 | 28 | 2017 | 1.56 |
| Romania | 39 | 46 | 54 | 15 | 2018 | 2.49 |
| Slovakia | 39 | 44 | 68 | 29 | 2022 | 2.58 |
| Slovenia | 31 | 46 | 45 | 14 | 2017 | 1.78 |
Note: Trust values are percentages. I12 values are survey-based scores; lower values indicate lower perceived justifiability of cheating on taxes and, by implication, stronger tax morale. I12 is wave-based and is not a balanced annual panel indicator. Source: Authors’ calculations based on European Commission (2017, 2019, 2024), The Quality of Government Institute (2026) and World Values Survey Association (2022); indicator definitions and data processing are described in Section 3.
Table 4.
Interpretation of the research propositions.
| Proposition | Empirical / conceptual basis | Interpretation |
|---|---|---|
| P1. Perceived quality of local public services is associated with fiscal trust. | Romania is close to or above the CEE average in selected local expenditure functions. Trust in local/regional authorities increased from 39% in 2014 to 54% in 2024. | The evidence is consistent with the proposition, but service quality is not directly measured. The relationship should be interpreted as contextual, not causal. |
| P2. Institutional transparency strengthens the relationship between local taxation and fiscal trust. | Transparency is retained as a conceptual dimension, not as a separate empirical indicator. | The proposition remains theoretically relevant, but it cannot be directly assessed with the final dataset. Its role is interpretive. |
| P3. Fiscal trust contributes to tax morale and voluntary compliance. | I11 provides contextual evidence on trust, while I12 provides contextual evidence on tax morale. | The evidence supports an interpretive link between trust and tax morale, but does not establish causal effects on voluntary compliance. |
| P4. Limited local fiscal autonomy may weaken the perceived connection between local taxes and local public value. | Romania is below the CEE average for local tax revenue indicators, especially local tax revenue as a share of local government revenue. | The results provide strong descriptive support for this proposition. Romania’s local tax base appears comparatively limited relative to its local expenditure profile. |
| P5. In CEE contexts, administrative capacity mediates the relationship between local fiscal resources and citizens’ willingness to comply voluntarily. | Selected COFOG functions show visible local expenditure responsibilities, but administrative capacity is not directly measured at local level. | The proposition is conceptually supported, but direct testing would require local-level administrative and behavioural data. |
Disclaimer/Publisher’s Note: The statements, opinions and data contained in all publications are solely those of the individual author(s) and contributor(s) and not of MDPI and/or the editor(s). MDPI and/or the editor(s) disclaim responsibility for any injury to people or property resulting from any ideas, methods, instructions or products referred to in the content. |
© 2026 by the authors. Licensee MDPI, Basel, Switzerland. This article is an open access article distributed under the terms and conditions of the Creative Commons Attribution (CC BY) license (http://creativecommons.org/licenses/by/4.0/).
Copyright: This open access article is published under a Creative Commons CC BY 4.0 license, which permit the free download, distribution, and reuse, provided that the author and preprint are cited in any reuse.


