

Submitted:
27 May 2026
Posted:
27 May 2026
You are already at the latest version
Abstract
The Technology-Organization-Environment (TOE) framework is widely applied in organizational technology adoption research, yet its measurement practices remain fragmented. Across studies of EDI, cloud computing, blockchain, AI, and other contexts, researchers routinely rename, adapt, or recombine constructs without documenting how their operationalizations relate to prior work, producing a literature that is empirically rich but difficult to accumulate. This study addresses that problem by developing a measurement catalog of 14 reusable TOE constructs drawn from 45 empirical anchor studies. Using a targeted construct-selection approach, the study retained constructs that were peer-reviewed, tested at the firm level, statistically validated, and generalizable across technology domains. Related aliases were consolidated under canonical names through three documented rules based on shared theoretical mechanisms, item-level overlap, and functional equivalence. The catalog organizes constructs across the technological, organizational, and environmental contexts, provides core definitions with recommended measurement facets, and includes representative survey items with reported reliability coefficients. Beyond consolidation, this study identifies persistent gaps, including limited post-adoption measurement, weak readiness-capability differentiation, and underdeveloped governance constructs for emerging technologies. The catalog serves as a practical starting point for researchers designing TOE-based survey instruments and conceptual models, strengthening construct consistency while preserving the framework’s flexibility.
Keywords:
Technology-Organization-Environment (TOE)
; technology adoption
; measurement catalog
; construct operationalization
; organizational innovation
; survey instrument design
Introduction
The Technology–Organization–Environment (TOE) framework, introduced by Tornatzky and Fleischer (Tornatzky & Fleischer, 1990), explains organizational technology adoption through three interacting contexts: the technological context, the organizational context, and the environmental context (Awa et al., 2017; Baker, 2012; Oliveira & Martins, 2011). The technological context captures both internal and external technologies relevant to the firm; the organizational context includes characteristics such as size, structure, communication processes, and slack resources; and the environmental context encompasses industry conditions, competitors, technology-support infrastructure, and government regulation (Oliveira & Martins, 2011). Several of the framework’s technological constructs, including relative advantage, compatibility, and complexity, share theoretical roots with Rogers’ Diffusion of Innovations (DOI) theory (Rogers, 2003; Tornatzky & Klein, 1982), while the organizational and environmental contexts extend beyond individual-level adoption models such as TAM (Davis, 1989) and UTAUT (Venkatesh et al., 2003) by situating adoption at the firm level. This multi-context design has given TOE broad applicability: researchers have adapted the framework to study EDI, e-business, ERP, cloud computing, blockchain, artificial intelligence, healthcare IT, and other innovation contexts (Bhuiyan et al., 2019; Chittipaka et al., 2023; Damali et al., 2021; Malik et al., 2021; Sánchez et al., 2025; Wallace et al., 2020). Oliveira and Martins observe that TOE has a solid theoretical basis, consistent empirical support, and broad applicability to information systems innovation, although the specific factors used within each context often vary across studies (Oliveira & Martins, 2011). Baker similarly characterizes TOE as a framework that is commonly adapted across different innovation contexts rather than applied through a single standardized instrument (Baker, 2012).
However, the same flexibility that makes TOE broadly applicable also creates a measurement problem. Because the framework does not prescribe a fixed set of constructs, researchers frequently select, rename, combine, or modify constructs such as relative advantage, compatibility, complexity, technology readiness, top management support, organizational readiness, competitive pressure, government support, and vendor support. As a result, two studies may examine similar adoption mechanisms while using different labels and different measurement items. For example, Kuan and Chau (2001) tested “direct benefits” and “indirect benefits” in EDI adoption, Lin and Lin (2008) measured “expected benefits” in e-business diffusion, and Abed (2020) examined “perceived usefulness” in social commerce adoption; all three operationalize the same underlying logic of perceived organizational value, yet each uses a distinct label and item set. This inconsistency makes the TOE literature useful in breadth but difficult to accumulate in depth (Baker, 2012; Oliveira & Martins, 2011). It also creates unnecessary work for researchers who must repeatedly justify construct selection and rebuild survey instruments from scattered prior studies.
The problem is not that TOE lacks empirical support. Numerous studies have operationalized and validated TOE constructs in organizational adoption settings. Kuan and Chau (2001) validated a six-factor TOE model of EDI adoption among 575 small firms; Low et al. (2011) tested technological, organizational, and environmental determinants of cloud computing adoption; Oliveira et al. (2014) examined cloud service adoption among manufacturing and service firms; and Zhu et al. (2006) modeled e-business assimilation across initiation, adoption, and routinization stages. These and other studies demonstrate that TOE constructs can be empirically grounded, measured, and statistically validated across technology domains. The larger challenge is that these validated constructs are dispersed across different technologies, industries, countries, and methodological traditions, with no consolidated reference that maps construct names, aliases, and measurement boundaries across studies. Researchers, therefore, lack a concise resource that identifies reusable TOE constructs and organizes them into a measurement-oriented catalog.
This study addresses that gap by developing a concise catalog of empirically validated TOE constructs for technology adoption research. This study provides a focused, evidence-informed synthesis of constructs that have been repeatedly used and empirically tested in scholarly technology adoption studies. The catalog is intended as a practical starting point for researchers designing TOE-based survey instruments, hypotheses, and conceptual models. The study is guided by three research questions:
- RQ1. Which TOE constructs have repeated empirical validation across organizational technology adoption studies, and how can they be organized into a concise measurement catalog across the technological, organizational, and environmental contexts?
- RQ2. What operational boundaries should guide the adaptation of canonical TOE constructs to new technology adoption contexts?
- RQ3. What limitations and gaps remain in the operationalization of TOE constructs across empirical adoption research?
By answering these questions, this study makes three specific contributions to TOE-based technology adoption research. First, it consolidates dispersed empirical evidence into a compact measurement catalog of 14 reusable constructs, organized across the TOE contexts, with canonical names mapped to their common aliases, core measurement definitions paired with recommended facets, and empirical anchor citations drawn from 45 studies. Second, it provides representative survey items for each construct with reported reliability coefficients from the anchor studies, giving researchers a ready-to-adapt item bank rather than requiring them to reconstruct instruments from scattered sources. Third, it documents explicit alias-consolidation rules and construct-boundary guidelines that future researchers can follow when adapting, renaming, or extending TOE constructs for new technology contexts. The contribution is intentionally practical rather than theoretical: the catalog does not propose a new theory nor claim to provide an exhaustive inventory of all TOE constructs. Rather, it provides researchers with a defensible, evidence-based starting point for designing survey instruments, formulating hypotheses, and building conceptual models. This approach preserves TOE’s flexibility while reducing the avoidable measurement fragmentation that currently limits cumulative progress across the field.
Methodology
This study used a targeted construct-selection approach as presented in Figure 1 to identify reusable TOE constructs that have been empirically tested in organizational technology adoption studies, rather than to exhaustively review the full TOE literature. This bounded approach is appropriate because TOE is commonly applied at the firm level, but its constructs are frequently adapted across technologies, industries, and study contexts (Baker, 2012; Oliveira & Martins, 2011). The approach follows the principles of rigorous narrative reviewing outlined by Ferrari (2015), who recommends transparent documentation of search scope, source selection, and analytical decisions even when a full systematic protocol is not the study’s objective. Studies were identified through structured searches of three academic databases: Scopus, Web of Science, and Google Scholar. The primary search string combined framework-specific and methodology-specific terms:
(“TOE” OR “technology-organization-environment”) AND (“technology adoption” OR “innovation adoption” OR “technology diffusion”) AND (“survey” OR “empirical” OR “SEM” OR “PLS” OR “regression”).
Search criteria were limited to peer-reviewed journal articles and book chapters published in the English language only. No fixed start date was applied as the TOE framework was first introduced in 1990, and foundational empirical studies appeared throughout the 1990s and 2000s. However, the search was conducted through early 2025. The initial search across all three databases returned about 220 potentially relevant records. After removing duplicates and screening titles and abstracts for relevance to firm-level technology adoption, 86 studies were retained for full-text review. Of these, 45 studies met all four retention criteria described below and were used as empirical anchors in the construct catalog. The remaining studies were excluded because they were purely conceptual and used TOE only as a framing device, without operationalizing constructs.
Identified constructs were retained when they met four criteria. First, the construct appeared in a peer-reviewed scholarly study. Second, it was used in an organizational or firm-level context of technology adoption. Third, it was operationalized and statistically tested using methods such as regression, SEM, PLS-SEM, or comparable approaches. Fourth, it represented a general adoption mechanism that could be reused across technology contexts, rather than a feature specific to one technology. In addition to these four criteria, constructs were excluded if they appeared in only a single study with no conceptual parallel in other TOE research, as isolated constructs cannot support the catalog’s goal of cross-context measurement reuse. Constructs that functioned as control variables rather than theorized antecedents (e.g., industry type used solely as a covariate) were also excluded, since the catalog focuses on constructs that researchers actively hypothesize and measure as adoption determinants.
This approach treats construct reuse as more important than exact terminology. Prior TOE studies often use different labels for similar mechanisms. To reduce label proliferation without collapsing genuinely distinct constructs, conceptually similar labels were grouped under canonical TOE construct names using three consolidation rules adapted from concept-centric review methods (Wolfswinkel et al., 2013). Two or more labels were consolidated under a single canonical construct when they met all three conditions: (a) their published definitions referenced the same theoretical mechanism, meaning the construct descriptions identified the same type of influence on adoption (e.g., both describing perceived value gains from technology use); (b) their measurement items showed substantial overlap, operationally defined as three or more shared or near-identical survey items across studies; and (c) at least two independent studies treated the labels as functionally equivalent, either by citing one as a direct adaptation of the other or by using interchangeable definitions. When labels met conditions (a) and (c) but could not be verified on condition (b) because item-level detail was not reported, consolidation was applied conservatively and noted in the catalog’s alias column. Labels that shared surface-level similarity but referenced different theoretical mechanisms were kept separate. For example, technology readiness, referring to infrastructure and technical resources available for adoption, and organizational readiness, referring to broader financial, managerial, and operational capacity, were maintained as distinct constructs because their definitions target different sources of adoption capacity, their item pools measure different organizational attributes, and multiple studies model them as separate antecedents (Lin & Lin, 2008; Zhu et al., 2006). This grouping supports cumulative measurement while preserving TOE’s flexibility across contexts (Awa et al., 2017; Baker, 2012).
Construct Catalog
The construct-selection process described in the methodology section yielded 14 reusable constructs distributed across the three TOE contexts: five in the technological context, five in the organizational context, and four in the environmental context. These constructs were identified from 45 empirical anchor studies spanning EDI, e-business, cloud computing, ERP, RFID, social commerce, big data analytics, blockchain, and AI adoption research. Table 1 presents the catalog. Each row contains five elements. The first column identifies the TOE context to which the construct belongs. The second column provides the canonical construct name recommended for use in future studies. The third column lists the common aliases and variant labels that have been used for the same construct across prior studies, along with the consolidation logic that justifies grouping them. The fourth column provides a two-part measurement focus consisting of a core definition and recommended measurement facets. The fifth column lists the references of empirical anchor studies in which the construct was operationalized and statistically tested. Representative survey items for each construct, along with reported reliability coefficients from the anchor studies, are provided in Appendix A.
The catalog should be utilized as a validated starting point, not a universal measurement scale. TOE studies consistently show that construct significance varies by technology, industry, country, firm size, and adoption stage. For example, empirical studies have validated TOE constructs in EDI adoption (Kuan & Chau, 2001), e-business diffusion (Lin & Lin, 2008), cloud computing adoption (Low et al., 2011; Oliveira et al., 2014), enterprise application adoption (Ramdani et al., 2013), and e-business assimilation (Zhu et al., 2006), but the strength and significance of individual constructs differ across these contexts.
Discussion
Before interpreting the construct catalog, several limitations should be acknowledged. First, the catalog is grounded in a targeted narrative approach rather than a systematic review with PRISMA-compliant protocols. While the search scope, retention criteria, and alias consolidation rules are documented transparently, the construct selection reflects analytical judgment rather than algorithmic exhaustiveness, and relevant studies may have been missed. Second, the representative survey items provided in Appendix A are compiled from published anchor studies rather than independently validated through a dedicated psychometric study. Their factor structure, convergent validity, and discriminant validity have not been tested as a unified instrument. Third, the reliability coefficients reported (Appendix A) alongside each construct are drawn from the anchor studies’ original samples and contexts. These values may vary when items are adapted to different technologies, industries, or national settings, and researchers should treat them as indicative benchmarks rather than guaranteed performance thresholds.
Alias Consolidation Rationale and Guidelines
The validated TOE construct catalog confirms that TOE research has accumulated substantial empirical evidence, but that evidence is distributed across inconsistent construct labels (Baker, 2012; Oliveira & Martins, 2011). The methodology section documented the alias consolidation rules used to address this problem. It provided examples of both merging decisions, such as grouping perceived benefits, expected benefits, and perceived usefulness under the relative advantage construct, and separation decisions, such as maintaining technology readiness and organizational readiness as distinct constructs. The discussion here focuses on the practical implications of these decisions for future research.
The central guideline is that future TOE studies should use canonical construct names while reporting the aliases from which those constructs were adapted. A study examining cloud adoption, for instance, may use relative advantage as the construct label and disclose that its items were adapted from prior measures of perceived usefulness (Abed, 2020), expected benefits (Lin & Lin, 2008), or direct benefits (Kuan & Chau, 2001). Similarly, external stakeholder pressure can consolidate trading partner, customer, supplier, and business partner pressures, provided the items clearly measure pressure from external ecosystem actors rather than from competitors or regulators, which belong under separate environmental constructs (Low et al., 2011; Zhu et al., 2006). This practice improves cross-study comparability without eliminating the flexibility that allows TOE to accommodate different technology contexts (Awa et al., 2017; Baker, 2012). The underlying problem in TOE research is not the existence of multiple constructs; it is the lack of explicit mapping between construct labels, measurement items, and theoretical meaning (Wolfswinkel et al., 2013). The catalog serves as a translation layer, making these mappings visible, enabling researchers to build on prior operationalizations rather than reinventing them.
Construct Boundary Rules: Technology–Organization–Environment Placement Logic
The catalog also shows that many TOE measurement problems arise when constructs are placed under the wrong context. A useful classification rule is to assign constructs by the source of influence. If the influence comes from the technology’s perceived features, it belongs in the technological context. If it comes from internal organizational capacity, leadership, resources, or skills, it belongs in the organizational context. If it comes from competitors, customers, partners, vendors, government, or regulation, it belongs in the environmental context. For example, complexity should remain a technological construct when it measures the perceived difficulty of understanding or integrating the technology, as tested in cloud adoption and RFID adoption studies (Low et al., 2011; Wang et al., 2010). By contrast, lack of employee skills should not be coded as complexity; it is better treated as human and IT capability or organizational readiness (Martins et al., 2016). This distinction matters because poor construct placement can weaken the logic of hypotheses and create ambiguous survey instruments.
The catalog should be treated as a reusable core, not a closed measurement system, but extending it requires discipline. Emerging technologies often need context-specific constructs beyond the canonical set: Pumplun et al. (2019) examined AI-specific readiness factors such as data management maturity and algorithmic transparency; Mikalef & Gupta (2021) developed and validated an AI capability construct capturing organizational resources needed for effective AI deployment; Malik et al. (2021) identified trust, traceability, and regulatory uncertainty as constructs requiring precise measurement in blockchain adoption; and Abraham et al. (2019) proposed a data governance framework with constructs such as data quality management and compliance monitoring applicable to cloud, AI, and big data analytics contexts. However, if every technology-specific issue is added as a new TOE construct, the framework becomes descriptive rather than explanatory (Chatterjee et al., 2021; Chittipaka et al., 2023). The more disciplined approach is to maintain the 14 catalog constructs as the reusable core and treat domain-specific constructs such as AI explainability, blockchain immutability, cloud elasticity, or healthcare interoperability as extensions that are justified, defined, and measured separately when the study context requires them.
Limitations and Contextual Variability
A key limitation of the catalog is that empirical validation does not mean universal significance. TOE constructs vary in predictive power across technologies, industries, countries, and adoption stages. Kuan & Chau (2001) found that five of six TOE factors distinguished EDI adopters from non-adopters among small firms, but this does not imply that the same constructs will perform identically in cloud, AI, blockchain, or digital transformation studies (Chittipaka et al., 2023; Low et al., 2011; Malik et al., 2021; Nguyen et al., 2022). Zhu et al. (2006) further showed that e-business assimilation differs across initiation, adoption, and routinization stages, suggesting that construct significance may shift before and after adoption. Researchers should therefore not mechanically include all catalog constructs but instead justify their selection based on the technology, adoption stage, and organizational setting.
Beyond construct significance, three cross-cutting methodological limitations affect the TOE literature as a whole. The first is geographic and cultural bias: the majority of TOE studies have been conducted in specific national contexts such as Hong Kong, Taiwan, Malaysia, India, and Portugal, and construct relationships validated in one institutional environment may not replicate in others, given that cultural values influence how organizations perceive and respond to technology (Leidner & Kayworth, 2006). The second is common method bias: most TOE studies rely on single-informant, cross-sectional designs where one respondent provides perceptual ratings for both predictors and outcomes, a design susceptible to common method variance that procedural remedies such as multi-respondent collection, temporal separation, or objective outcome data should address (Podsakoff et al., 2003). The third is level-of-analysis ambiguity: TOE is a firm-level framework, but individual respondents’ perceptions are routinely treated as organizational measures without formal aggregation justification, and future studies should either adopt multi-informant designs or explicitly justify that the selected informant role has adequate visibility into the constructs being measured.
Future Measurement Agenda
Four specific measurement gaps remain in the TOE literature. The first is construct-name inconsistency: similar mechanisms are measured under different labels across EDI, e-business, cloud, and blockchain studies, reducing cross-study comparability (Abed, 2020; Chittipaka et al., 2023; Kuan & Chau, 2001). The catalog’s alias consolidation rules offer a partial remedy, but wider adoption of canonical labeling conventions is needed. The second is limited post-adoption measurement: most TOE studies focus on adoption intention or adoption decision, while routinization, assimilation, value realization, and long-term performance remain underexamined. Zhu et al. (2006) modeled assimilation across initiation, adoption, and routinization, but this staged approach has not been consistently followed. Future research should develop and validate post-adoption constructs that capture sustained use, organizational embedding, and governance maturity.
The third gap is weak differentiation between readiness and capability. Organizational readiness, technology readiness, and IT capability are sometimes treated as interchangeable, even though they measure different aspects of adoption capacity. Lin & Lin (2008) separated IS infrastructure from IS expertise in e-business diffusion, while later cloud and big data studies often combine these under broader readiness constructs (Maroufkhani et al., 2023; Oliveira et al., 2014). The catalog maintains these as distinct constructs, but researchers must ensure their measurement items reflect these boundaries. The fourth gap is the underdeveloped measurement of governance and risk. Earlier TOE studies emphasized benefits, compatibility, and external pressure, but cloud, AI, blockchain, and big data analytics demand stronger constructs for security, privacy, trust, data governance, and regulatory accountability (Abraham et al., 2019; Chittipaka et al., 2023; Maroufkhani et al., 2023; Maroufkhani, Tseng, et al., 2020; Maroufkhani, Wan Ismail, et al., 2020; Oliveira et al., 2014). As technologies with significant ethical and data-handling implications become the primary subjects of adoption research, governance measurement within TOE will require substantially more attention.
Conclusion
TOE remains one of the most widely applied frameworks in organizational technology adoption research, yet its measurement practices have not kept pace with its popularity. Researchers working across EDI, cloud computing, blockchain, AI, and other innovation contexts continue to rename, recombine, and reinvent constructs that prior studies have already validated. This study responded to that problem by developing a measurement catalog of 14 reusable TOE constructs, each anchored in empirical source studies and organized across the technological, organizational, and environmental contexts. The catalog offers several practical resources. It maps canonical construct names to the aliases that have proliferated across the literature, provides core definitions with recommended measurement facets, and includes representative survey items drawn from 45 anchor studies with reported reliability ranges. To ensure that alias groupings are defensible, the consolidation followed three transparent rules grounded in shared theoretical mechanisms, item-level overlap, and demonstrated functional equivalence across independent studies. Beyond organizing what exists, this study also identifies what is still missing. The TOE literature continues to struggle with limited post-adoption measurement, blurred boundaries between readiness and capability constructs, and underdeveloped treatment of governance and risk gaps that become more consequential as adoption research shifts toward AI, blockchain, and data-intensive technologies. Methodological concerns around geographic bias, common method variance, and single-informant designs further constrain the generalizability of existing findings. This catalog is not a universal instrument, nor does it attempt to replace theoretical development. It is a starting point, one that gives researchers a defensible foundation for selecting, naming, and adapting TOE constructs rather than rebuilding from scratch.
Appendix A
Representative Survey Items for Validated TOE Constructs
Note: All items are measured on a 5-point or 7-point Likert scale (1 = Strongly Disagree to 5/7 = Strongly Agree) Except for firm size and other objective controls. The placeholder [technology] should be replaced with the specific technology under study, for example, cloud computing, blockchain, AI, ERP, and others. Items are representative examples drawn from published instruments; researchers should adapt wording to their specific technology and organizational context while preserving the construct’s theoretical meaning.
Technological Context
1. Relative Advantage

Table A1.
Survey constructs for Relative Advantage.
| Item Code | Representative Survey Item | Adapted From |
|---|---|---|
| RA1 | Adopting [technology] would enable our organization to accomplish tasks more quickly and efficiently. | Premkumar & Roberts (1999); Moore & Benbasat (1991) |
| RA2 | Adopting [technology] would improve the quality of work our organization performs. | Premkumar & Roberts (1999); Gangwar et al. (2015) |
| RA3 | Adopting [technology] would enhance our organization’s competitive position in the industry. | Low et al. (2011); Oliveira et al. (2014) |
Source studies reporting reliability: Gangwar et al. (2015), α = 0.87; Low et al. (2011), α = 0.83; Oliveira et al. (2014), α = 0.91; Nguyen et al. (2022), CR = 0.88; Premkumar & Roberts (1999), α = 0.88.
2. Compatibility
Table A2.
Survey constructs for Compatibility.
| Item Code | Representative Survey Item | Adapted From |
|---|---|---|
| COM1 | Adopting [technology] is compatible with our organization’s existing IT infrastructure and systems. | Premkumar & Roberts (1999); Gangwar et al. (2015) |
| COM2 | Adopting [technology] is consistent with our organization’s existing values and business practices. | Low et al. (2011); Tornatzky & Klein (1982) |
| COM3 | Adopting [technology] fits well with the way our employees prefer to work. | Oliveira et al. (2014); Rogers (2003) |
Source studies reporting reliability: Gangwar et al. (2015), α = 0.82; Low et al. (2011), α = 0.81; Oliveira et al. (2014), α = 0.87; Nguyen et al. (2022), CR = 0.86; Premkumar & Roberts (1999), α = 0.86.
3. Complexity
Table A3.
Survey constructs for Complexity.
| Item Code | Representative Survey Item | Adapted From |
|---|---|---|
| CX1 | Learning to use [technology] would be difficult for our organization’s employees. | Premkumar & Roberts (1999); Rogers (2003) |
| CX2 | Integrating [technology] into our current work processes would be complex and require significant effort. | Gangwar et al. (2015); Low et al. (2011) |
| CX3 | The skills needed to implement and operate [technology] are too complex for our organization. | Oliveira et al. (2014); Thong (1999) |
Source studies reporting reliability: Gangwar et al. (2015), α = 0.80; Low et al. (2011), α = 0.79; Oliveira et al. (2014), α = 0.84; Nguyen et al. (2022), CR = 0.83; Wang et al. (2010), α = 0.85. Note: Complexity is typically reverse-scored or treated as an inhibitor in structural models.
4. Technology Readiness
Table A4.
Survey constructs for Technology Readiness.
| Item Code | Representative Survey Item | Adapted From |
|---|---|---|
| TR1 | Our organization has adequate IT infrastructure (e.g., networks, hardware, software) to support [technology] adoption. | Zhu et al. (2006); Lin & Lin (2008) |
| TR2 | Our organization’s existing technology systems can be readily integrated with [technology]. | Low et al. (2011); Oliveira et al. (2014) |
| TR3 | Our organization has the necessary technical platforms and tools to implement [technology] effectively. | Kuan & Chau (2001); Premkumar & Roberts (1999) |
Source studies reporting reliability: Zhu et al. (2006), α = 0.86; Low et al. (2011), α = 0.82; Lin & Lin (2008), α = 0.88; Oliveira et al. (2014), α = 0.85; Ramdani et al. (2013), α = 0.84.
5. Security, Privacy, Risk, and Trust
Table A5.
Survey constructs for Security, Privacy, Risk, and Trust.
| Item Code | Representative Survey Item | Adapted From |
|---|---|---|
| SPRT1 | Our organization is concerned that adopting [technology] could expose sensitive business data to security breaches. | Oliveira et al. (2014); Gangwar et al. (2015) |
| SPRT2 | Our organization is concerned about the privacy of organizational and customer data when using [technology]. | Low et al. (2011); Lian et al. (2014) |
| SPRT3 | Our organization trusts that [technology] providers can deliver reliable and secure services. | Chittipaka et al. (2023); Malik et al. (2021) |
Source studies reporting reliability: Oliveira et al. (2014), α = 0.89; Gangwar et al. (2015), α = 0.83; Chittipaka et al. (2023), CR = 0.87; Malik et al. (2021), CR = 0.85. Note: Security/risk items are typically treated as inhibitors (negative influence on adoption), while trust items are treated as enablers. Researchers should consider separating these into distinct sub-constructs when the study context warrants it (see Discussion, Section “Alias Consolidation Rationale and Guidelines”).
Organizational Context
6. Top Management Support
Table A6.
Survey constructs for Top Management Support.
| Item Code | Representative Survey Item | Adapted From |
|---|---|---|
| TMS1 | Top management in our organization actively supports the adoption of [technology]. | Premkumar & Roberts (1999); Low et al. (2011) |
| TMS2 | Top management provides adequate resources (funding, personnel, time) for [technology] adoption initiatives. | Gangwar et al. (2015); Chatterjee et al. (2021) |
| TMS3 | Top management is willing to accept the risks involved in adopting [technology]. | Thong (1999); Grandon & Pearson (2004) |
Source studies reporting reliability: Premkumar & Roberts (1999), α = 0.90; Low et al. (2011), α = 0.85; Gangwar et al. (2015), α = 0.87; Nguyen et al. (2022), CR = 0.89; Ramdani et al. (2013), α = 0.88.
7. Organizational Readiness
Table A7.
Survey constructs for Organizational Readiness.
| Item Code | Representative Survey Item | Adapted From |
|---|---|---|
| OR1 | Our organization has sufficient financial resources to adopt and implement [technology]. | Iacovou et al. (1995); Kuan & Chau (2001) |
| OR2 | Our organization has the operational capacity and managerial bandwidth to manage the [technology] adoption process. | Zhu et al. (2006); Gangwar et al. (2015) |
| OR3 | Our organization is prepared to commit the time and organizational effort required for [technology] adoption. | Low et al. (2011); Oliveira et al. (2014) |
Source studies reporting reliability: Gangwar et al. (2015), α = 0.84; Low et al. (2011), α = 0.80; Zhu et al. (2006), α = 0.83; Kuan & Chau (2001), α = 0.82; Ramdani et al. (2013), α = 0.81.
8. Human and IT Capability
Table A8.
Survey constructs for Human and IT Capability.
| Item Code | Representative Survey Item | Adapted From |
|---|---|---|
| HIC1 | Our organization’s employees have the technical skills and knowledge needed to use [technology] effectively. | Zhu et al. (2006); Lin & Lin (2008) |
| HIC2 | Our IT staff have sufficient expertise to implement and maintain [technology]. | Thong (1999); Premkumar & Roberts (1999) |
| HIC3 | Our organization provides adequate training programs to develop employee competency in [technology]. | Gangwar et al. (2015); Chatterjee et al. (2021) |
Source studies reporting reliability: Zhu et al. (2006), α = 0.87; Lin & Lin (2008), α = 0.85; Gangwar et al. (2015), α = 0.82; Premkumar & Roberts (1999), α = 0.84; Thong (1999), α = 0.86.
9. Firm Size and Organizational Scale
Table A9.
Survey constructs for Firm Size and Organizational Scale.
| Item Code | Representative Survey Item | Adapted From |
|---|---|---|
| FS1 | Total number of full-time employees in the organization. | Zhu et al. (2006); Premkumar & Roberts (1999) |
| FS2 | Annual revenue or turnover of the organization. | Low et al. (2011); Oliveira et al. (2014) |
| FS3 | Number of departments or business units in the organization. | Ramdani et al. (2013); Thong (1999) |
Note: Firm size is most commonly measured as a categorical or continuous variable (e.g., log-transformed employee count or revenue) rather than as a Likert-scale perception item. It typically functions as a control variable, moderator, or structural antecedent. Researchers should select the measure most appropriate to their industry context and available data. Source studies reporting usage: Zhu et al. (2006), log(employees); Low et al. (2011), categorical; Ramdani et al. (2013), employee count brackets; Premkumar & Roberts (1999), log(employees); Thong (1999), employee count.
10. Culture and Innovation Readiness
Table A10.
Survey constructs for Culture and Innovation Readiness.
| Item Code | Representative Survey Item | Adapted From |
|---|---|---|
| CIR1 | Our organization encourages employees to experiment with new technologies and innovative solutions. | Nguyen et al. (2022); Ifinedo (2011) |
| CIR2 | Our organization’s culture supports change and is open to adopting new ways of working. | Gangwar et al. (2015); Thong (1999) |
| CIR3 | Our organization actively seeks out new technology-based opportunities to improve business processes. | Ramdani et al. (2009); Al-Qirim (2007) |
Source studies reporting reliability: Nguyen et al. (2022), CR = 0.86; Ifinedo (2011), α = 0.83; Ramdani et al. (2009), α = 0.80; Gangwar et al. (2015), α = 0.81.
Environmental Context
11. Competitive Pressure
Table A11.
Survey constructs for Competitive Pressure.
| Item Code | Representative Survey Item | Adapted From |
|---|---|---|
| CP1 | Our organization would be at a competitive disadvantage if we did not adopt [technology]. | Premkumar & Roberts (1999); Kuan & Chau (2001) |
| CP2 | Our competitors who have adopted [technology] have benefited greatly from it. | Low et al. (2011); Oliveira et al. (2014) |
| CP3 | Our industry is experiencing strong competitive pressure to adopt [technology]. | Zhu et al. (2006); Gangwar et al. (2015) |
Source studies reporting reliability: Premkumar & Roberts (1999), α = 0.85; Kuan & Chau (2001), α = 0.79; Low et al. (2011), α = 0.83; Zhu et al. (2006), α = 0.84; Gangwar et al. (2015), α = 0.82.
12. External Stakeholder Pressure
Table A12.
Survey constructs for External Stakeholder Pressure.
| Item Code | Representative Survey Item | Adapted From |
|---|---|---|
| ESP1 | Our major customers or clients have requested or expect us to adopt [technology]. | Premkumar & Roberts (1999); Iacovou et al. (1995) |
| ESP2 | Our key suppliers or trading partners require us to use [technology] to maintain business relationships. | Kuan & Chau (2001); Low et al. (2011) |
| ESP3 | Our business partners in the supply chain or ecosystem strongly recommend adopting [technology]. | Zhu et al. (2006); Teo et al. (2009) |
Source studies reporting reliability: Premkumar & Roberts (1999), α = 0.87; Kuan & Chau (2001), α = 0.81; Low et al. (2011), α = 0.80; Zhu et al. (2006), α = 0.83; Ifinedo (2011), α = 0.84.
13. Government, Regulatory, and Legal Pressure
Table A13.
Survey constructs for Government, Regulatory, and Legal Pressure.
| Item Code | Representative Survey Item | Adapted From |
|---|---|---|
| GRL1 | Government laws and regulations in our industry encourage or require the adoption of [technology]. | Kuan & Chau (2001); Zhu et al. (2006) |
| GRL2 | Government provides incentives, subsidies, or support programs that facilitate [technology] adoption. | Nguyen et al. (2022); Hsu et al. (2006) |
| GRL3 | Our organization must comply with regulatory requirements that necessitate the use of [technology]. | Oliveira et al. (2014); Gangwar et al. (2015) |
Source studies reporting reliability: Kuan & Chau (2001), α = 0.78; Zhu et al. (2006), α = 0.82; Nguyen et al. (2022), CR = 0.85; Oliveira et al. (2014), α = 0.80; Gangwar et al. (2015), α = 0.83.
14. Vendor and Provider Support
Table A14.
Survey constructs for Vendor and Provider Support.
| Item Code | Representative Survey Item | Adapted From |
|---|---|---|
| VS1 | [Technology] vendors provide adequate technical support and training to help our organization implement the technology. | Premkumar & Roberts (1999); Ramdani et al. (2013) |
| VS2 | Our organization has access to reliable external consultants or service providers for [technology] implementation. | Gangwar et al. (2015); Lian et al. (2014) |
| VS3 | [Technology] vendors offer continuous maintenance, updates, and after-sales support that meet our organization’s needs. | Chittipaka et al. (2023); Alshamaila et al. (2013) |
Source studies reporting reliability: Premkumar & Roberts (1999), α = 0.86; Ramdani et al. (2013), α = 0.83; Gangwar et al. (2015), α = 0.81; Chittipaka et al. (2023), CR = 0.84; Lian et al. (2014), α = 0.82.
Usage Guidelines for Researchers
Item adaptation protocol. When adapting these representative items to a new study context, researchers should follow four steps. First, replace the [technology] placeholder with the specific technology under investigation (e.g., “cloud computing,” “blockchain,” “artificial intelligence,” “big data analytics”). Second, adjust organizational terminology to match the study population (e.g., “employees” may become “healthcare professionals” or “supply chain managers” in sector-specific studies). Third, pilot-test adapted items with a small sample from the target population to confirm face validity and clarity. Fourth, report the original source from which items were adapted and disclose any wording modifications, following the alias-transparency guidelines described in the Discussion section of this study.
Scale selection. The majority of anchor studies used 5-point Likert scales (1 = Strongly Disagree to 5 = Strongly Agree). Some studies, particularly those using SEM or PLS-SEM, employed 7-point scales for greater variance. Either format is acceptable; the choice should be consistent within a single instrument and justified in the study’s method section.
Minimum items per construct. Reflective constructs in SEM and PLS-SEM models typically require a minimum of three items per construct to ensure model identification and stable factor loadings (Hair et al., 2018). The three items per construct provided in this appendix meet this minimum threshold. Researchers may add items from the anchor studies listed in Table 1 to improve content coverage, provided that additional items do not introduce construct contamination or redundancy.
References
- Abed, S. S. Social commerce adoption using TOE framework: An empirical investigation of Saudi Arabian SMEs. International Journal of Information Management 2020, 53, 102118. [Google Scholar] [CrossRef]
- Abraham, R.; Schneider, J.; vom Brocke, J. Data governance: A conceptual framework, structured review, and research agenda. International Journal of Information Management 2019, 49, 424–438. [Google Scholar] [CrossRef]
- Al-Qirim, N. The adoption of eCommerce communications and applications technologies in small businesses in New Zealand. Electronic Commerce Research and Applications 2007, 6(4), 462–473. [Google Scholar] [CrossRef]
- Alshamaila, Y.; Papagiannidis, S.; Li, F. Cloud computing adoption by SMEs in the north east of England. Journal of Enterprise Information Management 2013, 26(3), 250–275. [Google Scholar] [CrossRef]
- Asiaei, A.; Ab. Rahim, N. Z. A multifaceted framework for adoption of cloud computing in Malaysian SMEs. Journal of Science and Technology Policy Management 2019, 10(3), 708–750. [Google Scholar] [CrossRef]
- Awa, H. O.; Ojiabo, O. U. A model of adoption determinants of ERP within T-O-E framework. Information Technology & People 2016, 29(4), 901–930. [Google Scholar] [CrossRef]
- Awa, H. O.; Ojiabo, O. U.; Orokor, L. E. Integrated technology-organization-environment (T-O-E) taxonomies for technology adoption. Journal of Enterprise Information Management 2017, 30(6), 893–921. [Google Scholar] [CrossRef]
- Awa, H. O.; Ukoha, O.; Emecheta, B. C. Using T-O-E theoretical framework to study the adoption of ERP solution. Cogent Business & Management 2016, 3(1), 1196571. [Google Scholar] [CrossRef]
- Baker, J. The Technology–Organization–Environment Framework; 2012; pp. 231–245. [Google Scholar] [CrossRef]
- Bhuiyan, M. Y.; Othman, S. H.; & Raja Mohd. Radzi, R. Z. An Enhancement of TOE Model by Investigating the Influential Factors of Cloud Adoption Security Objectives. International Journal of Innovative Computing 2019, 9(1). [Google Scholar] [CrossRef]
- Chatterjee, S.; Rana, N. P.; Dwivedi, Y. K.; Baabdullah, A. M. Understanding AI adoption in manufacturing and production firms using an integrated TAM-TOE model. Technological Forecasting and Social Change 2021, 170, 120880. [Google Scholar] [CrossRef]
- Chau, P. Y. K.; Tam, K. Y. Factors Affecting the Adoption of Open Systems: An Exploratory Study1. MIS Quarterly 1997, 21(1), 1–24. [Google Scholar] [CrossRef] [PubMed]
- Chau, P. Y. K.; Tam, K. Y. Organizational adoption of open systems: a ‘technology-push, need-pull’ perspective. Information & Management 2000, 37(5), 229–239. [Google Scholar] [CrossRef]
- Chen, M.; Wang, H.; Liang, Y.; Zhang, G. Net and configurational effects of determinants on cloud computing adoption by SMEs under cloud promotion policy using PLS-SEM and fsQCA. Journal of Innovation & Knowledge 2023, 8(3), 100388. [Google Scholar] [CrossRef]
- Chittipaka, V.; Kumar, S.; Sivarajah, U.; Bowden, J. L.-H.; Baral, M. M. Blockchain Technology for Supply Chains operating in emerging markets: an empirical examination of technology-organization-environment (TOE) framework. Annals of Operations Research 2023, 327(1), 465–492. [Google Scholar] [CrossRef]
- Cruz-Jesus, F.; Pinheiro, A.; Oliveira, T. Understanding CRM adoption stages: empirical analysis building on the TOE framework. Computers in Industry 2019, 109, 1–13. [Google Scholar] [CrossRef]
- Damali, U.; Kocakulah, M.; Ozkul, A. S. Investigation of Cloud ERP Adoption in the Healthcare Industry Through Technology-Organization-Environment (TOE) Framework. International Journal of Healthcare Information Systems and Informatics 2021, 16(4), 1–14. [Google Scholar] [CrossRef]
- Davis, F. D. Perceived Usefulness, Perceived Ease of Use, and User Acceptance of Information Technology. MIS Quarterly 1989, 13(3), 319–340. [Google Scholar] [CrossRef]
- Ferrari, R. Writing narrative style literature reviews. Medical Writing 2015, 24(4), 230–235. [Google Scholar] [CrossRef]
- Gangwar, H.; Date, H.; Ramaswamy, R. Understanding determinants of cloud computing adoption using an integrated TAM-TOE model. Journal of Enterprise Information Management 2015, 28(1), 107–130. [Google Scholar] [CrossRef]
- Grandon, E. E.; Pearson, J. M. Electronic commerce adoption: an empirical study of small and medium US businesses. Information & Management 2004, 42(1), 197–216. [Google Scholar] [CrossRef]
- Gutierrez, A.; Boukrami, E.; Lumsden, R. Technological, organisational and environmental factors influencing managers’ decision to adopt cloud computing in the UK. Journal of Enterprise Information Management 2015, 28(6), 788–807. [Google Scholar] [CrossRef]
- Hair, J. F.; Black, W. C.; Babin, B. J.; Anderson, R. E. Multivariate Data Analysis, 8th ed.; Cengage Learning, 2018. [Google Scholar]
- Hsu, P.-F.; Kraemer, K. L.; Dunkle, D. Determinants of E-Business Use in U.S. Firms. International Journal of Electronic Commerce 2006, 10(4), 9–45. [Google Scholar] [CrossRef]
- Iacovou, C. L.; Benbasat, I.; Dexter, A. S. Electronic Data Interchange and Small Organizations: Adoption and Impact of Technology. MIS Quarterly 1995, 19(4), 465–485. [Google Scholar] [CrossRef]
- Ifinedo, P. AN EMPIRICAL ANALYSIS OF FACTORS INFLUENCING INTERNET/E-BUSINESS TECHNOLOGIES ADOPTION BY SMES IN CANADA. International Journal of Information Technology & Decision Making 2011, 10(04), 731–766. [Google Scholar] [CrossRef]
- Ilin, V.; Ivetić, J.; Simić, D. Understanding the determinants of e-business adoption in ERP-enabled firms and non-ERP-enabled firms: A case study of the Western Balkan Peninsula. Technological Forecasting and Social Change 2017, 125, 206–223. [Google Scholar] [CrossRef]
- Khayer, A.; Talukder, Md. S.; Bao, Y.; Hossain, Md. N. Cloud computing adoption and its impact on SMEs’ performance for cloud supported operations: A dual-stage analytical approach. Technology in Society 2020, 60, 101225. [Google Scholar] [CrossRef]
- Kuan, K. K. Y.; Chau, P. Y. K. A perception-based model for EDI adoption in small businesses using a technology–organization–environment framework. Information & Management 2001, 38(8), 507–521. [Google Scholar] [CrossRef]
- Leidner, D. E.; Kayworth, T. A Review of Culture in Information Systems Research: Toward a Theory of Information Technology Culture Conflict1. MIS Quarterly 2006, 30(2), 357–399. [Google Scholar] [CrossRef]
- Lian, J.-W.; Yen, D. C.; Wang, Y.-T. An exploratory study to understand the critical factors affecting the decision to adopt cloud computing in Taiwan hospital. International Journal of Information Management 2014, 34(1), 28–36. [Google Scholar] [CrossRef]
- Lin, H.-F.; Lin, S.-M. Determinants of e-business diffusion: A test of the technology diffusion perspective. Technovation 2008, 28(3), 135–145. [Google Scholar] [CrossRef]
- Low, C.; Chen, Y.; Wu, M. Understanding the determinants of cloud computing adoption. Industrial Management & Data Systems 2011, 111(7), 1006–1023. [Google Scholar] [CrossRef]
- Malik, S.; Chadhar, M.; Vatanasakdakul, S.; Chetty, M. Factors Affecting the Organizational Adoption of Blockchain Technology: Extending the Technology–Organization–Environment (TOE) Framework in the Australian Context. Sustainability 2021, 13(16), 9404. [Google Scholar] [CrossRef]
- Maroufkhani, P.; Iranmanesh, M.; Ghobakhloo, M. Determinants of big data analytics adoption in small and medium-sized enterprises (SMEs). Industrial Management & Data Systems 2023, 123(1), 278–301. [Google Scholar] [CrossRef]
- Maroufkhani, P.; Tseng, M.-L.; Iranmanesh, M.; Ismail, W. K. W.; Khalid, H. Big data analytics adoption: Determinants and performances among small to medium-sized enterprises. International Journal of Information Management 2020, 54, 102190. [Google Scholar] [CrossRef]
- Maroufkhani, P.; Wan Ismail, W. K.; Ghobakhloo, M. Big data analytics adoption model for small and medium enterprises. Journal of Science and Technology Policy Management 2020, 11(4), 483–513. [Google Scholar] [CrossRef]
- Martins, R.; Oliveira, T.; Thomas, M. A. An empirical analysis to assess the determinants of SaaS diffusion in firms. Computers in Human Behavior 2016, 62, 19–33. [Google Scholar] [CrossRef]
- Mikalef, P.; Gupta, M. Artificial intelligence capability: Conceptualization, measurement calibration, and empirical study on its impact on organizational creativity and firm performance. Information & Management 2021, 58(3), 103434. [Google Scholar] [CrossRef]
- Moore, G. C.; Benbasat, I. Development of an Instrument to Measure the Perceptions of Adopting an Information Technology Innovation. Information Systems Research 1991, 2(3), 192–222. [Google Scholar] [CrossRef]
- N’Dri, A. B.; Su, Z. Successful configurations of technology–organization–environment factors in digital transformation: Evidence from exporting small and medium-sized enterprises in the manufacturing industry. Information & Management 2024, 61(7), 104030. [Google Scholar] [CrossRef]
- Ngah, A. H.; Zainuddin, Y.; Thurasamy, R. Applying the TOE framework in the Halal warehouse adoption study. Journal of Islamic Accounting and Business Research 2017, 8(2), 161–181. [Google Scholar] [CrossRef]
- Nguyen, T. H.; Le, X. C.; Vu, T. H. L. An Extended Technology-Organization-Environment (TOE) Framework for Online Retailing Utilization in Digital Transformation: Empirical Evidence from Vietnam. Journal of Open Innovation: Technology, Market, and Complexity 2022, 8(4), 200. [Google Scholar] [CrossRef]
- Oliveira, T.; Martins, M. F. Understanding e-business adoption across industries in European countries. Industrial Management & Data Systems 2010, 110(9), 1337–1354. [Google Scholar] [CrossRef]
- Oliveira, T.; Martins, M. F. Literature review of information technology adoption models at firm level. Electronic Journal of Information Systems Evaluation 2011, 14(1), pp110–121. [Google Scholar]
- Oliveira, T.; Thomas, M.; Espadanal, M. Assessing the determinants of cloud computing adoption: An analysis of the manufacturing and services sectors. Information & Management 2014, 51(5), 497–510. [Google Scholar] [CrossRef]
- Pan, M.-J.; Jang, W.-Y. Determinants of the Adoption of Enterprise Resource Planning within the Technology-Organization-Environment Framework: Taiwan’s Communications Industry. Journal of Computer Information Systems 2008, 48(3), 94–102. [Google Scholar] [CrossRef]
- Podsakoff, P. M.; MacKenzie, S. B.; Lee, J.-Y.; Podsakoff, N. P. Common method biases in behavioral research: A critical review of the literature and recommended remedies. Journal of Applied Psychology 2003, 88(5), 879–903. [Google Scholar] [CrossRef]
- Premkumar, G.; Roberts, M. Adoption of new information technologies in rural small businesses. Omega 1999, 27(4), 467–484. [Google Scholar] [CrossRef]
- Pudjianto, B.; Zo, H.; Ciganek, A. P.; Rho, J. J. Determinants of e-government assimilation in Indonesia: An empirical investigation using a TOE framework. Asia Pacific Journal of Information Systems 2011, 21(1), 49–80. [Google Scholar]
- Pumplun, L.; Tauchert, C.; Heidt, M. A new organizational chassis for artificial intelligence-exploring organizational readiness factors, 2019.
- Ramdani, B.; Chevers, D.; Williams, D. A. SMEs’ adoption of enterprise applications. Journal of Small Business and Enterprise Development 2013, 20(4), 735–753. [Google Scholar] [CrossRef]
- Ramdani, B.; Kawalek, P.; Lorenzo, O. Predicting SMEs’ adoption of enterprise systems. Journal of Enterprise Information Management 2009, 22(1/2), 10–24. [Google Scholar] [CrossRef]
- Rogers, E. M. Diffusion of Innovations, 5th ed.; Free Press, 2003. [Google Scholar]
- Sánchez, E.; Calderón, R.; Herrera, F. Artificial Intelligence Adoption in SMEs: Survey Based on TOE–DOI Framework, Primary Methodology and Challenges. Applied Sciences 2025, 15(12), 6465. [Google Scholar] [CrossRef]
- Skafi, M.; Yunis, M. M.; Zekri, A. Factors Influencing SMEs’ Adoption of Cloud Computing Services in Lebanon: An Empirical Analysis Using TOE and Contextual Theory. IEEE Access 2020, 8, 79169–79181. [Google Scholar] [CrossRef]
- Teo, T. S. H.; Lin, S.; Lai, K. Adopters and non-adopters of e-procurement in Singapore: An empirical study. Omega 2009, 37(5), 972–987. [Google Scholar] [CrossRef]
- Thong, J. Y. L. An Integrated Model of Information Systems Adoption in Small Businesses. Journal of Management Information Systems 1999, 15(4), 187–214. [Google Scholar] [CrossRef]
- Tornatzky, L. G.; Fleischer, M. The processes of technological innovation; Lexington Books, 1990. [Google Scholar]
- Tornatzky, L. G.; Klein, K. J. Innovation characteristics and innovation adoption-implementation: A meta-analysis of findings. IEEE Transactions on Engineering Management 1982, EM-29(1), 28–45. [Google Scholar] [CrossRef]
- Venkatesh, V.; Morris, M. G.; Davis, G. B.; Davis, F. D. User Acceptance of Information Technology: Toward A Unified View1. MIS Quarterly 2003, 27(3), 425–478. [Google Scholar] [CrossRef]
- Wallace, S.; Green, K. Y.; Johnson, C. M.; Cooper, J. T.; Gilstrap, C. M. An Extended TOE Framework for Cybersecurity Adoption Decisions. Communications of the Association for Information Systems 2020, 47, 338–363. [Google Scholar] [CrossRef]
- Wang, Y.-M.; Wang, Y.-S.; Yang, Y.-F. Understanding the determinants of RFID adoption in the manufacturing industry. Technological Forecasting and Social Change 2010, 77(5), 803–815. [Google Scholar] [CrossRef]
- Wolfswinkel, J. F.; Furtmueller, E.; Wilderom, C. P. M. Using grounded theory as a method for rigorously reviewing literature. European Journal of Information Systems 2013, 22(1), 45–55. [Google Scholar] [CrossRef]
- Zhu, K.; Kraemer, K. L. Post-Adoption Variations in Usage and Value of E-Business by Organizations: Cross-Country Evidence from the Retail Industry. Information Systems Research 2005, 16(1), 61–84. [Google Scholar] [CrossRef]
- Zhu, K.; Kraemer, K. L.; Xu, S. The Process of Innovation Assimilation by Firms in Different Countries: A Technology Diffusion Perspective on E-Business. Management Science 2006, 52(10), 1557–1576. [Google Scholar] [CrossRef]
Figure 1.
Targeted construct-selection process used in this study.
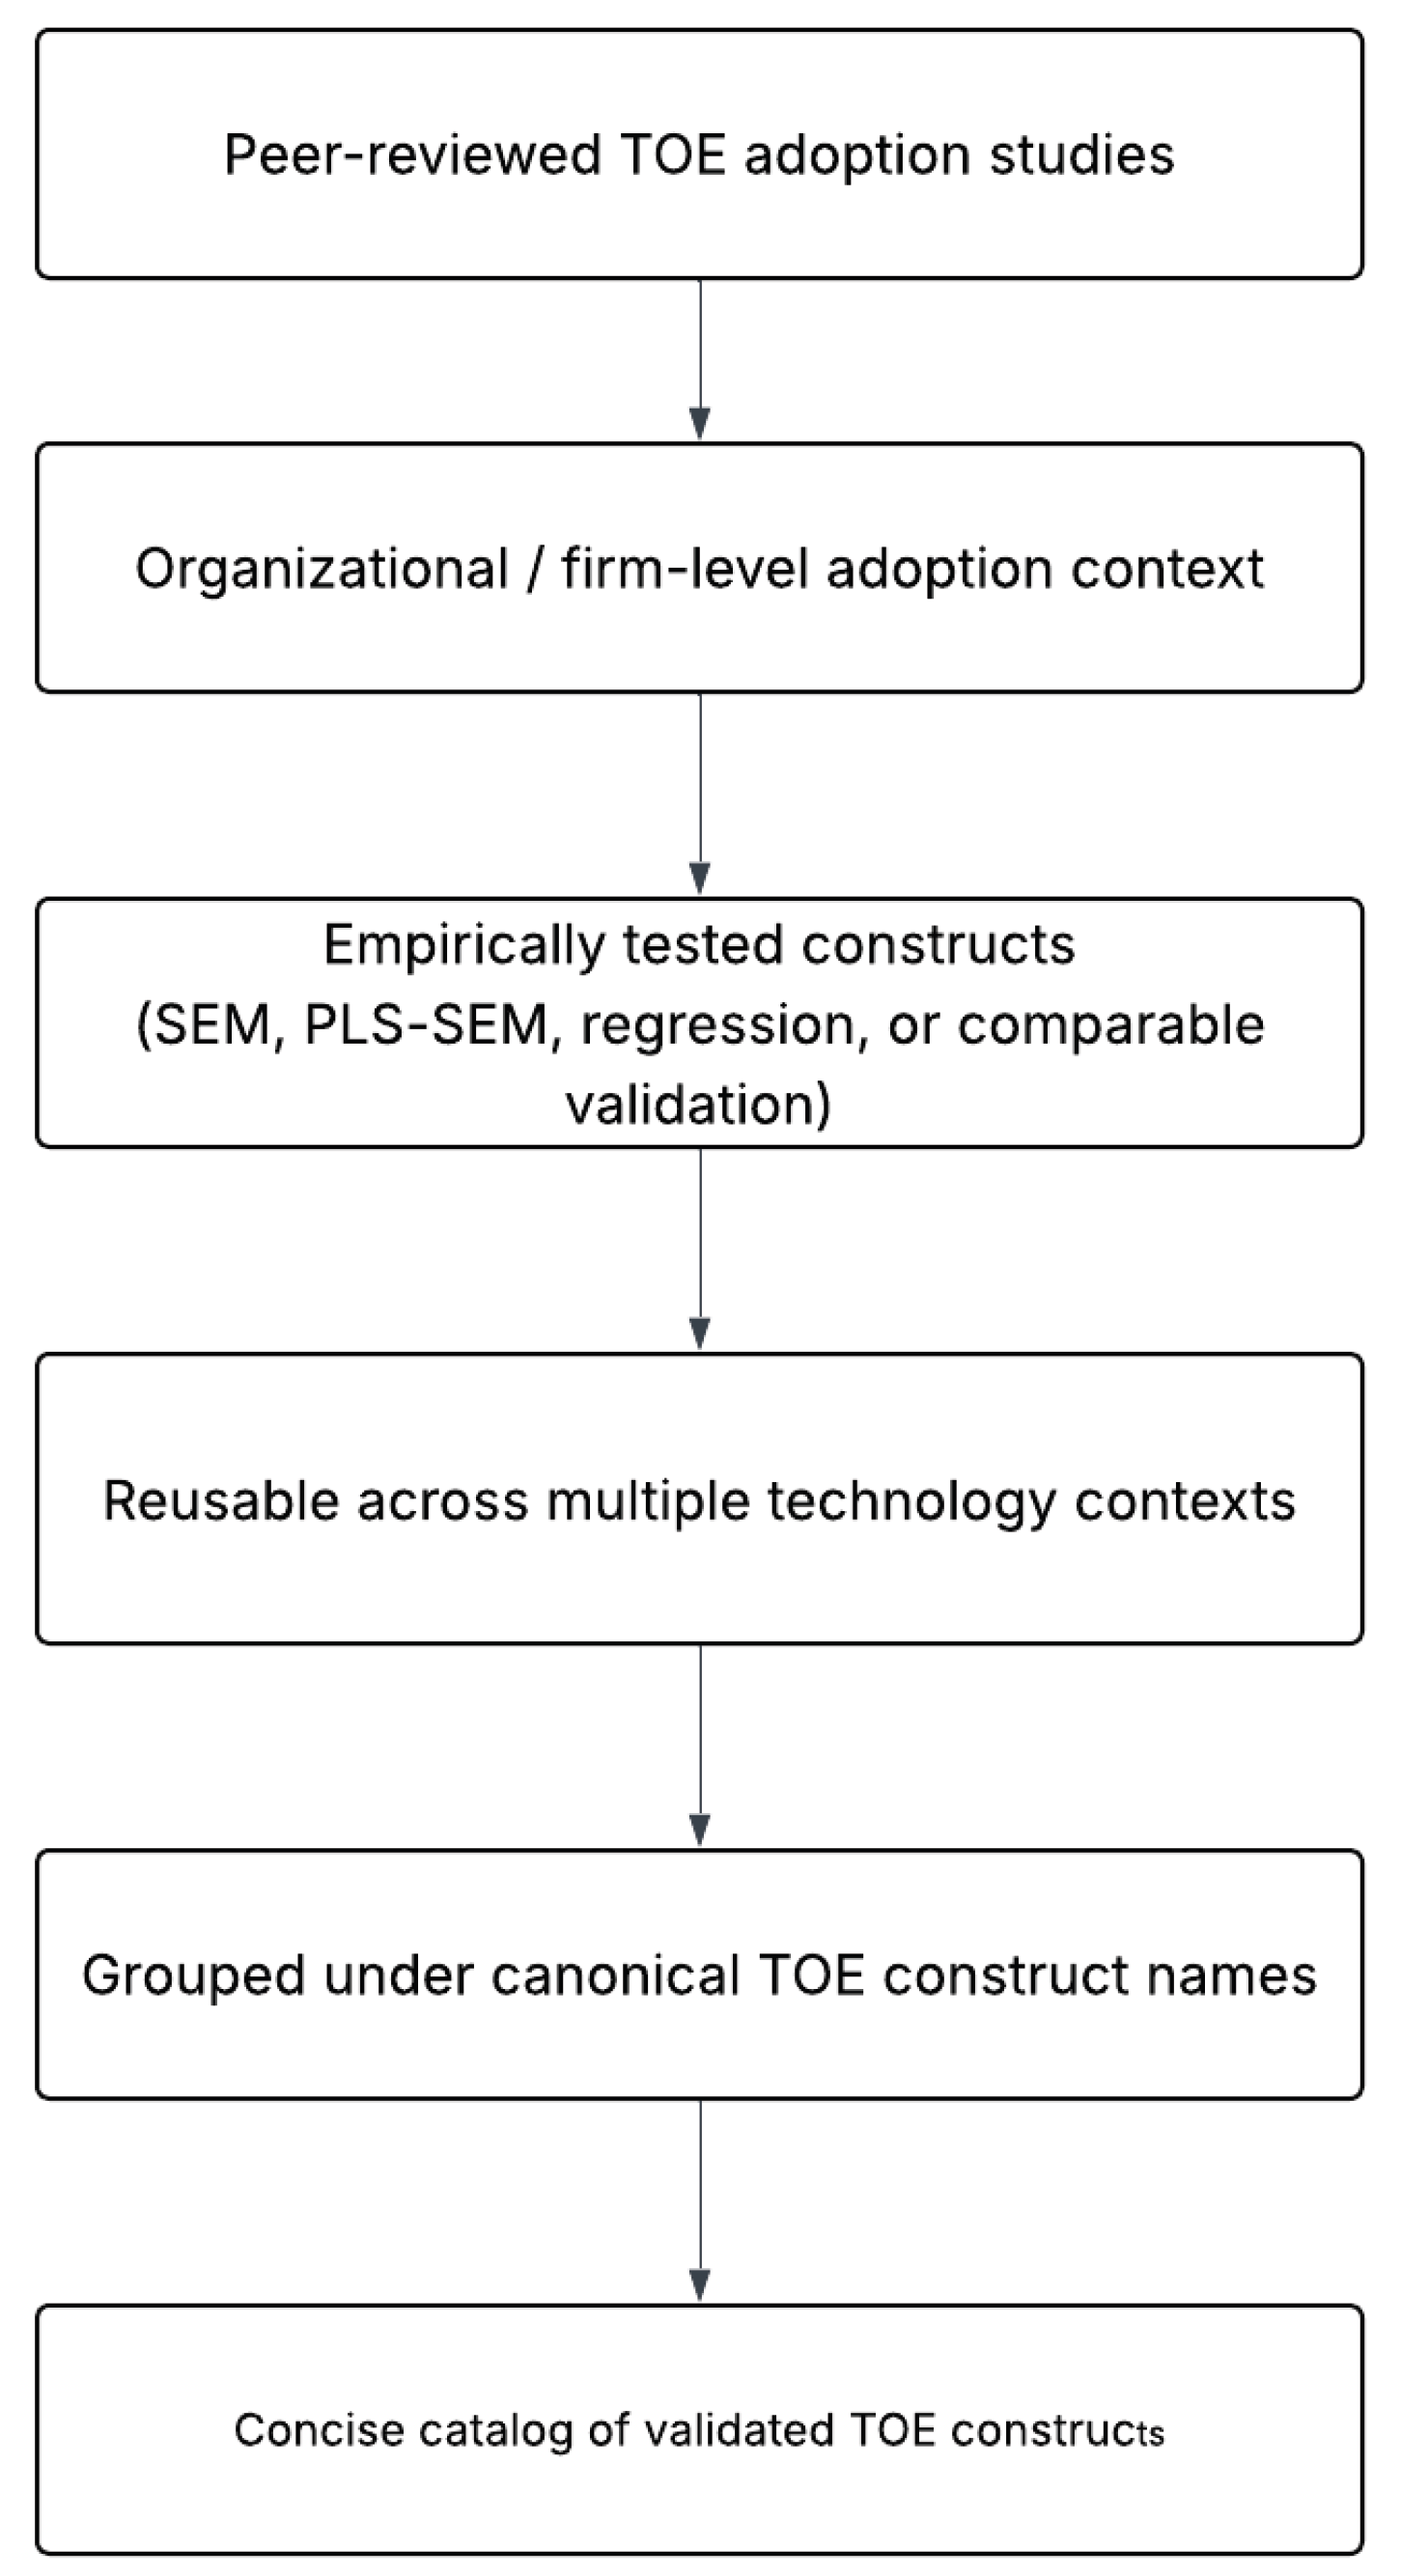
Table 1.
Catalog of reusable validated TOE constructs.
| TOE context | Reusable construct | Common aliases/consolidation rule | Core Definition and Measurement Facets | Empirical study anchors |
|---|---|---|---|---|
| Technology | Relative advantage | Perceived benefit, expected benefit, direct benefit, perceived usefulness, business value |
Core definition: Perceived net benefit of adopting the technology compared to the current state or alternative solutions. Measurement facets: operational efficiency, cost reduction, service quality improvement, competitive positioning, strategic value creation. |
(Abed, 2020; Al-Qirim, 2007; Alshamaila et al., 2013; Chatterjee et al., 2021; Chau & Tam, 1997, 2000; Chen et al., 2023; Gangwar et al., 2015; Grandon & Pearson, 2004; Gutierrez et al., 2015; Hsu et al., 2006; Iacovou et al., 1995; Ifinedo, 2011; Ilin et al., 2017; Khayer et al., 2020; Kuan & Chau, 2001; Lin & Lin, 2008; Low et al., 2011; Maroufkhani, Tseng, et al., 2020; Maroufkhani, Wan Ismail, et al., 2020; Martins et al., 2016; N’Dri & Su, 2024; Nguyen et al., 2022; Oliveira et al., 2014; Oliveira & Martins, 2010; Premkumar & Roberts, 1999; Wang et al., 2010; Zhu et al., 2006) |
| Technology | Compatibility | System fit, process fit, workflow fit, organizational compatibility, technology fit. | Core definition: Perceived alignment between the technology and the organization’s existing operational environment. Measurement facets: IT infrastructure fit, workflow and process consistency, value and belief congruence, employee work-practice alignment. | (Al-Qirim, 2007; Alshamaila et al., 2013; Awa et al., 2016; Awa & Ojiabo, 2016; Chau & Tam, 1997; Chen et al., 2023; Cruz-Jesus et al., 2019; Gangwar et al., 2015; Ifinedo, 2011; Ilin et al., 2017; Kuan & Chau, 2001; Lin & Lin, 2008; Low et al., 2011; Maroufkhani et al., 2023; Maroufkhani, Tseng, et al., 2020; Maroufkhani, Wan Ismail, et al., 2020; Martins et al., 2016; N’Dri & Su, 2024; Nguyen et al., 2022; Oliveira et al., 2014; Pan & Jang, 2008; Premkumar & Roberts, 1999; Pudjianto et al., 2011; Teo et al., 2009; Thong, 1999; Wang et al., 2010) |
| Technology | Complexity | Technical complexity, implementation difficulty, perceived difficulty, ease-of-use barrier | Core definition: Perceived difficulty of understanding, implementing, and using the technology within the organization. Measurement facets: learning difficulty, integration effort, technical skill requirements, operational maintenance burden. |
(Al-Qirim, 2007; Alshamaila et al., 2013; Awa et al., 2016; Chau & Tam, 2000; Chen et al., 2023; Gangwar et al., 2015; Ifinedo, 2011; Lian et al., 2014; Low et al., 2011; Maroufkhani et al., 2023; Maroufkhani, Tseng, et al., 2020; Maroufkhani, Wan Ismail, et al., 2020; Martins et al., 2016; Nguyen et al., 2022; Oliveira et al., 2014; Pan & Jang, 2008; Premkumar & Roberts, 1999; Skafi et al., 2020; Thong, 1999; Wang et al., 2010; Zhu et al., 2006) |
| Technology | Technology readiness | IT infrastructure, IS infrastructure, technology competence, technology integration, IT resources | Core definition: Availability and maturity of the organization’s technical infrastructure to support adoption. Measurement facets: network and hardware adequacy, software platform maturity, system integration capacity, data architecture preparedness. | (Alshamaila et al., 2013; Chau & Tam, 1997; Chen et al., 2023; Chittipaka et al., 2023; Cruz-Jesus et al., 2019; Gutierrez et al., 2015; Hsu et al., 2006; Ifinedo, 2011; Khayer et al., 2020; Lian et al., 2014; Lin & Lin, 2008; Low et al., 2011; Maroufkhani et al., 2023; Maroufkhani, Tseng, et al., 2020; Martins et al., 2016; N’Dri & Su, 2024; Ngah et al., 2017; Nguyen et al., 2022; Oliveira et al., 2014; Oliveira & Martins, 2010; Pan & Jang, 2008; Premkumar & Roberts, 1999; Pudjianto et al., 2011; Ramdani et al., 2013; Skafi et al., 2020; Teo et al., 2009; Thong, 1999; Wang et al., 2010; Zhu et al., 2006; Zhu & Kraemer, 2005) |
| Technology | Security, privacy, risk, and trust | Security concern, perceived risk, privacy concern, trust, data protection risk | Core definition: Perceived exposure to security, privacy, and reliability threats created or mitigated by adoption. Measurement facets: data breach vulnerability, customer and organizational data privacy, service reliability and continuity, trust in provider competence and integrity. | (Chen et al., 2023; Chittipaka et al., 2023; Gangwar et al., 2015; Gutierrez et al., 2015; Iacovou et al., 1995; Khayer et al., 2020; Lian et al., 2014; Low et al., 2011; Malik et al., 2021; Maroufkhani, Tseng, et al., 2020; Maroufkhani, Wan Ismail, et al., 2020; Oliveira et al., 2014; Skafi et al., 2020) |
| Organization | Top management support | Executive support, leadership commitment, senior management support, higher authority support | Core definition: Degree to which senior leadership actively champions and resources the adoption initiative. Measurement facets: executive sponsorship and advocacy, budget and resource allocation, risk tolerance and willingness to experiment, strategic priority signaling. | (Abed, 2020; Alshamaila et al., 2013; Asiaei & Ab. Rahim, 2019; Awa et al., 2016; Awa & Ojiabo, 2016; Chatterjee et al., 2021; Chau & Tam, 1997, 2000; Chen et al., 2023; Chittipaka et al., 2023; Cruz-Jesus et al., 2019; Gangwar et al., 2015; Grandon & Pearson, 2004; Gutierrez et al., 2015; Ifinedo, 2011; Ilin et al., 2017; Khayer et al., 2020; Lian et al., 2014; Lin & Lin, 2008; Low et al., 2011; Malik et al., 2021; Maroufkhani et al., 2023; Maroufkhani, Tseng, et al., 2020; Maroufkhani, Wan Ismail, et al., 2020; Martins et al., 2016; N’Dri & Su, 2024; Ngah et al., 2017; Oliveira et al., 2014; Pan & Jang, 2008; Premkumar & Roberts, 1999; Ramdani et al., 2009, 2013; Skafi et al., 2020; Teo et al., 2009; Thong, 1999; Wang et al., 2010) |
| Organization | Organizational readiness | Resource readiness, financial readiness, organizational capacity, slack resources, adequate resources | Core definition: Availability of non-technical organizational resources required to implement and sustain adoption. Measurement facets: financial resource sufficiency, managerial bandwidth, operational capacity for change, time commitment readiness. | (Alshamaila et al., 2013; Awa et al., 2016; Awa & Ojiabo, 2016; Chau & Tam, 2000; Chen et al., 2023; Chittipaka et al., 2023; Gutierrez et al., 2015; Iacovou et al., 1995; Ifinedo, 2011; Ilin et al., 2017; Khayer et al., 2020; Low et al., 2011; Maroufkhani et al., 2023; Maroufkhani, Tseng, et al., 2020; Maroufkhani, Wan Ismail, et al., 2020; Martins et al., 2016; N’Dri & Su, 2024; Ngah et al., 2017; Oliveira et al., 2014; Pudjianto et al., 2011; Ramdani et al., 2009, 2013; Skafi et al., 2020; Thong, 1999; Zhu et al., 2006) |
| Organization | Human and IT capability | IS expertise, employee capability, technical competence, training, digital skills, absorptive capability | Core definition: Capacity of employees and IT staff to evaluate, implement, and operate the technology effectively. Measurement facets: employee technical skill level, IT staff implementation expertise, training program availability, absorptive capacity for new knowledge. | (Alshamaila et al., 2013; Awa & Ojiabo, 2016; Chatterjee et al., 2021; Chau & Tam, 1997; Chen et al., 2023; Chittipaka et al., 2023; Cruz-Jesus et al., 2019; Gutierrez et al., 2015; Ifinedo, 2011; Lian et al., 2014; Lin & Lin, 2008; Low et al., 2011; Maroufkhani, Tseng, et al., 2020; Martins et al., 2016; N’Dri & Su, 2024; Oliveira et al., 2014; Pan & Jang, 2008; Premkumar & Roberts, 1999; Pudjianto et al., 2011; Thong, 1999; Wang et al., 2010; Zhu et al., 2006; Zhu & Kraemer, 2005) |
| Organization | Firm size and organizational scale | Firm size, organizational scope, global scope, firm age, structural capacity | Core definition: Organizational size or structural scope as a contextual enabler, constraint, or moderator of adoption. Measurement facets: employee count, annual revenue or turnover, number of business units or departments, geographic scope of operations. | (Abed, 2020; Alshamaila et al., 2013; Chau & Tam, 1997, 2000; Ifinedo, 2011; Ilin et al., 2017; Low et al., 2011; Maroufkhani et al., 2023; Maroufkhani, Tseng, et al., 2020; Nguyen et al., 2022; Oliveira et al., 2014; Pan & Jang, 2008; Premkumar & Roberts, 1999; Ramdani et al., 2009, 2013; Teo et al., 2009; Thong, 1999; Wang et al., 2010; Zhu et al., 2006; Zhu & Kraemer, 2005) |
| Organization | Culture and innovation readiness | Organizational culture, innovation orientation, digital culture, entrepreneurial orientation, change readiness | Core definition: Organizational willingness to innovate, experiment, and accept process change associated with new technology. Measurement facets: innovation orientation, tolerance for experimentation and risk, openness to new work routines, entrepreneurial or change-oriented leadership norms. | (Al-Qirim, 2007; Asiaei & Ab. Rahim, 2019; Chatterjee et al., 2021; Gangwar et al., 2015; Ifinedo, 2011; Ilin et al., 2017; N’Dri & Su, 2024; Nguyen et al., 2022; Ramdani et al., 2009; Thong, 1999) |
| Environment | Competitive pressure | Rivalry pressure, market pressure, industry pressure, competition intensity | Core definition: Pressure from market rivalry or industry dynamics that makes adoption strategically necessary. Measurement facets: competitor adoption activity, perceived competitive disadvantage from non-adoption, industry-wide adoption momentum, market expectation intensity. | (Abed, 2020; Al-Qirim, 2007; Alshamaila et al., 2013; Asiaei & Ab. Rahim, 2019; Awa & Ojiabo, 2016; Chau & Tam, 2000; Chen et al., 2023; Chittipaka et al., 2023; Gangwar et al., 2015; Gutierrez et al., 2015; Hsu et al., 2006; Iacovou et al., 1995; Ifinedo, 2011; Ilin et al., 2017; Khayer et al., 2020; Kuan & Chau, 2001; Lin & Lin, 2008; Low et al., 2011; Malik et al., 2021; Maroufkhani, Tseng, et al., 2020; Maroufkhani, Wan Ismail, et al., 2020; N’Dri & Su, 2024; Nguyen et al., 2022; Oliveira et al., 2014; Premkumar & Roberts, 1999; Pudjianto et al., 2011; Ramdani et al., 2013; Teo et al., 2009; Wang et al., 2010; Zhu et al., 2006; Zhu & Kraemer, 2005) |
| Environment | External stakeholder pressure |
Trading partner pressure, customer pressure, supplier pressure, partner influence, ecosystem pressure | Core definition: Pressure from customers, suppliers, partners, or ecosystem actors to adopt the technology. Measurement facets: customer demand or expectation, supplier or trading partner requirements, business partner recommendations, platform or ecosystem dependency. | (Abed, 2020; Al-Qirim, 2007; Alshamaila et al., 2013; Awa et al., 2016; Chau & Tam, 2000; Chen et al., 2023; Gangwar et al., 2015; Grandon & Pearson, 2004; Gutierrez et al., 2015; Hsu et al., 2006; Iacovou et al., 1995; Ifinedo, 2011; Ilin et al., 2017; Low et al., 2011; Malik et al., 2021; Nguyen et al., 2022; Oliveira et al., 2014; Oliveira & Martins, 2010; Premkumar & Roberts, 1999; Pudjianto et al., 2011; Ramdani et al., 2013; Skafi et al., 2020; Teo et al., 2009; Zhu et al., 2006) |
| Environment | Government, regulatory, and legal pressure | Government pressure, regulatory environment, legal framework, compliance pressure, policy support | Core definition: Influence of laws, regulations, government programs, or compliance requirements on adoption decisions. Measurement facets: regulatory mandate or compliance obligation, government incentive or subsidy availability, legal framework clarity, public policy support or promotion. | (Alshamaila et al., 2013; Asiaei & Ab. Rahim, 2019; Awa et al., 2016; Awa & Ojiabo, 2016; Chau & Tam, 2000; Chen et al., 2023; Chittipaka et al., 2023; Gangwar et al., 2015; Gutierrez et al., 2015; Hsu et al., 2006; Ifinedo, 2011; Ilin et al., 2017; Low et al., 2011; Malik et al., 2021; Maroufkhani, Tseng, et al., 2020; Maroufkhani, Wan Ismail, et al., 2020; N’Dri & Su, 2024; Nguyen et al., 2022; Oliveira et al., 2014; Oliveira & Martins, 2010; Pan & Jang, 2008; Pudjianto et al., 2011; Skafi et al., 2020; Wang et al., 2010; Zhu et al., 2006; Zhu & Kraemer, 2005) |
| Environment | Vendor and provider support | External support, provider support, consultant support, technology partner support, service support | Core definition: Availability of external expertise and service support to facilitate implementation and ongoing use. Measurement facets: vendor technical assistance, consultant or partner availability, training and onboarding support, post-implementation maintenance and updates. | (Alshamaila et al., 2013; Asiaei & Ab. Rahim, 2019; Awa et al., 2016; Awa & Ojiabo, 2016; Chau & Tam, 2000; Chen et al., 2023; Chittipaka et al., 2023; Cruz-Jesus et al., 2019; Gangwar et al., 2015; Gutierrez et al., 2015; Iacovou et al., 1995; Ifinedo, 2011; Ilin et al., 2017; Khayer et al., 2020; Lian et al., 2014; Low et al., 2011; Maroufkhani et al., 2023; Maroufkhani, Wan Ismail, et al., 2020; Martins et al., 2016; Ngah et al., 2017; Oliveira et al., 2014; Pan & Jang, 2008; Premkumar & Roberts, 1999; Pudjianto et al., 2011; Ramdani et al., 2013; Skafi et al., 2020; Wang et al., 2010) |
Disclaimer/Publisher’s Note: The statements, opinions and data contained in all publications are solely those of the individual author(s) and contributor(s) and not of MDPI and/or the editor(s). MDPI and/or the editor(s) disclaim responsibility for any injury to people or property resulting from any ideas, methods, instructions or products referred to in the content. |
© 2026 by the authors. Licensee MDPI, Basel, Switzerland. This article is an open access article distributed under the terms and conditions of the Creative Commons Attribution (CC BY) license (http://creativecommons.org/licenses/by/4.0/).
Copyright: This open access article is published under a Creative Commons CC BY 4.0 license, which permit the free download, distribution, and reuse, provided that the author and preprint are cited in any reuse.


