
Submitted:
26 May 2026
Posted:
27 May 2026
You are already at the latest version
Abstract
Coastlines possess significant ecological and resource values, which are intricately associated with marine ecological civilization, the marine green economy, and coastal well-being. Comprehending the spatiotemporal variations and driving mechanisms of coastlines is of great significance for their effective protection, rational utilization, and sustainable development. In this study, we employed ArcGIS to extract the coastline vectors of Huizhou in 1973, 1988, 2003, and 2019 based on multi-source remote sensing and unmanned aerial vehicle (UAV) images. The coastline location and type (CLT) model was proposed to differentiate four coastline types, namely the sets of coastline segments with invariant locations and types (SCA), the sets of coastline segments with invariant locations but altered types (SCB), the sets of coastline segments with changed locations but invariant types (SCC), and the sets of coastline segments with both changed locations and types (SCD). Subsequently, the spatio-temporal evolution and disturbance factors of these coastline types were analyzed, offering a diversified foundation for quantitative coastline analysis. The results indicate that total length of Huizhou coastlines increased from 248.75 km in 1973 to 260.82 km in 2019, with natural coastlines decreasing by 62.86 km and artificial coastlines increasing by 75.21 km. The length and proportion of SCA exhibited a continuous decline, decreasing from 79.66% in the initial stage to 58% in the final stage. Conversely, the lengths of SCB, SCC, and SCD all witnessed a continuous increase. The coastline disturbance index (CDI) of Huizhou exhibited a continuous upward trend, escalating from 20.34% to 30.95% and further to 42.00%. This phenomenon was primarily propelled by land reclamation and aquaculture enclosures, accompanied by distinct regional disparities. The coastline alterations were concentrated in regions such as the Daya Bay Petrochemical Zone, Fanhe Port, Kaozhouyang Bay, Xiaogui Village, and Quanwan Port. Meanwhile, the CDI of aquaculture reclamation witnessed a continuous decline, whereas the CDI of land reclamation showed a continuous increase. The natural environment of Huizhou, including its topographical, geomorphological, and hydrological characteristics, serves as the basis for coastline evolution. Meanwhile, social and economic development, along with policies, are significant driving forces for coastline evolution. These findings offer a solid scientific foundation for the management of coastal zones in Huizhou.
Keywords:
coastline
; location and type model
; spatio-temporal evolution
; Huizhou
1. Introduction
Geographically, the coastline is defined as the demarcation line between land and sea established at the multi-year mean high spring tide, and it is recognized as one of the 27 surface elements by the International Geographical Data Commission [1]. The coastline and its adjacent marine areas function as crucial spatial platforms for production and human activities in coastal regions. Research has indicated that over half of the global population is located in coastal zones [2,3]. As the frontline of the interaction between the coast and the ocean, the coastline experiences dynamic and continuous evolution. Its morphological alterations mirror the combined intensity of natural, economic, and social forces [4], and are closely associated with the production and daily lives of coastal inhabitants.
Influenced by the combined impacts of natural and anthropogenic factors, coastlines manifest two opposing trends: coastal erosion and seaward expansion [5]. On a global scale, 70% of coastlines are afflicted by long-term erosion [6]. This includes shorelines in specific regions and countries, such as the Hawaiian Islands of the United States [7], Italy [8], Turkey [9] and India [6]. Coastal erosion poses a threat to coastal ecosystems, leading to habitat loss and a decline in biodiversity[10]. It also imposes significant risks on human communities by damaging infrastructure and causing population displacement [11]. Moreover, it has far-reaching economic implications, which undermines the tourism, agriculture, and fisheries sectors, thus impeding people's livelihoods and regional economic development [12]. Artificially modifying shorelines and seaward expansion of shorelines also present unprecedented challenges to the coastal ecological environment. Industrial, aquacultural, and domestic wastewater has resulted in significant seawater eutrophication, while the construction of large-scale seawalls has led to land subsidence and wetland degradation. Coastal reclamation projects have encroached upon the breeding and habitat areas of aquatic and wetland flora and fauna [13,14,15].
There are a multitude of factors influencing coastline changes, encompassing global environmental processes like climate change and sea-level rise [16,17], along with coastal processes typified by marine dynamics and local climate variability [18,19,20]. Simultaneously, coastline evolution is also significantly affected by human activities, such as land reclamation, aquaculture enclosure, tidal flat enclosure for farmland and coastal protection projects [21,22,23].
Historically, natural factors have been the dominant drivers of coastline shifts, whereas in recent decades, human activities have emerged as the primary impetus for coastal variations [24]. Lotze's research indicated that anthropogenic activities have led to the degradation and loss of over 90% of the dominant native species, inflicted damage on more than 65% of seagrass beds and coastal wetlands, deteriorated water quality, and facilitated the expansion of invasive speces [25]. In Japan, the coastal low-lying areas have undergone high-intensity development, leading to the extensive artificial alteration of most coastlines. By 1992, approximately 30% of Japan's coastline had been outfitted with various artificial protective structures [26]. In Sydney Harbour, roughly 50% of the shoreline consists of retaining seawalls or other constructed habitats [27]. From 1990 to 2018, Indonesia's natural coastline witnessed a reduction of 5995.52 km, whereas its artificial coastline experienced a significant increase of 6771.92 km [28]. Between 1990 and 2015, the aggregate length of the coastlines of more than 9,000 islands in Southeast Asia witnessed an increment of 821 km. The length of natural coastlines experienced a reduction of 4238 km, whereas artificial coastlines underwent an expansion of 5059 km[29]. The Chinese mainland is characterized by an extensive coastline. In recent decades, intensive human activities along the coastal regions have led to significant changes in the coastline. Research has demonstrated that over 68% of China's coastlines display a seaward expansion tendency [5]. From 1979 to 2014, the total area of coastal reclamation in mainland China reached 11162.89 km²[30]. The coastal wetlands in the three major economic zones, namely the Bohai Bay, the Yangtze River Delta, and the Pearl River Delta, have undergone the most intense sea-reclamation activities [31,32,33]. Statistical analyses suggest that from 1950 to 2014, large-scale areas of China's coastal wetlands were degraded or destroyed as a result of natural disasters and anthropogenic interferences [34,35].The cumulative loss of coastal wetlands in China has approximated 8.01×10⁶ ha, accounting for approximately 58% of the original total coastal wetland area. Among these alterations, 70%-82% of wetland degradation can be ascribed to coastal reclamation and coastal infrastructure development [36,37].
In conclusion, global issues, including coastline artificialization, coastal erosion, beach degradation, and coastal wetland deterioration, have become increasingly prominent. These issues not only give rise to a series of eco-environmental challenges but also result in a shortage of exploitable coastline and offshore marine area reserve resources. Therefore, investigating regional coastline changes contributes to a deeper understanding of human activities and ecological processes in the coastal zone. It holds significant importance for the protection of coastline and tidal flat resources, the balance between socio-economic development and ecological environmental protection, and the promotion of sustainable development in coastal zones. Simultaneously, it can also offer a scientific foundation for administrative management and decision - making departments.
Precise coastline mapping serves as the cornerstone for probing into the spatiotemporal evolution patterns and driving mechanisms of coastlines. Conventional field survey methods employed for coastline measurement are characterized by high costs and intensive labor, and have gradually been supplanted by remote sensing and geographic information technologies [38]. The integration of spatial modeling with remote sensing interpretation and Geographic Information System (GIS) spatial analysis has emerged as an efficient and accurate technical approach for long-term sequence and large-scale coastline change monitoring, as well as the quantitative assessment of coastal erosion. This approach can effectively surmount the limitations of traditional field investigations, such as low efficiency and restricted coverage [39].
Currently, research on the characteristics of coastline change monitoring primarily focuses on alterations in coastline length, positional displacement, land-use type transformation, morphological evolution, and land-sea spatial replacement enclosed by coastlines [40]. Different change characteristics can be quantitatively analyzed through corresponding models and algorithms. Specifically, the variation in coastline length can be analyzed by means of the ‘Length Change Intensity’ method [41], positional displacement can be examined using the ‘End Point Rate’ method [42], land-use type transformation can be evaluated via the ‘Type Changing Rate’ method [23], morphological evolution can be analyzed through the ‘Fractal Dimension’ method [43,44] and land-sea spatial replacement enclosed by coastlines can be measured by the area method [45]. Coastline change monitoring is closely associated with driving factor analysis. Coastline change monitoring reflects external intuitive manifestations, whereas driving factor analysis delves into the internal evolutionary mechanism. Current research on coastline driving factors is mostly concentrated at the regional scale, such as bay, municipal, provincial, and national levels. There are relatively few studies exploring driving mechanisms at the coastline segment scale, which poses challenges to realizing refined analysis of coastline evolution characteristics.
In light of the limitations in the existing research on the spatiotemporal evolution and driving mechanisms of local coastlines, this paper establishes a coastline location and type (CLT) model. The model classifies coastline segments into four categories: the sets of coastline segments with invariant locations and types (SCA), the sets of coastline segments with invariant locations but altered types (SCB), the sets of coastline segments with changed locations but invariant types (SCC), and the sets of coastline segments with both changed locations and types (SCD). Based on this, taking Huizhou in Guangdong Province as the study area, this paper conducts a segment-by- segment analysis of the spatiotemporal evolution characteristics and driving factors of the four types of coastlines in Huizhou. It offers a multi-dimensional analytical perspective for the quantitative research on coastline evolution. This study aims to provide scientific support for the protection, restoration, and utilization of coastlines in coastal cities, and offer references for coastal governance and management.
2. Materials and Methods
2.1. Study Area
Huizhou is situated in the eastern region of the Guangdong-Hong Kong-Macao Greater Bay Area and stands as a significant coastal city in Guangdong Province. Huizhou administers two coastal counties and districts, specifically Huiyang District and Huidong County. Over the past several decades, it has emerged as an integral part of the Guangdong-Hong Kong-Macao Greater Bay Area. Huizhou boasts a long and continuous coastline, characterized by diverse types and complex structures. The natural coastline primarily consists of sandy, rocky shorelines, whereas muddy shorelines, estuarine shorelines, and biological shorelines are only sporadically distributed in certain areas. Artificial shorelines are mainly concentrated in Kaozhouyang, Fanhe Port, Dayawan Petrochemical Zone, and Quanwan Port Area.
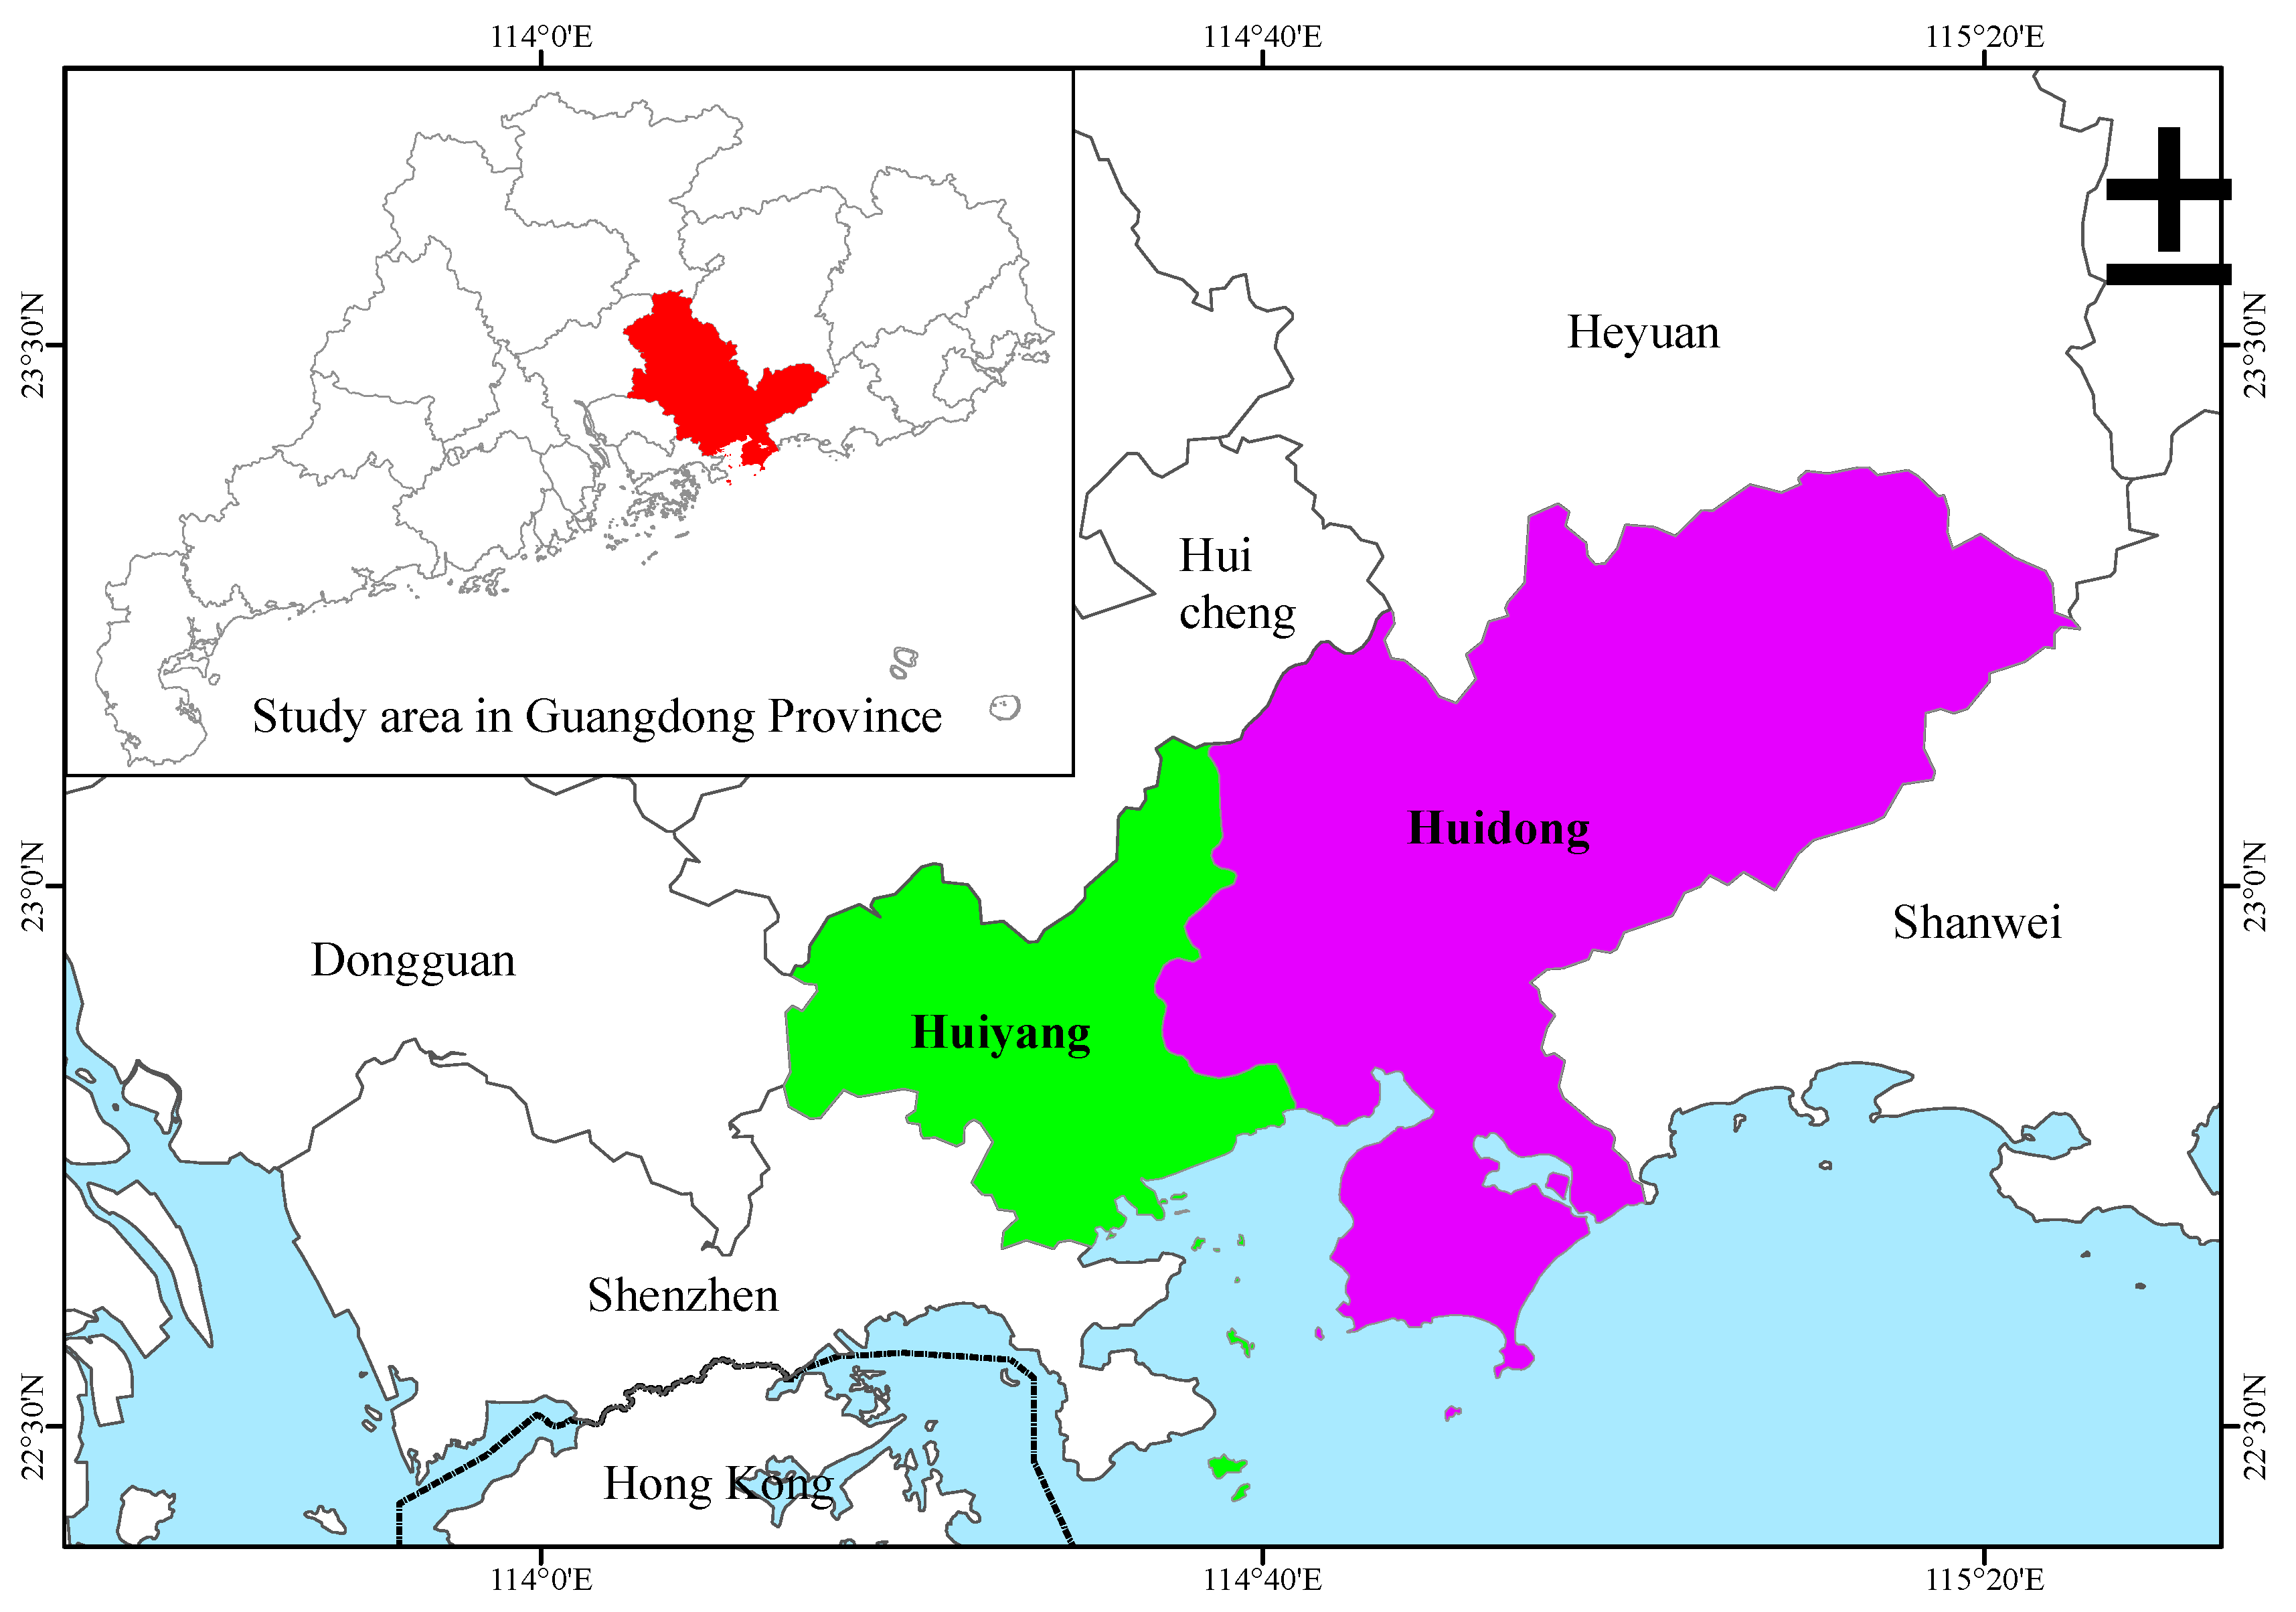
Figure 1.
The geographic location of study area.
2.2. Data Sources
In this research, a combination of Landsat, Spot, GaoFen, and UAV data was employed as the primary data source (Table 1). Landsat images were retrieved from the Geospatial Data Cloud website (www.gscloud.cn). The GaoFen data were obtained from the China Global Earth Observation System of Systems (GEOSS) Data Sharing Network website (https://noda.ac.cn). The Spot images were procured, and the UAV data were collected on-site in October 2019. These satellite data cover four approximately equal time intervals during the period from 1973 to 2019.
To guarantee spatial and spectral consistency, radiometric calibration, mosaic merging, and geometric correction were applied to the remote-sensing data.
2.3. Coastline Extraction
The types of the coastline were determined in line with the "Technical Regulations for the Survey and Measurement of the National Coastline" as artificial coastline, natural coastline (rocky coastline, sandy coastline, biological coastline, muddy coastline), and river coastline. The remote sensing interpretation signs are presented in Table 2 [46].
Employing ArcGIS software and the human-computer interaction interpretation approach, coastlines were extracted from the images. To guarantee the accuracy of the coastline location, the 2019 GF-1 remote sensing image with the highest precision was utilized as the foundation, in combination with the on-site measurement points, to extract the 2019 coastline. Based on the UAV images collected in 2019, the type of the coastline was ascertained. Subsequently, based on the extraction results of 2019, the position and type of the coastline were rectified to acquire the coastline data of the other three periods.
2.4. The Coastline Location and Type Model
2.4.1. Definition
Let be the coastline of the previous period, and be the coastline of the subsequent period. Subsequently, two sets and can be respectively acquired via a series of operations using GIS software. Herein, and represent SCA; and denote SCB; and indicate SCC; and and refer to SCD during periods t and T, respectively.
These sets fulfill the subsequent conditions: for any coastline segment , , , that meets , , ,; for any coastline segment , , , that satisfies , , , ; for the set of coastline segments , , , that comply with , , , and for , , satisfying ; for the set of coastline segments , , , that meets ,,, and , ,satisfying .
In the aforementioned formula, Len() and Area() represent the formulas employed for calculating the length and area, respectively. Type() refers to the formula utilized for acquiring the type of the coastline segment. dom() signifies the area encircled by the coastline segments.
As previously stated, the approach for deriving the sets of coastline segments and from the sets of coastlines and during the time periods t and T is referred to as theCLT model.
The CLT model is commonly employed to analyze the positional and attribute alterations of the subsequent coastline based on the previous coastline. Taking the subsequent coastline as an instance, it can be ascertained that the set is the collection of coastline segments with unaltered locations in , the set is the collection of coastline segments with modified locations in , the set is the collection of coastline segments with unchanged types in , and the set is the collection of coastline segments with changed types in .
2.4.2. Implementation with the ArcGIS
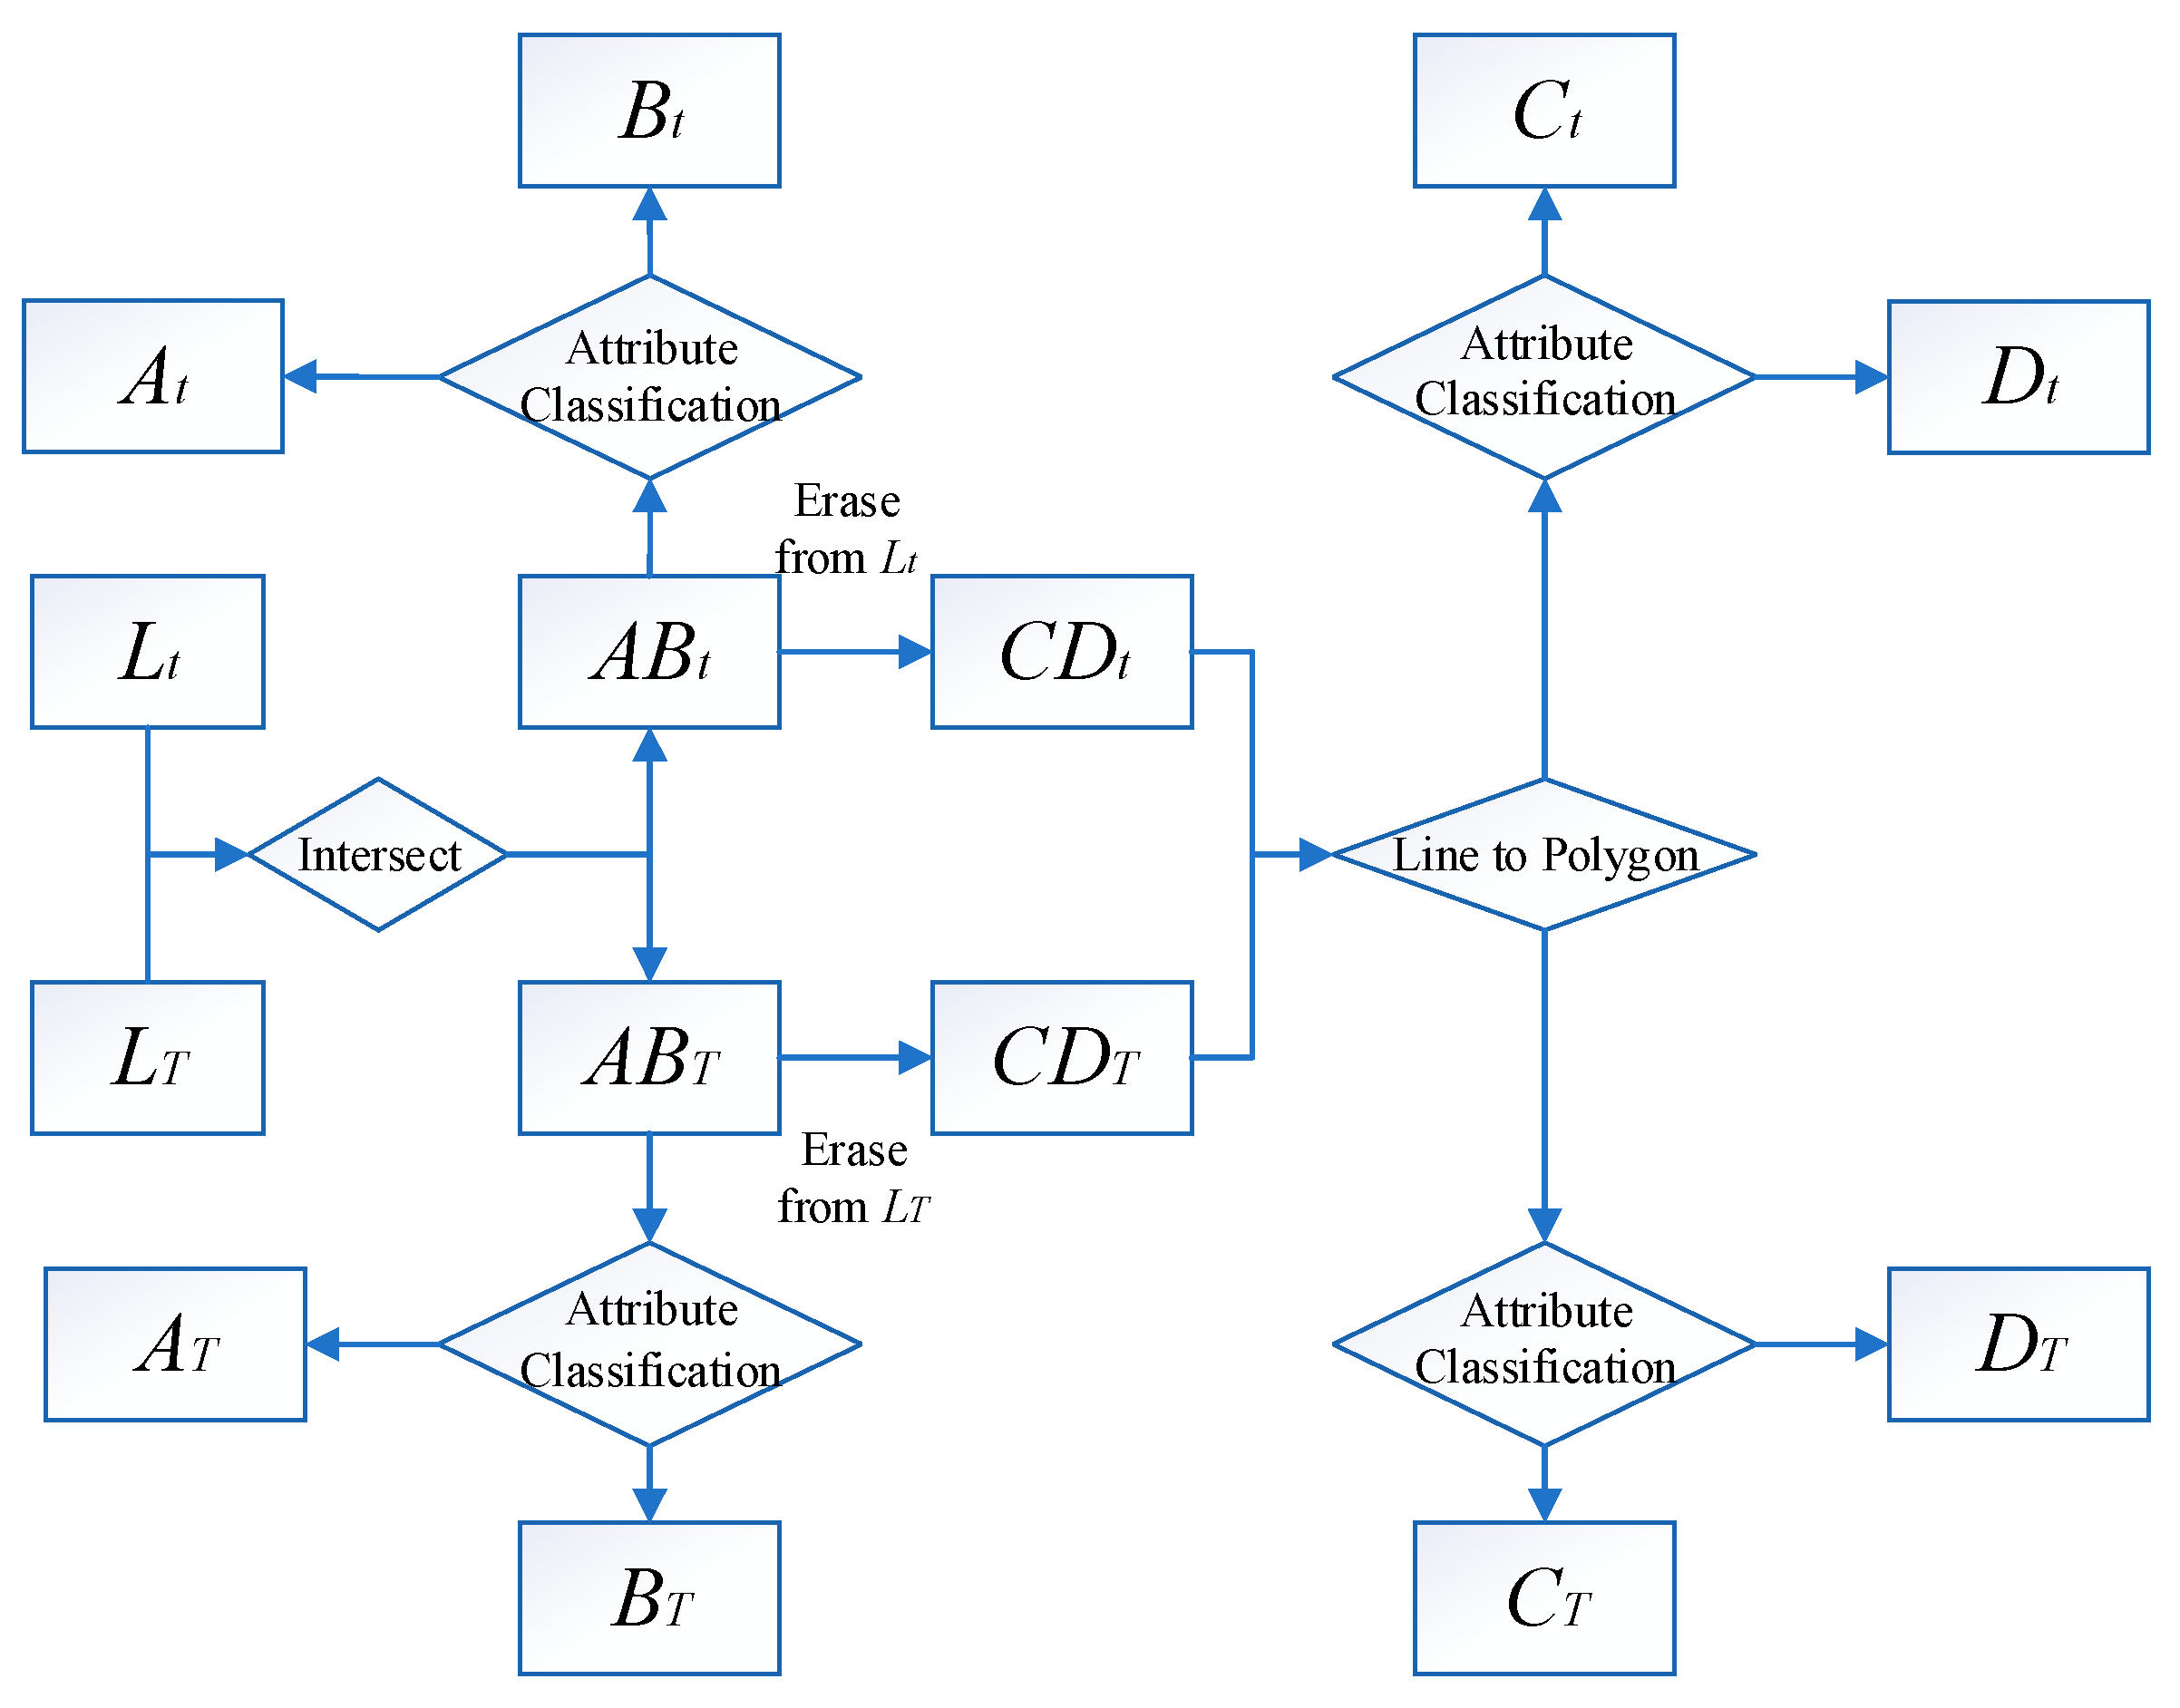
ArcGIS is a comprehensive geospatial platform designed for professionals and organizations, developed by ESRI (Environmental Systems Research Institute, Inc.). The implementation of the CLT model can be achieved based on ArcGIS as follows:
Let and be two feature layers of coastlines. Each layer is equipped with an attribute table that documents information such as coastline types and coastline lengths.
Step 1: Conduct an intersection operation between and using the Intersect tool in ArcGIS to obtain a feature layer that contains a set of feature elements. Each feature element in represents a coastline segment where the locations of and coincide. In the attribute table of , each record comprises two fields, namely TYPE_Lt and TYPE_LT, which respectively document the coastline types of and .
Step 2: Employing the Attribute Calculator function in ArcGIS to compute the record values of the TYPE_Lt and TYPE_LT fields, the sets of coastline segments characterized by identical record values are exported as feature layer and . These represent the sets of coastline segments where both the position and the type of the coastline remain unchanged across the two periods. Conversely, the sets with distinct record values are output as feature layer and , which signify the sets of coastline segments with unaltered positions but changed types during the two periods.
Step 3: Employing the Erase tool in ArcGIS to eliminate and from , the sets of previous coastline segments with modified locations are exported as feature layer . Subsequently, erasing and from to generate the feature layer denoting the subsequent coastline layer with modified locations.
Step 4: The Merge tool in ArcGIS is employed to integrate the feature layer and , yielding a linear feature layer denoted as CD_T. For the coastline segments with non-connected endpoints in CD_T, auxiliary lines are constructed to form a closed area. Then, the Line to Polygon function in ArcGIS is utilized to convert the vector data CD_T into a polygon feature layer S_CD_T, which represents a collection of polygonal areas where the position of the coastline has undergone changes. Each face is assigned a unique identification ID value.
Step 5: The Spatial Join tool in ArcGIS is employed to establish the spatial association between , , and S_CD t_T. Specifically, the coastline segments in and that belong to the same face will possess the same ID value. Subsequently, the Attribute Summary function in ArcGIS is utilized to analyze the types of the coastline segments in and with identical ID values. If the types of all coastline segments are consistent, the feature layer and , namely the collection of coastline segments with altered positions but unchanged type, are outputted; otherwise, the feature layer and , that is, the collection of coastline segments with changde positions and types, are outputted.
2.5. Coastline Disturbance Index
2.5.1. Definition
The location and type of the coastline are not static. Over an extended period, the location or type of the coastline may undergo alterations owing to anthropogenic factors (e.g., land reclamation, reclamation for agricultural purposes, and sea enclosure for aquaculture) or natural factors (e.g., coastal erosion or sedimentation induced by marine dynamics and extreme weather events). To investigate the causes of the location and changes of the coastline in a specific region, we introduce the concept of the Coastline Disturbance Index (CDI) in conjunction with the CLT model.
The CDI represents the ratio of the length of the coastline in the current period that has undergone changes due to factors such as land reclamation and natural erosion, in comparison to the coastline of the previous period. The corresponding formula is presented as follows:
where R represents the CDI, ,, and represent SCA, SCB, SCC, SCD in the later period, respectively, denotes the set of coastline segments within that have undergone a change in type as a result of a specific factor or some factors, represents the set of coastline segments in that have experienced a positional change owing to a certain factor or some factors, signifies the set of coastline segments in that have altered in both position and type due to a particular factor or some factors.
R=(len(Br)+ len(Cr)+ len(Dr))/( len(AT)+ len(BT)+ len(CT)+ len(DT))
2.5.2. Influencing Factors
To elucidate the factors influencing the positional and typological changes of the coastline, the coastlines of Huizhou during three periods (1973 - 1988, 1988 - 2004, and 2004 - 2019) were superimposed with the corresponding remote-sensing images, and the influencing factors for each shore segment were identified. The factors affecting coastline disturbance ultimately include coastal beach restoration, artificial facility construction, artificial facility damage, land excavation for marine use, aquaculture enclosure, land reclamation, natural erosion, and natural accretion.

Table 3.
Influencing factors for the spatiotemporal evolution of coastlines in Huizhou.
| Type | Influencing factors | Characteristics |
|---|---|---|
| F1 | Coastal beach restoration | The formation of sandy or biological coasts with well-defined beach surfaces, mainly through beach nourishment or the artificial planting of mangroves offshore of embankments. |
| F2 | Artificial facility construction | The development of coastal infrastructure including sluices, bridges, roads, and embankments. |
| F3 | Artificial facility damage | The deterioration of coastal infrastructure (e.g., roads, embankments) resulting from anthropogenic or natural factors. |
| F4 | Land excavation for marine use | The excavation of existing land areas for applications such as harbor basins. |
| F5 | Aquaculture enclosure | The practice of enclosing sea areas by means of dikes for the purpose of fishery cultivation. |
| F6 | Land reclamation | The act of enclosing sea areas with dikes and filling them to form new land |
| F7 | Natural erosion | The gradual erosion of sandy or muddy beach surfaces caused by long-term hydrodynamically induced coastal erosion. |
| F8 | Natural accretion | The formation of sandy or muddy coasts with well - defined beach surfaces through long - term sediment accumulation on artificial coasts driven by hydrodynamics. |
| F9 | Comprehensive Causes | A combination of one or more of the aforementioned scenarios |
3. Results
For the sake of presentation convenience, the three periods spanning from 1973 to 1988, from 1988 to 2003, and from 2003 to 2019 are respectively denoted as the early, intermediate, and late periods.
3.1. Spatial–Temporal Change in Coastline
Figure 3 depicts the dynamic evolution of the coastline within the study area from 1973 to 2019. Over the study period, notable spatiotemporal alterations were detected. In 1973, the aggregate length of the coastline was 248.75 km, consisting of 176.69 km (71.03%) of natural coastlines, 70.79 km (28.46%) of artificial coastlines, and 1.27 km (0.51%) of river coastlines. By 1997, the overall length of the coastline had increased to 250.66 km. Nevertheless, the length of the natural coastline decreased to 156.02 km (62.24%), and the river coastline decreased to 1.13 km (0.45%), while the artificial coastline expanded to 93.51 km (37.31%). In 2004, the total length of the coastline significantly decreased to 258.73 km. The natural coastlines further declined to 122.14 km (47.21%), and the river coastline declined to 1.08 km (0.42%). Conversely, the artificial coastline surged to 135.51 km (52.37%). By 2019, the total length of the coastline had expanded to 260.82 km. During this period, the natural coastlines experienced a slight reduction to 113.83 km (43.64%), and the river coastline continuously declined to 0.99 km ((0.38%). In contrast, the artificial coastlines slightly grew to 146 km (55.98%).
3.2. Analysis of Factors Affecting the Coastline
In 1988, the lengths of SCA, SCB, SCC, and SDC were 199.67 km, 0.66 km, 27.61 km, and 22.72 km, respectively. The CDI was 20.34%. The factors influencing the coastline changes in 1988 included the construction of artificial facility construction, aquaculture enclosure, land reclamation, and natural accretion, with the CDIs of each factor being 0.26%, 16.64%, 0.12%, and 3.31% respectively. Aquaculture enclosure was the primary cause of coastline changes during this period, and the affected coastline segments were mainly concentrated along the coast of Kaozhouyang.
In 2004, the lengths of SCA, SCB, SCC, and SDC were 178.66 km, 4.22 km, 30.14 km and 45.71 km, respectively. The CDI was 30.95%. The factors influencing the coastline changes in 2004 included the artificial facility construction, artificial facility damage, aquaculture enclosure, land reclamation, natural erosion, natural accretion, and other causes. The CDIs of each factor were 0.81%, 0.30%, 7.53%, 17.25%, 0.82%, 2.35%, and 1.89% respectively. Land reclamation, as well as aquaculture enclosure, were the main causes of coastline changes during this period. The coastline segments affected by land reclamation were mainly concentrated in the Daya Bay Petrochemical Zone, Quanwan Port, and the Xiaogui Village, while those affected by aquaculture enclosure were mainly concentrated along the coast of Kaozhouyang and the south bank of Fanhe Port.
In 2019, the lengths of SCA, SCB, SCC, and SDC were 151.28 km, 8.19 km, 72.18 km, and 29.17 km, respectively. The CDI was 42%. The factors influencing the coastline changes in 2019 included coastal beach restoration, artificial facility construction, artificial facility damage, land excavation for marine use, aquaculture enclosure, land reclamation, natural erosion, natural accretion, and other causes. The CDIs of each factor were 3.95%, 5.54%, 0.82%, 1.19%, 1.38%, 23.13%, 2.65%, 2.70%, and 0.65% respectively. Land reclamation was the main cause of coastline changes during this period, and the affected coastline segments were mainly concentrated along the coast of the Daya Bay Petrochemical Zone, Quanwan Port, Fanhe Port, and the Xiaogui Port Village.
Table 4.
The length and CDI for the four types of coastlines in Huizhou (km).
| Period | Type/CDI | F1 | F2 | F3 | F4 | F5 | F6 | F7 | F8 | F9 | sum |
|---|---|---|---|---|---|---|---|---|---|---|---|
| Early | B | 0 | 0.66 | 0 | 0 | 0 | 0 | 0 | 0 | 0 | 0.66 |
| C | 0 | 0 | 0 | 0 | 19.31 | 0 | 0 | 8.3 | 0 | 27.61 | |
| D | 0 | 0 | 0 | 0 | 22.41 | 0.31 | 0 | 0 | 0 | 22.72 | |
| sum | 0 | 0.66 | 0 | 0 | 41.72 | 0.31 | 0 | 8.3 | 0 | 50.99 | |
| CDI | 0 | 0.26% | 0 | 0 | 16.64% | 0.12% | 0 | 3.31% | 0 | 20.34% | |
| Intermediate | B | 0 | 2.1 | 0 | 0 | 0 | 0 | 2.12 | 0 | 0 | 4.22 |
| C | 0 | 0 | 0.47 | 0 | 16.43 | 7.7 | 0 | 5.54 | 0 | 30.14 | |
| D | 0 | 0 | 0.31 | 0 | 3.04 | 36.93 | 0 | 0.54 | 4.89 | 45.71 | |
| sum | 0 | 2.1 | 0.78 | 0 | 19.47 | 44.63 | 2.12 | 6.08 | 4.89 | 80.07 | |
| CDI | 0 | 0.81% | 0.30% | 0 | 7.53% | 17.25% | 0.82% | 2.35% | 1.89% | 30.95% | |
| Late | B | 1.18 | 2.9 | 0 | 0 | 0 | 0.02 | 0.17 | 3.92 | 0 | 8.19 |
| C | 8.39 | 10.06 | 1.31 | 0.45 | 2.76 | 39.76 | 5.92 | 3.01 | 0.52 | 72.18 | |
| D | 0.72 | 1.5 | 0.82 | 2.65 | 0.83 | 20.54 | 0.83 | 0.1 | 1.18 | 29.17 | |
| sum | 10.29 | 14.46 | 2.13 | 3.1 | 3.59 | 60.32 | 6.92 | 7.03 | 1.7 | 109.54 | |
| CDI | 3.95% | 5.54% | 0.82% | 1.19% | 1.38% | 23.13% | 2.65% | 2.70% | 0.65% | 42.00% |
4. Discussion
The coastline possesses significant ecological functions and resource value, and is closely associated with the construction of marine ecological civilization, the development of the marine green economy, and the well-being of coastal regions. In recent decades, China's coastal economy has witnessed rapid development. Large-scale coastal development activities, including land reclamation, aquaculture enclosure, etc., have given rise to numerous ecological and environmental issues, which have become a crucial obstacle to promoting the construction of marine ecological civilization. Consequently, it is essential to conduct an analysis and study on the spatio-temporal evolution of the coastline, comprehend the laws of coastline changes, and scientifically guide the protection and utilization of the coastline to attain sustainable development of the coastal economy.
This research is founded on multi-source data, including Landsat, Spot-5, GF-1, and UVA oblique images. By utilizing ArcGIS, coastline vector data for four periods (1973, 1988, 2003, and 2019) in Huizhou were extracted. The CLT model was put forward to precisely identify four types of coastlines: SCA, SCB, SCC and SCD. The disturbance factors influencing the changes in the coastline of Huizhou were identified. On this basis, the spatio-temporal evolution characteristics of the coastline and the disturbance factors of coastline changes in Huizhou were investigated, aiming to conduct a quantitative analysis of coastline changes from multiple perspectives and offer a more diversified foundation for coastline analysis. Based on the research findings, the following conclusions are drawn:
- (1)
- Over a span of 46 years, the coastline length in Huizhou witnessed an increment of 12.07 km. Specifically, in the early period, it increased by 1.91 km; in the intermediate stage, the increment was 8.07 km; and in the late stage, it rose by 2.09 km. During this time frame, the artificial coastline expanded by 75.21 km, representing an increase of 27.52%, whereas the natural coastline contracted by 62.86 km, accounting for a decrease of 27.39%. The proportions of the artificial coastline in 1973, 1988, 2004, and 2019 were 28.46%, 37.31%, 52.37%, and 55.98% respectively, and those of the natural coastline were 71.03%, 62.24%, 47.21%, and 43.64% respectively. Evidently, in the early and intermediate periods in Huizhou, the increase in the artificial coastline and the decrease in the natural coastline were remarkable, while in the late period, the changes were relatively smaller.
- (2)
- During this period, the length of SCA decreased continuously, with its proportion dropping from 79.66% in the early stage to 58% in the late stage. In contrast, the lengths of SCB, SCC and SCD increased continuously. Among the changed coastline segments, the volume of SCB was small, accounting for only 0.26% in the early stage but rising to 3.14% in the late stage. The reason was that Huizhou implemented a large number of mangrove restoration projects on artificial seawalls in the late stage, and many artificial coastlines were transformed into natural coastlines, leading to a significant increase in SCB in the late stage. In the early stage, the length of SCC (27.61 km) was slightly longer than that of SCD (22.72 km). In the middle stage, the length of SCD increased significantly (45.71 km), surpassing that of SCC (30.14 km). In the late stage, the length of SCC increased sharply to 72.18 km, while the length of SCD decreased to 29.17 km. The reason is that in the middle stage, land reclamation and aquaculture enclosure activities were significant, and there was insufficient protection of natural coastlines, resulting in a significant decrease in many natural coastlines and a significant increase in artificial coastlines. So, it led to a significant increase in SCD. In the late stage, the position of the coastline changed significantly, but during this period, natural coastlines gradually received protection, and the number of coastline restoration and improvement projects increased, resulting in a reduction in the decline of natural coastlines and a significant decrease in SCD.
- (3)
- Over three periods, the CDI of Huizhou has exhibited a continuous upward trend, reaching 20.34%, 30.95%, and 42.00%, respectively. This phenomenon suggests that the coastline of Huizhou has experienced substantial alterations in terms of both position and type as a result of various disturbance factors. The primary factors contributing to these changes were land reclamation and aquaculture enclosure. As depicted in Figure 4, the coastline changed in Huizhou were characterized by regional disparities, predominantly concentrated in the Daya Bay Petrochemical Zone, Fanhe Port, Kaozhouyang Bay, Xiaogui Village, and Quanwan Port. In contrast, the coastline changed in other areas were relatively insignificant. Among the aforementioned areas, the coastline changed in Kaozhouyang Bay were primarily attributed to aquaculture enclosure during the early and middle stages. The coastline changed in Fanhe Port were mainly influenced by aquaculture enclosure in the early and middle stages, as well as land reclamation and artificial facility construction in the later stage. The changed in the Daya Bay Petrochemical Zone, Quanwan Port, and Xiaogui Village were mainly due to land reclamation in the middle and later stages. Among the several significant influencing factors, the CDI of aquaculture enclosure has shown a continuous decline from 16.64% to 7.53% to 1.38%. The CDI of land reclamation has continuously increased from 0.12% to 17.25% to 23.13%, with the most substantial increase occurring in the middle stage and a subsequent decrease in the later stage. the CDI of artificial facility construction has also continuously increased from 0.26% to 0.81% to 5.54%, with a remarkable increase in the later stage. Furthermore, in the later stage, two new types of coastlines change factors have emerged, namely coastal beach restoration and land excavation for marine use.
The structure of the coastline type is closely related to geological structure, geomorphology, and human activities, and is an external manifestation of their combined influence [47]. According to remote sensing data, since 1973, the coastline of Huizhou has experienced natural phenomena such as erosion and siltation due to the influence of geomorphology and land-sea interaction. However, the affected areas were not large. Huizhou is located in the Guangdong-Hong Kong-Macao Greater Bay Area, where the population is concentrated and human activities are active. The demand for land resources due to urban construction is increasing day by day. Human activities such as port construction, port-related industrial facilities, and marine aquaculture have a huge impact on the evolution of the coastline, leading to the continuous advancement of the mainland coastline towards the sea and the transformation of a large number of natural coastlines into artificial ones. For example, from 1985 to 2000, influenced by economic globalization, international trade at the Pearl River Estuary increased, and the marine transportation industry developed rapidly. Port construction and related port facilities continued to expand [48]. Quanwan Port was built through land reclamation during this period. In addition, the adjustment of national policies has a significant promoting effect on the evolution of the coastline. In 2002, under the background of controlled construction land, land reclamation became the best choice for coastal cities to promote industrialization and urbanization. The Daya Bay Petrochemical Zone was built through land reclamation during this period. After 2017, the State successively issued policies to strengthen the protection and restoration of the coastline and strictly control land reclamation, clearly stating that the natural coastline retention rate of the mainland should not decrease. This has had a certain mitigating and inhibitory effect on the morphological evolution of artificial coastlines in Huizhou, while accelerating the protection and restoration of natural coastlines.
5. Conclusions
This research reveals that within rapidly urbanizing coastal regions, anthropogenic factors play a dominant role in the evolution of coastlines. The findings can offer a reference for the development, protection, utilization, and management of coastlines in coastal cities. With Huizhou as the study area from 1973 to 2019, the results demonstrate that land reclamation and aquaculture enclosures have facilitated the large-scale seaward progression of the coastline, which is especially conspicuous in the Daya Bay Petrochemical Zone, Fanhe Port, Kaozhouyang Bay, Xiaogui Village, and Quanwan Port Area. The research findings align with extant studies: in areas experiencing heightened coastal urbanization, the requirements for economic development systematically restrict natural dynamic processes. The irrevocable conversion from natural to artificial coastlines underscores an immediate necessity to attain a strategic equilibrium between development requirements and ecological resilience.
It is noteworthy that the driving factors of coastline changes in this paper are primarily determined empirically and manually based on multi-period remote sensing images. The analytical outcomes are subject to certain uncertainties owing to human subjective judgment. Simultaneously, the manual identification of driving factors for each coastline segment also leads to low research efficiency. Future research will be conducted in two aspects. Firstly, by integrating factors such as regional GDP, population, annual precipitation, and extreme weather conditions, we will conduct a more in-depth quantitative analysis of the driving mechanisms of regional coastline changes. Secondly, we will endeavor to develop semi-automatic or automatic model algorithms for identifying coastline driving factors, thereby offering technical support for coastline evolution research at large regional scales.
Funding
This study was supported by National Key Research and Development Program of China (2024-89), and Funds (MESTA-2022-D001,MESTA-2022-C002), which are the projects of Key Laboratory of Marine Environmental Survey Technology and Application, Ministry of Natural Resources, P.R. China, and Guangdong MEPP Fund (NO.GDOE[2019]A46), which is the project of Guangdong Province Marine Economy Promotion Projects.
Data Availability Statement
The data presented in this study are available on request from the corresponding author. The data are not publicly available due to privacy or ethical restrictions.
Conflicts of Interest
The authors declare no conflicts of interest.
Abbreviations
The following abbreviations are used in this manuscript:
| UAV | Unmanned Aerial Vehicle |
| CLT | model Coastline Location and Type model |
| SCA | The sets of coastline segments with invariant locations and types |
| SCB | The sets of coastline segments with invariant locations but altered types |
| SCC | The sets of coastline segments with changed locations but invariant types |
| SCD | The sets of coastline segments with both changed locations and types |
| CDI | The Coastline Disturbance Inde |
| ESRI | Environmental Systems Research Institute, Inc. |
| F1 | Coastal beach restoration |
| F2 | Artificial facility construction |
| F3 | Artificial facility damage |
| F4 | Land excavation for marine use |
| F5 | Aquaculture enclosure |
| F6 | Land reclamation |
| F7 | Natural erosion |
| F8 | Natural accretion |
| F9 | Comprehensive Causes |
References
- Mujabar, P.S.; Chandrasekar, N. Shoreline change analysis along the coast between Kanyakumari and Tuticorin of India using remote sensing and GIS. Arab. J. Geosci. 2013, 6, 647–664. [Google Scholar] [CrossRef]
- Primavera, J.H. Overcoming the impacts of aquaculture on the coastal zone. Ocean Coast. Manag. 2006, 49, 531–545. [Google Scholar] [CrossRef]
- Boye, C.B.; Addo, K.A.; Wiafe, G.; Dzigbodi-Adjimah, K. Spatiotemporal analyses of shoreline change in the Western Region of Ghana. J. Coast. Conserv. 2018, 22, 769–776. [Google Scholar] [CrossRef]
- Thoai, D.T.; Dang, A.N.; Oanh, N.T.K. Analysis of coastline change in relation to meteorological conditions and human activities in Ca mau cape, Viet Nam. Ocean Coast. Manag. 2019, 171, 56–65. [Google Scholar] [CrossRef]
- Hou, X.Y.; Wu, T.; Hou, W.; Chen, Q.; Wang, Y.D.; Yu, L.J. Characteristics of coastline changes in mainland China since the early 1940s. Sci. China Earth Sci. 2016, 59, 1791–1802. [Google Scholar] [CrossRef]
- Dar, I.A.; Dar, M.A. Prediction of shoreline recession using geospatial technology: A case study of Chennai coast, Tamil Nadu,India. J. Coast. Res. 2009, 25, 1276–1286. [Google Scholar] [CrossRef]
- Kuleli, T. Quantitative analysis of shoreline changes at the Mediterranean Coast in Turkey. Environ. Monit. Assess. 2010, 167, 387–397. [Google Scholar] [CrossRef]
- Aiello, A.; Canora, F.; Pasquariello, G.; Spilotro, G. Shoreline variations and coastal dynamics: A space-time data analysis of the Jonian littoral, Italy. Estuarine,Coastal Shelf Sci. 2013, 129, 124–135. [Google Scholar] [CrossRef]
- Kautsky, N.; Rönnbäck, P.; Tedengren, M.; Troell, M. Ecosystem perspectives on management of disease in shrimp pond farming. Aquaculture 2000, 191, 145–161. [Google Scholar] [CrossRef]
- Gori, S.H.; Dudiya, D.D.; Pandya, P.J.; Yogi, K.J.; Parmar, S.I. Navigating the shifting shorelines: Climate change efects on intertidal fauna and their adaptations. In Navigating Climate Change: Impacts on Biodiversity and Ecosystem Resilience. Sustainable Development and Biodiversity; Barathan, B.P., Velupillai, V., Perumal, S., Kannan, K., Eds.; Springer: Singapore, 2025; vol 42. [Google Scholar]
- Conel, S. Coastal Erosion: Causes, consequences, and mitigation strategies. J. Mar. Sci. Res. Dev. 2023, 13, 414. [Google Scholar]
- Mercogliano, R.; Avio, C.G.; Regoli, F.; Anastasio, A.; Colavita, G.; Santonicola, S. Occurrence of microplastics in commercial seafood under the perspective of the human food chain. J. Agric. Food Chem. 2020, 68, 5296–5301. [Google Scholar] [CrossRef]
- Kang, P.; Xu, S. The impact of mariculture on nutrient dynamics and identification of the nitrate sources in coastal waters. Environ. Sci. Pollut. Res. 2016, 23, 1300–1311. [Google Scholar] [CrossRef] [PubMed]
- Li, J.; Leng, Z.; Yuguda, T.K.; Wei, L.; Xia, J.; Zhuo, C.; Nie, Z.; Du, D. Increasing coastal reclamation by Invasive alien plants and coastal armoring threatens the ecological sustainability of coastal wetlands. Front. Mar. Sci. 2023. [Google Scholar] [CrossRef]
- Cui, L.; Li, G.; Zhao, M.; Zhang, Z. Quantifying the cumulative effects of large-scale reclamation on coastal wetland degradation. Land 2024, 13, 1404. [Google Scholar] [CrossRef]
- Cooper, M.J.P.; Beevers, M.D.; Oppenheimer, M. The potential impacts of sea level rise on the coastal region of New Jersey, USA. Clim. Change 2008, 90, 475–492. [Google Scholar] [CrossRef]
- Peduzzi, P.; Chatenoux, B.; Dao, H.; De Bono, A.; Herold, C.; Kossin, J.; Mouton, F.; Nordbeck, O. Global trends in tropical cyclone risk. Nat. Clim. Change 2012, 2, 289–294. [Google Scholar] [CrossRef]
- Yıldırım, U.; Erdoğan, S.; Uysal, M. Changes in the coastline and water level of the Akşehir and Eber Lakes between 1975 and 2009. Water Resour. Manag. 2010, 25, 941–962. [Google Scholar] [CrossRef]
- Ranasinghe, R.; Duong, T.M.; Uhlenbrook, S.; Roelvink, D.; Stive, M. Climate-change impact assessment for inlet-interrupted coastlines. Nat. Clim. Change 2013, 3, 83–87. [Google Scholar] [CrossRef]
- Huang, K.; Schuerch, M.; Fagherazzi, S.; Liu, Z.Z.; Hu, Z. Climate change influences coastal protection value of global wetlands. Sci. Bull. 2026. [Google Scholar] [CrossRef]
- Slott, J.M.; Murray, A.B.; Ashton, A.D. Large-scale responses of complex-shaped coastlines to local shoreline stabilization and climate change. J. Geophys. Res. 2010, 115, F03033. [Google Scholar] [CrossRef]
- Liu, Y.C.; Li, J.L.; Sun, C.; Wang, X.X.; Tian, P.; Chen, L.M.; Zhang, H.T.; Yang, X.D.; He, G.L. Thirty-year changes of the coastlines,wetlands, and ecosystem services in the Asia major deltas. J. Environ. Manag. 2023, 326, 116675. [Google Scholar] [CrossRef]
- Tian, S.; Jia, H.L.; Zeng, J.S.; Wei, Z.; Deng, H.W.; Tu, Z.F. The Spatiotemporal evolution of coastlines in the Pearl River Delta from 1973 to 2019. 10th Academic Conference of Geology Resource Management and Sustainable Development 2022, 1006. [Google Scholar]
- Zhang, X.H.; Huang, H.M.; Wang, P.; Chen, M.R.; Wang, J.H.; Sun, Q.Y. Change analysis of coastline and sea reclamation in Pearl River Estuary from 1973 to 2015. Trans. Oceanol. Limnol. 2016, 5, 9–15. [Google Scholar]
- Lotze, H. K.; Lenihan, H. S.; Bourque, B. J.; Bradbury, R. H.; Cooke, R. G.; Kay, M. C.; et al. Depletion, degradation, and recovery potential of estuaries and coastal seas. Science 2006, 312, 1806. [Google Scholar] [CrossRef]
- Koike, K. The countermeasures against coastal hazards in Japan. GeoJournal 1996, 38, 301–312. [Google Scholar] [CrossRef]
- Chapman, M.G.; Bulleri, F. Intertidal seawalls-new features of landscape in intertidal environments. Landsc. Urban Plan. 2003, 62, 159–172. [Google Scholar] [CrossRef]
- Sui, L.; Wang, J.; Yang, X.; Wang, Z. Spatial-temporal characteristics of coastline changes in Indonesia from 1990 to 2018. Sustainability 2020, 12, 3242. [Google Scholar] [CrossRef]
- Zhang, Y.X.; Li, D.; Fan, C.; Xu, H.; Hou, X.Y. Southeast Asia island coastline changes and driving forces from 1990 to 2015. Ocean Coast. Manag. 2021, 215. [Google Scholar] [CrossRef]
- Liu, L.; Wang, H.J.; Yue, Q. China’s coastal wetlands: Ecological challenges, restoration, and management suggestions. Reg. Stud. Mar. Sci. 2020, 37. [Google Scholar] [CrossRef]
- Yang, S.; Chen, J. Coastal salt marshes and mangrove swamps in China. Chin. J. Oceanol. Limnol. 1995, 13, 318–324. [Google Scholar]
- Qiu, J. Chinese survey reveals widespread coastal pollution: massive declines in coral reefs, mangrove swamps and wetlands. Nature 2012, 486. [Google Scholar]
- Tian, B.; Wu, W.T.; Yang, Z.Q.; Zhou, Y.X. Drivers, trends, and potential impacts of long-term coastal reclamation in China from 1985 to 2010. Estuar. Coast. Shelf Sci. 2016, 170, 83–90. [Google Scholar] [CrossRef]
- He, Q.; Bertness, M.D.; Bruno, J.F.; Li, B.; Chen, G.Q.; Coverdale, T.C.; Altieri, A.H.; Bai, J.H.; Sun, T.; Pennings, S.C.; Liu, J.G.; Ehrlich, P.R.; Cui, B.S. Economic development and coastal ecosystem change in China. Sci. Rep. 2014, 4, 1–9. [Google Scholar] [CrossRef]
- Jiang, T.T.; Pan, J.F.; Pu, X.M.; Wang, B.; Pan, J.J. Current status of coastal wetlands in China: degradation, restoration, and future management. Estuar. Coast. Shelf Sci. 2015, 164, 265–27. [Google Scholar] [CrossRef]
- Niu, Z.G.; Zhang, H.Y.; Gong, P. More protection for China's wetlands. Nature 2011, 471, 305. [Google Scholar] [CrossRef]
- An, S.Q.; Li, H.B.; Guan, B.H.; Zhou, C.F.; Wang, Z.S.; Deng, Z.F.; Zhi, Y.B.; Liu, Y.H.; Xu, C.; Fang, S.B.; Jiang, J.H.; Li, H.L. China's natural wetlands: Past problems, current status, and future challenges. Ambio 2007, 36, 335–342. [Google Scholar] [CrossRef] [PubMed]
- Ma, T.; Li, H.; She, Y.; Zhao, Y.; Feng, X.; Zhang, F. Spatial-temporal change and dominant factors of coastline in zhuhai city from 1987 to 2022. Water 2025, 17. [Google Scholar] [CrossRef]
- Li, R.X.; Liu, J.K.; Felus, Y. Spatial modeling and analysis for shoreline change detection and coastal erosion monitoring. Mar. Geod. 2001, 24, 1–12. [Google Scholar] [CrossRef]
- Wu, T.; Hou, X.Y. Review of research on coastline changes. Acta Ecol. Sin. 2016, 36, 1170–1182. [Google Scholar]
- Xu, J.Y.; Zhang, Z.X.; Zhao, X.L.; Wen, Q.K.; Zuo, L.J.; Wang, X.; Yi, L. Spatial-temporal analysis of coastline changes in northern China from 2000 to 2012. Acta Geogr. Sin. 2013, 68, 651–660. [Google Scholar]
- Crowell, M.; Honeycutt, M.; Hatheway, D. Coastal erosion hazards study: Phase one mapping. J. Coast. Res. 1999, SI, 10–20. [Google Scholar]
- Mandelbrot, B. How long is the coast of Britain? Statistical self-similarity and fractional dimension. Science 1967, 156, 636. [Google Scholar] [CrossRef]
- Liebovitch, L.S.; Toth, T. A fact algorithm to determine fractal dimension by box counting. Phys. Lett. A 1989, 141, 386–390. [Google Scholar] [CrossRef]
- Ye, M.Y.; Li, J.L.; Shi, X.L.; Jiang, Y.M.; Shi, Z.Q.; Xu, L.H.; He, G.L.; Huang, R.P.; Feng, B.X. Spatial pattern change of the coastline development and utilization in Zhejiang from 1990 to 2015. Geogr. Res. 2017, 36, 1159–1170. [Google Scholar]
- Li, X.; Yan, H.; Yang, Y.; Xu, Z.; Yang, H. Spatiotemporal coastline variations in the Pearl River Estuary and the relationship with multiple human disturbances. Front. Mar. Sci. 2022. [Google Scholar] [CrossRef]
- Li, J.L.; Tian, P.; Shao, S.Y.; Wang, H.F.; Wang, L.J.; Ye, M.Y.; Zhao, M.Q.; Zhang, K.Q.; Cai, K.T.; Ruan, Y.C.; Shen, X.W. The change of continental coastline and its development and utilization intensity in the East China Sea. J. Nat. Resour. 2019, 34, 1886–1901. [Google Scholar] [CrossRef]
- Yang, C.C.; Gan, H.Y.; Wan, R.S.; Zhang, Y.M. Spatiotemporal evolution and influencing factors of coastline in the Guangdong-Hong Kong-Macao Greater Bay Area from 1975 to 2018. Geol. China 2021, 48, 697–707. [Google Scholar]
Figure 3.
Statistics on Coastline Changes in Huizhou City from 1973 to 2019.
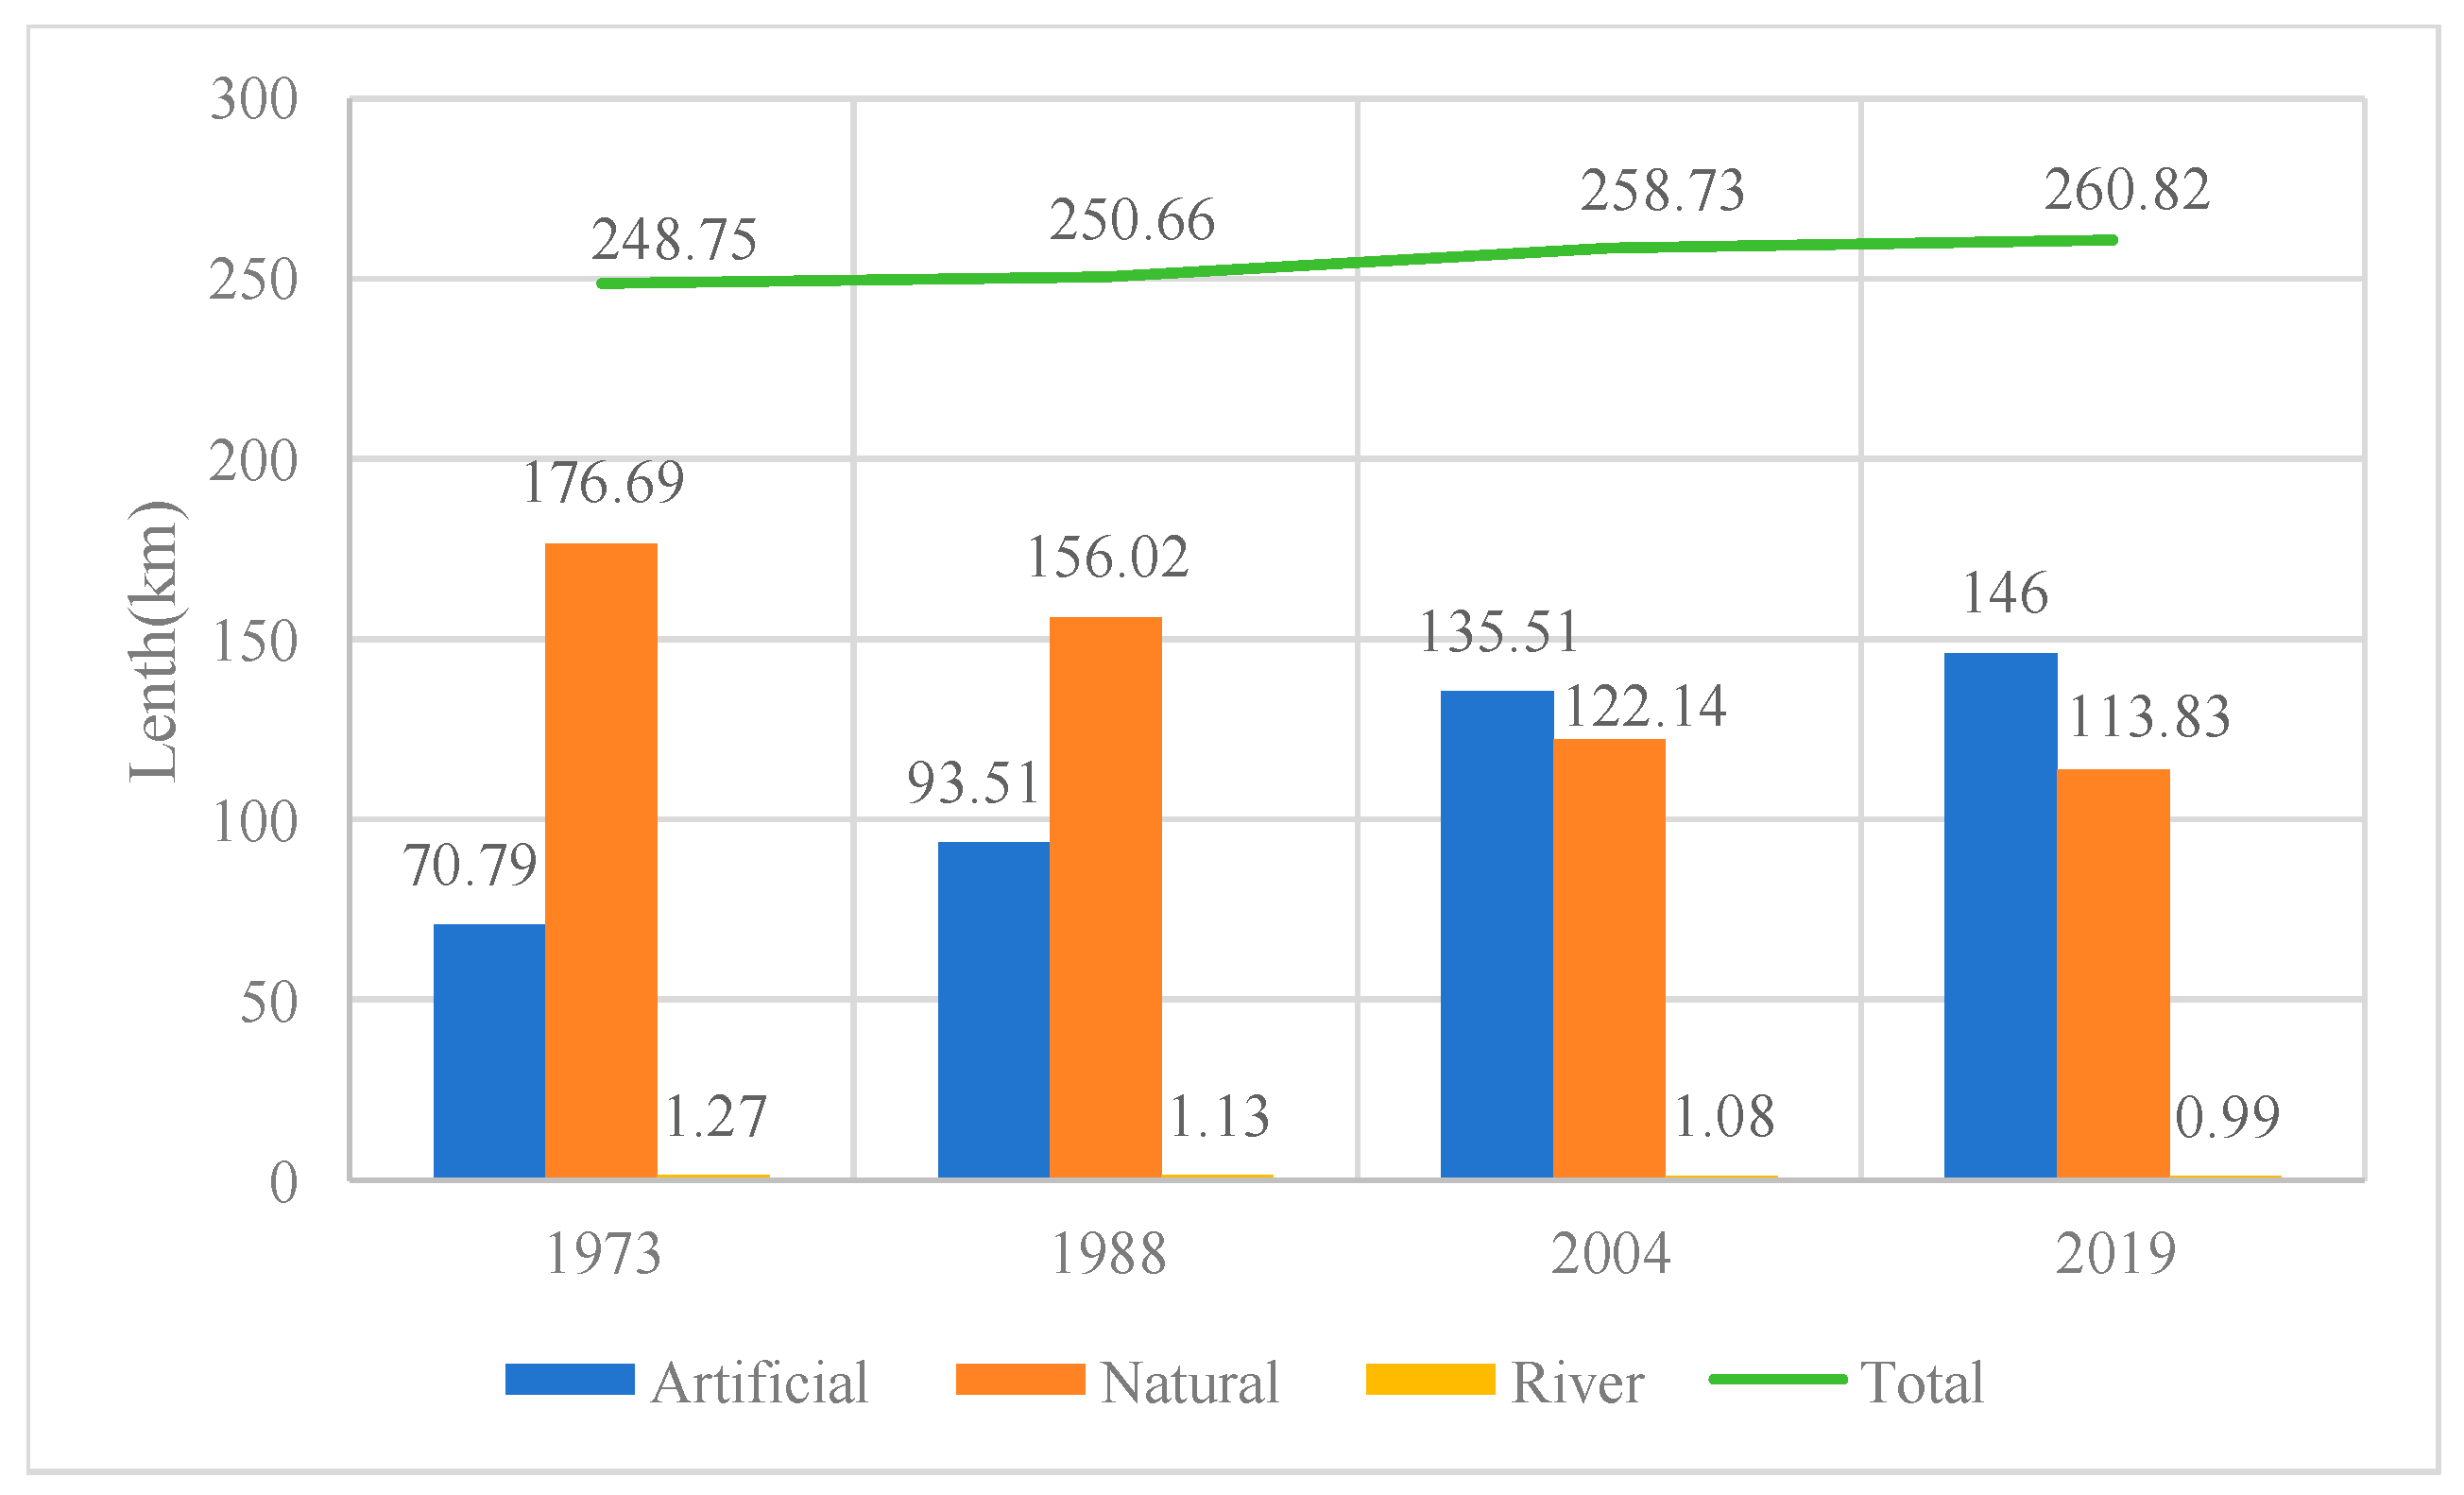
Figure 4.
Spatial change in coastline in Huizhou region. (a) Change from 1973-2019; (b) Location and type change in 1988; (c) Influencing factors in 1988; (d) Location and type change in 2004; (e) Influencing factors in 2004; (f) Location and type change in 2019; (g) Influencing factors in 2019.
Figure 4.
Spatial change in coastline in Huizhou region. (a) Change from 1973-2019; (b) Location and type change in 1988; (c) Influencing factors in 1988; (d) Location and type change in 2004; (e) Influencing factors in 2004; (f) Location and type change in 2019; (g) Influencing factors in 2019.
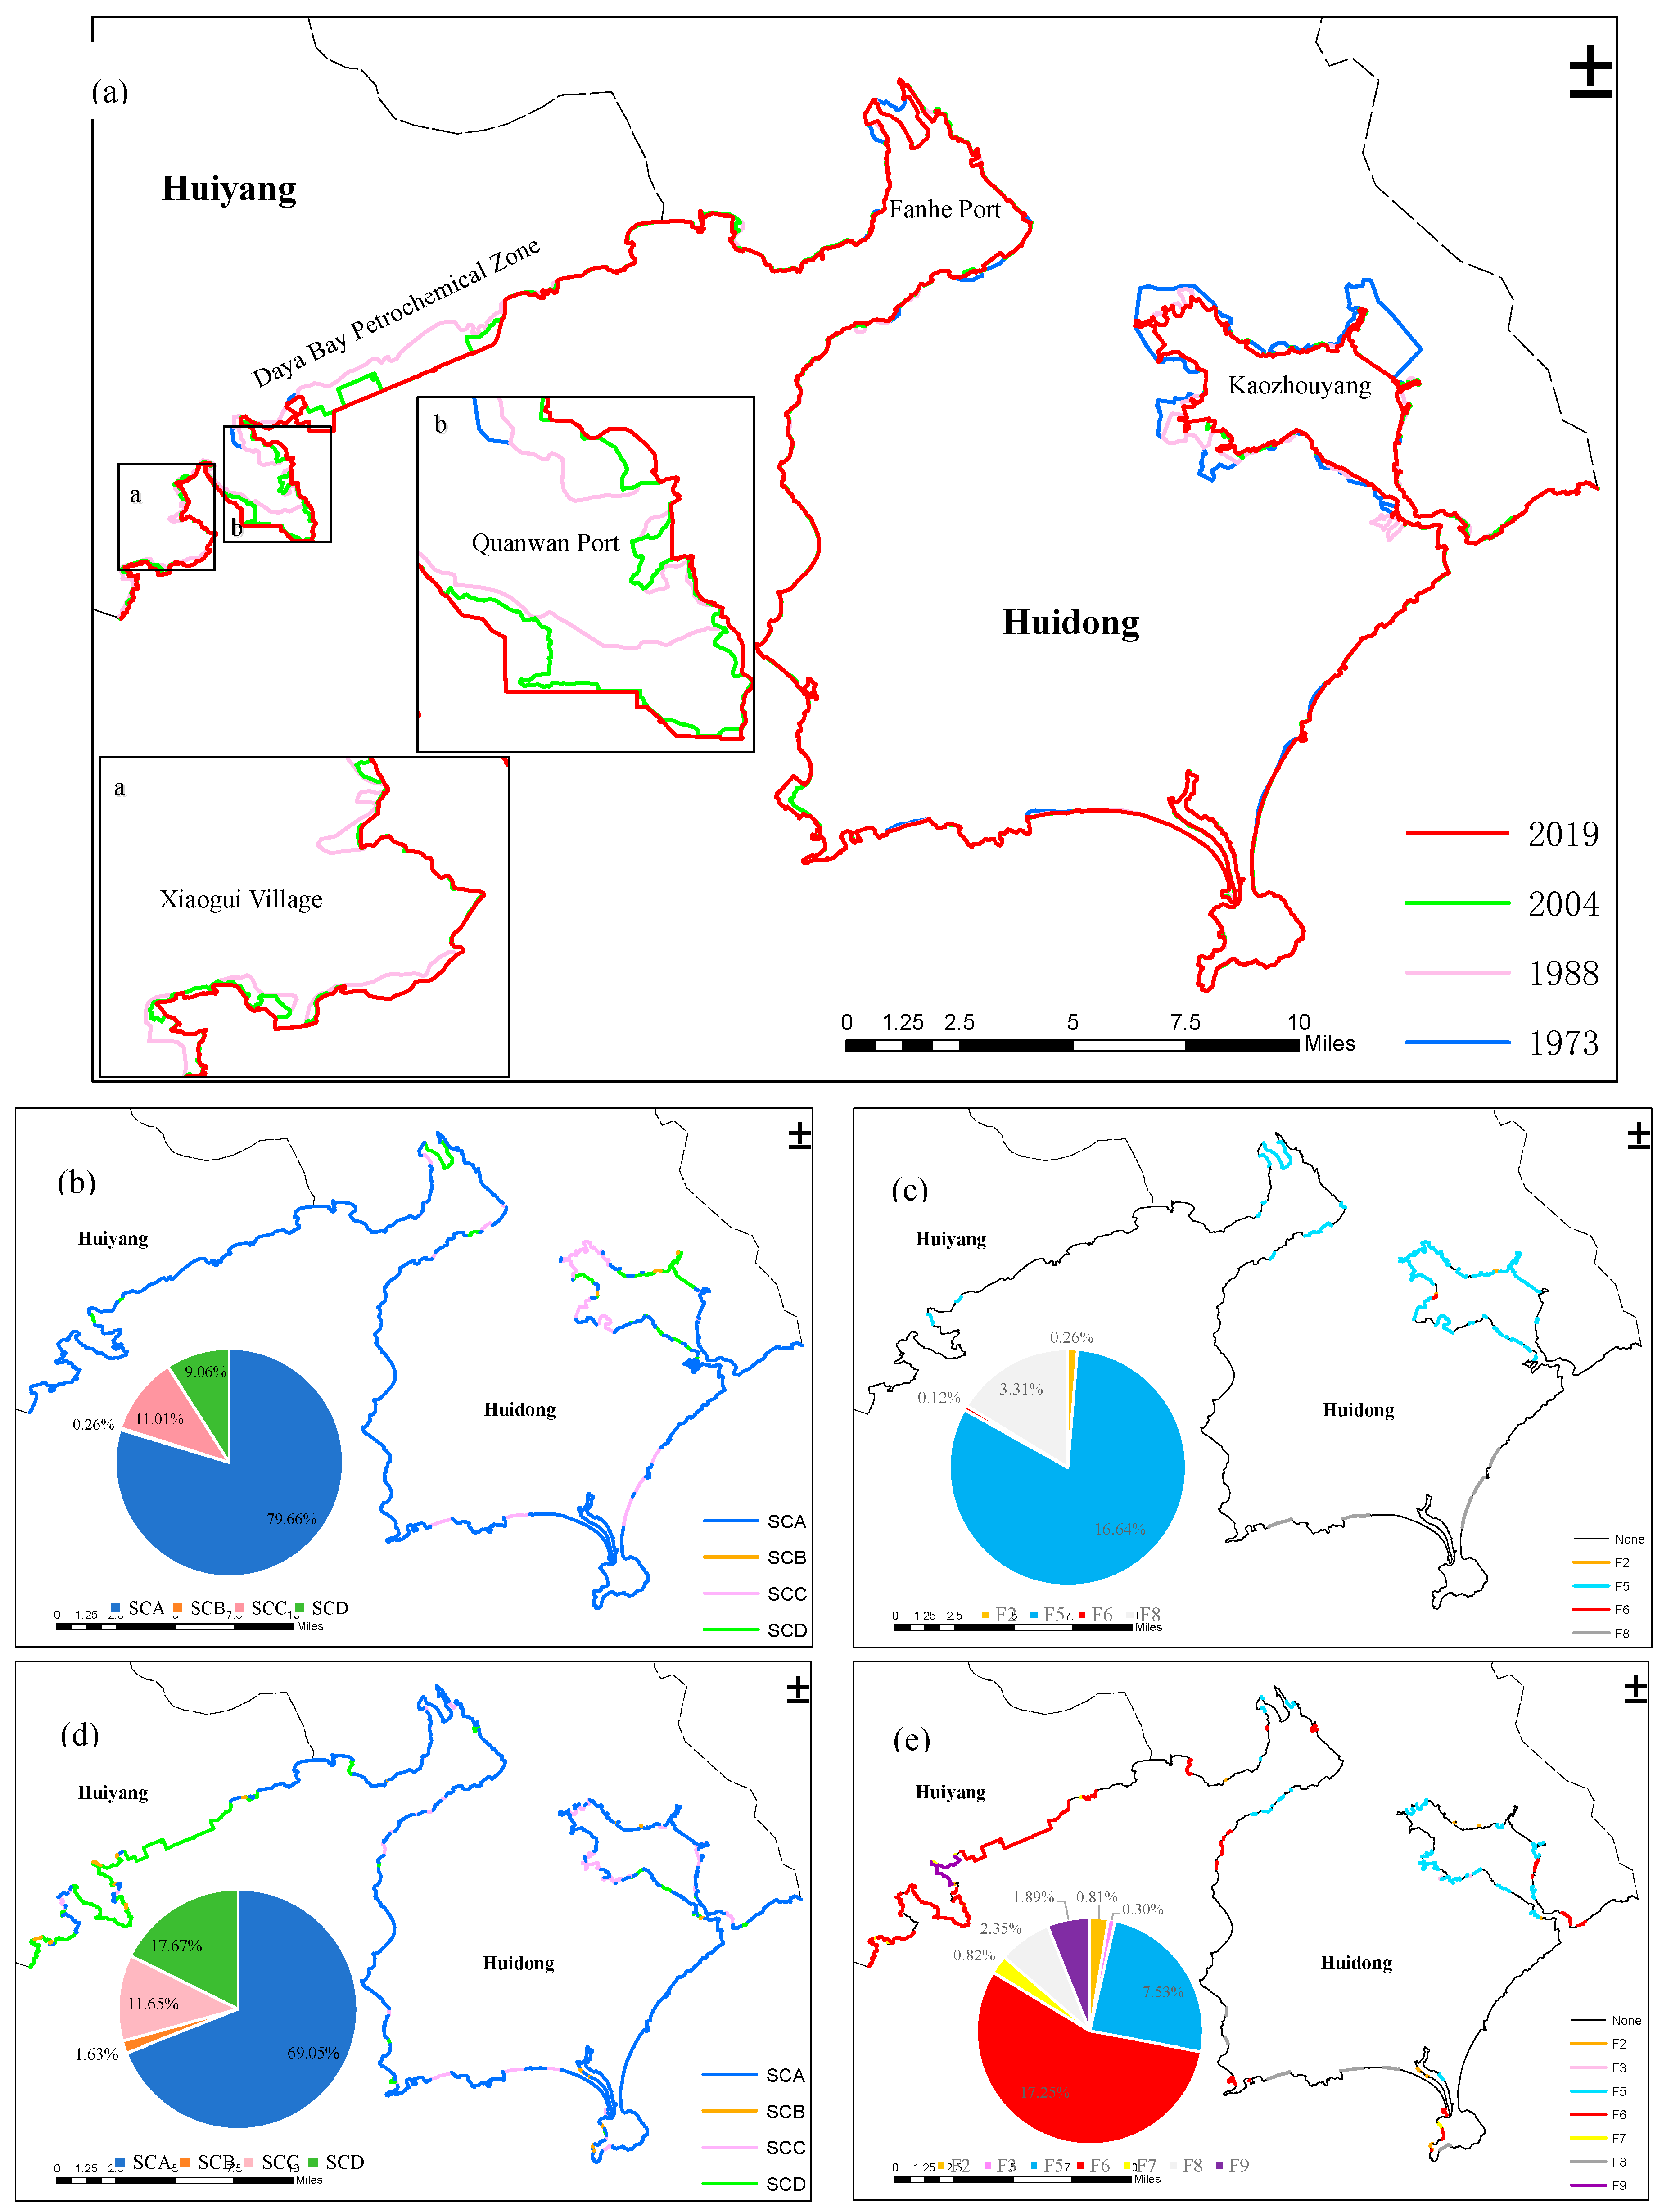
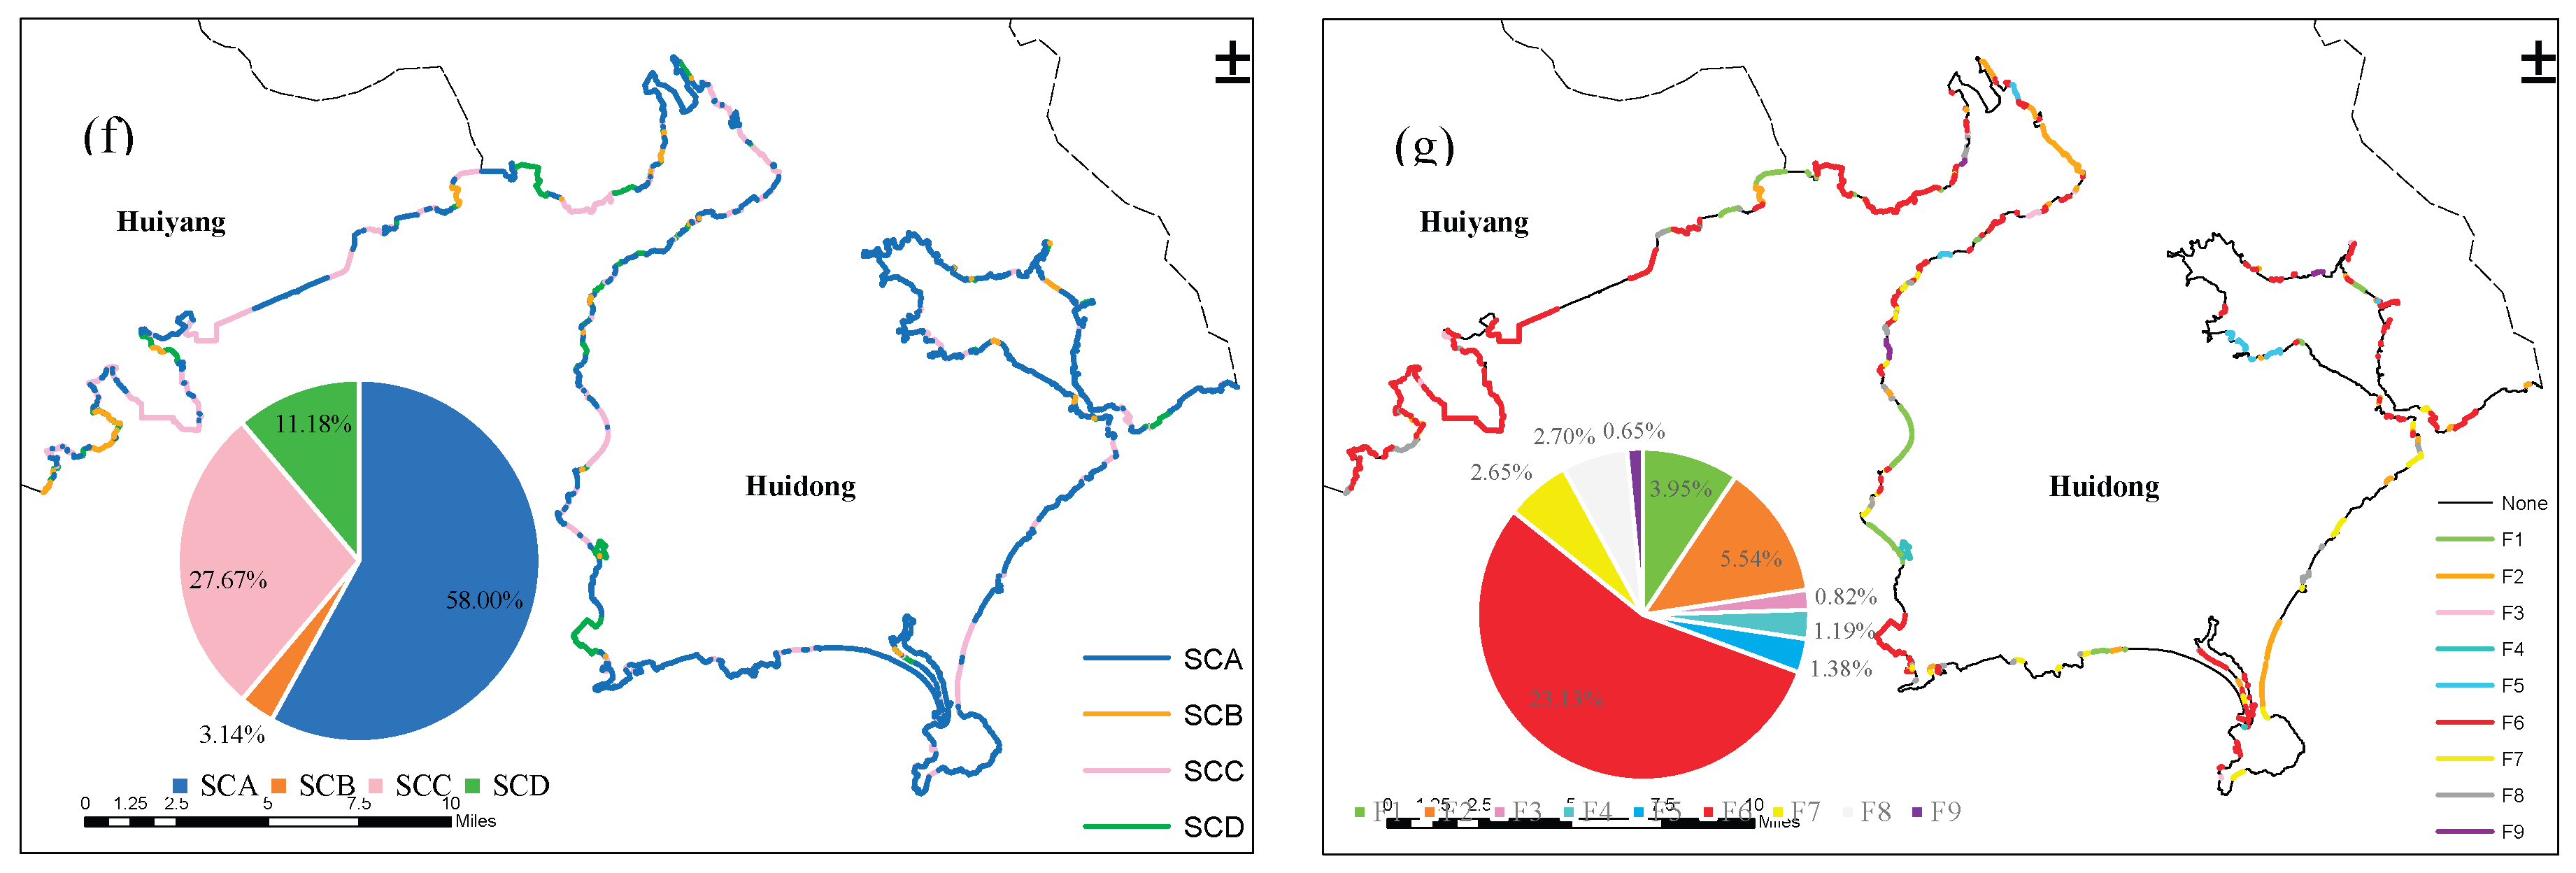
Table 1.
The Information of Data Sources.
| Data source | spatial resolution | imaging time | role |
|---|---|---|---|
| Landsat-1 Mss | 70 | 1973 | Shoreline extraction and shoreline type interpretation |
| Landsat-5 TM | 30 | 1988 | |
| Spot-5 | 2.5 | 2004 | |
| GF-1 | 2 | 2019 | |
| UAV | / | 2019 | Shoreline type interpretation |
Table 2.
The Remote Sensing Interpretation Standard of Coastlines.
| Class I | Class II | Characteristics | Image Example |
|---|---|---|---|
| Artificial coastline | Usually appears as a regular bright white streak between artificial engineering and the sea. If it is a structure such as a jetty that intersects perpendicularly or obliquely with the coastline, the coastline is defined at the connection point between the structure and the land. | 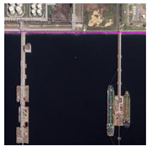 |
|
| Natural coastline | Bedrock coastline | Above the waterline of the low hills, the upper border of the white edge of the remote-sensing image. | 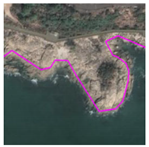 |
| Sandy coastline | Elongated, rectilinear bands of sandy sediment typically amass in the form of ridges parallel to the coastline. | 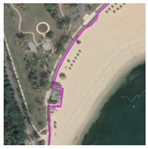 |
|
| Biological coastline | The inner boundary on the landward side of growth areas, such as those of mangroves. | 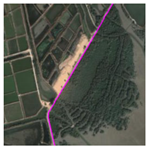 |
|
| Silty coastline | Vegetation density demarcation lines in remote-sensing images | 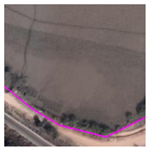 |
|
| River coastline | Historical customary line. | 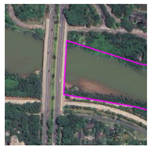 |
|
Disclaimer/Publisher’s Note: The statements, opinions and data contained in all publications are solely those of the individual author(s) and contributor(s) and not of MDPI and/or the editor(s). MDPI and/or the editor(s) disclaim responsibility for any injury to people or property resulting from any ideas, methods, instructions or products referred to in the content. |
© 2026 by the authors. Licensee MDPI, Basel, Switzerland. This article is an open access article distributed under the terms and conditions of the Creative Commons Attribution (CC BY) license (http://creativecommons.org/licenses/by/4.0/).
Copyright: This open access article is published under a Creative Commons CC BY 4.0 license, which permit the free download, distribution, and reuse, provided that the author and preprint are cited in any reuse.


