

Submitted:
24 May 2026
Posted:
27 May 2026
You are already at the latest version
Abstract
Serious games and gamified interventions are increasingly being proposed as tools to reduce household food waste, yet the field lacks standardized methods to assess whether these interventions produce measurable behavioral and environmental impact. Despite the European Union (EU) Waste Framework Directive's call for comparable food waste monitoring, most studies report only knowledge gains or attitudinal shifts. This paper presents SG-FLW, a measurement framework that evaluates the evidence quality of interventions targeting food loss and waste across five dimensions: Baseline measurement, Knowledge attitudinal assessment, Direct behavioral change, Environmental conversion, and Persistence, each on a 0--3 ordinal scale. We demonstrate the framework through worked coding examples and apply it to thirty-five interventions (seven games, ten serious games, and eighteen gamification studies) drawn from two complementary reviews and targeted search. Results reveal a persistent complementary measurement gap: twenty-five interventions assess knowledge or attitudinal outcomes but rarely measure actual behavior, while the five achieving Moderate certainty through objective behavioral measurement (including waste weighing, audits, and consumption proxies) all neglect cognitive assessment. No study achieves environmental conversion, and only one includes post-intervention follow-up. SG-FLW provides a transparent, reproducible tool aligned with EU reporting standards that can be applied both retrospectively (to evaluate published studies) and prospectively (to guide measurement planning during intervention design). By making measurement gaps visible, the framework directs future research toward stronger evidence of impact.
Keywords:
serious games
; food loss and waste
; gamification
; behavioral change
; knowledge assessment
; measurement framework
; evidence quality
; GRADE
; SG-FLW
1. Introduction
Serious games and gamified digital interventions are increasingly proposed as tools to reduce household food waste [1,2]. However, the field suffers from a fundamental measurement paradox: interventions that claim to change behavior rarely measure behavior, and those that measure behavior rarely quantify environmental impact. Most studies evaluate only knowledge gains or attitudinal shifts, leaving actual effectiveness as an open question [3,4]. Prior reviews have catalogued existing interventions and their design characteristics [5,6], but no standardized tool exist to systematically assess the quality of evidence these interventions produce.
Food loss and food waste (FLW), though often conflated, refer to different stages of the supply chain: food loss occurs during production, post-harvest handling, and processing, while food waste arises at the retail and consumer levels [7,8]. The European Union (EU) Waste Framework Directive mandates that Member States develop prevention programs with comparable monitoring, and the European Commission’s Joint Research Centre has published evaluation frameworks for assessing the performance of food waste prevention actions [9,10]. Yet most digital interventions have not been aligned with these reporting standards, and food waste is measured in inconsistent units (kilograms, packages, or self-reported estimates) when it is measured at all [1,11]. SG-FLW focuses on the consumer-facing stage where serious games and gamification operate, but its measurement logic applies across the supply chain.
This measurement gap extends beyond food waste. Hognon et al. [12] showed that Climate Fresk evaluations are predominantly qualitative, rely on small non-randomized samples, and include no long-term follow-up; they argue that evaluation must also consider cognitive and attitudinal processes, not only behavioral outcomes. The same pattern holds for food waste: studies evaluated without behavior-change frameworks risk overestimating impact by focusing on immediate or self-reported outcomes [12], and gamification-driven engagement may not sustain change once novelty effects subside [13].
Existing frameworks each address part of this problem but none covers the full measurement chain from baseline to persistence. GRADE [14] assesses evidence certainty but is designed for clinical trials, not behavioral interventions. RE-AIM [15] includes maintenance but does not grade baseline or environmental conversion. Kirkpatrick [16] sequences learning before behavior but provide no waste-specific measurement criteria. Typical serious game evaluation rubrics assess engagement and learning outcomes without connecting them to environmental impact. Appraisal checklists (TIDieR, Cochrane Risk of Bias, MMAT) address reporting completeness, internal validity, or mixed-methods quality, but none grades domain-specific measurement rigor across the full chain. SG-FLW (Serious Games for Food Loss & Waste) differs by integrating these concerns into a single five-dimensional measurement chain, synthesizing principles from eight sources (CONSORT/GRADE, Behavior Change Technique Taxonomy v1 (BCTTv1) [17], Kirkpatrick, Theory of Planned Behavior (TPB) [18], Cohen’s d, ISO 14040–14044, RE-AIM, CONSORT-SPI [19]). It evaluates the quality of evidence that an intervention reduces food waste, not whether the game is “good” or “engaging.”
The framework is designed for researchers, reviewers, and practitioners working with digital interventions targeting food waste, including serious games, gamified mobile applications, interactive installations, and dashboard-based campaigns. SG-FLW supports two complementary modes of use: retrospectively, to evaluate the evidence quality of published studies (as demonstrated in this paper); and prospectively, to guide the design of new interventions by setting target measurement levels before development begins. A research team designing a serious game can use the dimensional profiles to plan their evaluation strategy, for example committing to B2/K3/D2/E1/L2 as a target profile, thereby embedding rigorous measurement into the study design rather than treating it as an afterthought. Note that SG-FLW evaluates measurement quality, not intervention quality: a high profile means strong evidence exists, while a low profile indicates evidence is missing, not that the intervention failed. The contributions of this paper are: (i) defining the five SG-FLW dimensions and their 0–3 ordinal scales; (ii) specifying four derived indices for quantitative comparison; and (iii) applying the framework to thirty-five interventions, revealing a systematic complementary measurement gap (no study achieves both K≥2 and D≥2).
This paper is organized in 7 sections. Section 2 presents the SG-FLW framework architecture and its five dimensions. Section 3 defines the four derived calculable indices. Section 4 describes the coding protocol. Section 5 presents the evidence certainty classification. Section 6 applies the framework to thirty-five interventions and reports reliability and robustness analyses. Finally, Section 7 discusses implications and concludes.
2. Framework Architecture
SG-FLW evaluates five dimensions, each rated on a 0–3 ordinal scale following a causal logic chain: an intervention must first establish a Baseline (what was waste before?), then assess Knowledge & attitudinal outcomes (did people learn?), demonstrate Direct Behavioral change (did people act differently?), ideally convert that change into Environmental impact (what does it mean for the planet?), and finally assess whether the change Persists over time (abbreviated L for Longitudinal, the measurement method). Higher scores indicate greater measurement rigor and lower susceptibility to bias. A 0–3 ordinal scale was chosen to balance coder reliability with field-wide applicability, matching the practical evidence tiers observed across the heterogeneous literature; finer granularity (e.g., splitting B3 into calibrated vs. uncalibrated) reduced agreement in pilot coding without adding discriminative value. This causal chain also serves as a design guide: when used prospectively, each dimension prompts researchers to decide before development what level of measurement rigor they will implement at each stage.
2.1. B — Baseline Measurement Quality
Measures the rigor of pre-intervention food waste quantification, grounded in CONSORT and GRADE. Without a baseline, waste reduction cannot be calculated; self-reported baselines introduce recall and social desirability bias. For indices that combine baseline and post measures (e.g., Waste Reduction Rate (WRR)), baseline and outcome must be commensurate in unit and aggregation level.
2.2. K — Knowledge & Attitudinal Assessment
Captures whether and how the intervention assessed cognitive, attitudinal, or awareness outcomes, the intermediate processes that precede behavioral change. Grounded in Kirkpatrick’s training evaluation hierarchy [16], where Levels 1–2 (reaction and learning) must precede Level 3 (behavior), and in the Theory of Planned Behavior [18], which posits that attitudes and perceived behavioral control shape intentions before action. Many serious games primarily target these precursors; K captures the quality of that assessment independently of whether behavior was measured. K and D are operationally distinct: K evaluates assessments of what participants know, believe, or intend (e.g., a food storage quiz, an attitude scale), while D evaluates measurements of what participants do (e.g., weighed plate waste, observed sorting behavior). A study may score K3/D0 or K0/D3; neither dimension implies the other. Because K grades measurement rigor rather than construct type, it groups factual knowledge, attitudes, and self-efficacy into a single scale; this trades construct-level precision for cross-study comparability, a limitation most relevant at K2–K3 where different TPB determinants carry different predictive weight for behavior.
2.3. D — Direct Behavior Measurement
Captures how behavioral outcomes are recorded, grounded in BCTTv1 and Cohen’s d. Knowledge is not behavior: quiz scores and self-reported intentions correlate weakly with actual food waste behavior [18].
2.4. E — Environmental Conversion
Assesses whether behavioral change is translated into environmental impact metrics, grounded in LCA methodology (ISO 14040–14044). Reducing 1 kg of meat waste has a fundamentally different impact than reducing 1 kg of bread waste; without conversion, behavioral data cannot inform sustainability policy.
2.5. L — Persistence (Longitudinal Measurement)
Evaluates whether behavioral effects are assessed over time after the intervention ends, drawn from RE-AIM’s Maintenance dimension: “long-term effects ≥6 months after the most recent intervention contact” [15].
3. Calculable Indices
When minimum dimensional requirements are met, SG-FLW enables four derived indices computed from the study data.
WRR — Waste Reduction Rate (requires B≥2, D≥3):
Proportion of waste eliminated (0–1.0). Pre and post measurements must be commensurate in unit and aggregation level.
BII — Behavioral Impact Index (individual-level; requires B≥3, D≥3):
Standardized effect size (Cohen [20]; 0.2/0.5/0.8 = small/medium/large). Positive values indicate waste reduction; apply Hedges’ correction when .
EII — Environmental Impact Index (requires E≥1, D≥3):
where represents the waste reduction (kg) for food category c and is its emission factor (kg CO2eq/kg). EII requires D3; behavioral proxies (D2) are insufficient unless converted to mass units in-study.
PI — Persistence Index (requires L≥3, D≥2):
Ratio of the behavioral effect at time t to the initial post-intervention effect. With ≥3 time points, the decay constant can be estimated and the behavioral half-life computed.1
4. Coding Protocol
SG-FLW coding follows three principles adapted from CONSORT-SPI and BCTTv1: (1) Code what is reported, not what is implied: if a study does not explicitly report weighing of food waste, do not infer it; (2) Independent dimensions: each dimension is coded independently, so B0/K2/D3/E0/L0 is a valid profile; (3) Conservative coding: when evidence is ambiguous, code the lower level.
For each dimension, coders follow a decision path: first determine whether the relevant data exist (score 0 if absent), then classify its quality level (1–3) based on the criteria in Table 1, Table 2, Table 3, Table 4 and Table 5. Following BCTTv1 methodology [17], two coders independently rated each intervention; inter-rater reliability is reported in Section 6.3. In multi-arm trials where arms differ in measurement level, the profile reflects the arm with the strongest measurement chain.
5. Evidence Certainty Classification
Inspired by but distinct from the GRADE approach [14], SG-FLW profiles map to a measurement-chain certainty level (Table 6). Certainty here refers to certainty about waste reduction: substantiating a reduction claim requires both a commensurate baseline (B) and post-intervention behavioral measurement (D). SG-FLW classifies measurement-chain adequacy, not causal identification. SG-FLW therefore produces two orthogonal outputs: waste-reduction certainty (determined by B, D, E, L) and mechanism evidence (captured by K). Knowledge gains do not constitute evidence of waste reduction; K is reported separately because it captures the cognitive precursors that the attitude–behavior gap [18] shows are necessary but insufficient. For Moderate, D2 must capture behaviors linked to waste outcomes (not merely engagement metrics). A commensurability rule applies: baseline and outcome must match in unit and aggregation level (e.g., group-level baseline requires group-level outcome); violation downgrades the study one level (e.g., B3 in kg/household/week paired with D3 in g/person/day; no study in this corpus required downgrade). Moderate accepts behavioral proxies (D2), but waste-mass indices (WRR, EII) require D3. High requires E≥1 and L≥2 because policy-relevant waste reduction claims need environmental conversion (reducing 1 kg of meat waste differs from 1 kg of bread waste) and evidence of sustained change; in practice, E0 dominates because most studies lack food-category composition data needed for conversion. A study can reach High for behavioral certainty (B3/D3/L2) without E, but not for sustainability certainty, which demands environmental conversion; High is intentionally rare, representing policy-grade evidence sufficient for SDG 12.3 reporting. This is a GRADE-inspired measurement-chain classification, not a full GRADE assessment of bias and precision.
6. Framework Application
We applied SG-FLW to thirty-five interventions drawn from three sources: (1) nine interventions from our qualitative review [3]; (2) twenty-nine interventions from our systematic review [1]; and (3) two behavioral studies using cloud-based automatic weighing. Duplicates were identified by matching intervention name, authors, and year across sources; five serious games appeared in both reviews and were counted once. The merged corpus comprises games (), serious games (), and gamification () per the taxonomy in [1]. This category split is descriptive; SG-FLW is category-agnostic. Two coders independently rated each intervention (Section 4); reliability () and borderline decisions are in Section 6.3. The corpus spans prototype-stage studies scoring all zeros to quasi-experimental trials at Moderate certainty, showing the framework differentiates across evidence levels.
6.1. Worked Examples
To illustrate the coding process, we present two contrasting cases.
Worst case — Verloop [21]: This serious game for food waste data collection was evaluated using qualitative methods only. B: No pre-intervention waste data was collected (B0). K: Qualitative observations were gathered informally (K1). D: No behavioral outcomes, not even self-reported, were measured (D0). E: No environmental conversion (E0). L: No follow-up (L0). Profile: B0/K1/D0/E0/L0, Very Low certainty. The study provides no evidence of behavioral impact, although K1 acknowledges that qualitative data was collected.
Best case — Seta et al. [22]: This gamified self-monitoring app was tested with 126 households using a cloud-based automatic weighing system (SmartMat). B: Individual household food waste was weighed during a two-week baseline period (B3). K: No formal knowledge or attitudinal assessment was conducted; the study focused exclusively on behavioral waste measurement (K0). D: Post-intervention waste was directly measured in grams per household per week, yielding a 45% reduction as reported by the authors (D3). E: No environmental conversion was reported (E0). L: A follow-up approximately three months post-intervention was conducted, below the six-month RE-AIM threshold (L1). Profile: B3/K0/D3/E0/L1, Moderate certainty. This is the highest-scoring intervention on the behavioral evidence chain and the only one with any post-intervention follow-up, yet it illustrates a complementary gap: strong behavioral evidence without cognitive assessment.
6.2. Full Results
Table 7 presents the complete SG-FLW profiles for all thirty-five interventions.
SG-FLW provides a common vocabulary for comparing what was measured across a heterogeneous field. A Very Low profile means the study’s measurement focus lay elsewhere, not that the intervention failed. We define a complementary measurement gap as the pattern where studies scoring K≥2 score D=0, studies scoring D≥2 score K=0, and zero studies achieve both K≥2 and D≥2 simultaneously.
Of the thirty-five interventions, twenty-five score K>0 (K1: ; K2: ; K3: ), but twenty of those score D0. Yu et al. [52] is the nearest bridge, reaching D2 through app-logged actions but with only K1 and no baseline (B0/K1/D2). In Kirkpatrick’s terms [16], most studies remain at Levels 1–2 without progressing to Level 3 (behavior), and the documented attitude–behavior gap in food waste [4,11] confirms the need for objective data.
Conversely, five studies achieve Moderate certainty (B≥2, D≥2), yet all score K0. Dolnicar et al. [41] weighed plate waste (34% reduction); Joyner et al. [24] measured cafeteria vegetable consumption as a waste-reduction proxy (99.9% increase in servings taken); Soma et al. [44] conducted curbside audits across 164 households (); and Seta et al. [22,55] deployed cloud-based automatic weighing across 126 and 119 households respectively (45% reduction, ). These studies reach Kirkpatrick Level 3 but bypass Level 2, leaving cognitive mechanisms unexplored. Where reported data permits, the indices from Section 3 can be computed: Dolnicar yields WRR=0.34, Seta (a) yields WRR=0.45 and BII; the remaining Moderate studies lack the dispersion statistics that BII requires.
No intervention achieves E≥1, only one [22] includes follow-up (L1), and none reaches High certainty. The highest combined K+D is K2/D1 (Löchtefeld [36]; Pajpach et al. [51]; Santa Cruz et al. [54]). In summary: 20/35 score K>0 with D=0; 5/35 score D≥2 with K=0; 0/35 achieve both K≥2 and D≥2. In cross-tabulation: of 14 studies with K≥2, none achieves D≥2; all 6 with D≥2 score K≤1. These patterns hold across all three categories and match the evaluation deficits Hognon et al. [12] identified in climate education, suggesting a field-wide gap rather than a sampling artifact.
6.3. Reliability and Robustness
To assess coding reliability, two coders independently rated all five dimensions for a purposive subsample of twelve interventions selected to span the full evidence range and include all identified borderline cases: Altarriba, Verloop, Seiler, Löchtefeld (Very Low); Pajpach, Yu, Santa Cruz (Low); Joyner, Dolnicar, Soma, Seta (a), Seta (b) (Moderate). Both coders were trained on the codebook (Table 1, Table 2, Table 3, Table 4 and Table 5) using three pilot studies before independent coding. Table 8 reports per-dimension results. was computed for B, K, and D; E and L had no variance in the subsample (all E0; all L0 except Seta (a) L1, agreed by both coders), so is undefined for those dimensions. The high agreement reflects the design of the scale: B and D levels are anchored in observable reporting artifacts (weighing, audits, app logs) rather than subjective judgments, which constrains coder disagreement. The two disagreements were each one level apart: Seiler K3 vs. K2 (TAM as validated instrument vs. structured scale) and Yu D2 vs. D1 (app-logged actions vs. self-initiated records). After discussion, both were resolved to the higher category (K3, D2) because the studies met the formal criteria in Table 2 and Table 3; Seiler explicitly hypothesizes acceptance as a determinant of adoption behavior and uses a validated instrument (TAM) with A/B design, satisfying the K3 mediator criterion; Yu’s 800+ app-logged actions are server-recorded, not self-reported. E and L reliability cannot be assessed in this corpus due to insufficient variance; future application to studies with E≥1 or L≥2 should include these dimensions in reliability testing. values may also be lower in corpora with greater E/L variance, where finer distinctions between adjacent levels become necessary.
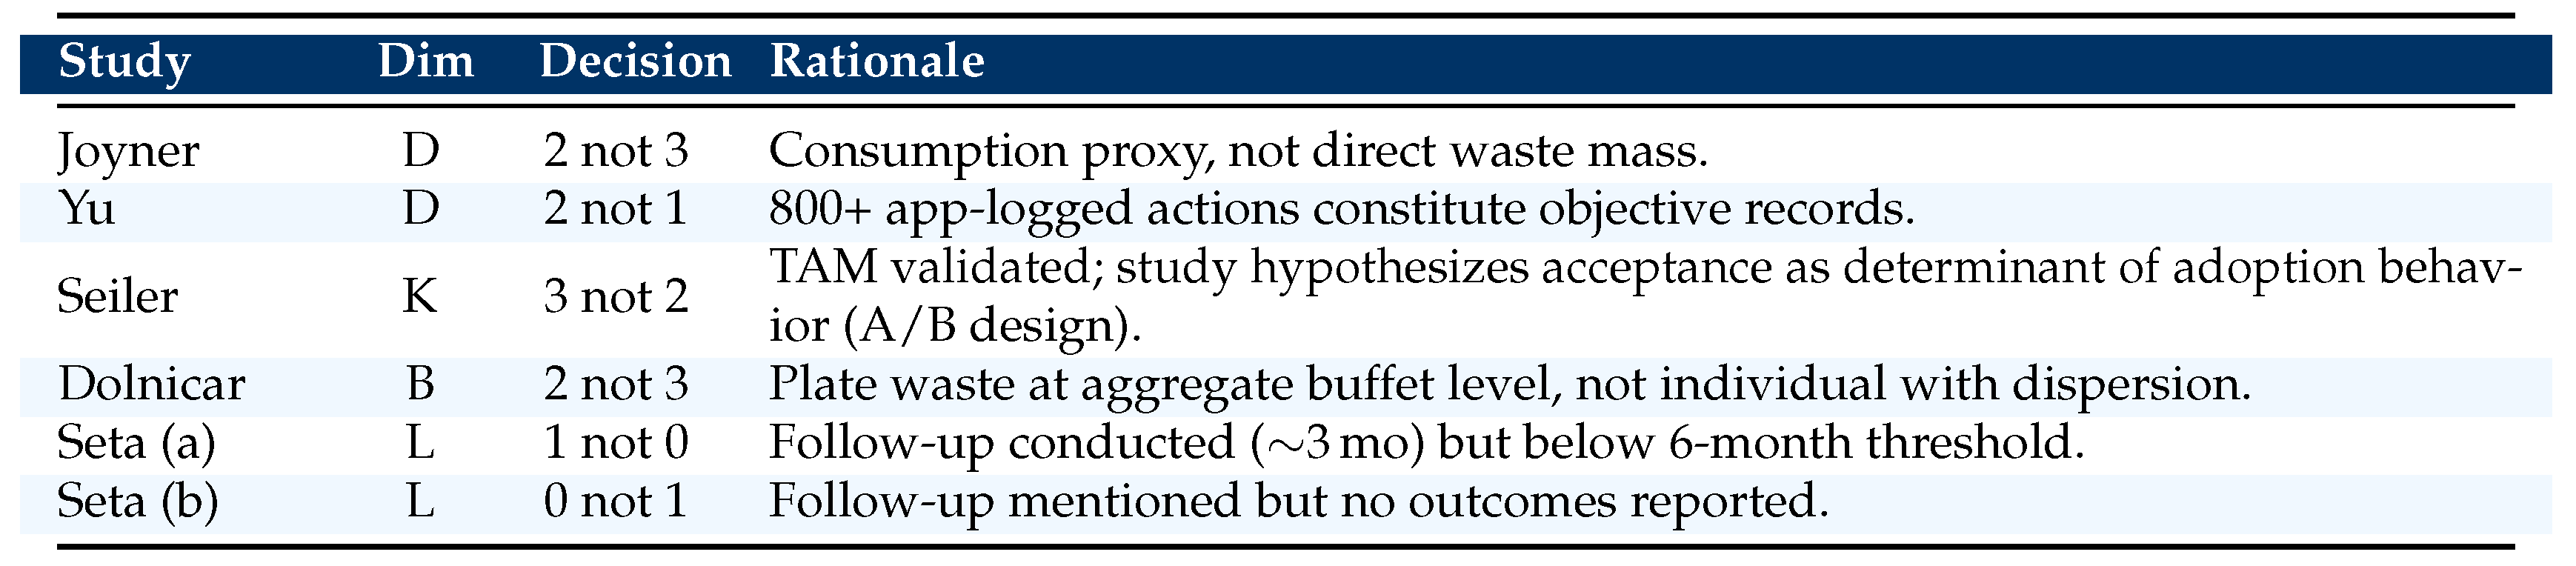
Table 9 documents six borderline scoring decisions where adjacent levels were considered. These cases operationalize the boundaries of each scale and illustrate decision rules.
We tested four threshold perturbations: (1) L2 threshold lowered from 6 to 3 months: Seta (a) L1→L2, but E0 blocks High; (2) consumption proxies excluded from D2: Joyner drops to Low (5→4 Moderate), gap unchanged; (3) TAM/SUS always K2 unless tied to a behavioral mediator: Seiler K3→K2, no D change, gap persists; (4) Moderate requires D≥3: Joyner removed (5→4), gap persists (still 0/35 with K≥2 and D≥2). Across the corpus, K and D are negatively correlated (Spearman , ; computed on raw ordinal scores from Table 7, , asymptotic p-value with ties; the correlation is primarily descriptive given ordinal data), suggesting that the complementary gap is a systematic pattern in this corpus rather than an artifact of threshold placement.
7. Discussion and Conclusion
As Hognon et al. [12] argue, evaluation should not be reduced to behavioral outcomes alone: the cognitive processes that serious games activate are themselves dimensions of impact, and K makes this visible. Yet the Theory of Planned Behavior [18] and Kirkpatrick’s hierarchy [16] both treat knowledge as necessary but insufficient for behavioral change. The complementary gap (Section 6) confirms this: without the measurement of actual behavioral outcomes, the field cannot establish whether cognitive gains translate into waste reduction [4]. This gap partly reflects disciplinary silos: HCI and education researchers prioritize learning outcomes (K), while public health and environmental science groups prioritize objective outcome measurement (D) without embedding games. Evidence from the corpus supports this reading: all five Moderate studies (D≥2) are gamification interventions, while all three K3 studies are games or serious games. Early-stage studies scoring K2 or K3 with D0 are not failures; they represent the first half of the measurement chain, and SG-FLW’s prospective mode can help them plan the second.
Inconsistent measurement compounds this problem [4,6]. SG-FLW’s profiles complement both systemic perspectives such as Rossitto et al.’s Digital Environmental Stewardship [56] and game-focused evaluation frameworks (engagement, usability, flow); it assesses only the evidence chain for waste reduction, not whether the game is well-designed. Used prospectively (Section 1), target profiles such as B2/K3/D2/E1/L2 make both K and D visible from the outset, avoiding the pattern where cognitive and behavioral measurement are treated as mutually exclusive.
The framework has limitations, SG-FLW evaluates measurement quality, not intervention quality; a low profile indicates missing evidence, not that the intervention failed. Its ordinal scale does not capture all study design nuances (K, for instance, groups distinct TPB constructs into a single rigor scale), and borderline cases are expected (Table 9); dual coding mitigates but does not eliminate subjectivity. E and L are empirically unanchored in this corpus (all E0; only one L>0), so E1–E3 distinctions remain untested until studies begin to report environmental conversion. Our corpus is drawn from two prior reviews, and the framework was iteratively refined on these same studies; independent application to a different corpus might yield different gap patterns. To mitigate overfitting, each scale level is anchored to observable reporting artifacts (weighing, validated instruments, app logs) rather than corpus-specific features. Reliability (; Section 6.3) is based on a single coder pair coding 12 of 35 studies; resource constraints prevented full dual-coding, but the purposive subsample spans the full evidence range and includes all borderline cases. SG-FLW does not capture intervention dosage or implementation fidelity, nor participatory outcomes from co-design processes. In continuous-measurement interventions where the instrument is also the game mechanic (e.g., SmartMat), B and D may be conflated through reactivity; this is a known issue in behavioral measurement generally, not specific to SG-FLW. Because the causal chain is domain-agnostic, SG-FLW could serve energy, water, or carbon domains; Hognon et al. [12] identified identical evaluation deficits in climate education.
Future studies should pair cognitive assessments (K) with objective behavioral measures (D≥2) and baselines (B≥2) to test the K→D pathway predicted by Ajzen [18], aligning with the EU’s call for standardized monitoring [9,10]. A minimal pathway to B2/K2/D2/E1/L1 requires: aggregate waste weighing before the intervention (B2), a structured pre/post questionnaire (K2), app-logged or photo-documented waste actions (D2), one published emission factor applied to the waste stream (E1), and a three-month follow-up (L1). None of these steps demands specialized equipment; upgrading to the full target B2/K3/D2/E1/L2 requires only substituting validated instruments for K and extending follow-up to six months. Environmental conversion (E≥1) should become routine for SDG 12.3 progress, and longitudinal follow-up (≥6 months) is needed to separate novelty from sustained change [12]. Reporting participant demographics [57,58] would enable moderator analyses across SG-FLW profiles.
Acknowledgments
This work was supported by national funds through the Foundation for Science and Technology, I. P. (FCT), under projects UID/05549/2025 https://doi.org/10.54499/UID/05549/2025 and LA/P/0050/2020 https://doi.org/10.54499/LA/P/0050/2020.
References
- Santos, E.; Sevivas, C.; Carvalho, V. Managing Food Waste Through Gamification and Serious Games: A Systematic Literature Review. Information 2025, 16. [Google Scholar] [CrossRef]
- Hammady, R.; Arnab, S. Serious Gaming for Behaviour Change: A Systematic Review. Information 2022, 13, 142. [Google Scholar] [CrossRef]
- Santos, E.F.d.; Sevivas, C.; Carvalho, V.; Rodrigues, N.F.; Oliveira, E.F.d. Serious Games for Food Waste Reduction: A Qualitative Review. In Proceedings of the Proceedings of the 13th International Conference on Serious Games and Applications for Health (SeGAH), Manchester, UK, 2025. [Google Scholar]
- Schanes, K.; Dobernig, K.; Gözet, B. Food waste matters - A systematic review of household food waste practices and their policy implications. J. Clean. Prod. 2018, 182, 978–991. [Google Scholar] [CrossRef]
- Bassanelli, S.; Vasta, N.; Bucchiarone, A.; Marconi, A. Gamification for behavior change: A scientometric review. Acta Psychol. 2022, 228, 103657. [Google Scholar] [CrossRef]
- Casonato, C.; García-Herrero, L.; Caldeira, C.; Sala, S. What a waste! Evidence of consumer food waste prevention and its effectiveness. Sustain. Prod. Consum. 2023, 41, 305–319. [Google Scholar] [CrossRef]
- Lipinski, B.; Hanson, C.; Waite, R.; Searchinger, T.; Lomax, J. Reducing food loss and waste. 2013. Available online: http://pdf.wri.org/reducing_food_loss_and_waste.pdf (accessed on 01-12-2024).
- Bagherzadeh, M.; M.I.; Jeong, H. Food Waste Along the Food Chain; Organisation for Economic Co-Operation and Development (OECD), 2014. [Google Scholar] [CrossRef]
- De Laurentiis, V.; Casonato, C.; Mancini, L.; García Herrero, L.; Valenzano, A.; Sala, S. Building Evidence on Food Waste Prevention Interventions; Number 137760 in JRC; Publications Office of the European Union: Luxembourg, 2024. [Google Scholar] [CrossRef]
- Caldeira, C.; Sala, S.; De Laurentiis, V. Assessment of food waste prevention actions: development of an evaluation framework to assess performance of food waste prevention actions; European Commission: Joint Research Centre, Publications Office of the European Union: Luxembourg, 2019. [Google Scholar] [CrossRef]
- Aitken, J.A.; Sprenger, A.; Alaybek, B.; Mika, G.; Hartman, H.; Leets, L.; Maese, E.; Davoodi, T. Surveys and Diaries and Scales, Oh My! A Critical Analysis of Household Food Waste Measurement. Sustainability 2024, 16, 968. [Google Scholar] [CrossRef]
- Hognon, L.; Teran-Escobar, C.; Bernard, P.; Chevance, G.; Caille, P. A call for robust evaluations of the impacts of serious games for climate change mitigation: The Climate Fresk as a global case study. J. Environ. Psychol. 2026. [Google Scholar] [CrossRef]
- Stepanovic, S.; Mettler, T. Gamification applied for health promotion: does it really foster long-term engagement? A scoping review. In Proceedings of the 36th European Conference on Information Systems, 2018. [Google Scholar]
- Guyatt, G.H.; Oxman, A.D.; Vist, G.E.; Kunz, R.; Falck-Ytter, Y.; Alonso-Coello, P.; Schünemann, H.J. GRADE: An emerging consensus on rating quality of evidence and strength of recommendations. BMJ 2008, 336, 924–926. [Google Scholar] [CrossRef]
- Glasgow, R.E.; Vogt, T.M.; Boles, S.M. Evaluating the public health impact of health promotion interventions: The RE-AIM framework. Am. J. Public Health 1999, 89, 1322–1327. [Google Scholar] [CrossRef] [PubMed]
- Kirkpatrick, D.L.; Kirkpatrick, J.D. Evaluating Training Programs: The Four Levels, 3rd ed.; Berrett-Koehler Publishers: San Francisco, CA, 2006. [Google Scholar]
- Michie, S.; Richardson, M.; Johnston, M.; Abraham, C.; Francis, J.; Hardeman, W.; Eccles, M.P.; Cane, J.; Wood, C.E. The Behavior Change Technique Taxonomy (v1) of 93 Hierarchically Clustered Techniques: Building an International Consensus for the Reporting of Behavior Change Interventions. Ann. Behav. Med. 2013, 46, 81–95. [Google Scholar] [CrossRef]
- Ajzen, I. The Theory of Planned Behavior. Organ. Behav. Hum. Decis. Process. 1991, 50, 179–211. [Google Scholar] [CrossRef]
- Montgomery, P.; Grant, S.; Mayo-Wilson, E.; Macdonald, G.; Michie, S.; Hopewell, S.; Moher, D. CONSORT-SPI 2018 explanation and elaboration: Guidance for reporting social and psychological intervention trials. Trials 2018, 19, 406. [Google Scholar] [CrossRef] [PubMed]
- Cohen, J. Statistical Power Analysis for the Behavioral Sciences, 2nd ed.; Lawrence Erlbaum Associates, 1988. [Google Scholar]
- Verloop, C. Developing a serious game as a tool for collecting data on food waste behavior. PhD thesis, University of Twente, 2018. [Google Scholar]
- Seta, Y.; Yamakawa, H.; Okayama, T.; Watanabe, K.; Nonomura, M. Effects of a Gamified Self-Monitoring App on Household Food Waste Reduction. Detritus 2025. [Google Scholar] [CrossRef]
- Altarriba, F.; Lanzani, S.E.; Torralba, A.; Funk, M. The Grumpy Bin. In Proceedings of the Proceedings of the 2017 ACM Conference Companion Publication on Designing Interactive Systems. ACM, ACM, jun 10 2017, DIS ’17. [CrossRef]
- Joyner, D.; Wengreen, H.J.; Aguilar, S.S.; Spruance, L.A.; Morrill, B.A.; Madden, G.J. The FIT Game III: Reducing the Operating Expenses of a Game-Based Approach to Increasing Healthy Eating in Elementary Schools. Games Health J. 2017, 6, 111–118. [Google Scholar] [CrossRef]
- Sato, M.; Tsunoda, M.; Imamura, H.; Mizuyama, H.; Nakano, M. The design and evaluation of a multi-player milk supply chain management game. In Simulation Gaming. Applications for Sustainable Cities and Smart Infrastructures; Springer International Publishing, 2018; Vol. LNCS 10825, pp. 110–118. Proceedings of the 48th International Simulation and Gaming Association Conference (ISAGA 2017),. [CrossRef]
- Tian, M.; Zheng, Y. How to Reduce Food Waste Caused by Normative Illusion? A Study Based on Evolutionary Game Model Analysis. Foods 2022, 11, 2162. [Google Scholar] [CrossRef]
- Miller, M.; Barwood, D.; Devine, A.; Boston, J.; Smith, S.; Masek, M. Rethinking Adolescent School Nutrition Education Through a Food Systems Lens. J. Sch. Health 2023, 93, 891–899. [Google Scholar] [CrossRef]
- Rodrigues, R.; Pombo, L. The Potential of a Mobile Augmented Reality Game in Education for Sustainability: Report and Analysis of an Activity with the EduCITY App. Sustainability 2024, 16. [Google Scholar] [CrossRef]
- Elnakib, S.; Subhit, S.; Shukaitis, J.; Rowe, A.; Cava, J.; Quick, V. New Jersey Leaves No Bite Behind: A Climate Change and Food Waste Curriculum Intervention for Adolescents in the United States. Int. J. Environ. Res. Public Health 2024, 21, 437. [Google Scholar] [CrossRef]
- Gruter, C. The game design of a serious game about food waste. 2018. [Google Scholar]
- Sinclear, D.; Birch Flensborg, L.; Lindblad Fogsgaard, A.; Lochtefeld, M. Face-the-Waste - Learning about Food Waste through a Serious Game. In Proceedings of the 20th International Conference on Mobile and Ubiquitous Multimedia. ACM, ACM, may 12 2021, MUM 2021. [Google Scholar] [CrossRef]
- Seiler, R.; Fankhauser, D.; Keller, T. Reducing food waste with virtual reality (VR) training : a prototype and A/B-test in an online experiment. In Proceedings of the Proceedings of the International Conferences on e-Society 2022 and Mobile Learning 2022; Kommers, P.; Arnedillo Sánchez, I.; Isaías, P., Eds. IADIS, 2022, pp. 179–186. 20th International Conference e-Society 2022, Virtual, 12-14 March 2022.
- Sato, M.; Mizuyama, H. Global Environmental Issues: Food and Agriculture Education to Address Food Loss and Waste, Aiming at a Sustainable Supply Chain. J. Nutr. Sci. Vitaminol. 2022, 68, S95–S97. [Google Scholar] [CrossRef]
- Vasconcelos, F.; Dionísio, M.; Câmara Olim, S.; Campos, P. Game ON! a Gamified Approach to Household Food Waste Reduction. In Proceedings of the Entertainment Computing – ICEC 2023;Number 14455 in Lecture Notes in Computer Science, 1st ed. 2023; Ciancarini, P., Di Iorio, A., Hlavacs, H., Poggi, F., Eds.; Singapore, 2023; pp. 139–149. [Google Scholar]
- Jespersen, K.N.; Odgaard, R.; Julsgaard, K.; Madsbøll, J.L.; Lundbak, M.H.; Niebuhr, M.; Skovfoged, M.M.; Löchtefeld, M. FoodFighters - Improving Memory Retention of Food Items through a Mobile Serious Game. In Proceedings of the Extended Abstracts of the 2023 CHI Conference on Human Factors in Computing Systems. ACM, apr 2023, CHI ’23. [CrossRef]
- Löchtefeld, M.; Møller, F.; Kyster, L.; Petersen, A.N.; Jaqué, S.N.; Larsen, A.; Ziadeh, H. FridgeSort - Improving Fridge Sorting behaviour to reduce Food Waste through a Mobile Serious Game. In Proceedings of the Proceedings of the 22nd International Conference on Mobile and Ubiquitous Multimedia. ACM, dec 2023, MUM ’23. Publisher: dl.acm.org. [CrossRef]
- Vasconcelos, F. Development of Masters contra o Desperdicio, a game for awareness on Food waste. Master’s thesis, University of Madeira, 2023. [Google Scholar]
- Olim, S.C.; Vasconcelos, F.; Dionisio, M.; Campos, P. “Masters Against Food Waste” Providing Children with Strategies to Avoid Food Waste. In Proceedings of the Serious Games; Plass, J.L., Ochoa, X., Eds.; Cham, 2025; pp. 155–174. [Google Scholar]
- Fadhil, A.; Villafiorita, A. An Adaptive Learning with Gamification & Conversational UIs: The Rise of CiboPoliBot. In Proceedings of the AdJunct Publication of the 25th Conference on User Modeling, Adaptation and Personalization. ACM, Jul 2017, UMAP ’17, pp. 408–412. [CrossRef]
- Anderson, C.G.; Reid, L.A. Collaborative decision-making in multi-buy food purchases. J. Clean. Prod. 2019, 216, 520–527. [Google Scholar] [CrossRef]
- Dolnicar, S.; Juvan, E.; Grün, B. Reducing the plate waste of families at hotel buffets – A quasi-experimental field study. Tour. Manag. 2020, 80, 104103. [Google Scholar] [CrossRef]
- Gaggi, O.; Meneghello, F.; Palazzi, C.E.; Pante, G. Learning how to recycle waste using a game. In Proceedings of the Proceedings of the 6th EAI International Conference on Smart Objects and Technologies for Social Good. ACM, ACM, sep 14 2020, GoodTechs ’20. [CrossRef]
- Jacobsen, R.M.; Johansen, P.S.; Bysted, L.B.L.; Skov, M.B. Waste Wizard: Exploring Waste Sorting using AI in Public Spaces. In Proceedings of the Proceedings of the 11th Nordic Conference on Human-Computer Interaction: Shaping Experiences, Shaping Society. ACM, Oct 2020, NordiCHI ’20. [CrossRef]
- Soma, T.; Li, B.; Maclaren, V. Food Waste Reduction: A Test of Three Consumer Awareness Interventions. Sustainability 2020, 12, 907. [Google Scholar] [CrossRef]
- He, H.; He, Y.; Yu, Y. Research on the Cultivation of Food-saving Habits Based on Behavioral Design. In Proceedings of the 2021 14th International Symposium on Computational Intelligence and Design (ISCID), Dec 2021; Institute of Electrical and Electronics Engineers Inc.; pp. 202–205. [Google Scholar] [CrossRef]
- Nkwo, M.; Suruliraj, B.; Orji, R. Persuasive Apps for Sustainable Waste Management: A Comparative Systematic Evaluation of Behavior Change Strategies and State-of-the-Art. Front. Artif. Intell. 2021, 4. [Google Scholar] [CrossRef]
- Haas, R.; Aşan, H.; Doğan, O.; Michalek, C.R.; Karaca Akkan, Ö.; Bulut, Z.A. Designing and Implementing the MySusCof App—A Mobile App to Support Food Waste Reduction. Foods 2022, 11, 2222. [Google Scholar] [CrossRef] [PubMed]
- Tuah, N.M.; Ghani, S.K.A.; Darham, S.; Sura, S. A Food Waste Mobile Gamified Application Design Model using UX Agile Approach in Malaysia. Int. J. Adv. Comput. Sci. Appl. 2022, 13, 208–217. [Google Scholar] [CrossRef]
- Jung, D. CoCo: Compost Companion: Design and Evaluation of a Wearable Pet That Supports Composting Habits Towards an Interaction Design for Empathy. In Proceedings of the Extended Abstracts of the 2023 CHI Conference on Human Factors in Computing Systems, New York, NY, USA, 2023; p. CHI EA ’23. [Google Scholar] [CrossRef]
- Perera, D.; Verdezoto Dias, N.; Gwilliam, J.; Eslambolchilar, P. COMPASS 2023 - Proceedings of the ACM SIGCAS/SIGCHI Conference on Computing and Sustainable Societies. In Proceedings of the Proceedings of the 6th ACM SIGCAS/SIGCHI Conference on Computing and Sustainable Societies. ACM, Inc, Aug 2023; COMPASS ’23, pp. 30–42. [Google Scholar] [CrossRef]
- Pajpach, M.; Sekerák, Ľ.; Kučera, E.; Haffner, O.; Pribiš, R.; Beňo, L.; Janecký, D. Exspiro - Mobile Application for Food Sustainability. In Proceedings of the 2023 International Conference on Modeling, Simulation & Intelligent Computing (MoSICom). IEEE, Dec 2023; pp. 77–82. [CrossRef]
- Yu, Y.; Yi, S.; Nan, X.; Lo, L.Y.H.; Shigyo, K.; Xie, L.; Wicaksana, J.; Cheng, K.T.; Qu, H. FoodWise: Food Waste Reduction and Behavior Change on Campus with Data Visualization and Gamification. 6th ACM SIGCAS/SIGCHI Conference on Computing and Sustainable Societies. ACM, 2023, COMPASS ’23; pp. 76–83. [CrossRef]
- Hamada, M.; Tanguay Doucet, I.; Aurélie, B. COOKNOOK: Intelligent Meal Planning Application. In Proceedings of the Extended Abstracts of the CHI Conference on Human Factors in Computing Systems. ACM, May 2024, CHI ’24; pp. 1–6. [CrossRef]
- Cruz, E.S.; Baranda, A.; Illanes, E.; Rioja, P.; Rios, Y.; Riesco, S.; da Quinta, N. Co-creating a gamification tool for children and parents to improve their food nutrition Knowledge and dietary habits. Sci. Talks 2024, 10, 100355–100355. [Google Scholar] [CrossRef]
- Seta, Y.; Yamakawa, H.; Okayama, T.; Watanabe, K.; Nonomura, M. The Effects of Interventions Using Support Tools to Reduce Household Food Waste: A Study Using a Cloud-Based Automatic Weighing System. Sustainability 2025, 17, 6392. [Google Scholar] [CrossRef]
- Rossitto, C.; Comber, R.; Tholander, J.; Jacobsson, M. Towards Digital Environmental Stewardship: the Work of Caring for the Environment in Waste Management. In Proceedings of the Proceedings of the 2022 CHI Conference on Human Factors in Computing Systems, New York, NY, USA, 2022; p. CHI ’22. [Google Scholar] [CrossRef]
- Koivupuro, H.; Hartikainen, H.; Silvennoinen, K.; Katajajuuri, J.; Heikintalo, N.; Reinikainen, A.; Jalkanen, L. Influence of socio-demographical, behavioural and attitudinal factors on the amount of avoidable food waste generated in Finnish households. Int. J. Consum. Stud. 2012, 36, 183–191. [Google Scholar] [CrossRef]
- Aschemann-Witzel, J.; De Hooge, I.; Amani, P.; Bech-Larsen, T.; Oostindjer, M. Consumer-Related Food Waste: Causes and Potential for Action. Sustainability 2015, 7, 6457–6477. [Google Scholar] [CrossRef]
| 1 | The exponential decay model assumes ; fitting to observed PI values yields the half-life. |

Table 1.
Baseline (B) dimension rating scale.
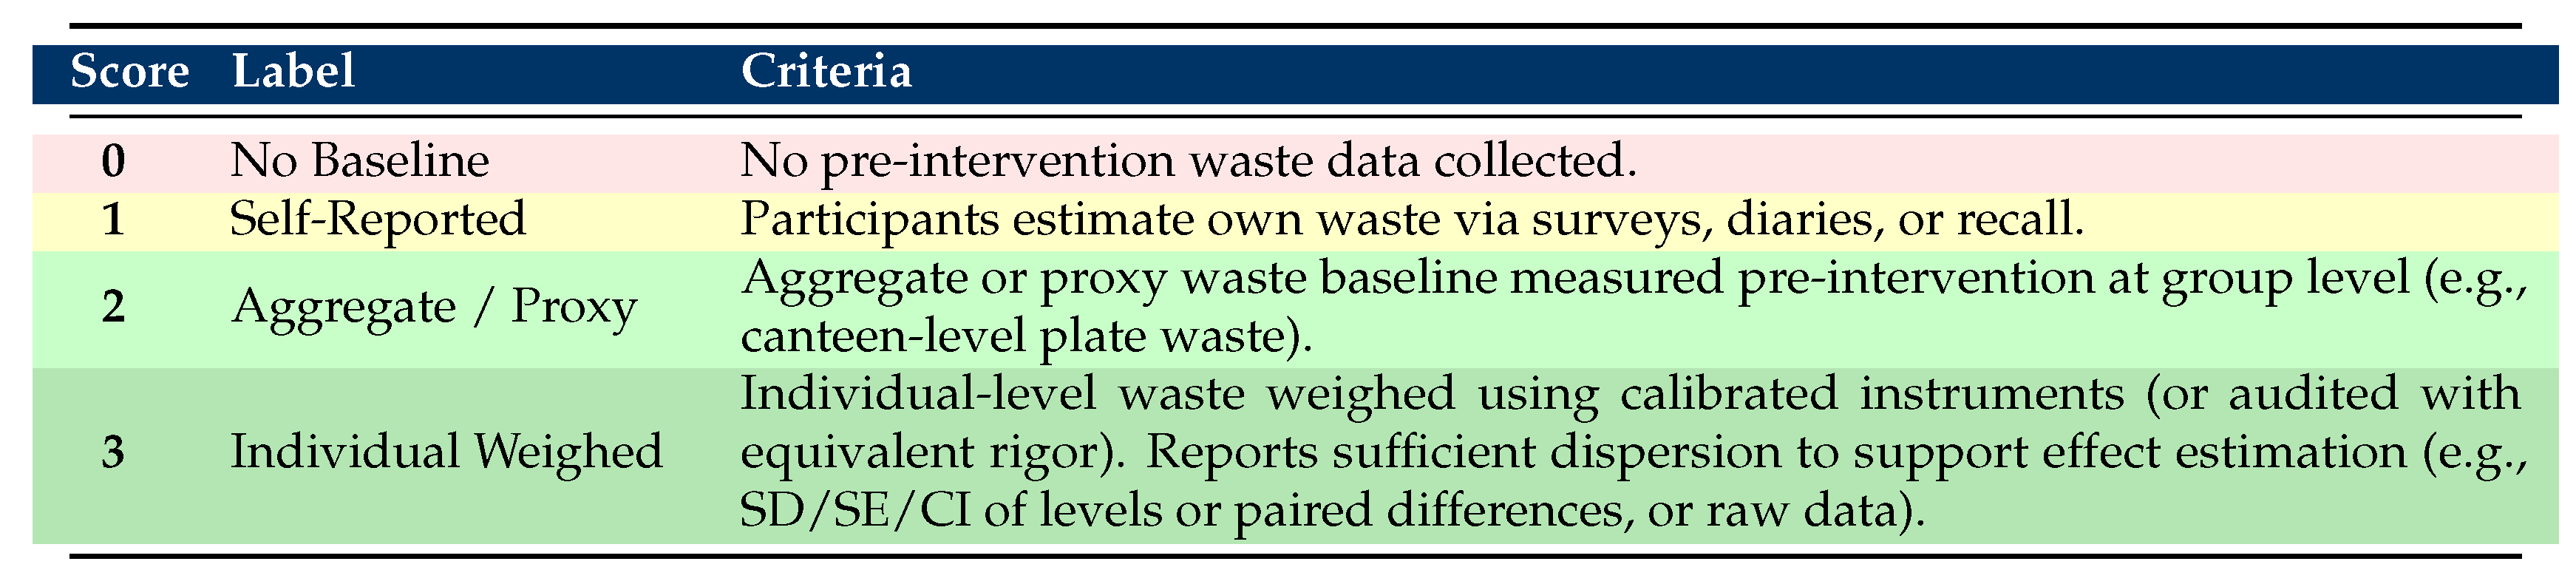 |
Table 2.
Knowledge & Attitudinal (K) dimension rating scale.
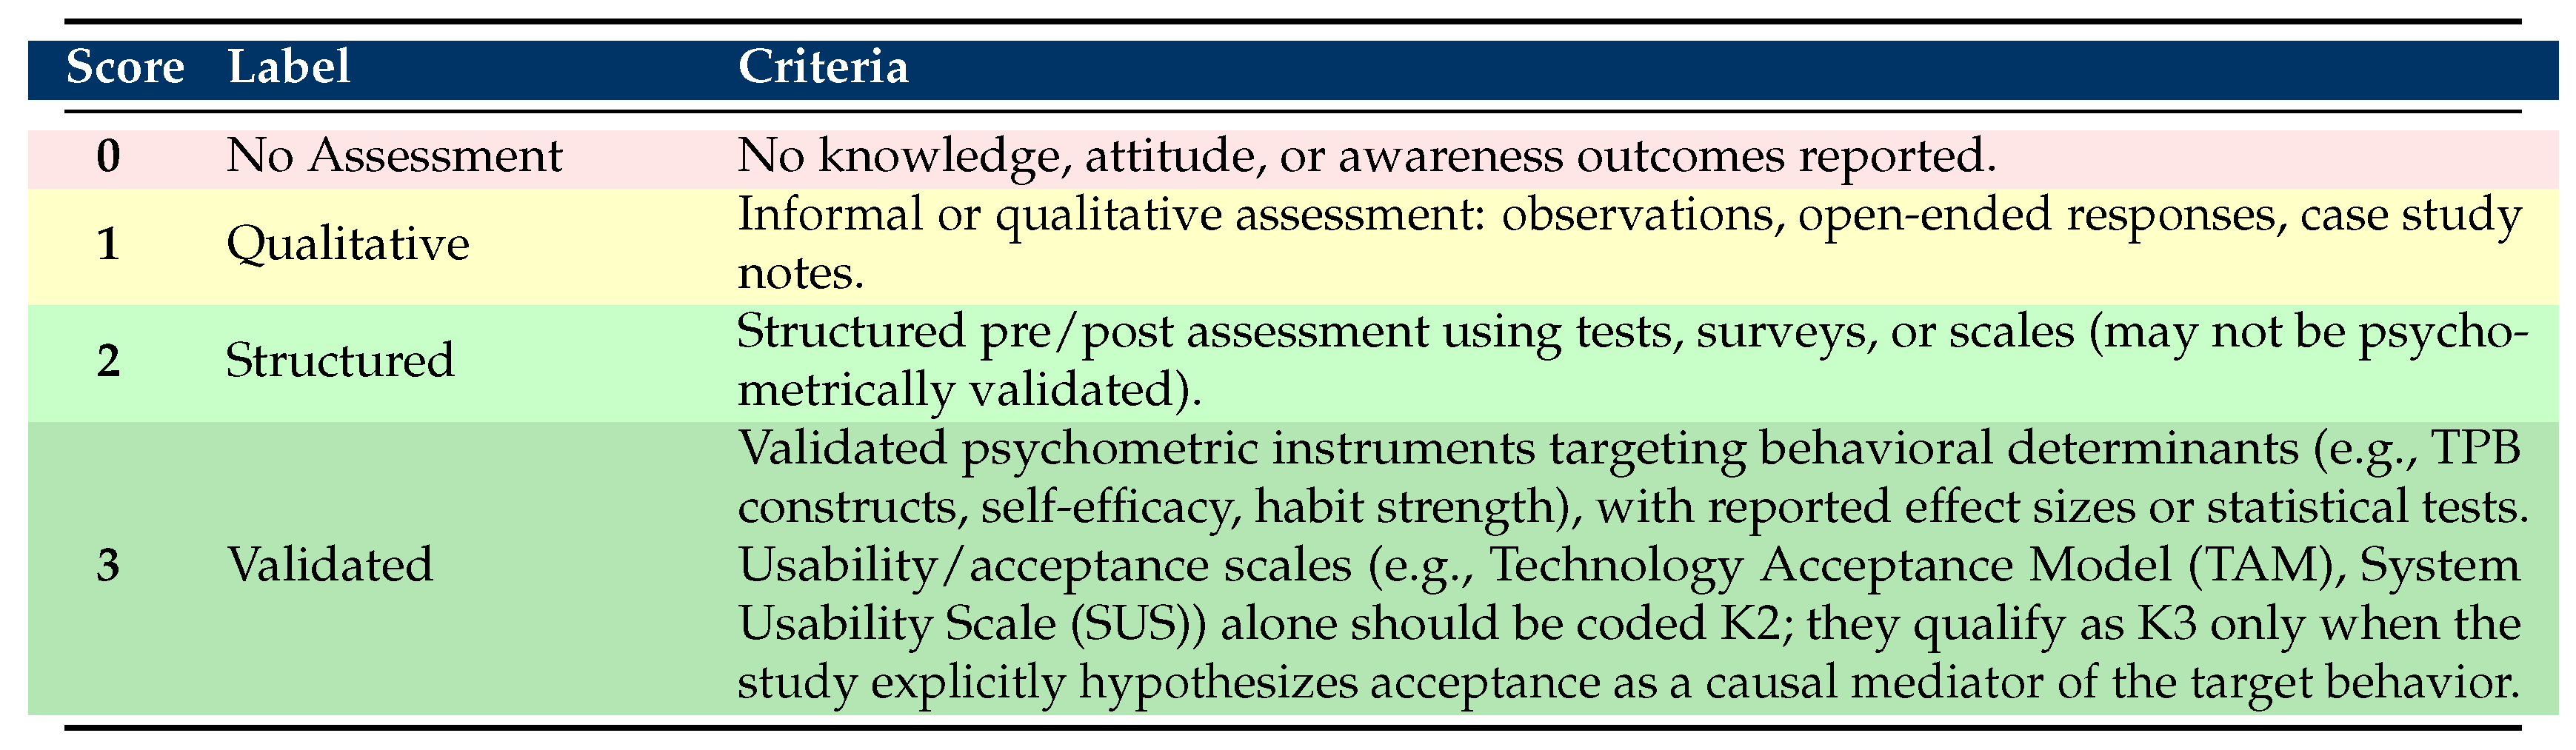 |
Table 3.
Direct Behavior (D) dimension rating scale.
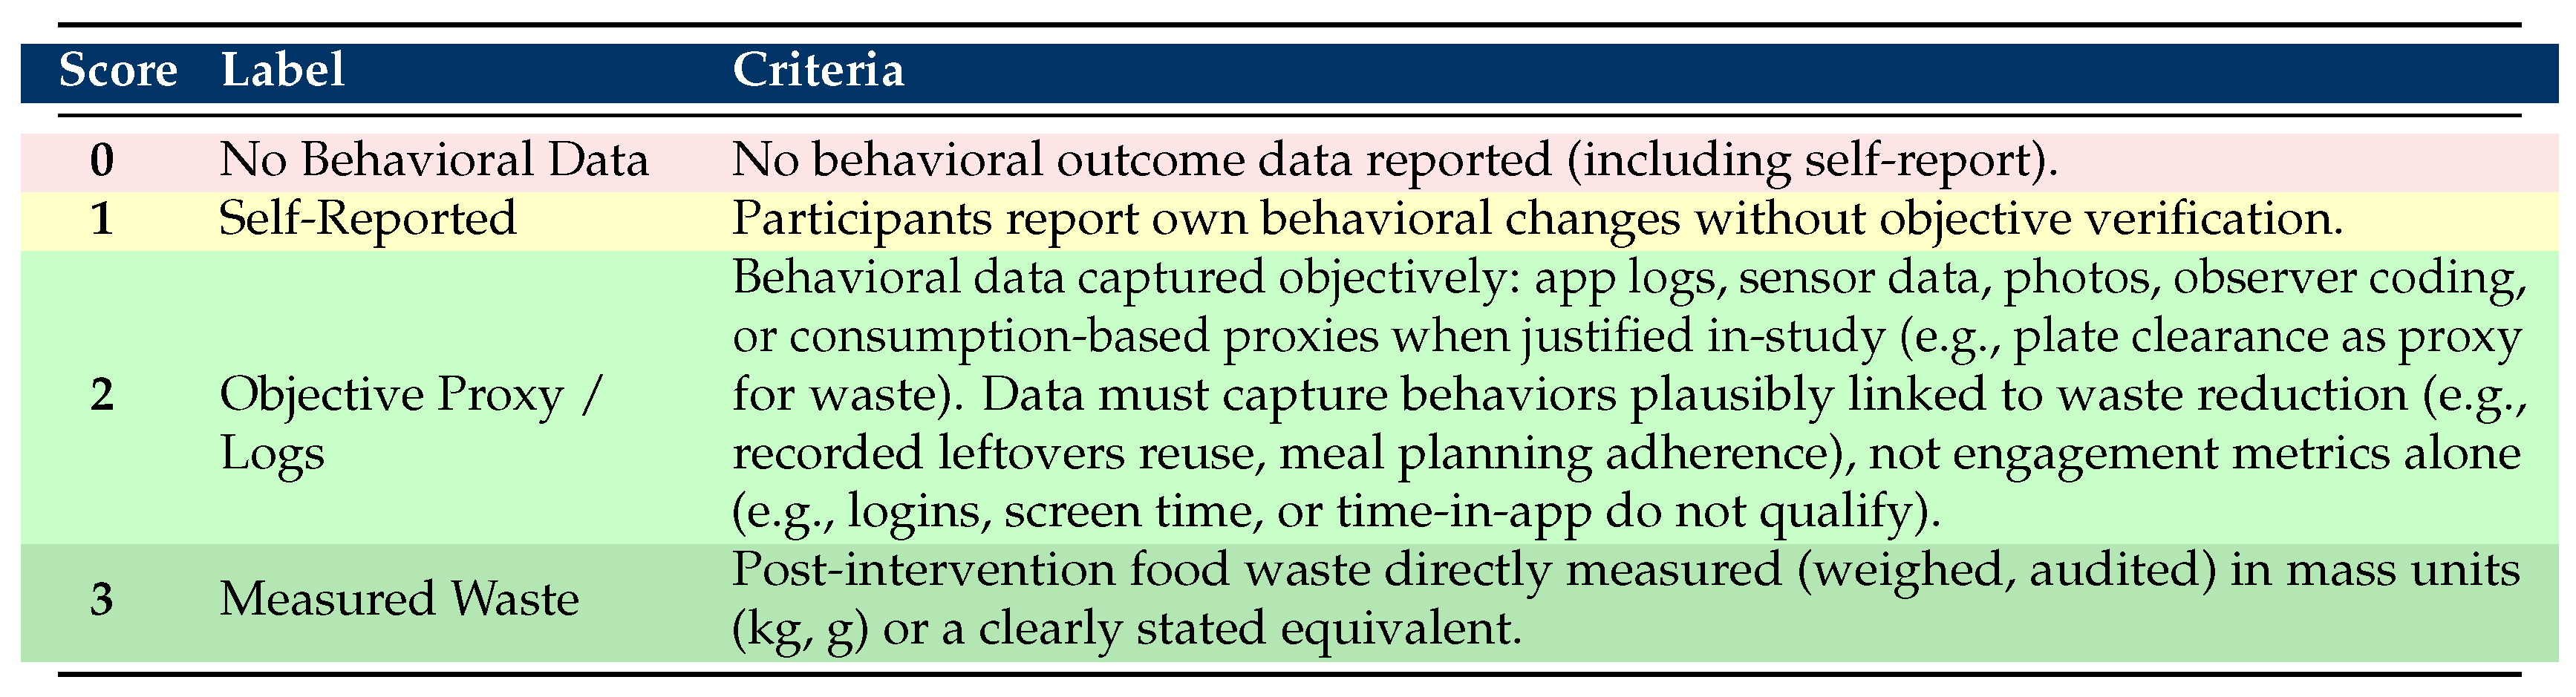 |
Table 4.
Environmental Conversion (E) dimension rating scale.
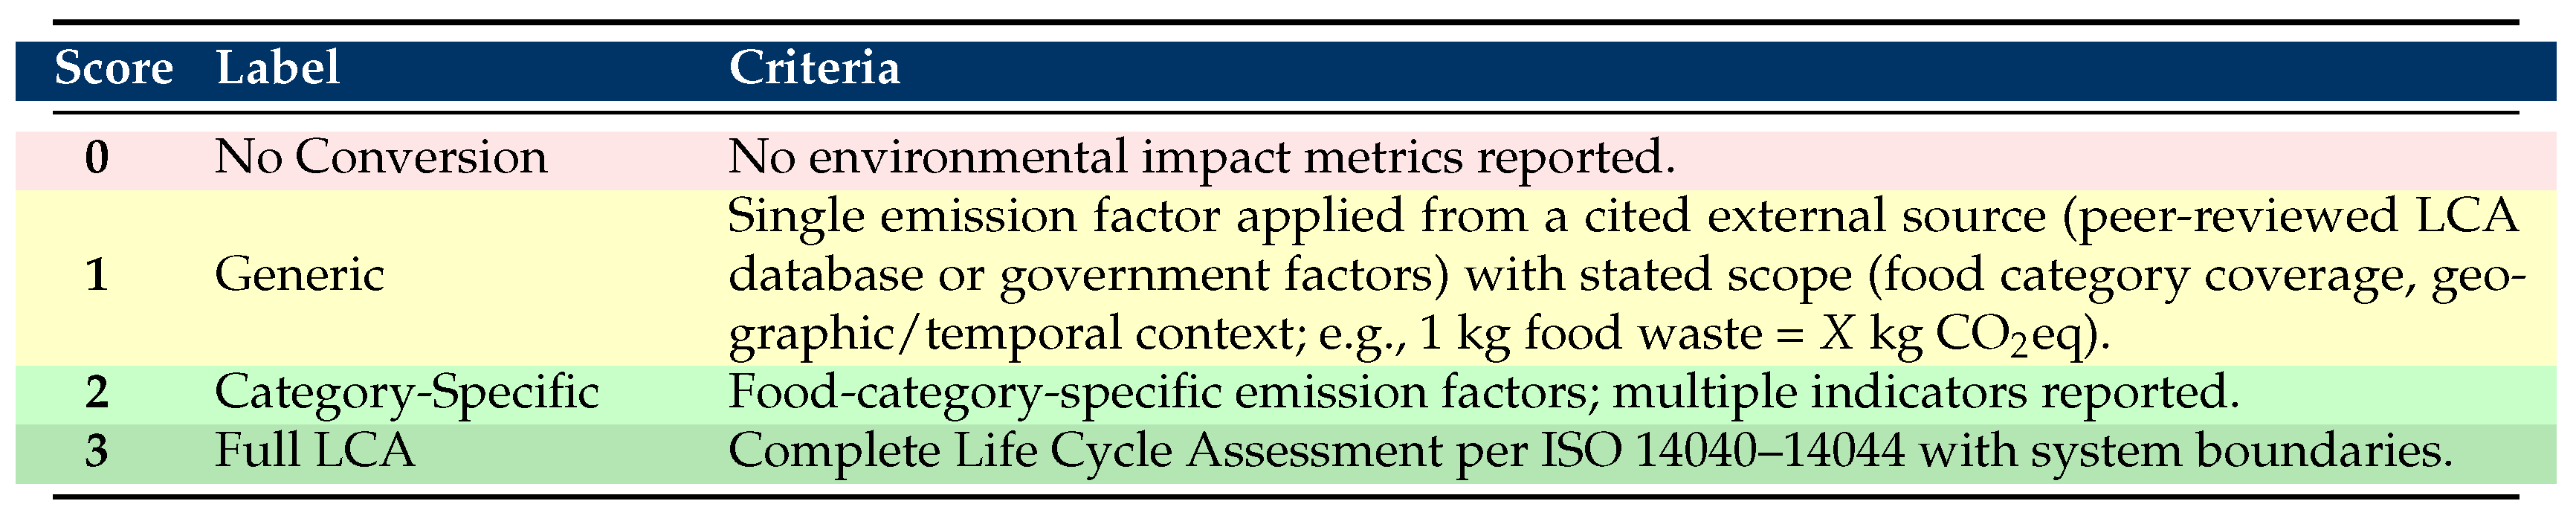 |
Table 5.
Persistence (L) dimension rating scale.
 |
Table 6.
GRADE-inspired measurement-chain certainty classification.
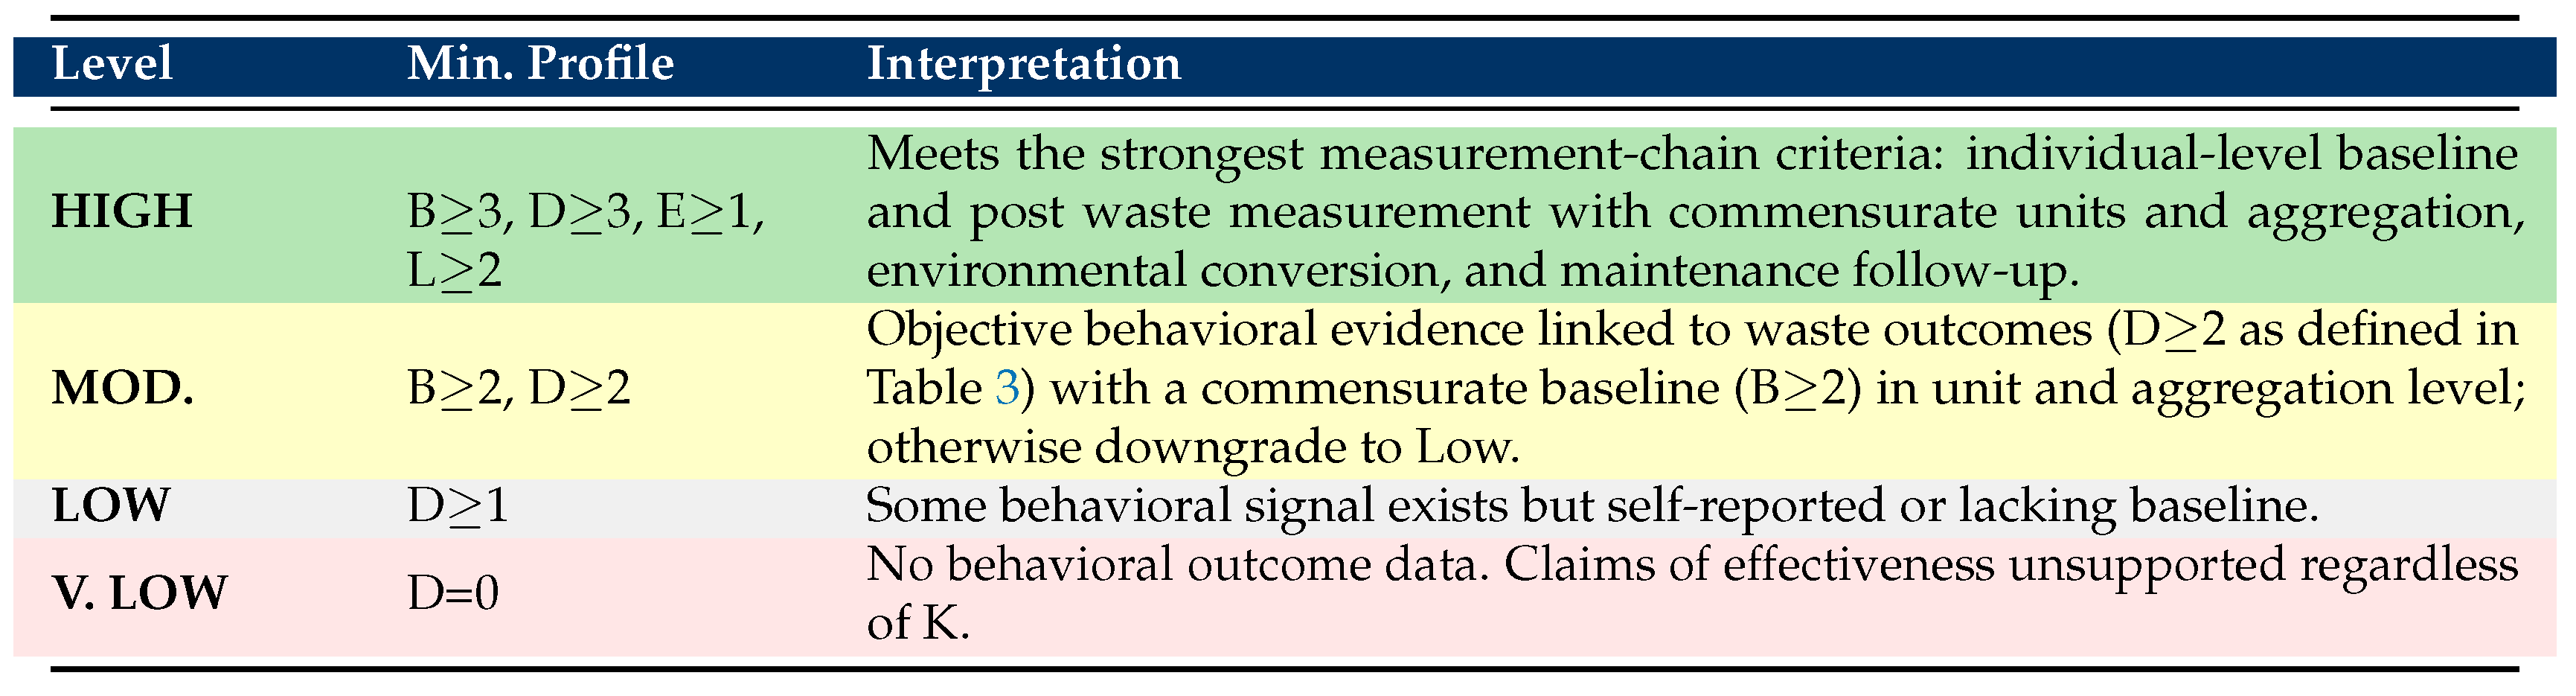 |
Table 7.
SG-FLW profiles for all reviewed food waste interventions. Classification follows [1].
Table 7.
SG-FLW profiles for all reviewed food waste interventions. Classification follows [1].
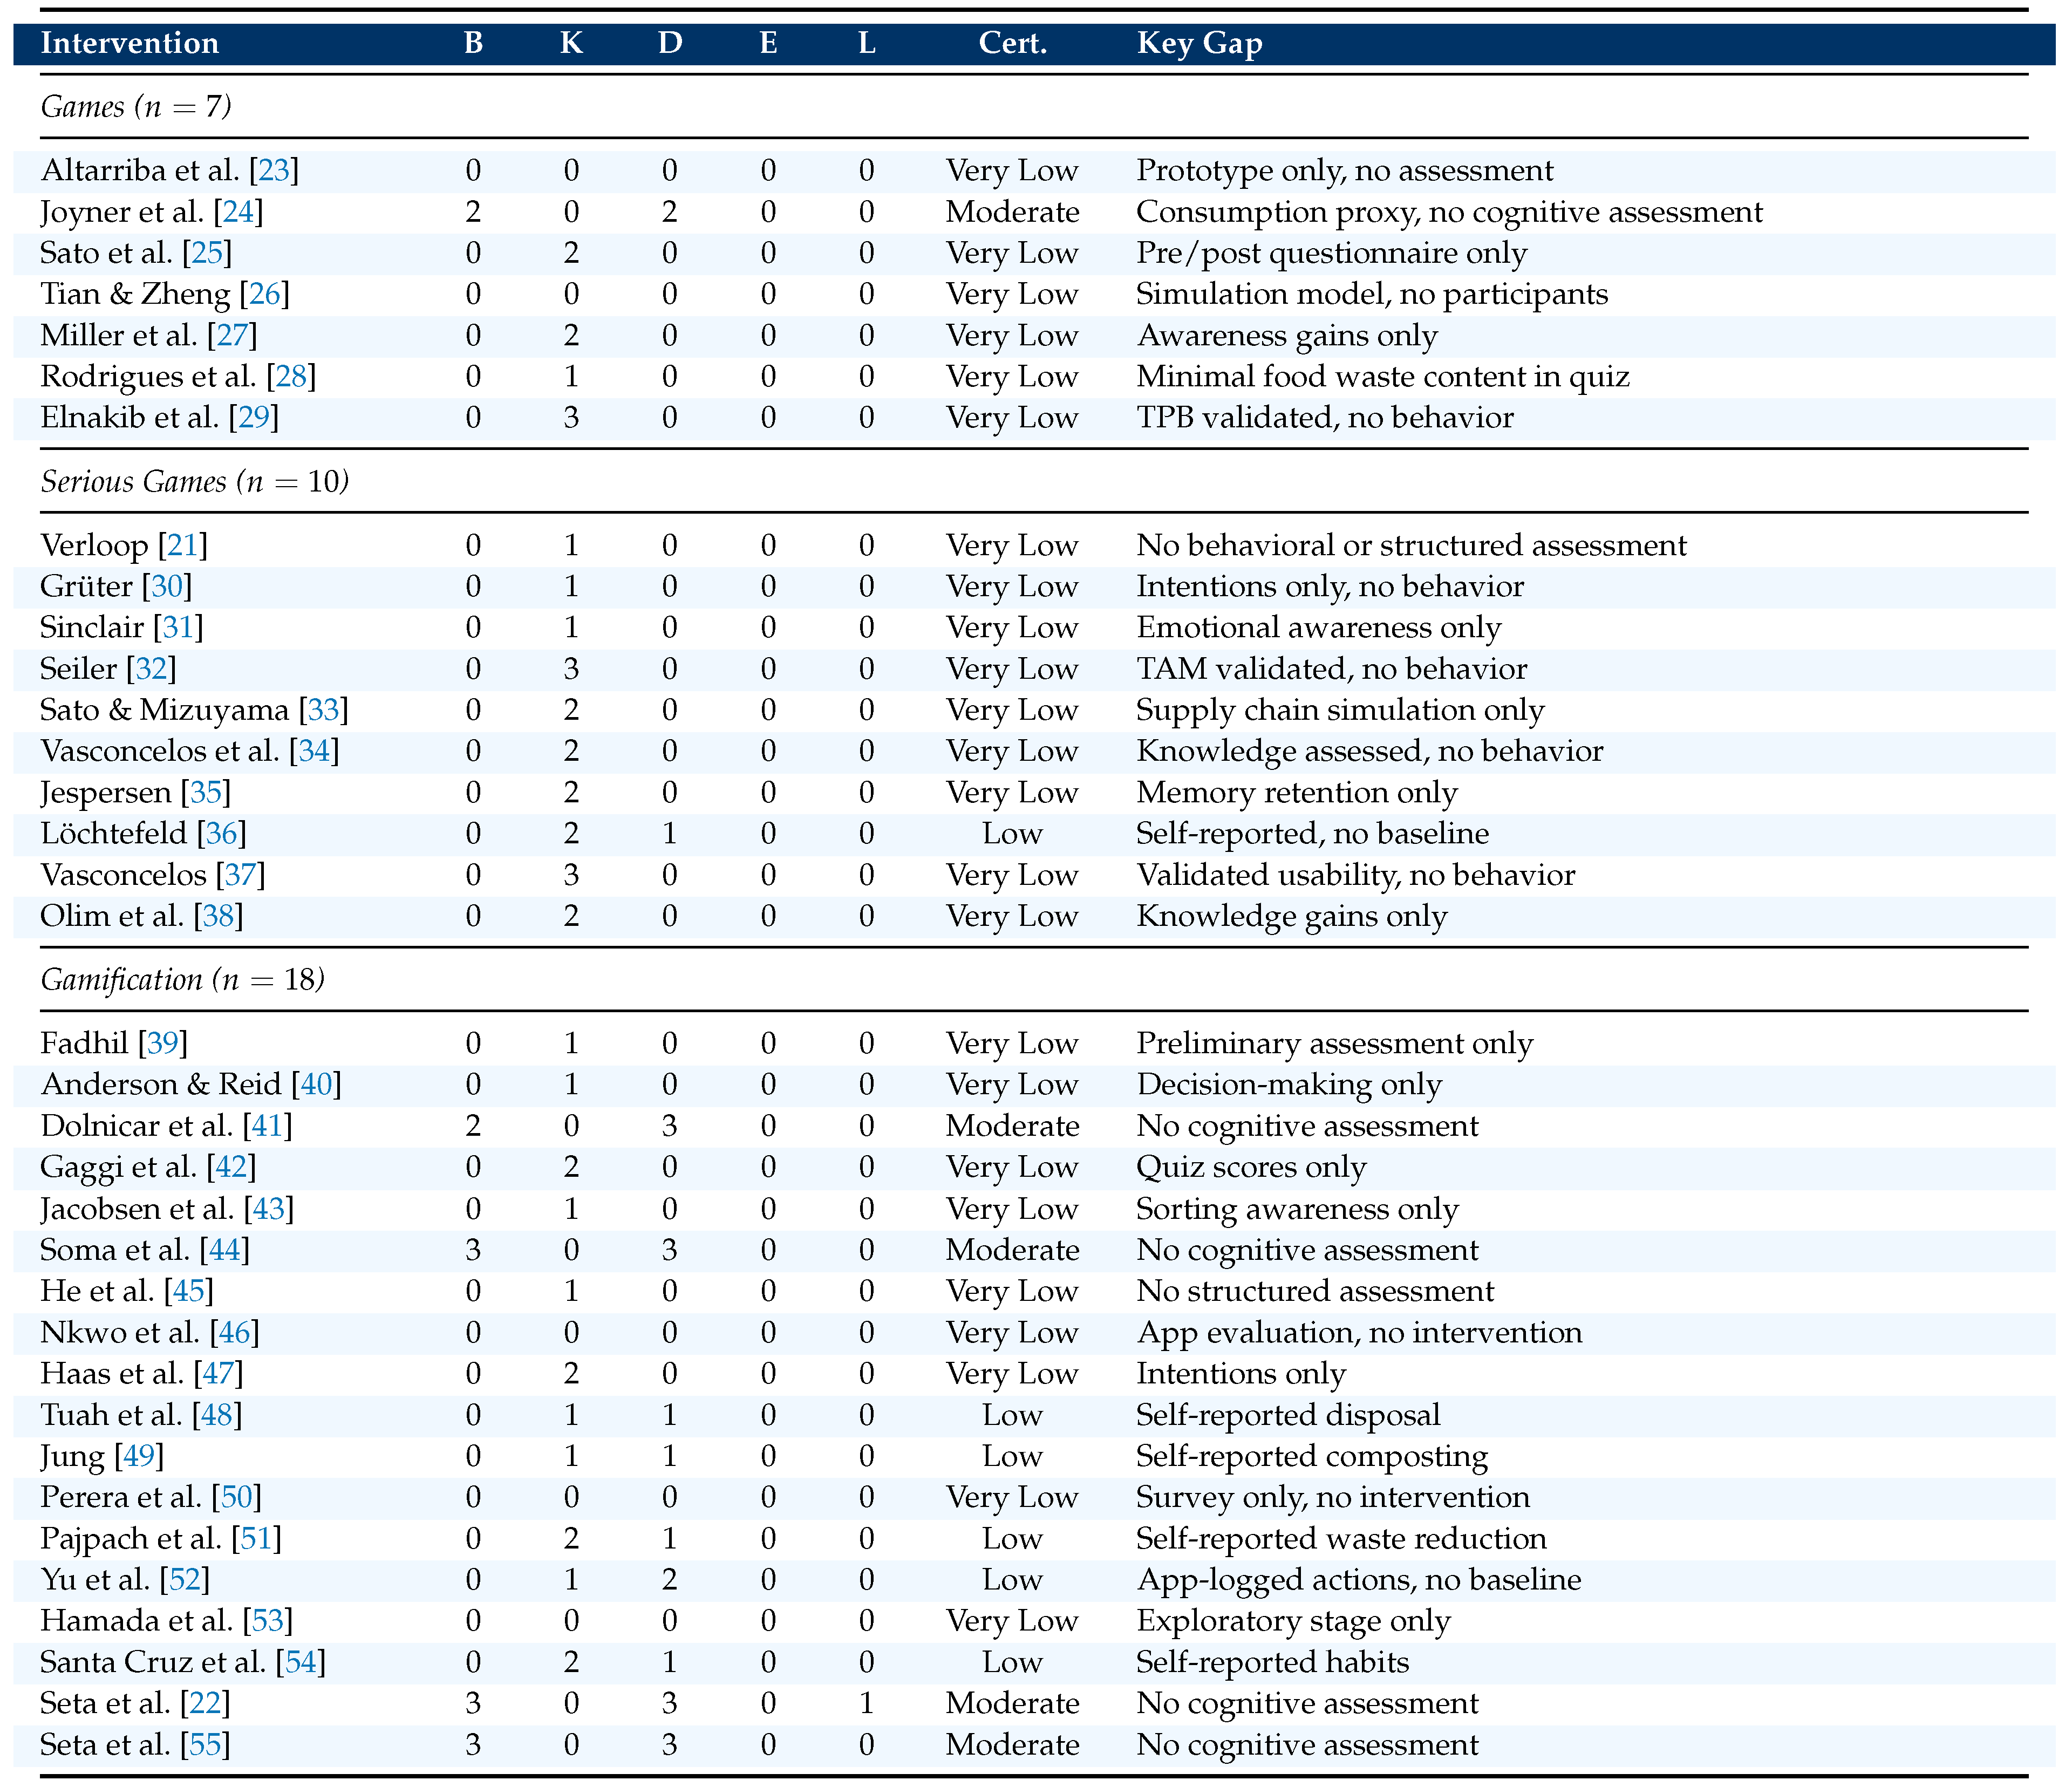 |
Table 8.
Inter-rater reliability on stratified subsample ().
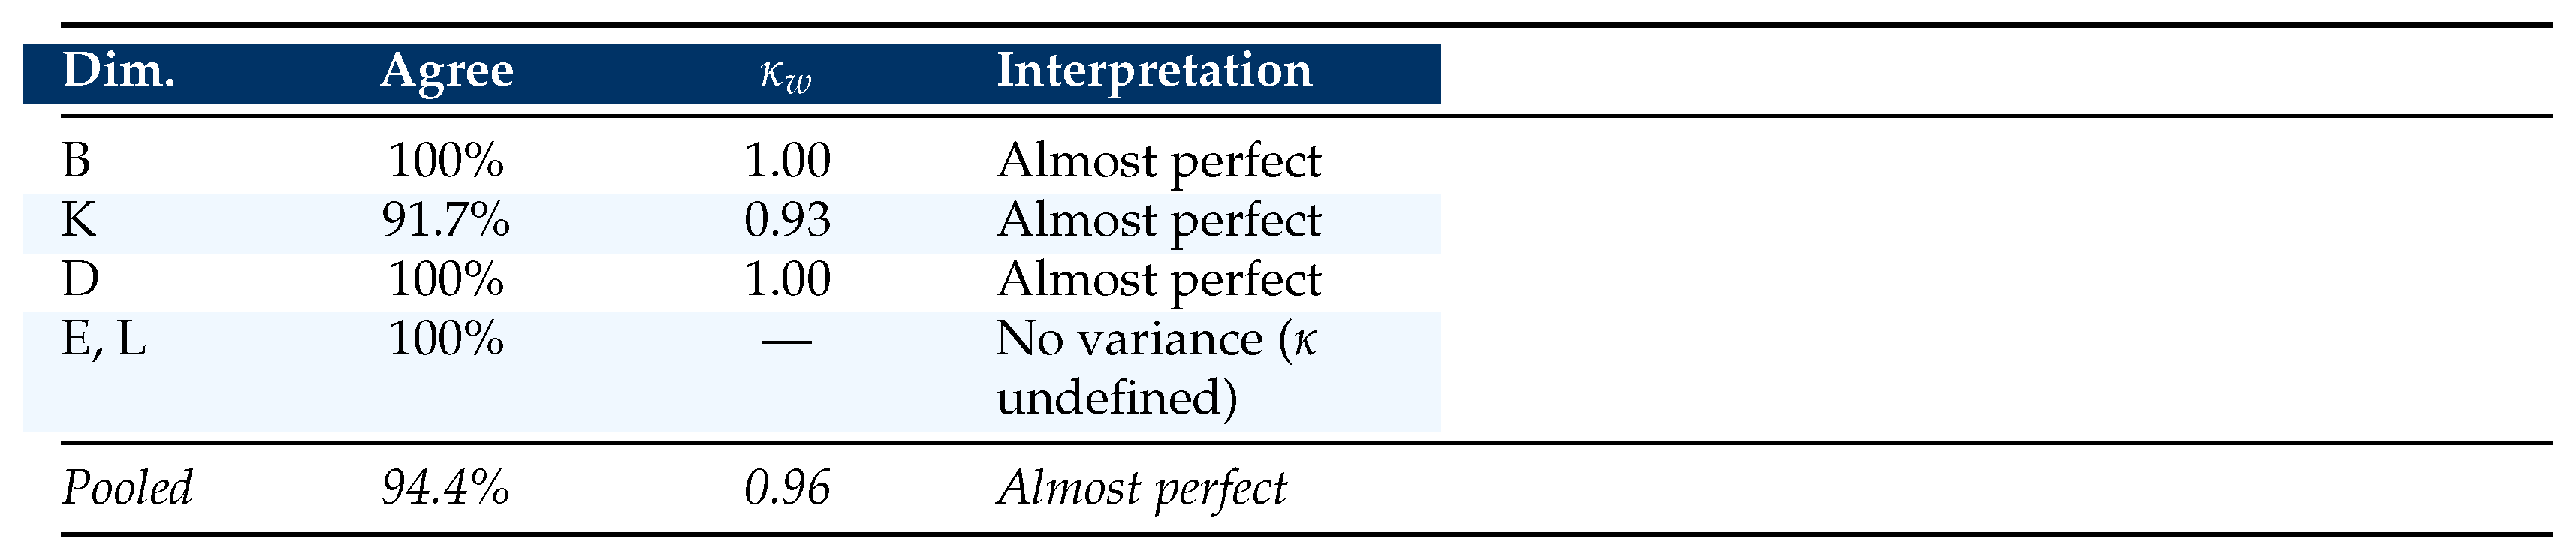 |
= linearly weighted Cohen’s . Linear weights penalize all adjacent-level disagreements equally on this 4-level scale. Pooled computed on 36 stacked B+K+D rating pairs. Labels follow Landis & Koch (1977). E, L: undefined (no variance).
Table 9.
Borderline scoring decisions.
 |
Disclaimer/Publisher’s Note: The statements, opinions and data contained in all publications are solely those of the individual author(s) and contributor(s) and not of MDPI and/or the editor(s). MDPI and/or the editor(s) disclaim responsibility for any injury to people or property resulting from any ideas, methods, instructions or products referred to in the content. |
© 2026 by the authors. Licensee MDPI, Basel, Switzerland. This article is an open access article distributed under the terms and conditions of the Creative Commons Attribution (CC BY) license (http://creativecommons.org/licenses/by/4.0/).
Copyright: This open access article is published under a Creative Commons CC BY 4.0 license, which permit the free download, distribution, and reuse, provided that the author and preprint are cited in any reuse.


