Submitted:
24 April 2026
Posted:
26 May 2026
You are already at the latest version
Abstract
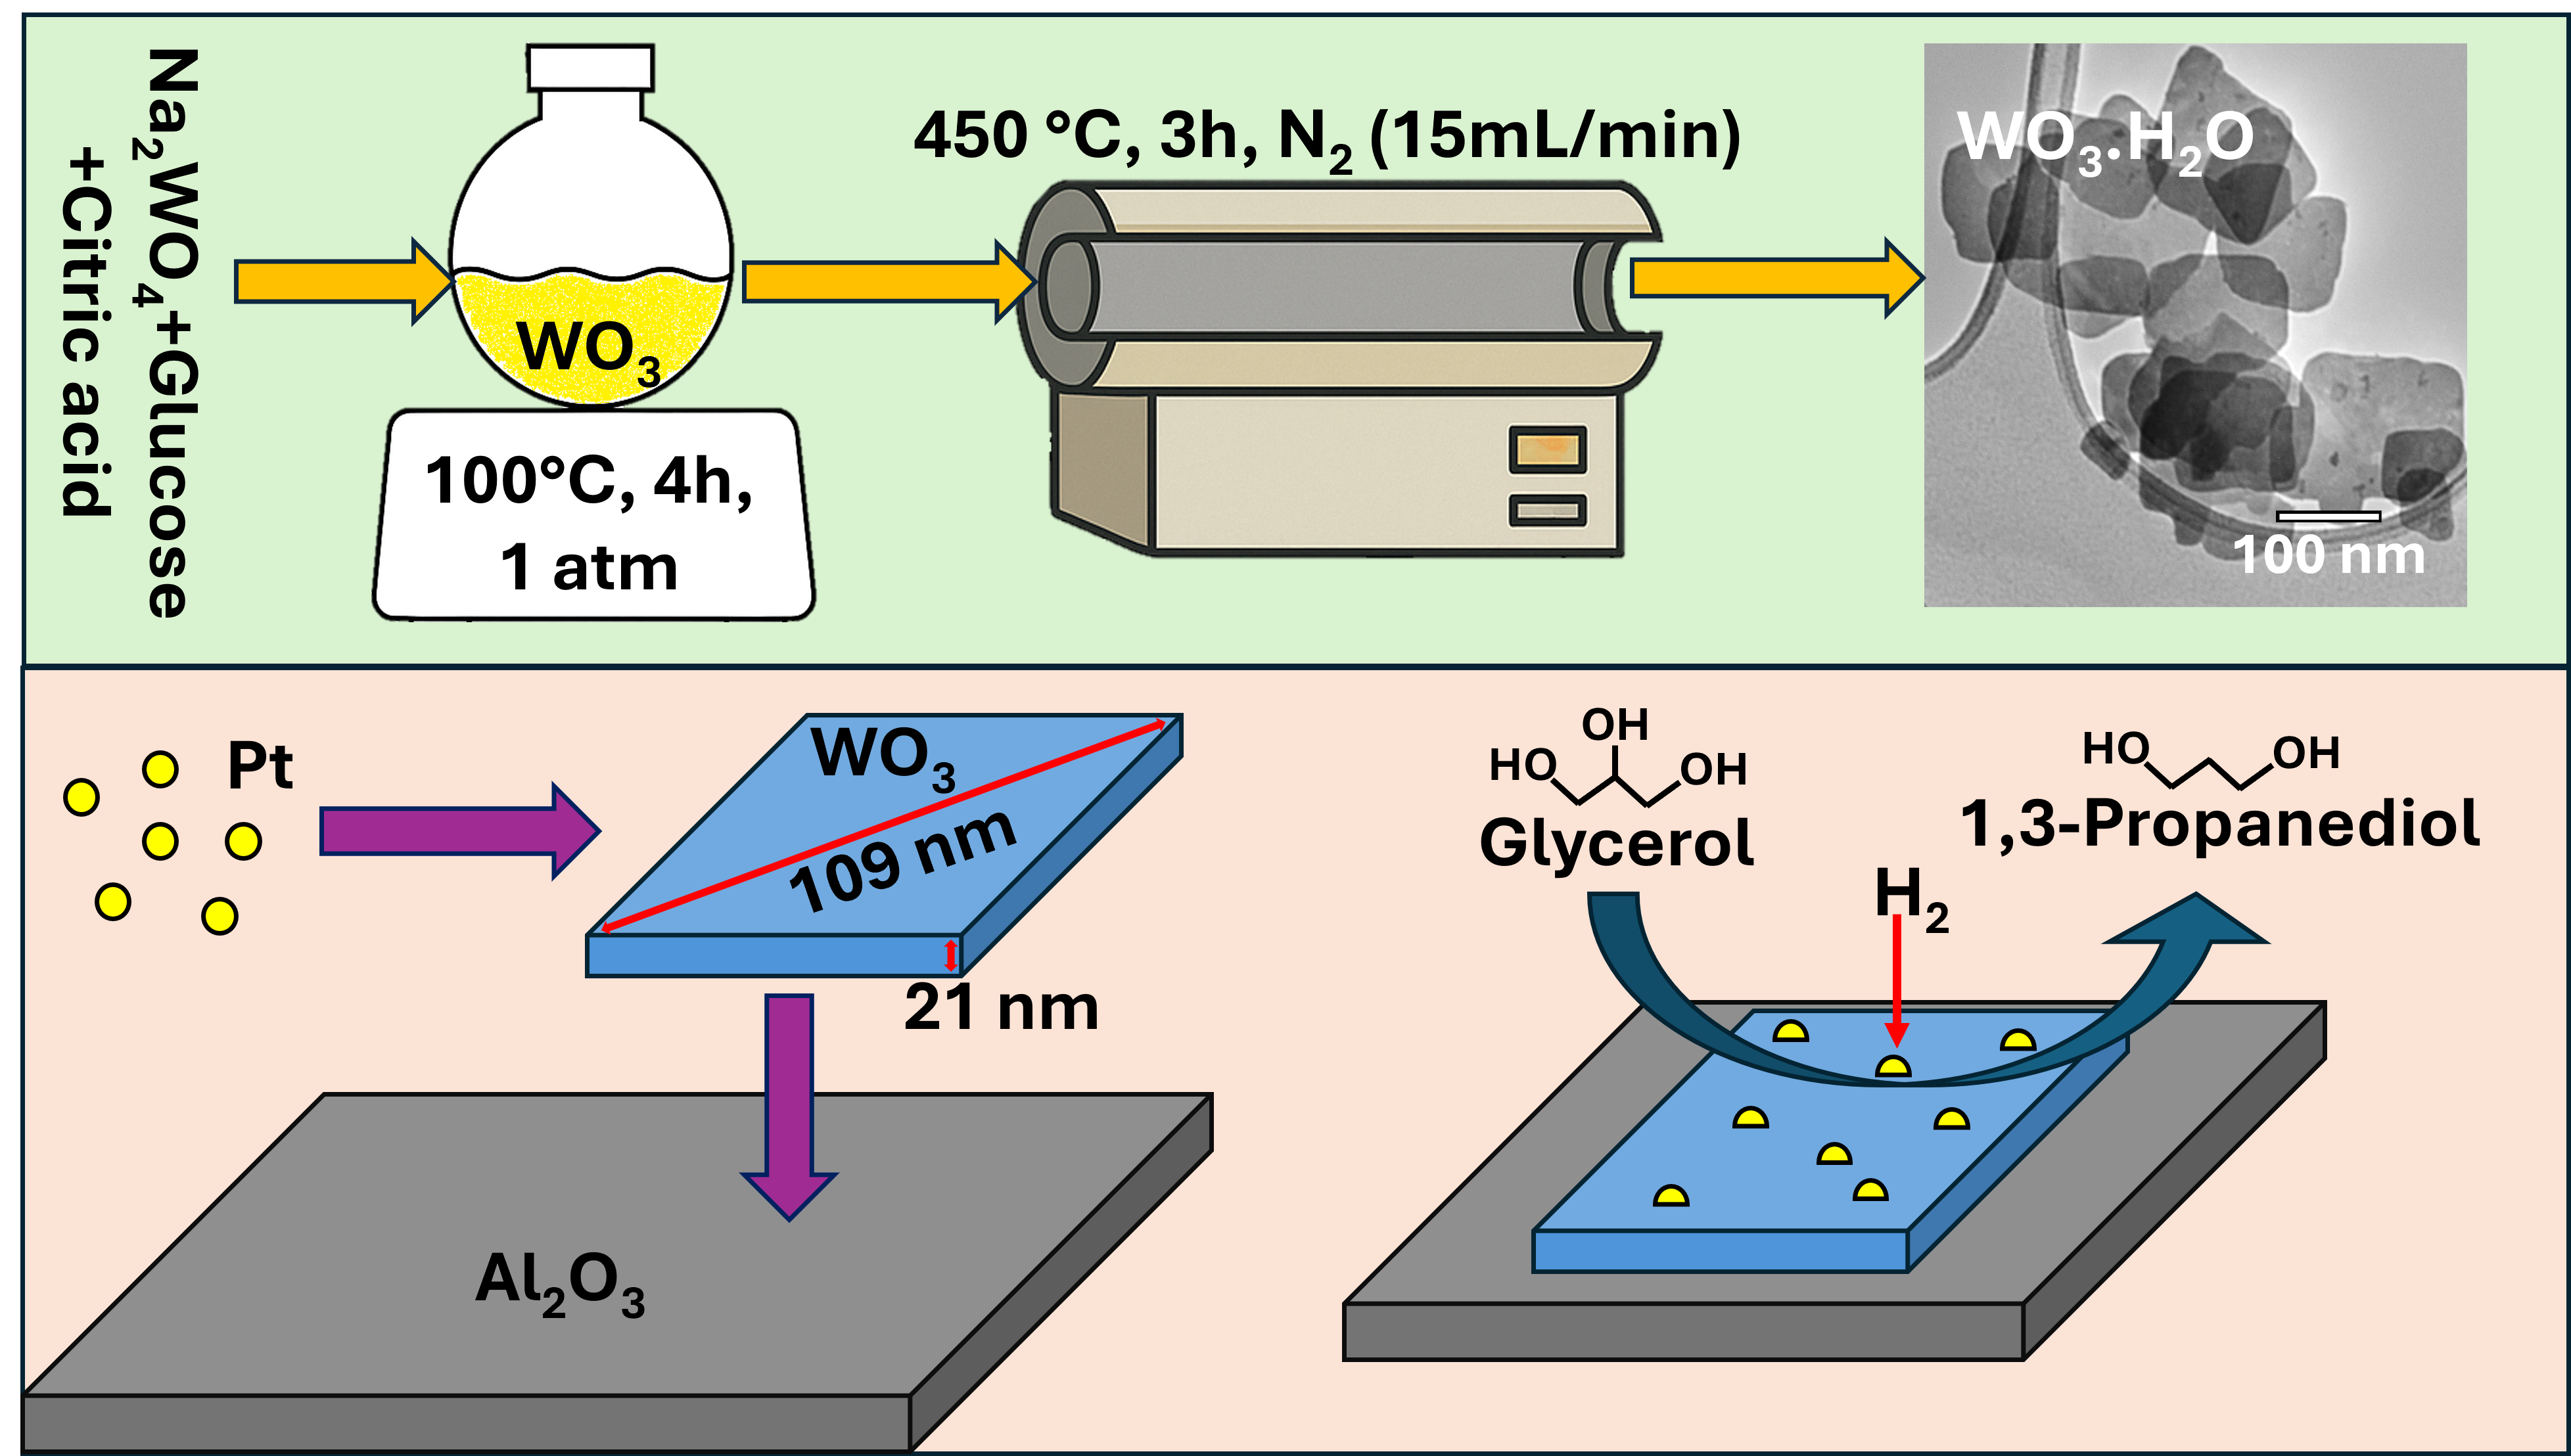
The development of highly crystalline tungsten oxide nanomaterials remains challenging for catalytic applications due to the difficulty of achieving high phase purity without sacrificing metal oxide loading. This work addresses this limitation through an innovative fast hydrothermal synthesis at 100∘C for 4h without autoclaves or surfactants, using citric acid as a critical structural directing agent. Such methodology reduce synthesis time by 50-80% compared to existing hydrothermal routes. Citric acid was identified as the critical parameter controlling nanosheet thickness (20nm–35nm) and diameter (109nm–173nm), acting as a coordinating ligand. The resulting nanosheets were used to prepare Pt/WO3/Al2O3 catalysts with well defined crystalline monoclinic WO3 structure at 9.5% wt. loading. Normally this phase is inaccessible by standard impregnation at equivalent loading. NH3-TPD characterization confirmed that crystalline WO3 generates strong acid sites absent in the reference wetness impregnation catalyst. Glycerol hydrogenolysis tests revealed that the presence of monoclinic WO3 reduces the average glycerol conversion rate by a factor of 3.8 and systematically shifts selectivity toward over-hydrogenolysis products (1-propanol and 2-propanol), despite identical WO3 loading and surface densities below the literature optimum of 2.2W atoms nm−2. These results demonstrate that WO3 crystalline phase is a primary determinant of catalytic performance, without taking in account increased loading. Such demonstration will be useful for the rational design of selective glycerol hydrogenolysis catalysts.
Keywords:
tungsten oxide
; WO3
; nanosheets
; hydrothermal synthesis
; citric acid
; exfoliation
; EELS
; XRD
; Pt/WO3/Al2O3
; glycerol hydrogenolysis
1. Introduction
Biodiesel production has been a rising industry in the latest years. The IEA estimated a worldwide biodiesel and Hydrotreated Vegetable Oil (HVO) demand in 2030 of [1]. However, biodiesel production yields a 10% wt. of glycerol as a by-product [2]. Glycerol is a chemical already produced by several other industrial processes such as propylene chlorination, oil hydrolysis in soap industry, fermentation processes and so on [3]. Researchers have explored its valorization to other chemicals, particularly 1,2-Propanediol (1,2-PD) and 1,3-Propanediol (1,3-PD) transformation via glycerol hydrogenolysis reaction [2,3]. Such large production of glycerol motivate decades of work on catalyst design and optimization.
1,3-PD is a high value industrial chemical ( /) that is mainly used for polytrimethylene terephthalate (PTT) production. As of right now, 1,3-PD is produced through the Shell process starting from ethylene oxide (produced from fossil oil) or from the innovative DuPont process that derived it through fermentation of corn oil, but in much lower volumes ( 10000 / against the 83000 / produced by Shell) [2].
Recent literature studies focus on the catalytic conversion of polyols such as glycerol or glyceraldehyde over supported metal catalysts, with particular attention to platinum-group metals known for their hydrogenation activity and thermal stability [4]. However, achieving selective C–O bond cleavage at specific positions requires careful manipulation of surface chemistry and acidity. Tungsten oxide, particularly in crystalline form, has emerged as a powerful promoter of platinum-catalyzed reactions, enhancing selectivity toward target products through oxygen vacancy formation and metal-support interactions that facilitate hydrogen spillover [5,6]. The strong metal-oxygen bond in tungsten oxide creates oxygen-deficient sites that stabilize reactive intermediates while simultaneously providing Brønsted acid functionality, creating a bifunctional surface architecture well suited to cascade reactions involving both dehydration and hydrogenation steps [6,7,8]. This catalyst can activate the H2 and transfer it through hydrogen spillover on the WO3 surface [9]. Meanwhile, the glycerol is coordinated with WO3 and its C-O bound is cleaved, then the activated H2 migrates on glycerol to stabilize the intermediate, producing 1,2-PD or 1,3-PD.
Several papers have studied the structural properties of WO3 to better understand its role in the selective production of 1,3-PD. N. Lei et al. demonstrated that a mixture of monoclinic WO3 and polytungstate species at 12% wt. loading maximizes 1,3-PD yield (up to 29%), suggesting that the crystallographic nature of WO3 coupled with different loading, critically determines catalytic performance [10]. Those studies demonstrated that at high WO3 loadings (> 12% wt.), the reaction shifts toward over-hydrogenolysis products due to excessive surface acidity generated by WO3 increased surface density, as confirmed by other groups [5,10,11]. In fact S. García-Fernández et al. found that the ideal surface density to produce 1,3-PD for WO3 was found to be at , with a loading around 10% wt. or lower. Studies demonstrated that the perimeter sites at the WO3–Al2O3 interface, stabilized by Al–O–W bonds, were the primary active sites for selective 1,3-PD production. Maximizing the density of such interfacial sites is therefore a key design criterion for selective catalysts [6,7,8].
It was suggested that larger amount of oxygen defects in WO3 enhance 1,3-propanediol yield in glycerol hydrogenolysis. J. Wang et al. studied this phenomenon by preparing a series of mesoporous Pt-WOx catalysts where the one with most oxygen vacancies showed the highest 1,3-PD selectivity (18% glycerol conversion with 39.2% 1,3-PD selectivity) [12]. Y. Niu et al. developed two catalysts with high and low oxygen vacancies (Pt/H-WO3 and Pt/L-WO3 respectively) and found an increase in 1,3-PD conversion and selectivity up to 63.8% glycerol conversion and 43.2% selectivity of 1,3-PDO for Pt/H-WO3 catalyst [13].
The loading of WO3 over the catalyst was also studied to assess the optimal amount to maximise the 1,3-PD yield. S. García-Fernández et al. studied the effect of WO3 surface density over different Pt/WO3 loading and discovered a maximum in 1,3-PD selectivity (54% with a 9% wt. Pt loading and 26% with a 2% wt. Pt loading) at surface density [5]. T. Aihara et al. further investigated the ideal amount of WO3 loading in the catalyst, finding that 7% in weight of WO3 gave the highest 1,3-PD selectivity (24% yield), with a W/Al (atom/atom) ratio of 0.04 [14]. N. Lei et al. recently tested the optimal WO3 loading over a wide range (from 5% wt. to 40% wt.), finding a 48% selectivity of 1,3-PD as optimal with a 10% wt. WO3 loading [10].
Since both the surface density and the crystallographic structure of WO3 critically determine catalytic performance, we hypothesized that pre-synthesized WO3 nanosheets, produced by an innovative fast hydrothermal methodology we developed, could serve as a strategy to introduce crystalline monoclinic WO3 at moderate loading (10% wt.), while simultaneously providing a 2D morphology that maximizes the fraction of perimeter sites relative to isotropic particles of equivalent dimensions [7]. This approach explicitly decouples crystallinity from loading, which cannot be resolved by conventional wetness impregnation, where crystalline WO3 formation only appears at high loadings (>20%) [10,15]. Such method simultaneously generates 3D aggregates with reduced perimeter/volume ratios as there is no control over the particles shape [5,16]. By controlling nanosheet dimensions and crystallite size during synthesis, we aimed to isolate the effect of WO3 crystalline phase on glycerol hydrogenolysis activity and selectivity, independently from loading effects.
The properties of WO3 nanosheets depend on the synthesis route used to obtain them, thus a new fast hydrothermal synthesis and its optimization are proposed in our paper, to obtain the most fitting properties for our glycerol hydrogenolysis reaction, in terms of nanosheets dimensions and WO3 crystallite size.
Such modified hydrothermal exfoliation, used to produce our nanosheets, is a one-step process that uses inexpensive and environmentally friendly chemicals compared to conditions used by other methods like sol-gel synthesis and Chemical Vapour Deposition.
Normally, an advantage of hydrothermal exfoliation is its easy scalability as it is a one-step process performed in a simple autoclave. Nevertheless, this technique requires relatively severe conditions (temperatures from 120 °C–160 °C and autogenic pressures) [17], acidic substances such as HCl or HNO3[18,19], long reaction times (12–24) [17,18], and often the use of surfactants to improve particle dimension’s distribution [19,20,21]. Tab. Table 1 summarizes experimental conditions from different papers for the preparation of nanosheets. Here, we propose a new approach to produce WO3 nanosheets that avoids the use of surfactants and reduces reaction time to 4 . We also examine the evolution of crystalline phases during synthesis and precisely measure particle dimensions and the critical role of citric acid on final morphology. Finally, we prepare a Pt/WO3/Al2O3 catalyst using these nanosheets and compare it with a Pt/WO3/Al2O3 prepared from literature methodology in a glycerol hydrogenolysis reaction, with loading amounts comparable to the literature (2% wt. Pt and 10% wt. WO3) [5].
2. Experimental
2.1. Reagents
Sodium tungstate dihydrate (Na2WO4.2H2O, 99+% purity) was acquired from Thermo Scientific and used as a precursor. Glycerol (99.0% purity), ammonium metatungstate hydrate (>85% WO3 basis), hexachloroplatinic acid hexahydrate (40% Pt), -Al2O3 40 mesh powder (99.99% purity), citric acid anhydrous (99.5% purity), D-glucose (99+% purity), and hydrochloric acid (36.5–38%) were purchased from Fisher Chemical. All chemicals were used without further purification.
2.2. Nanosheets Synthesis
The nanosheets were prepared in a 250 two-necked flask, where 80 of Milli-Q water were added. A thermometer, mounted on a side neck, measured the temperature of the reacting mixture. A bubble condenser was equipped on the central neck, with cooling water at 15 °C.
While stirring vigorously at 600 , 4 of Na2WO4.2H2O were added. Their complete dissolution was achieved over 5 . of Citric acid and 20 of D-glucose were then added consecutively (Tab. Table 2 for each quantity in detail). After all components have fully dissolved, 4 of HCl ( 6 ) were added dropwise in one minute. The solution was then stirred continuously at room temperature for 1 . During the first 10 to 15 , the solution turned from transparent to pale yellow, and finally yellow, indicating the onset of WO3 particle precipitation (a sample of the precipitate at this time is referred as "No Heat").
The flask was then heated to 100 °C and maintained under stirring at 600 for 4 . During this phase, the solution gradually changed from yellow to green, signaling exfoliation and phase transition. The reaction mixture was then allowed to cool (a sample of the precipitate at this time is referred as "4 hours").
The resulting nanosheets were separated by centrifugation (Beckman Avanti J-20 XP) at 1300 for 15 , followed by two washes with 100 Milli-Q water and two washes with 50 of dry EtOH, each wash followed by another centrifugation at the same conditions. Resulting nanosheets were calcined at 350 °C for 2 in a tubular furnace with an air flow at 15 / to reduce residual chlorine content. The so produced nanosheets appeared as a green-yellow powder (a sample of the precipitate at this time is referred as "4 hours"). Each experiment lead to nanosheets and it’s named NSX where X is the test number.
We varied the concentration of each reactant to evaluate their effects on morphology, in Tab. Table 2, yielding 12 experiments in water. Two extra experiments were carried out in methanol (NS11) and ethanol (NS10) to study the effect of reaction temperature and solvent.
2.3. Pt/WO3/Al2O3 Catalyst Synthesis
The Pt/WO3/Al2O3 catalysts were prepared by wetness impregnation. The literature catalyst (WI) was prepared by subsequent wetness impregnation as described by S. G. Fernandez [5]. of ammonium tungstate were dissolved in of milli-Q water. The solution was then added dropwise in 30 to of Al2O3 while stirring. The wet powder was left to dry under vent and then it was calcined at 500 °C for 2 with a temperature ramp of 3 °C/ with an air flow at 50 /. Afterwards, of H2PtCl6.6H2O were dissolved in of water and the solution was then added dropwise in 30 to the WO3/Al2O3 catalyst while stirring. The powder was left to dry under vent and then calcined at 500 °C for 2 with a temperature ramp of 3 °C/ with an air flow at 50 /. The calcination was made at 500 °C in dry air to ensure avoiding any chloride residual on the catalyst.
The nanosheets catalysts obtained from the usage of nanosheets from (NS14) and (NS4) (producing the catalysts NN14 and NN4 respectively, when attached to Pt and Al2O3) were prepared in a similar way, by solving of H2PtCl6.6H2O in milli-Q water and adding it dropwise to of previously produced nanosheets while stirring. (NS14) has an average thickness of 21 , while the mean square average diameter (MSA) is of 109 . (NS4) has an average thickness of 34 , while the MSA is of 173 . These values were calculated through the TEM and EELS analysis.
The powder was left to dry and then mixed with of milli-Q water and then sonicated for 15 to finally add this solution to of Al2O3 while stirring. The catalyst was left to dry and then calcined at 500 °C for 2 with a temperature ramp of 3 °C/ and an air flow at 150 /.
Before the experiment, both catalysts were pre-reduced in a tubular furnace with a flow of 5 of H2 and 45 of N2 flow at 250 °C for 90 , with a temperature ramp of 3 °C/.
2.4. Glycerol Hydrogenolysis Catalytic Tests
The catalytic tests are performed in a Parr autoclave of 1 equipped with pressure gauge, impeller and further modified with a sampling valve. In this setup, 400 of glycerol aqueous solution at 2.5% wt. are poured in, followed by of catalyst. Then two purging steps are performed: in the first one first one, Ar is flushed through the reactor for 10 to purge the air; in the second one, H2 is flushed through the reactor for 5 to purge the Ar. Finally, H2 is fed to the reactor up to 2800 and heated to 200 °C, reaching an operating pressure of 5000 while stirring at 1500 . The reaction is kept in such conditions for 5 while sampling the solution each hour. After such time the reactor is quenched with a bucket of water and ice untill 23 °C and a gas sample is analyzed through a GC equipped with a TCD detector, while the collected liquid samples are analyzed through an HPLC equipped with an Aminex HPX-87H and a RI detector.
Glycerol concentration was selected as 2.5% because diluted feeds minimises diffusional effects in batch reactors and to better compare with similar the literature studies [6].
The final glycerol reaction rate and selectivity over the liquid products were calculated using the following equations:
Where i is the considered species while j is any liquid product.
2.5. Characterization
A Hitachi H-7500 transmission electron microscope (TEM) operating at 120 imaged the samples, with electron energy set at 80 . Samples were prepared on lacey copper grids (Electron Microscopy Sciences, 300 mesh, 50 micron) after elution in 5 of EtOH and sonication for 30 .
HRTEM images of the nanosheets were obtained using a Talos F200X G2 operated at 200 , after elution in 5 of EtOH and sonication for 30 .
XRD measurements were carried out using a Panalytical X’Pert Pro MPD diffractometer operating at 40 and 50 , equipped with a Cu K radiation source (wavelength of Å).
Powder XRD analyses were performed from 5 °C to 90 °C to assess the crystallinity of the nanosheets using Scherrer’s equation Eq. 3. To monitor their crystal dimensions evolution, nanosheets samples were collected before and during the heating phase and thermal treatment (see Fig. Figure 2). The crystallite size was estimated as well by Eq. 3.
Where D is the crystallite size, K is the shape factor (0.9), is the X-ray wavelength ( ), is the Full Width at Half Maximum (FWHM), and is the Bragg angle ( , corresponding to the (1 1 1) plane).
To evaluate the Pt/WO3/Al2O3 catalysts (WI and NN14), the analyses were carried from 10°C to 75 °C to observe the different crystal phases in the catalyst and the crystallinity was evaluated on the peak at = .
SEM-EDS analyses of the Pt/WO3/Al2O3 catalysts were obtained using a ThermoFisher Phenom XL G1 with a 15 source and 10 vacuum.
Particle size distributions were obtained by treating TEM images with ImageJ software (ImageJ 1.54g in Java 1.8.0-345). For each image the software recorded all the minimum and maximum Feret diameters across all nanosheet population.
We then calculated the MSA between the minimum and maximum Feret diameters (dmin and Dmax respectively, see eq. 4):
Specific surface area and porosity of the nanosheets were determined via N2 adsorption/desorption isotherms at °C, using a Micromeritics Tristar II 3020 and applying the Brunauer–Emmett–Teller (BET) and the Barrett-Joyner-Halenda (BJH) models, respectively. Samples were pre-treated at 150 °C for 4 under a constant N2 flow before analysis.
Temperature desorption analyses of ammonia (NH3-TPD) were performed with Microtract Belcat II instrument. The samples were treated at 150 °C for 1 h under He flow ( 30 /); next the temperature was reduced to 100 °C and 10% vol. NH3/He ( 30 /) was flown for 40 , followed by purging with pure He ( 30 /) for an hour always at 100 °C. Finally, the analysis was performed by ramping up the temperature ( 10 °C/) to 500 °C under the same He flow. Peaks were identified as weak ( 150 °C–200 °C), medium ( 200 °C–350 °C) or strong ( 350 °C–500 °C)
EELS (Electron Energy Loss Spectroscopy) measurements were conducted for thickness evaluation using a Talos F200X G2 operated in STEM mode at 200 . An ENFINIUM ER 977 dual-EELS camera was used with a 60 camera length, a 100 C2 aperture, and a collection angle of . The absolute thickness t was calculated from the definition of , given in Eq. 5 [27].
where is the relativistic factor, E0 = 200 is the electron beam intensity, is the collection semi-angle and Em is the average energy loss expressed in .
The multiple atomic number Z in WO3 was used to calculate Em (Eq. 6). We considered the atomic number 1/4 W and 3/4 O in Eq. 7.
We performed this analysis on the most different samples among the nanosheets experiments: (NS4, NS5, NS14 and NS15).
To further evaluate the nanosheets properties, band gap and pHPZC were evaluated and reported in the supporting information (Fig. 1S and 2S).
X-ray fluorescence (XRF) analyses were performed using a Bruker S2 PUMA Series 2 energy-dispersive spectrometer (EDXRF), equipped with a 50 W long-life X-ray tube and a HighSense™ silicon detector. Elemental compositions were determined using the SPECTRA.ELEMENTS software suite with the SMART-QUANT FP module operating in full Fundamental Parameters (FP) mode, which requires no external calibration standards. XRF analysis were confirmed by ICP analysis further described in supporting information (Tab. 1S).
HPLC analyses performed on the glycerol hydrogenolysis samples used an Agilent 1260 Infinity II equipped with a Aminex HPX-87H column with solution of H2SO4 as eluent with a flow of /.
The Pt/WO3/Al2O3 catalysts characterized were WI and NN14, to assess the different results between the two synthesis methods.
The surface density W nm-2 was calculated using the formula from S. Fernandez et al. in Eq. 8 considering the results obtained from the XRF to better compare literature to our results.[5]
Where xW is the mass fraction of the W species in the Pt/WO3/Al2O3 catalyst, MW is the atomic weight of tungsten, NA is the Avogadro number, SAAI2O3 is the surface area of the alumina before the impregnation (from Fisher Chemical analysis) expressed in nm2 g−1, xWO3 is the mass fraction of the tungstate oxide, and xptO is the mass fraction of the platinum oxide. We considered all W and Pt in the catalyst as WO3 and PtO, since the XRF analysis is performed after the calcination in air, without the pre-reduction.
3. Results and Discussion
3.1. Nanosheet Synthesis and Morphology
During a typical successful synthesis (where nanosheets morphology was obtained), after only one hour of stirring at room temperature, the material appeared mostly amorphous (Fig. Figure 1, No Heat). Following the 4 heating step, the XRD pattern (Fig. Figure 1, 4 hours) displayed clear peaks corresponding to the orthorhombic phase of tungsten oxide hydrate, WO3.H2O, which are retained after calcination (Fig. Figure 1, Calcined).
This phase belongs to space group P n m b (no. 62), with lattice parameters: , , and . Characteristic peaks were observed at 17 ° for (2 0 0), 26 ° for (1 1 1), and the typical WO3.H2O peaks from 33 ° to 36 °, including (4 0 0), (0 2 0), and (0 0 2) (Fig. Figure 1, Calcined).
During the heating phase the solid exfoliated to nanosheets, and grew the proper crystal phase over time (Fig. Figure 1, No Heat and 4 hours). To better prove our hypothesis, an experiment was performed while sampling over 6 of heating phase (using (NS14) parameters) (Fig. Figure 2).
The crystallite size increased over time reaching a maximum around 32 . Compared to other synthesis routes from literature of tungsten oxide nanoparticles (sputtering or dry ball milling), the crystallite size obtained was larger [28,29]. Concerning hydrothermal synthesis, Hatel et al. [30] obtained after 72 reaction and 5 of calcination crystallite sizes from 21–29. The only work we found that obtained a larger crystallite size on a comparable synthesis time is the paper published by Karimkhah et al. [31], where the authors performed a liquid phase deposition for 8 obtaining crystallites of 91 . However, their synthesis does not result in nanosheets but in nanoflakes. We are not aware of any reports specifically containing crystallite sizes for nanosheets synthesis.
Our proposed synthesis is therefore able to tune crystallite sizes from 22.5–32.
By interpolating our data, we obtained an equation to calculate the time needed (t) to obtain a target crystallite size ():
The monoclinic crystal phase of WO3.H2O was further confirmed by the diffractogram obtained from HRTEM images (Fig. Figure 3, right).
The image shows a square lattice oriented in the (0 1 0) direction, rotated by 45 °. Visible planes include (0 0 2) at the corners and (–1 0 1) on the sides, with external points indicating (2 0 0), (1 1 1), and (2 2 0) planes. Toward the nanosheet interior, a local rotation of the crystal planes introduces disorder (Fig. Figure 3, left).
Sharp diffraction peaks indicate a well-ordered orthorhombic phase, further supporting the hypothesis that citric acid promotes not only exfoliation but also crystallization under these mild hydrothermal conditions. By contrast, test conducted without citric acid, resulted in the formation of large, irregular WO3 particles with no discernible nanosheet morphology (Fig. Figure 1a). In this case, particles were more spherical and of much larger average diameter ().
Figure 2.
Evolution of the crystallite size of WO3 nanosheets during the synthesis. Scherrer crystallite size increases via a first order reaction with characteristic constant 2/ (dotted line). Comparison between literature data for a ball mill synthesis (diamond, Bandi et al. [28]) and a sputtering technique (square, Mazur et al. [29]).

Figure 3.
Right: HRTEM image of a single nanosheet. White arrow points to an array of tungsten atoms that we used to confirm lattice parameters calculation. Red arrow points at a non-crystalline region of the nanosheet. Left: Diffractogram obtained from the HRTEM image.
Figure 3.
Right: HRTEM image of a single nanosheet. White arrow points to an array of tungsten atoms that we used to confirm lattice parameters calculation. Red arrow points at a non-crystalline region of the nanosheet. Left: Diffractogram obtained from the HRTEM image.

Citric acid acts therefore as a molecular template (like a surfactant) or coordinating ligand, and helps to control nucleation and avoids uncontrolled crystal growth. These findings confirm the fundamental role of citric acid in modulating both the morphology and crystallinity of the final product.
Kong et al. [32] studied the role of oxalic acid in the WO3 nanosheet synthesis. We conclude that citric acid has the same coordinating role, i.e. it coordinates with tungsten oxide hydroxyls groups and stabilizes it in a nanosheet form.
Literature reports the use of glucose for the synthesis of 2D oxides via dry ball milling synthesis, and for few other hydrothermal routes of WO3 nanosheets [18,25,33]. These works never discuss the role of glucose nor its influence on nanosheet size. From (NS1) and (NS2), in which we kept all parameters constants but adding or completely removing glucose, we obtained in both cases nanosheets similar in size (see Fig. 3Sa,c of Supporting Information)). We therefore concluded that glucose has an ancillary role and propose a mechanism of WO3 exfoliation that does not involve glucose (Fig. Figure 4).
Citric acid plays a key role by coordinating with the WO3.H2O lattice via −OH groups. This influence is also reflected in the nanosheets’ shape: edges become increasingly rounded as citric acid levels deviate from the optimal value (NS14), as seen in (Fig. Figure 5). Citric acid is therefore the critical factor for the successful formation of nanosheets. Its role as a coordinating agent appears to be essential in directing the morphology of the resulting WO3 structures. In particular, (NS14) yielded the smallest and thinnest nanosheets (Fig. Figure 1b–d). The crystalline nature of the resulting WO3.H2O was confirmed by XRD analysis, as shown in (Fig. Figure 1e).
3.2. Nanosheet Dimension and Thickness
TEM images illustrate the typical morphology of samples obtained in (NS4, NS5, NS14 and NS15). Each image displays a small cluster of nanosheets representative of the entire sample (Fig. Figure 5).
In (NS5), where the WO3 precursor is 1.5 times the citric acid amount (Fig. Figure 5e-top), the average MSA reaches 148 , diameters from 108–289. As citric acid concentration is increased, while keeping the tungsten precursor concentration constant, both the average size and distribution range narrow.
The minimal MSA is observed in (NS14), with an average diameter of 109 and a tighter distribution (minimum value: 61 , maximum value: 172 ). However, further increase in citric acid leads to an increment in dimensions: (NS15) shows a median value of 158 within a broader range (minimum value: 64 , maximum value: 158 ). This trend is confirmed by (NS4), in which we used even higher citric acid concentration compared to (NS15).
This trend is expected: lower citric acid concentrations reduce the likelihood of intercalation between crystal planes, leading to larger, less controlled growth. On the other hand, excessive citric acid can also destabilize the process, broadening the distribution due to excessive intercalation (Fig. Figure 4).
(NS14) was also repeated with varied dilution in (NS7) and (NS8), keeping the molar ratios of citric acid and glucose constants. Although the average diameter only slightly changed with dilution or concentration, a clear difference in nanosheet morphology was observed at higher concentration, particularly more rounded shapes in (NS8) (see Supporting Information Fig. 3Sk,m).
Thickness distribution data, shown in (Fig. Figure 5e-bottom) and calculated via Eq. 5, indicate that a 1:1.7 molar ratio of Na2WO4.2H2O to citric acid provides the thinnest nanosheets. (NS14) yielded an average thickness of 21 .
Both decreasing and increasing the citric acid concentration resulted in higher average thickness and broader distributions. In (NS5), reduced citric acid gave a thickness from 9–49, with an average of 29 . In (NS15), increased citric acid raised the average to 30 with a thickness range of 10 to 55 , and even further increased citric acid (NS4) led to an average of 34 , ranging from 6 to 66 . This supports the hypothesis that a citric acid concentration of 90 / is required for best control over nanosheet thickness.
For further characterization of the nanosheets see Supporting information.
Based on these TEM and EELS results, nanosheets from (NS14) (average thickness 21 , MSA 109 ) and (NS4) (average thickness 34 , MSA 173 ) were selected as the WO3 precursors for catalyst preparation, as they represent the thinnest and thickest nanosheets obtained, respectively, enabling a systematic assessment of nanosheet dimension effects on catalytic performance.
3.3. Pt/WO3/Al2O3 Catalyst Morphology
XRDs of the catalysts were obtained for both NN14 and WI (Fig. Figure 6). They were then analyzed to observe the phases present in the Pt/WO3/Al2O3 catalysts. These XRDs have been taken on the pre-reduced catalyst (as reaction conditions).
In both catalysts we can observe the presence of the -Al2O3 from the peaks at 37 °, 46 ° and 67 ° which can be identified with the characteristic peaks of the cubic Fd-3m -Al2O3. It is also possible to observe the presence of Pt in the peak at 39 ° which corresponds to the platinum (1 1 1) facet of cubic FCC, Fm-3m structure. We evaluated Pt particles size from Scherrer equation over the peak at 39.7° (representing the Pt (111) facet). The peak in WI has an FWHM of 0.18°, much smaller than the peak in NN14 with an FWHM of 0.47°. As the other parameters for the Scherrer’s equation are the same (K is the shape factor (0.9), is the X-ray wavelength ( ), is the Full Width at Half Maximum (FWHM), and is the Bragg angle ( , corresponding to the (111) plane), we calculated that the average particle size in WI is 52 ca., while in NN14 is 18 ca. These values show how Pt is better dispersed on the NN14 nanosheets respect to the WI. The key distinction between the catalysts emerges in the NN14 sample, where monoclinic WO3 diffraction peaks are clearly present. These peaks are absent in the WI catalyst. This observation is particularly significant: at WO3 loadings below 10% wt; conventional impregnation methods typically produce small WO3 species in form of either isolated monotungstates or oligomeric polytungstates, that lack crystalline character detectable by XRD [5,16]. The appearance of monoclinic WO3 in NN14 at an equivalent loading (9.5% wt.) directly demonstrates that pre-synthesized nanosheets enable the introduction of crystalline WO3 phases inaccessible through standard impregnation. The WI catalyst, as confirmed by literature data, does not have any observable peak of crystalline WO3 with our loading, producing small particles without proper crystal structure due to the small dimensions and the impregnation technique used to produce them [5,10,11].
Our pre-synthetized nanosheets were fixed onto the support surface as tungstite, as evidenced by previous XRD (Fig. Figure 1). Then changed phase over the calcination, producing monoclinic WO3 with lattice parameters a = Å, b = Å, c = Å. This is consistent with literature as it is a stable phase for tungsten up to 750 °, consistent with a 500 ° calcination in air [34]. Moreover, on the peak at 23 ° we can see the crystallinity change to 10 , calculated using the same equation used for the nanosheets (Eq. 3). The presence of these peaks at a loading of 9.5% wt. is the proof that we could obtain crystalline WO3 with low loading and then compare its reactivity to a classical subsequent wetness impregnation catalyst with the same amount of WO3.
The SEM-EDS images were obtained on the pre-reduced catalyst (as used in reaction conditions) and took to represent the overall catalysts surface.
From the SEM-EDS (Fig. Figure 7) analysis we observe a nice distribution for both Pt and WO3 over the Al2O3 surface in the catalysts, although Pt particles should be better dispersed on the NN14 catalyst. WO3 in the WI catalyst is spread through the surface covering a large part of the surface, as the Pt. It is hard to ensure that Pt particles are directly deposited on the WO3 surface, ensuring contact between the two. It could be possible to have Pt in contact with the Al2O3 surface instead, possibly originating side reactions due to Al2O3 proximity and its acidity. In the case of the NN14 catalysts we could observe in the image a general increase in Pt concentration over the surface in the same spots as the WO3. This would be a logical consequence of the catalyst preparation procedure, which allows us to ensure the deposition of Pt over the nanosheets and only afterwards the deposition of the Pt/WO3 on the support. However, the SEM-EDS images are not sufficient to show a significant difference between the two catalysts, although they show a similar distribution.
The N2 physisorption results reported in Tab. Table 3 show the nanosheets surface area as well as the surface area of the WI and NN14 catalysts, measured on the pre-reduced catalysts.
Nitrogen physisorption results in Tab. Table 3 confirm that surface area differences between catalysts are negligible: WI and NN14 show / and /, respectively, a difference of only /. The nanosheets deposit on the (0 0 2) facet (the flat side) of the alumina surface, effectively covering exposed area without creating additional porosity, but decreasing it slightly as we could observe from the total pore volume difference between WI and NN14 of /. The similar surface area between the catalysts has been attributed to the blockage of Al2O3 pores by WO3 particles and the subsequent calcinations, conducted similarly in both NN14 and WI catalysts.
The XRF composition results reported in Tab. Table 4 shows the NN14 and WI catalysts surface composition. The data reported in Tab. Table 4 are further confirmed as the catalysts composition obtained similar results by ICP analysis (Supporting information Tab. 1S). These analyses reveal minimal compositional differences: WI contains 9.6% wt. WO3 and 2.4% wt. Pt, while NN14 contains 9.5% wt. WO3 and 1.9% wt. Pt. Based on this composition and the surface area, the resulting W surface densities are for the WI catalyst and for the NN14 catalyst, both within the range associated with polytungstate species and optimal 1,3-PDO selectivity in the literature [5,11]. It should be noted that this formula was derived assuming a two-dimensional dispersion of WO3 species on the support surface. In the case of the NN14 catalyst, where WO3 is present as crystalline nanosheets of controlled thickness ( 21 ), this assumption underestimates the true surface coverage, as a fraction of W atoms are located in the bulk of the nanosheet and are not surface-exposed. The reported value for NN14 should therefore be interpreted as an apparent surface density. This is shown by the SEM-EDS, where the Al2O3 surface covered by WO3 in the NN14 catalyst is slightly higher than the one covered on the WI catalyst.
The surface acidity of the catalysts was estimated by NH3-TPD performed on both WI and NN14 catalysts and the results are listed in Tab. Table 5.
As shown in Tab. Table 5, the WI catalyst presents only weak and medium acid sites ( / and /, respectively), with no measurable strong acid sites. This is in accordance with the literature, where the acid sites distribution of catalysts prepared by wetness impregnation is typically reported to decrease in the order weak>medium>strong [5]. Such a distribution is usually associated with selectivity toward 1,3-PD and a low propensity for over-hydrogenolysis, a behaviour that has been documented for WO3 loadings below approximately 20% wt. [15], The Al2O3 support is the same for both catalysts and was subjected to the same thermal treatment; its contribution to the acidity baseline is therefore expected to be comparable in the two samples and, on its own, is not known to produce strong or markedly different medium acid sites between the catalysts. While the absolute acid site concentration may be partially set by this baseline, the focus of the present study is on the relative differences between the two final catalysts, for which a semi-quantitative comparison of the NH3-TPD profiles is sufficient to argue that the support contribution is secondary to that of the WO3 phase.The NN14 catalyst, in contrast, exhibits a qualitatively different acidity profile: weak sites ( 48 /) remain comparable to WI, medium sites increase substantially ( 38 /), and an additional contribution of strong acid sites appears at /.The appearance of these strong acid sites in NN14 is consistent with the crystalline monoclinic WO3 phase identified by XRD. According to the literature, crystalline WO3 surfaces are more prone than dispersed monotungstate or isolated polytungstate species to develop strong surface acidity upon H2 pre-reduction, a process commonly described in terms of H-spillover-induced transformation of Lewis-type W centres into Brønsted-type W–OH sites; here we adopt this picture only as the most widely accepted mechanistic interpretation, without claiming a direct Brønsted/Lewis discrimination from our NH3-TPD data alone [35]. The presence of strong acid sites is in line with the higher surface acidity of the bare nanosheets independently measured through pHPZC (see Fig. 2S in the Supporting Information). Strong surface acid sites have, in turn, been reported to promote secondary dehydration steps that lead to the formation of 1-propanol and 2-propanol via over-hydrogenolysis pathways, rather than selective primary C–O bond cleavage to 1,3-PD [15]. The mechanistic picture that emerges is therefore the following: WI and NN14 carry virtually identical WO3 loadings (9.6% vs. 9.5% wt.) and comparable effective surface densities once the nanosheet thickness is taken into account, yet they display qualitatively different acidity profiles that we attribute to the difference in WO3 crystallinity. The amorphous polytungstate-dominated WI lacks strong sites, whereas the crystalline monoclinic phase introduced through the nanosheet route in NN14 brings them in. By decoupling loading from crystallinity through the pre-synthesised nanosheets, the appearance of strong acid sites can be linked here primarily to the crystalline state of the WO3 phase rather than to its nominal loading.
3.4. Catalytic Tests Results
The catalytic tests performed on WI, NN14 and NN4 catalysts are shown in (Fig. Figure 8) as glycerol reaction rate (left) and selectivity (right), calculated by Eq. 1 and Eq. 2 respectively. A test with Al2O3 was performed as well, leading to no conversion ( 1%) and results were reported in supporting informations Tab. 3S, as well as all reactions carbon balances, which were considered acceptable. In Fig. 5S we also presented the yield profiles over reaction time of 1,3-PD and 1,2-PD. GC analysis of the gas phase were performed, and reported negligible CH4 or CO2 content. We assumed that resulting C atoms missing from the EG production were probably converted into MeOH, as typical of similar catalysts. However, the HPLC were performed with a RI detector in aqueous solution. The WI catalyst achieved the highest average glycerol conversion rate (1.23 mmolGly ), approximately 3.8 times higher than NN14 (0.32 mmolGly ) and 20 times higher than NN4 (0.06 mmolGly ). This while the reaction performed with only Al2O3 as blank test brought no appreciable glycerol conversion. This monotonic decrease in conversion rate with increasing nanosheet thickness can be primarily ascribed to the presence of crystalline monoclinic WO3 in the nanosheet-based catalysts, as evidenced by XRD (Fig. Figure 6) and consistent with the NH3-TPD profiles reported in Tab. Table 5. From previous studies, Pt increased distribution should improve catalytic performances overall [5,14]. We observed better Pt dispersion in the NN14 catalyst, but the observed average glycerol reaction rate, is much higher in the case of WI (1.23 versus 0.32 mmolGly ). If Pt distribution played a major role, we would have obtained an opposite result. According to literature, Pt action is effective only if in interaction with the WO3 support, as proved by DFT and operando studies [8,9]. These studies show that selective C–O cleavage occurs at the Pt–WO3 perimeter, where H spillover from Pt generates the Brønsted W–OH centers. We can therefore concluded that WO3 crystallinity effect has more importance than the Pt distribution. So we draw the conclusion that WO3 crystallinity was responsable for the decrease activity more than the Pt having major effects on the reaction rate.
This interpretation is supported by the selectivity data. Moving from WI to NN14 to NN4, the combined selectivity toward 1-Propanol and 2-Propanol increases from 3% to 16% to 45%, while 1,2-PD selectivity decreases from 72% to 57% to 17%. This systematic shift toward over-hydrogenolysis products is consistent with the progressive increase in strong acid sites associated with larger crystalline WO3 domains. Notably, this trend is observed while maintaining WO3 surface densities below the critical threshold of for both WI and NN14, confirming that it is the crystalline phase of WO3 that drives the observed differences in activity and selectivity, instead of the increased loading. In fact, conversion rate drops because NS4 has an average thickness of 34 and lateral dimension of 173 i.e., 1.6 times thicker and 1.6 times wider than NS14 ( 21 thick and 109 ). For platelet-like crystals, the perimeter-to-volume ratio scales as 1/d (where d is the lateral diameter), so NN4 has 1.6 times less Pt-WO3 interfacial perimeter per unit WO3 mass than NN14, assuming similar and uniform Pt distribution over the two catalysts. This is consistent with the trends we observe: reaction rate drops further from NN14 (0.32 mmolGly ) to NN4 (0.06 mmolGly ); propanol selectivity rises from 16% to 45% because the larger nanosheets of crystalline WO3, which leads to an increase in surface Brønsted acid sites, responsible for over hydrogenolysis reactions.
We observe a systematic shift toward over-hydrogenolysis products, which would support this interpretation. Moving from WI to NN14 to NN4, the combined selectivity toward 1-propanol and 2-propanol rises from 3% to 16% to 45%, while 1,2-PD selectivity drops from 72% to 57% to 17%. Such shift toward over-hydrogenolysis products is consistent with the progressive emergence of strong acid sites associated with larger crystalline WO3 domains. It is worth noting that this trend is observed while both WI and NN14 maintain apparent WO3 surface densities below the critical threshold of W,atoms,nm-2, which supports the view that the catalytic divergence is driven by the crystalline state of the WO3 phase rather than by an increase in loading. In fact, conversion rate drops because NS4 has an average thickness of 34 and lateral dimension of 173 i.e., 1.6 times thicker and 1.6 times wider than NS14 ( 21 thick and 109 ). For platelet-like crystals, the perimeter-to-volume ratio scales as 1/d (where d is the lateral diameter), so NN4 has 1.6 times less Pt-WO3 interfacial perimeter per unit WO3 mass than NN14, assuming similar and uniform Pt distribution over the two catalysts. This is consistent with the trends we observe: reaction rate drops further from NN14 (0.32 mmolGly ) to NN4 (0.06 mmolGly ); propanol selectivity rises from 16% to 45% because the larger nanosheets of crystalline WO3, which leads to an increase in surface acid sites, responsible for over hydrogenolysis reactions.
All three catalysts were tested under identical conditions, and both WI and NN14 maintain apparent tungsten surface densities below the critical threshold. The WO3 crystalline phase, not loading or H2 limitation, is the driving force for the observed differences in secondary product selectivity.
The stability of the catalyst was investigated and more informations can be found in Supporting Informations (Fig. S6, S7, S8). Overall, both catalysts performances were decreased after 48 of reaction without presence of relevant carbon deposition on the catalyst. However the structural integrity of the NN14 catalyst was compromised over the long reaction time, possibly due to leaching of the WO3.
4. Conclusions
WO3 nanosheets synthesized via the fast hydrothermal method enabled the introduction of crystalline monoclinic WO3 at 9.5% wt. loading in Pt/WO3/Al2O3 catalysts which was never tested with conventional wetness impregnation, where only by exceeding 12% wt. a change in crystallinity was observable [10]. The process demonstrates a 50–80% reduction in synthesis time compared to existing hydrothermal routes [17,22], while producing nanosheets with controlled dimensions (average diameter 109 , thickness 21 ) and a defined monoclinic crystalline phase. Citric acid emerged as the critical parameter governing nanosheet morphology and crystallinity through its role as a chelating ligand via hydroxyl groups.
The catalytic investigation of glycerol hydrogenolysis reveals a counterintuitive finding: crystalline monoclinic WO3 at low loading suppresses conversion rates and shifts selectivity toward undesired over-hydrogenolysis products (1-Propanol and 2-Propanol). The conversion rate decreased from 1.23 mmolGly with amorphous WO3 species to 0.32 mmolGly with crystalline WO3, despite maintaining WO3 surface densities below the literature optimum of . We concluded that under the controlled conditions of equal nominal WO3 loading (9.5–9.6% wt.) and equal effective W surface density, the WO3 crystalline phase is the dominant variable governing the observed catalytic divergence between WI and NN14. More importantly, the results show that the amorphous and polytungstate nature of WO3 in conventional catalysts is actually beneficial for achieving high 1,3-PD selectivity instead of a limitation to overcome.
These findings redirect the rational design of selective glycerol hydrogenolysis catalysts: future optimization should prioritize maximizing dispersed polytungstate coverage and minimizing crystalline WO3 phases. The nanosheet synthesis platform described here provides a valuable tool for systematically investigating how crystalline phase influences catalytic outcomes in hydrogenolysis and related reactions. Additionally, controlled variation of nanosheet dimensions offers potential for optimizing their performance in other catalytic applications beyond glycerol conversion.
Supplementary Materials
Author Contributions
Conceptualization: Martino Fontana (M.F.), Federico Galli (F.G.); Methodology: M.F., F.G., Giuseppe Pipitone (G.P.), Mariangela Longhi (M.L.), Nadi Braidy (N.B.); Investigation: M.F., F.G.; Formal analysis: M.F., M.L., Maria Vittoria Dozzi (M.V.D.), Carlo Pirola (C.P.); Resources: F.G.; Data curation: M.F.; Visualization: M.F., F.G.; Writing—original draft: M.F., F.G.; Writing—review and editing: M.F., F.G., G.P., M.L., N.B., M.V.D., C.P.; Supervision: F.G.; Funding acquisition: F.G.
Funding
This research received no external funding.
Data Availability Statement
Data available on request due to restrictions.
Acknowledgments
The authors are grateful to Dr. Andrée Lessard from the Electron Microscopy platform at University of Sherbrooke for providing assistance in acquiring the electron micrographs supporting this study. As well as Dr. Jesus A. V. Aguilar from McGill University for the EELS analysis. Special thanks also to Ahmed El Alaoui Laguel, who helped in the laboratory manipulations.
Conflicts of Interest
There are no conflicts to declare.
Abbreviations
The following abbreviations are used in this manuscript:
| 1,2-PD | 1,2-propanediol |
| 1,3-PD | 1,3-propanediol |
| BET | Brunauer–Emmett–Teller |
| BJH | Barrett–Joyner–Halenda |
| EG | ethylene glycol |
| EELS | electron energy-loss spectroscopy |
| EDS | energy-dispersive X-ray spectroscopy |
| FWHM | full width at half maximum |
| GC | gas chromatography |
| HPLC | high-performance liquid chromatography |
| HRTEM | high-resolution transmission electron microscopy |
| HVO | hydrotreated vegetable oil |
| ICP | inductively coupled plasma |
| MSA | mean square average diameter |
| NS | nanosheet obtained from a test |
| NN | nanosheet-based catalyst |
| NN14 | nanosheet catalyst prepared from (NS14) |
| NN4 | nanosheet catalyst prepared from (NS4) |
| PDO | propanediol |
| PTT | polytrimethylene terephthalate |
| RI | refractive index |
| SEM | scanning electron microscopy |
| STEM | scanning transmission electron microscopy |
| TCD | thermal conductivity detector |
| TEM | transmission electron microscopy |
| TPD | temperature-programmed desorption |
| WI | wetness impregnation catalyst |
| XRD | X-ray diffraction |
| XRF | X-ray fluorescence |
References
- IEA. Transport biofuels–Renewables 2024, 2024.
- Kraus, G.A. Synthetic Methods for the Preparation of 1,3-Propanediol. CLEAN – Soil, Air, Water 2008, 36, 648–651. [CrossRef]
- Checa, M.; Nogales-Delgado, S.; Montes, V.; Encinar, J.M. Recent Advances in Glycerol Catalytic Valorization: A Review. Catalysts 2020, Vol. 10, Page 1279 2020, 10, 1279. [CrossRef]
- Bhowmik, S.; Darbha, S. Advances in solid catalysts for selective hydrogenolysis of glycerol to 1,3-propanediol. Catalysis Reviews 2021, 63, 639–703. [CrossRef]
- García-Fernández, S.; Gandarias, I.; Requies, J.; Güemez, M.B.; Bennici, S.; Auroux, A.; Arias, P.L. New approaches to the Pt/WOx/Al2O3 catalytic system behavior for the selective glycerol hydrogenolysis to 1,3-propanediol. Journal of Catalysis 2015, 323, 65–75. [CrossRef]
- Aihara, T.; Miura, H.; Shishido, T. Investigation of the mechanism of the selective hydrogenolysis of CO bonds over a Pt/WO3/Al2O3 catalyst. Catalysis Today 2020, 352, 73–79. [CrossRef]
- Aihara, T.; Miura, H.; Shishido, T. Effect of perimeter interface length between 2D WO 3 monolayer domain and gamma-Al 2 O 3 on selective hydrogenolysis of glycerol to 1,3-propanediol. Catalysis Science & Technology 2019, 9, 5359–5367. [CrossRef]
- García-Fernández, S.; Gandarias, I.; Requies, J.; Soulimani, F.; Arias, P.L.; Weckhuysen, B.M. The role of tungsten oxide in the selective hydrogenolysis of glycerol to 1,3-propanediol over Pt/WOx/Al2O3. Applied Catalysis B: Environmental 2017, 204, 260–272. [CrossRef]
- Li, H.; Abdelgaid, M.; Paudel, J.R.; Holzapfel, N.P.; Augustyn, V.; McKone, J.R.; Mpourmpakis, G.; Crumlin, E.J. Operando Unveiling of Hydrogen Spillover Mechanisms on Tungsten Oxide Surfaces. Journal of the American Chemical Society 2025, 147, 6472–6479. [CrossRef]
- Lei, N.; Zhao, X.; Hou, B.; Yang, M.; Zhou, M.; Liu, F.; Wang, A.; Zhang, T. Effective Hydrogenolysis of Glycerol to 1,3-Propanediol over Metal-Acid Concerted Pt/WOx/Al2O3 Catalysts. ChemCatChem 2019, 11, 3903–3912. [CrossRef]
- Li, Z.; Wu, C.; Zhang, C.; Li, H. The Effect of WO3 on the Selective Hydrogenolysis of Glycerol to 1,3-Propanediol over Pt/WO3–Al2O3 Catalysts. Catalysts 2024, 14, 774. [CrossRef]
- Wang, J.; Zhao, X.; Lei, N.; Li, L.; Zhang, L.; Xu, S.; Miao, S.; Pan, X.; Wang, A.; Zhang, T. Hydrogenolysis of Glycerol to 1,3-propanediol under Low Hydrogen Pressure over WOx-Supported Single/Pseudo-Single Atom Pt Catalyst. ChemSusChem 2016, 9, 784–790. [CrossRef]
- Niu, Y.; Zhao, B.; Liang, Y.; Liu, L.; Dong, J. Promoting Role of Oxygen Deficiency on a WO 3 -Supported Pt Catalyst for Glycerol Hydrogenolysis to 1,3-Propanediol. Industrial & Engineering Chemistry Research 2020, 59, 7389–7397. [CrossRef]
- Aihara, T.; Kobayashi, H.; Feng, S.; Miura, H.; Shishido, T. Effect of WO 3 Loading on the Activity of Pt/WO 3 /Al 2 O 3 Catalysts in Selective Hydrogenolysis of Glycerol to 1,3-Propanediol. Chemistry Letters 2017, 46, 1497–1500. [CrossRef]
- Jarauta-Córdoba, C.; Bengoechea, M.O.; Agirrezabal-Telleria, I.; Arias, P.L.; Gandarias, I. Insights into the nature of the active sites of pt-wox/al2o3 catalysts for glycerol hydrogenolysis into 1,3-propanediol. Catalysts 2021, 11, 1171. [CrossRef]
- García-Fernández, S.; Gandarias, I.; Tejido-Núñez, Y.; Requies, J.; Arias, P.L. Influence of the Support of Bimetallic Platinum Tungstate Catalysts on 1,3-Propanediol Formation from Glycerol. ChemCatChem 2017, 9, 4508–4519. [CrossRef]
- Yu, Y.; Zeng, W.; Xu, M.; Peng, X. Hydrothermal synthesis of WO3·H2O with different nanostructures from 0D to 3D and their gas sensing properties. Physica E: Low-dimensional Systems and Nanostructures 2016, 79, 127–132. [CrossRef]
- Zhang, N.; Li, X.; Ye, H.; Chen, S.; Ju, H.; Liu, D.; Lin, Y.; Ye, W.; Wang, C.; Xu, Q.; et al. Oxide Defect Engineering Enables to Couple Solar Energy into Oxygen Activation. Journal of the American Chemical Society 2016, 138, 8928–8935. [CrossRef]
- Chen, G.; Chu, X.; Qiao, H.; Ye, M.; Chen, J.; Gao, C.; Guo, C.Y. Thickness controllable single-crystal WO3 nanosheets: Highly selective sensor for triethylamine detection at room temperature. Materials Letters 2018, 226, 59–62. [CrossRef]
- Zhang, J.; Chen, J.; Luo, Y.; Chen, Y.; Kiani, M.; Wei, X.; Luo, R.; Wang, G.; Wang, R. Controllable synthesis of two-dimensional tungsten nitride nanosheets as electrocatalysts for oxygen reduction reaction. Science China Materials 2018, 61, 1567–1574. [CrossRef]
- Ahmed, B.; Kumar, S.; Ojha, A.K.; Donfack, P.; Materny, A. Facile and controlled synthesis of aligned WO3 nanorods and nanosheets as an efficient photocatalyst material. Spectrochimica Acta Part A: Molecular and Biomolecular Spectroscopy 2017, 175, 250–261. [CrossRef]
- Han, X.; Han, X.; Li, L.; Wang, C. Controlling the morphologies of WO3 particles and tuning the gas sensing properties. New Journal of Chemistry 2012, 36, 2205–2208. [CrossRef]
- Hu, J.; Sun, Y.; Wang, X.; Chen, L.; Zhang, W.; Chen, Y. Synthesis and gas sensing properties of molybdenum oxide modified tungsten oxide microstructures for ppb-level hydrogen sulphide detection. RSC Advances 2017, 7, 28542–28547. [CrossRef]
- Zhang, Q.; Xu, M.; Shen, Z.; Wei, Q. A nanostructured Cr2O3/WO3 p–n junction sensor for highly sensitive detection of butanone. Journal of Materials Science: Materials in Electronics 2017, 28, 12056–12062. [CrossRef]
- He, K.; Jin, Z.; Chu, X.; Bi, W.; Wang, W.; Wang, C.; Liu, S. Fast response–recovery time toward acetone by a sensor prepared with Pd doped WO3 nanosheets. RSC Adv. 2019, 9, 28439–28450. [CrossRef]
- Xiao, J.; Song, C.; Dong, W.; Li, C.; Yin, Y. Synthesis, Characterization, and Gas Sensing Properties of WO3 Nanoplates. Rare Metal Materials and Engineering 2017, 46, 1241–1244. [CrossRef]
- Egerton, R. Electron Energy-Loss Spectroscopy in the Electron Microscope. Electron Energy-Loss Spectroscopy in the Electron Microscope 2011. [CrossRef]
- Bandi, S.; Srivastav, A.K. Formation mechanism of nanocrystalline W derived cubic-H0.5WO3. Scripta Materialia 2022, 208, 114363. [CrossRef]
- Mazur, M.; Kapuscik, P.; Weichbrodt, W.; Domaradzki, J.; Mazur, P.; Kot, M.; Flege, J.I. WO3 Thin-Film Optical Gas Sensors Based on Gasochromic Effect towards Low Hydrogen Concentrations. Materials 2023, 16. [CrossRef]
- Hatel, R.; Baitoul, M. Nanostructured Tungsten Trioxide (WO 3 ): synthesis, structural and morphological investigations. Journal of Physics: Conference Series 2019, 1292, 012014. [CrossRef]
- Karimkhah, M.; Yourdkhani, A.; Moradpur-Tari, E.; Poursalehi, R.; Sarraf-Mamoory, R. How does water of crystallization influence the optical properties, band structure and photocatalytic activity of tungsten oxide? Surfaces and Interfaces 2021, 27, 101493. [CrossRef]
- Kong, L.; Guo, X.; Xu, J.; Mo, Z.; Li, L. Morphology control of WO3 nanoplate film on W foil by oxalic acid for photocatalytic gaseous acetaldehyde degradation. Journal of Photochemistry and Photobiology A: Chemistry 2020, 401, 112760. [CrossRef]
- Wang, Z.G.; Shen, H.Y.; Yu, R.L.; Gao, J.F.; Zhang, G.Q.; Xu, C.; Lei, J.; Du, J.G.; Xu, J.Z.; Li, Z.M. Universal production of functionalized 2D nanomaterials via integrating glucose-assisted mechanochemical exfoliation and cosolvent-intensified sonication exfoliation. Nano Research 2023, 16, 5033–5041. [CrossRef]
- Thummavichai, K.; Wang, N.; Xu, F.; Rance, G.; Xia, Y.; Zhu, Y. In situ investigations of the phase change behaviour of tungsten oxide nanostructures. Royal Society Open Science 2018, 5, 171932. [CrossRef]
- Guntida, A.; Suriye, K.; Panpranot, J.; Praserthdam, P. Lewis acid transformation to Bronsted acid sites over supported tungsten oxide catalysts containing different surface WOx structures. Catalysis Today 2020, 358, 354–369. [CrossRef]
Figure 1.
TEM of nanosheets resulted from (NS13) with no citric acid (a), and (NS14) with 1 of stirring but no heating phase (b), after 4 of heating (c) and after reduction in N2 (d). Below, XRD compared of each obtained nanosheets sample (e), with the reference of WO3.H2O on the bottom.
Figure 1.
TEM of nanosheets resulted from (NS13) with no citric acid (a), and (NS14) with 1 of stirring but no heating phase (b), after 4 of heating (c) and after reduction in N2 (d). Below, XRD compared of each obtained nanosheets sample (e), with the reference of WO3.H2O on the bottom.

Figure 4.
Proposed mechanism of H2WO4 nanosheets production.[32]
Figure 4.
Proposed mechanism of H2WO4 nanosheets production.[32]

Figure 5.
TEM images of (NS5, NS14, NS15, NS4) (a, b, c, d respectively), and dimensions’ ((e) top) and thickness distributions ((e) bottom). The distributions shown represent the mean square average diameter (MSA)
Figure 5.
TEM images of (NS5, NS14, NS15, NS4) (a, b, c, d respectively), and dimensions’ ((e) top) and thickness distributions ((e) bottom). The distributions shown represent the mean square average diameter (MSA)

Figure 6.
XRD patterns of the WI (top) and NN14 (bottom) catalysts after 500 °C calcination and pre-reduction. Asterisks indicate diffraction peaks attributed to -Al2O3 (red), Pt (green), and monoclinic WO3 (blue, NN14 only).
Figure 6.
XRD patterns of the WI (top) and NN14 (bottom) catalysts after 500 °C calcination and pre-reduction. Asterisks indicate diffraction peaks attributed to -Al2O3 (red), Pt (green), and monoclinic WO3 (blue, NN14 only).

Figure 7.
SEM-EDS images of the Pt/WO3/Al2O3 WI (a, b and c) and NN14 (d, e and f) catalyst after the 500 ° calcination and three washes with a centrifuge, using 300of milli-Q water for each wash.
Figure 7.
SEM-EDS images of the Pt/WO3/Al2O3 WI (a, b and c) and NN14 (d, e and f) catalyst after the 500 ° calcination and three washes with a centrifuge, using 300of milli-Q water for each wash.

Figure 8.
Left: Average glycerol conversion rate of WI, NN14 and NN4 catalysts. Right: Liquid product selectivity of WI, NN14 and NN4 catalysts.
Figure 8.
Left: Average glycerol conversion rate of WI, NN14 and NN4 catalysts. Right: Liquid product selectivity of WI, NN14 and NN4 catalysts.


Table 1.
Published WO3 nanosheet synthesis via hydrothermal methods and main dimensions, when available.
Table 1.
Published WO3 nanosheet synthesis via hydrothermal methods and main dimensions, when available.
| Ref | Temperature ( °C) | Time required ( ) | Diameter ( ) | Thickness ( ) |
|---|---|---|---|---|
| Yu et al. [17] | 160 | 16 | 300 | 40 |
| Han et al. [22] | 160 | 12 | 155-175 | 30-35 |
| Ahmed et al. [21] | 75 | 12 | 150 | 20-40 |
| Chen et al. [19]* | 60 | 2 | 83-241 | 5-10 |
| Zhang et al. [18] | 120 | 24 | 150 | 15 |
| Hu et al. [23] | 160 | 24 | - | 40 |
| Zhang et al. [24] | 120 | 12 | 60-600 | 40 |
| He et al. [25] | 120 | 24 | 100 | 20 |
| Xiao et al. [26] | 160 | 12 | 200-300 | 50 |
| Our work | 100 | 4 | 109 | 21 |
*NaOA and NaOct have been used as surfactants for this synthesis.
Table 2.
Experimental parameters used for the WO3 nanosheet synthesis. Additional tests (NS6, NS9, NS10, NS11, NS12, and NS13) resulted in amorphous nanoparticles with no specific shape. Solvents for tests (NS10) and (NS11) are in parentheses.
Table 2.
Experimental parameters used for the WO3 nanosheet synthesis. Additional tests (NS6, NS9, NS10, NS11, NS12, and NS13) resulted in amorphous nanoparticles with no specific shape. Solvents for tests (NS10) and (NS11) are in parentheses.
| Sample name (NSX) | Sodium tungstate ( ) | Citric acid ( ) | Glucose ( ) | HCl ( ) | Average diameter ( ) | Thickness ( ) |
|---|---|---|---|---|---|---|
| NS1 | 0.05 | 0.07 | - | 4 | 127 | - |
| NS3 | 0.05 | 0.07 | 0.12 | 4 | 119 | - |
| NS4 | 0.05 | 0.15 | 0.25 | 4 | 172 | 34 |
| NS5 | 0.05 | 0.02 | 0.25 | 4 | 148 | 29 |
| NS7 | 0.03 | 0.04 | 0.12 | 4 | 132 | - |
| NS8 | 0.08 | 0.11 | 0.38 | 4 | 120 | - |
| NS14 | 0.05 | 0.09 | 0.25 | 4 | 109 | 21 |
| NS15 | 0.05 | 0.12 | 0.25 | 4 | 158 | 30 |
| NS6 | 0.05 | 0.15 | 0.12 | 4 | - | - |
| NS9 | 0.05 | 0.07 | 0.25 | 0.4 | - | - |
| NS10 (EtOH) | 0.05 | 0.07 | 0.25 | - | - | - |
| NS11 (MeOH) | 0.05 | 0.07 | 0.25 | - | - | - |
| NS12 | 0.12 | 0.13 | 0.13 | 1.67 | - | - |
| NS13 | 0.05 | - | 0.25 | 4 | - | - |
Table 3.
BET analysis, showing surface area, pore diameter and total pore volume for the Al2O3 precursor, WO3 nanosheets (NS14) and final catalysts (WI and NN14).
Table 3.
BET analysis, showing surface area, pore diameter and total pore volume for the Al2O3 precursor, WO3 nanosheets (NS14) and final catalysts (WI and NN14).
| Experiment | Surface area ( /) | Pore diameter ( ) | Total pore Volume ( /) |
|---|---|---|---|
| Al2O3 | 205 | - | - |
| NS14 | 23.5 | 1.0 | 0.12 |
| WI | 23.8 | 1.1 | 0.13 |
| NN14 | 21.2 | 1.1 | 0.08 |
Table 4.
WI and NN14 surface composition analyzed by the XRF directly on the powder, before the reduction performed before each test.
Table 4.
WI and NN14 surface composition analyzed by the XRF directly on the powder, before the reduction performed before each test.
| Catalyst | Al2O3 (% wt.) | WO3 (% wt.) | Pt (% wt.) |
|---|---|---|---|
| WI | 88.0 | 9.6 | 2.4 |
| NN14 | 88.6 | 9.5 | 1.9 |
Table 5.
WI and NN14 acid sites per gram of catalyst evaluated by NH3 desorption.
| Catalyst | Weak acid sites ( /) | Medium acid sites ( /) | Strong acid sites ( /) |
|---|---|---|---|
| WI | 50.5 | 16.1 | - |
| NN14 | 48 | 38 | 19.2 |
Disclaimer/Publisher’s Note: The statements, opinions and data contained in all publications are solely those of the individual author(s) and contributor(s) and not of MDPI and/or the editor(s). MDPI and/or the editor(s) disclaim responsibility for any injury to people or property resulting from any ideas, methods, instructions or products referred to in the content. |
© 2026 by the authors. Licensee MDPI, Basel, Switzerland. This article is an open access article distributed under the terms and conditions of the Creative Commons Attribution (CC BY) license (http://creativecommons.org/licenses/by/4.0/).
Copyright: This open access article is published under a Creative Commons CC BY 4.0 license, which permit the free download, distribution, and reuse, provided that the author and preprint are cited in any reuse.


