Submitted:
25 May 2026
Posted:
26 May 2026
You are already at the latest version
Abstract
Europium (Eu) is a rare-earth element with unique optoelectronic properties that underpin its applications in displays and lighting, X‑ray imaging, anti‑counterfeiting, and biomedicine. Conventional methods typically involve the synthesis of europium based luminescent materials in powder or crystalline form via high temperature solid state reactions or solution processes, followed by secondary processing such as spin coating or evaporation to fabricate films or devices. In this work, we report a direct approach to prepare trivalent europium based luminescent materials using divalent europium bromide (EuBr₂) as the precursor via a gas-phase vacuum evaporation approach (GPVEA). This “deposition-as-synthesis” method enables the fabrication of the hybrid nanoscale films with various blending ratios, which exhibit changes in the fine structure of the emission peaks. The luminescence spectra remain nearly identical across the temperature range from 80 K to 320 K. The photoluminescence emission intensity is stronger in air than in vacuum. Furthermore, the films show good stability under continuous photoexcitation. Through patterned design, we demonstrate their value for anti‑counterfeiting applications. This work thus provides guidance for the preparation of europium based luminescent nanomaterials via GPVEA and their application in anti‑counterfeiting.
Keywords:
divalent europium ions
; trivalent europium ions
; gas-phase vacuum evaporation approach
; anti-counterfeiting
1. Introduction
Europium (Eu) is a rare-earth element with a unique electron configuration, which imparts its characteristic luminescence. This property enables important applications in displays and lighting [1,2], X-ray imaging [3], anti-counterfeiting [4,5,6,7], and biomedicine [8,9,10]. Europium ion typically exists in two oxidation states, divalent [Eu(II)] and trivalent [Eu(III)], which exhibit markedly distinct luminescence properties. The luminescence of divalent europium ions arises from the electronic transition from the 4f65d1 excited state to the 4f7 ground state, producing broad-band emission covering the range from ultraviolet to red [11,12,13,14]. As this transition involves outer-shell 5d electrons, the corresponding energy levels are strongly influenced by the crystal field and coordination environment, resulting in high tunability of the emission wavelength [15]. In contrast, the 4f orbitals of trivalent europium ions are effectively shielded by the outer closed 5s25p6 shell [16]. Their luminescence arises from intra-configurational 4f-4f electronic transitions, giving rise to a series of sharp characteristic emission peaks [1,4,17,18,19]. The luminescence-related energy levels are barely affected by the ligand or solvent environment, thus delivering exceptionally high color purity and stability [20].
Existing preparation processes for europium-based luminescent materials can be categorized into two main classes based on the reaction phase: solid-phase methods and liquid-phase methods. Represented by the high-temperature solid-state reaction route, solid-phase approaches achieve the doping of europium ions into host matrices such as phosphates and borates via high-temperature calcination, and are widely adopted techniques for the industrial production of phosphors [12,21,22]. Liquid-phase methods mainly include routes such as co-precipitation [23], sol-gel processing [11], and hydrothermal synthesis [24], where precursors are prepared through uniform mixing of ions in solution systems. However, the high-temperature solid-state method requires very high temperatures, whereas the solution-based method requires a solvent during the reaction and subsequent purification of the product. Both methods require the prior synthesis of powder or crystalline materials with specific luminescence properties, followed by secondary processing such as spin-coating and vacuum evaporation to fabricate devices adapted to specific application scenarios [1,2], a step that imposes additional requirements on the material properties, including thermodynamic stability and solubility.
Vacuum evaporation, a type of vapor deposition technology, has been widely used for the fabrication of thin films and devices [25], most notably in the organic light-emitting diodes (OLEDs) display industry [26,27]. Thin films prepared via this method exhibit high uniformity, enable high pattern resolution, and the process itself offers excellent controllability. The development of novel europium-based luminescent materials based on this technology is expected to achieve direct compatibility with existing industrial production lines, thereby reducing the cost of technological iteration. In addition, most europium-based luminescent materials exhibit phenomena such as emission spectrum shifts under varying temperatures [20,28,29], which limits their anti-counterfeiting applications under extreme conditions, such as low temperatures.
In this work, we employed a “deposition-as-synthesis” strategy using a gas-phase vacuum evaporation approach (GPVEA) to co-evaporate 4,7-diphenyl-1,10-phenanthroline (Bphen) and europium(II) bromide EuBr2 from two sources, thereby preparing an organic/inorganic hybrid nano film that exhibits trivalent europium ion luminescence. By tuning the blending ratio of Bphen to EuBr2, the emission spectra of the blend films exhibited a composition-dependent evolution of peak positions. Low-temperature photoluminescence spectroscopy measurements revealed that the blend films maintained high consistency of luminescence spectra over a wide temperature range. Furthermore, the films showed higher luminescence intensity in air than in vacuum. Kinetic measurements under ambient air confirmed the excellent air stability of the films. These results demonstrate that the as-prepared blend films combine tunable optical properties with outstanding environmental adaptability, making them promising for optical anti-counterfeiting. Due to the controllable deposition of nanofilms, we anticipated their applications in optoelectronics. This work offers a new route to fabricate rare-earth functional materials via GPVEA.
2. Materials and Methods
Thin films were deposited under a vacuum of less than 2 × 10⁻³ Pa by resistive heating of a source. The deposition rate was monitored using a quartz crystal microbalance (INFICON SQC-310), which measures changes in the oscillation frequency of the quartz crystal. Steady-state photoluminescence spectra were measured with a fluorescence spectrometer (HiLight 990, Oriental Spectra) coupled to a nitrogen cryostat (Optistat DN, Oxford Instruments), using a xenon lamp as the excitation source. Photoluminescence quantum yield was measured using an integrating sphere coupled to the same spectrometer system. Time-resolved photoluminescence decay spectra were acquired with the same spectrometer. For nanosecond- and microsecond-scale excited-state lifetimes, a 307 nm nanosecond diode laser served as the excitation source, whereas a microsecond flashlamp was used for millisecond-scale lifetimes.
3. Results and Discussion
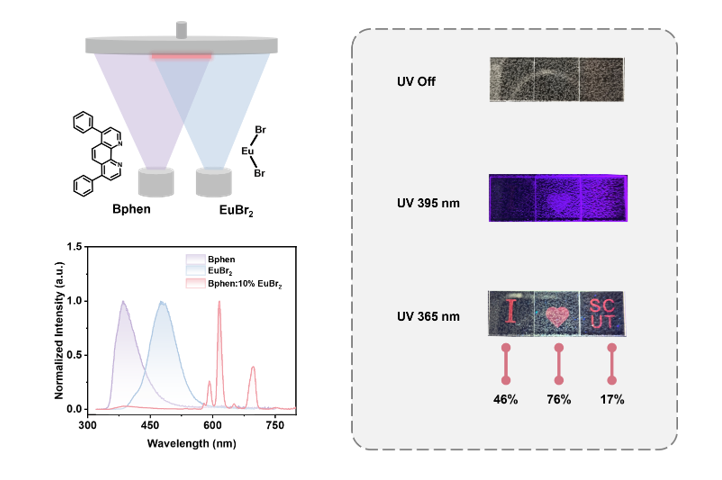
Bphen and EuBr2 were co-deposited by heating separately in two independent sources, as shown in Figure 1a. The blending ratio was defined as the ratio of the deposition thickness of EuBr2 to the total deposition thickness. Figure 1b shows the photoluminescence (PL) spectrum of a blend film with a EuBr2 mixing ratio of 10% (denoted as Bphen: 10% EuBr2) under excitation at 300 nm. For comparison, the PL spectra of single-component Bphen and EuBr2 films are also presented. The Bphen film exhibited an emission peak centred at 386 nm under photoexcitation, whereas the pure EuBr2 film showed a blue emission peak at 480 nm. Interestingly, apart from a weak emission from the Bphen ligand at 386 nm, the PL spectrum of the blend film displayed characteristic emission peaks at 579, 592, 616, 652 and 697 nm. To further elucidate the origin of the emission peaks, the excited-state lifetimes at the corresponding wavelengths of each emission peak were measured, and the results are shown in Figure 1c. The excited-state lifetime of the Bphen film at 386 nm was 0.480 ns, that of the EuBr2 film at 480 nm was 0.765 μs, and that of the blend film at 616 nm was 0.265 ms. The order-of-magnitude differences in these lifetimes indicate that the emission in the blend film originates from different energy levels of Bphen and Eu(II) ions. The sharp characteristic emission peaks in the hybrid film are attributed to electronic transitions from the 5D0 excited state to the 7FJ of trivalent Eu(III) ions [10,30], as illustrated in Figure 1d. This finding confirms that the valence state of europium ions in the as-prepared blend film changes from Eu(II) to Eu(III).
The luminescence properties of films with different blending ratios were further investigated. Figure 2a shows the PL spectra of the films denoted as Bphen: x% EuBr2 (x = 5, 10, 50, 80). Films with different blending ratios all exhibited similar emission characteristics, whereas the emission intensity of the Bphen ligand gradually decreased with increasing EuBr2 blending ratio. However, a high blending ratio also led to a decrease in the photoluminescence quantum yield (PLQY) of the films, as shown in Table 1. This indicates that although a higher EuBr2 ratio promotes coordination between Bphen and EuBr2 and thereby suppresses ligand emission, an excessive amount of EuBr2 induces a concentration quenching effect, which in turn reduces the luminescence efficiency. The photoluminescence excitation (PLE) spectra of the films with different doping ratios are shown in Figure 2b. Increasing the EuBr2 ratio leads to a red shift of the excitation edge. This is because at low doping ratios, Bphen molecules greatly outnumber EuBr2 molecules; excitation light is mainly absorbed by Bphen and then transferred to the Bphen-EuBr2 complex via energy transfer to generate luminescence. At high blending ratios, the Bphen-EuBr2 complex becomes more abundant and directly absorbs the excitation light.
To further investigate the effect of blending ratio on the excited-state dynamics of the films, we measured the time-resolved photoluminescence (TRPL) decay curves of the films with different blending ratios. Taking the film with a blending ratio of 50% as an example, Figure 2c shows the TRPL decay curves monitored at emission wavelengths of 593, 613, 621 and 701 nm. The excited-state lifetimes at different emission wavelengths are identical, indicating that these distinct emission peaks all originate from the same principal energy level transition (from the 5D0 to the 7FJ). The TRPL decay of films with different blending ratios was analysed at the emission wavelength of 616 nm, as shown in Figure 2d. As the EuBr2 ratio increases, the excited-state lifetime of the blending film shortens. This is attributed to the possibility that EuBr2 promotes the radiative transition of the excited state.
The temperature dependent luminescence properties of the Bphen and EuBr2 blended films were further investigated. Figure 3a shows the PL spectra of the Bphen: 10% EuBr2 film at different temperatures. The emission intensity gradually increased as the temperature decreased. For the characteristic emission peak at 616 nm, the intensity at 80 K was 2.13 times that at 320 K. This phenomenon can be attributed to the effective suppression of phonon vibrations at low temperatures, which reduces the probability of nonradiative transitions and enhances the radiative transition rate. Correspondingly, Figure 3b shows that the excited state lifetime of the 616 nm emission was shorter at low temperature than at 320 K. The tail component of the decay curve further decreased at low temperature, and the decay curve exhibited an almost single exponential behaviour, confirming the suppression of phonon vibration processes at low temperature. Notably, after normalising the PL spectra collected at different temperatures, the spectral curves were found to be almost identical, as shown in Figure 3c. This indicates that the emission spectrum of the Bphen and EuBr2 blended film is remarkably temperature insensitive; that is, both the emission peak positions and the spectral curves remain stable over a wide temperature range.
Figure 4a shows the PL spectra of the Bphen: 10% EuBr2 film measured in vacuum and in air. For the characteristic emission at 616 nm, the luminescence intensity of the film in air was approximately 1.36 times that in vacuum. The results of multiple cycle tests are shown in Figure 4b. The PL intensity in air was consistently higher than that in vacuum, and the luminescence response exhibited reversible behaviour, suggesting that the observed emission enhancement may originate from interactions between certain components in air and the blended film. TRPL decay curves were monitored at emission wavelengths of 591, 614 and 700 nm, as shown in Figure 4c–e. We found that the excited-state lifetime in air was shorter than that in vacuum, and the tail component of the decay curve was significantly reduced. Based on the above observations, we propose that oxygen molecules may increase the efficiency of energy transfer from the organic ligand to the Eu(III) ions in the blended film, thereby promoting the radiative transition process and shortening the excited-state lifetime.
To further investigate the stability of the blended films under continuous photoexcitation, we monitored the change in luminescence intensity at 616 nm under continuous excitation at 300 nm, as shown in Figure 4f. For films with low (5%) and high (50%) blending ratios, the PL intensity decreased rapidly at first, then the rate of decrease slowed markedly under prolonged excitation. After 10 min of continuous excitation, the PL intensities of the films with 5% and 50% blending ratios remained at 0.8857 and 0.8786 of their initial values, corresponding to decreases of 11.43% and 12.14%, respectively. During the subsequent excitation from 10 to 60 min, the PL intensities further decreased to 0.8552 and 0.8230 of the initial values, with corresponding decreases of 3.44% and 6.33%, respectively. These results indicate that the as prepared blended films exhibit reasonable stability, and that the film with a lower blending ratio shows relatively better stability than that with a higher blending ratio.
Given the consistency of the PL spectra of the blended films at different temperatures and their good photostability in air, we further investigated their application in anti-counterfeiting. Patterned blended films with different blending ratios were prepared, as shown in Figure 5a. Three patterned films with EuBr2 mixing ratios of 46%, 76% and 17% were directly fabricated on a quartz substrate, designed as “I”, “♥”, and “SCUT”, respectively. Under ordinary fluorescent lamp illumination, almost only the quartz substrate was visible, whereas the thin film was barely visible. No luminescence was observed from the films under a 395 nm UV lamp, but under 365 nm UV excitation the films exhibited distinct red emission. The PL emission spectra of the patterned films under 300 nm excitation are shown in Figure 5b. The ratio of the emission intensity at 613 nm to that at 621 nm was extracted as an identifying feature, as listed in Table 2. This ratio increased with increasing EuBr2 ratio, indicating that each mixing ratio corresponds to a unique intensity ratio. This allows the establishment of a database linking the blending ratio used in fabrication to the intensity ratio for anti-counterfeiting purposes. Furthermore, the excited state lifetimes of the films with different blending ratios are shown in Figure 5c and Table 2. For the “I” pattern, the excited state lifetime was 178 μs; for the “♥” pattern, 150 μs; and for the “SCUT” pattern, 256 μs. The excited state lifetime decreased with increasing blending ratio. Thus, both the emission intensity ratio and the excited-state lifetime can be used to verify the evaporation fabrication process, enabling dual authentication anti-counterfeitin.
4. Conclusions
In summary, we have developed a direct “deposition-as-synthesis” approach using GPVEA to fabricate organic–inorganic europium-based hybrid nanomaterials, using divalent EuBr2 and Bphen as the precursors. Notably, the as-prepared films exhibit characteristic sharp emission peaks originating from Eu(III), indicating an in situ oxidation from Eu(II) to Eu(III) during the co-deposition process. By tuning the blending ratio of Bphen to EuBr2, the emission properties and excited state dynamics can be modulated, with the optimal photoluminescence quantum yield observed at a 10% EuBr2 ratio. The blend films show remarkable spectral stability over a wide temperature range (80 K to 320 K) and exhibit higher luminescence intensity in air than in vacuum. Moreover, the films demonstrate good stability under continuous photoexcitation. Leveraging these advantages, patterned films with different blending ratios were fabricated, enabling dual-mode anti-counterfeiting based on both emission intensity ratio and excited-state lifetime. This work provides a facile and vacuum-compatible route for preparing europium-based luminescent nanomaterials via GPVEA, opening new opportunities for optical anti-counterfeiting and potential optoelectronic applications.
Supplementary Materials
All data supporting the findings of this study are provided within the article.
Author Contributions
Conceptualization, W. Z. Wu, S. F. Chen and D. C. Chen; methodology, W. Z. Wu, S. F. Chen and D. C. Chen; validation, W. Z. Wu and S. F. Chen; formal analysis, W. Z. Wu and S. F. Chen; data curation, W. Z. Wu, S. F. Chen, W. Ling, Y. W. Tang, Y. J. Du and P. L. Liang; investigation, W. Z. Wu, S. F. Chen, W. Ling, Y. W. Tang, Y. J. Du and P. L. Liang; visualization, W. Z. Wu and S. F. Chen; writing—original draft, W. Z. Wu; writing—review & editing, S. F. Chen and D. C. Chen; resources, S. -J. Su and D. C. Chen; supervision, D. C. Chen; funding acquisition, D. C. Chen; project administration, D. C. Chen; supervision, D. C. Chen; All authors have read and agreed to the published version of the manuscript.
Funding
This research was funded by the National Key Research and Development Program of China (grant number, 2020YFB0408000) and Guangdong Provincial Department of Science and Technology (grant number, 2019TQ05C778), Basic and Applied Basic Research Foundation of Guangdong Province (grant number, 2019A1515011639)
Data Availability Statement
All data supporting the findings of this study are provided within the article.
Acknowledgments
The authors greatly appreciate the financial support from the National Key Research and Development Program of China (2020YFB0408000) and Guangdong Provincial Department of Science and Technology (2019TQ05C778), Basic and Applied Basic Research Foundation of Guangdong Province (2019A1515011639).
Conflicts of Interest
The authors declare no conflicts of interest.
Abbreviations
The following abbreviations are used in this manuscript:
| GPVEA | Gas-phase vacuum evaporation approach |
| OLEDs | Organic light-emitting diodes |
| PL | Photoluminescence |
| PLQY | Photoluminescence quantum yield |
| PLE | Photoluminescence excitation |
| TRPL | Time-resolved photoluminescence |
References
- Xue, Q.; Chen, P.; Lu, J.; Xie, G.; Hou, J.; Liu, S.; Zhao, Y.; Zhang, L.; Li, B. Solid-State Electron. 2009, 53, 397. [CrossRef]
- Ilmi, R.; Xia, X.; Dutra, J.D.L.; Santos, G.S.; Zhou, L.; Wong, W.Y.; Khan, M.S. Eur. J. Inorg. Chem. 2025, 28, e202400855. [CrossRef]
- Liu, X.; Wang, S.; Xie, W.; Ni, J.; Xiao, K.; Liu, S.; Lv, W.; Zhao, Q. J. Mater. Chem. C 2023, 11, 7405. [CrossRef]
- Hasegawa, M.; Ohmagari, H.; Tanaka, H.; Machida, K. J. Photochem. Photobiol. C Photochem. Rev. 2022, 50, 100484. [CrossRef]
- Mei, J.-F.; Lv, Z.-P.; Lai, J.-C.; Jia, X.-Y.; Li, C.-H.; Zuo, J.-L.; You, X.-Z. Dalton T 2016, 45, 5451. [CrossRef]
- Zhang, D.; Zhou, W.; Liu, Q.; Xia, Z. Acs Appl. Mater. Inter 2018, 10, 27875. [CrossRef] [PubMed]
- Wang, C.; Xi, P.; Yan, J.; Cheng, B. Dye. Pigment. 2025, 241, 112859. [CrossRef]
- Chen, F.; Huang, P.; Zhu, Y.-J.; Wu, J.; Cui, D.-X. Biomaterials 2012, 33, 6447. [CrossRef]
- Gedara, S.M.K.; Ding, Z.-Y.; Balasooriya, I.L.; Han, Y.; Wickramaratne, M.N. J. Funct. Biomater. 2022, 13, 108. [CrossRef]
- Nehra, K.; Dalal, A.; Hooda, A.; Bhagwan, S.; Saini, R.K.; Mari, B.; Kumar, S.; Singh, D. J. Mol. Struct. 2022, 1249, 131531. [CrossRef]
- Morales–Saavedra, G.; Chavira, E.; Rodríguez-Rosales, A.A.; Flores-Flores, J.O.; Mata-Zamora, M.E.; Ponce, P. Opt. Mater. 2022, 123, 111760. [CrossRef]
- Gan, L.; Mao, Z.-Y.; Zeng, X.-H.; Zhang, Y.-Q.; Zhao, Y.; Xu, F.-F.; Zhu, Y.-C.; Liu, X.-J. Mater. Res. Bull. 2014, 51, 205. [CrossRef]
- Piao, X.; Horikawa, T.; Hanzawa, H.; Machida, K.-i. Appl. Phys. Lett. 2006, 88, 161908. [CrossRef]
- Hu, T.; Gao, Y.; Molokeev, M.S.; Xia, Z.; Zhang, Q. Adv. Opt. Mater. 2021, 9, 2100077. [CrossRef]
- Galimov, D.I.; Bulgakov, R.G. Luminescence 2018, 34, 127. [CrossRef]
- Wang, L.; Zhao, Z.; Wei, C.; Wei, H.; Liu, Z.; Bian, Z.; Huang, C. Adv. Opt. Mater. 2019, 7, 1801256. [CrossRef]
- Fang, J.; You, H.; Gao, J.; Ma, D. Chem. Phys. Lett. 2004, 392, 11. [CrossRef]
- Turchetti, D.A.; Nolasco, M.M.; Szczerbowski, D.; Carlos, L.D.; Akcelrud, L.C. Phys. Chem. Chem. Phys. 2015, 17, 26238. [CrossRef]
- Dai, H.L.; Li, D.F.; Chen, C.; Zhao, H.B.; Liu, D.S.; Peng, Q.F.; Lin, S.H.; Chen, J.W.; Zhang, Z.J.; Xu, T.; Sui, Y. Adv. Opt. Mater. 2026, 14, 0:e03465. [CrossRef]
- Kitagawa, Y.; Tsurui, M.; Hasegawa, Y. Rsc Adv. 2022, 12, 810. [CrossRef] [PubMed]
- Hu, T.; Gao, Y.; Ji, X.; Xia, Z.; Zhang, Q. Inorg. Chem. Front. 2020, 7, 2685. [CrossRef]
- Wang, M.; Meng, Y.; Zhu, Y.; Song, J.; Yang, J.; Liu, C.; Zhu, H.; Yan, D.; Xu, C.; Liu, Y. Inorg. Chem. 2022, 61, 11293. [CrossRef] [PubMed]
- Tan, J.; Zhang, P.; Song, X.; Han, C.; Wang, F.; Zhang, J.; Duan, C.; Zhang, Z.; Han, S.; Xu, H.; Liu, X. Nature 2025, 647, 632. [CrossRef]
- Rojas-Hernandez, R.E.; Rubio-Marcos, F.; Rodriguez, M.Á.; Fernandez, J.F. Renew. Sustain. Energy Rev. 2018, 81, 2759. [CrossRef]
- Yang, L.; Du, H.; Li, J.; Luo, Y.; Lin, X.; Pang, J.; Liu, Y.; Gao, L.; He, S.; Kang, J.-W.; Liang, W.; Song, H.; Luo, J.; Tang, J. Nat. Commun. 2024, 15, 6240. [CrossRef]
- Cheng, C.; Mai, M.; Li, C.; Zhang, D.; Duan, L. Nat. Mater. 2026. [CrossRef]
- Shen, C.; Hu, Y.; Zhou, S.; He, Z.; Han, J.; Zhang, D.; Lu, L.; Mo, X.; Zhang, Q. Adv. Electron. Mater. 2025, 11, e00555. [CrossRef]
- Straub, L.C.; Adlung, M.; Wickleder, C.; Wickleder, M.S.; Rasche, B. Inorg. Chem. 2022, 62, 497. [CrossRef]
- Turchetti, D.A.; Zanlorenzi, C.; Duarte, L.G.T.A.; Santos, R.F.S.; Atvars, T.D.Z.; Domingues, R.A.; Akcelrud, L.C. J. Phys. Chem. B 2020, 124, 6105. [CrossRef]
- Miyazaki, S.; Goushi, K.; Kitagawa, Y.; Hasegawa, Y.; Adachi, C.; Miyata, K.; Onda, K. Chem. Sci. 2023, 14, 6867. [CrossRef] [PubMed]
Figure 1.
(a) Schematic illustration of the gas-phase vacuum evaporation approach; (b) Photoluminescence spectra; (c) Time-resolved fluorescence decay curves of Bphen, EuBr2, and Bphen: 10% EuBr2 blended films; (d) Energy level diagram of Eu(III) ions.
Figure 1.
(a) Schematic illustration of the gas-phase vacuum evaporation approach; (b) Photoluminescence spectra; (c) Time-resolved fluorescence decay curves of Bphen, EuBr2, and Bphen: 10% EuBr2 blended films; (d) Energy level diagram of Eu(III) ions.

Figure 2.
(a) PL spectra (excited at 300 nm) and (b) PLE spectra of blended films with blending ratios of 5%, 10%, 50%, and 80%; (c) Time-resolved PL decay curves for the film with a blending ratio of 50%, monitored at 616 nm.
Figure 2.
(a) PL spectra (excited at 300 nm) and (b) PLE spectra of blended films with blending ratios of 5%, 10%, 50%, and 80%; (c) Time-resolved PL decay curves for the film with a blending ratio of 50%, monitored at 616 nm.

Figure 3.
(a) PL spectra excited at 300 nm, measured at various temperatures; (b) Time-resolved PL decay curves monitored at 616 nm at different temperatures; (c) Normalized PL spectra excited at 300 nm, recorded at various temperatures.
Figure 3.
(a) PL spectra excited at 300 nm, measured at various temperatures; (b) Time-resolved PL decay curves monitored at 616 nm at different temperatures; (c) Normalized PL spectra excited at 300 nm, recorded at various temperatures.

Figure 4.
(a) PL spectra measured under 300 nm excitation for the blended film with a blending ratio of 10%, recorded in air and under vacuum; (b) PL spectra of the same film subjected to multiple test cycles; Time-resolved PL decay curves monitored at (c) 591 nm, (d) 614 nm, and (e) 700 nm, measured in air and under vacuum; (f) PL intensity decay curves monitored at 616 nm under 300 nm excitation for the composite films with blending ratios of 5% and 50%.

Figure 5.
(a) Photographs of luminescence from patterns with different shapes under room light, 395 nm, and 365 nm handheld UV lamps; (b) Photoluminescence spectra of the patterned films excited at 300 nm; (c) Time-resolved photoluminescence decay curves monitored at 613 nm for the different patterns.


Table 1.
PLQY at different blending ratios.
| Ratio | 5% | 10% | 30% |
| PLQY 1 | 1.74% | 8.27% | 5.62% |
1 Integration from 500 nm to 750 nm.
Table 2.
Intensity ratios and excited state lifetimes for the patterns with different shapes.
| Pattern | I | ♥ | SCUT |
| Intensity ratio 1 [a.u.] | 1.61 | 1.93 | 1.53 |
| Lifetime 2 [μs] | 178 | 150 | 256 |
1 The intensity ratio is defined as the ratio of intensities at 613nm and 621nm; 2 Average lifetime of the excited-state monitored at 613 nm.
Disclaimer/Publisher’s Note: The statements, opinions and data contained in all publications are solely those of the individual author(s) and contributor(s) and not of MDPI and/or the editor(s). MDPI and/or the editor(s) disclaim responsibility for any injury to people or property resulting from any ideas, methods, instructions or products referred to in the content. |
© 2026 by the authors. Licensee MDPI, Basel, Switzerland. This article is an open access article distributed under the terms and conditions of the Creative Commons Attribution (CC BY) license (http://creativecommons.org/licenses/by/4.0/).
Copyright: This open access article is published under a Creative Commons CC BY 4.0 license, which permit the free download, distribution, and reuse, provided that the author and preprint are cited in any reuse.


