

Submitted:
23 May 2026
Posted:
25 May 2026
You are already at the latest version
Abstract
Early and accurate classification of neurodegenerative diseases remains challenging because of overlapping cognitive symptoms and delayed clinical presentation. The Montreal Cognitive Assessment (MoCA) is a brief, 30-point cognitive screening tool widely used for screening mild cognitive impairment (MCI) in most neurogenerative diseases. MoCA is particularly valuable in neurodegenerative diseases where cognitive changes may be subtle in early stages. Background/Objectives: This work aims at assessing the effectiveness of using machine learning algorithms for predicting and classifying neurodegenerative diseases classification obtained from MoCA. Methods: This study analyzed a refined dataset of 64 adult records from the National Institute of Neurological Disorders and Stroke, focusing on patients with neurodegenerative conditions such as Parkinson’s disease and Essential Tremor, among other neurodegenerative conditions. We utilized the Orange Data Mining platform to apply various machine learning algorithms to MoCA data, aiming to develop predictive models for both categorical clinical diagnoses and continuous cognitive scores. The performance of these models was rigorously evaluated using a comprehensive suite of metrics, including Area Under the ROC Curve (AUC) for classification tasks and Mean Squared Error (MSE) for regression analysis. Results: While predictive models achieved near-perfect accuracy in calculating MoCA total scores due to the direct arithmetic relationship with their subdomain features, they demonstrated only marginal success in classifying specific neurological diagnoses. These findings suggest that while the MoCA is internally consistent for global cognitive profiling, it lacks the necessary discriminative power to distinguish between complex neurodegenerative conditions without the integration of additional clinical or biomarker data. Conclusions: This study offers crucial insights into the capabilities and limitations of machine learning in cognitive assessment, advocating for a multimodal, precision medicine approach to early diagnosis and characterization of neurodegenerative diseases.
Keywords:
neurodegenerative diseases
; machine learning
; predictions
; cognitive screening
1. Introduction
Neurodegenerative diseases are increasingly understood as conditions that extend beyond motor impairment to encompass substantial cognitive deficits. Disorders such as Parkinson’s disease (PD), Essential Tremor (ET), Corticobasal Degeneration (CBD), Multiple System Atrophy (MSA) and Progressive Supranuclear Palsy (PSP) frequently present with cognitive decline affecting executive function, attention, memory, and visuospatial processing [1]. Early identification of cognitive impairment in these disorders is essential for an accurate prognosis, individualized treatment planning, caregiver guidance, and research stratification. The Montreal Cognitive Assessment (MoCA), developed by Ziad Nasreddine [2], is widely regarded as one of the most sensitive screening instruments for mild cognitive impairment in neurodegenerative disorders. Machine learning (ML) offers a data-driven framework for predicting MoCA scores and differentiating disease subtypes by integrating multimodal biomarkers, supporting precision medicine initiatives aimed at early detection and personalized care [3]. In this study, ML algorithms were applied to perform both classification and regression tasks for the neurodegenerative diseases under investigation. Previous research has extensively used ML techniques on neuropsychological assessments and neuroimaging modalities to diagnose neurodegenerative diseases, achieving high precision in distinguishing conditions such as Alzheimer’s disease (AD) and Parkinson’s disease (PD). Methods including support vector machines (SVMs) and convolutional neural networks (CNNs) applied to MRI and PET imaging have demonstrated strong diagnostic performance [1,3]. Nevertheless, a notable gap remains in the use of the Montreal Cognitive Assessment (MoCA)—a widely accessible and cost-effective cognitive screening tool—for multi-disease classification. Most existing studies focus on single-disease detection or do not incorporate MoCA’s comprehensive metrics into scalable ML frameworks [3,4]. To address this limitation, our study uses the MoCA total score as a unified input feature to develop an ML model capable of simultaneously classifying multiple neurodegenerative disorders (e.g., AD, PD, vascular dementia) while also predicting disease severity numerically. This approach enhances clinical accessibility and practicality by reducing dependence on resource-intensive imaging technologies, thereby broadening the applicability of ML-driven diagnostic tools in routine clinical settings [5,6].
2. Materials and Methods
After receiving institutional approval, datasets from the National Institute of Neurological Disorders and Stroke (NINDS) at the National Institutes of Health (NIH) was analyzed. The initial dataset comprised 133 adult records obtained from Montreal Cognitive Assessment (MoCA) neurological examinations. After addressing missing data, 64 observations were retained for analysis. The cohort included individuals diagnosed with Parkinson’s disease (PD), Essential Tremor (ET), Corticobasal Degeneration (CBD), Multiple System Atrophy (MSA) and Progressive Supranuclear Palsy (PSP). The primary clinical measure examined was the Montreal Cognitive Assessment (MoCA), a brief screening tool for mild cognitive impairment [2,7]. The MoCA evaluates multiple cognitive domains, including attention, executive functioning, memory, language, visuospatial ability, conceptual thinking, calculation, and orientation [8,9,10]. The instrument has a maximum score of 30 points, with scores of 26 or higher generally considered within the normal range [11]. Given the growing potential of artificial intelligence (AI) to enhance early detection and clinical management of neurodegenerative and psychiatric conditions [9,12,13], this study employed machine learning (ML) techniques to generate diagnostic and predictive models using both numerical and categorical features from the dataset. All data processing and modeling procedures were conducted using the Orange Data Mining Platform (version 3.38.1), where pipelines are developed for machine learning algorithm (MLA) prediction and classification tasks [14].
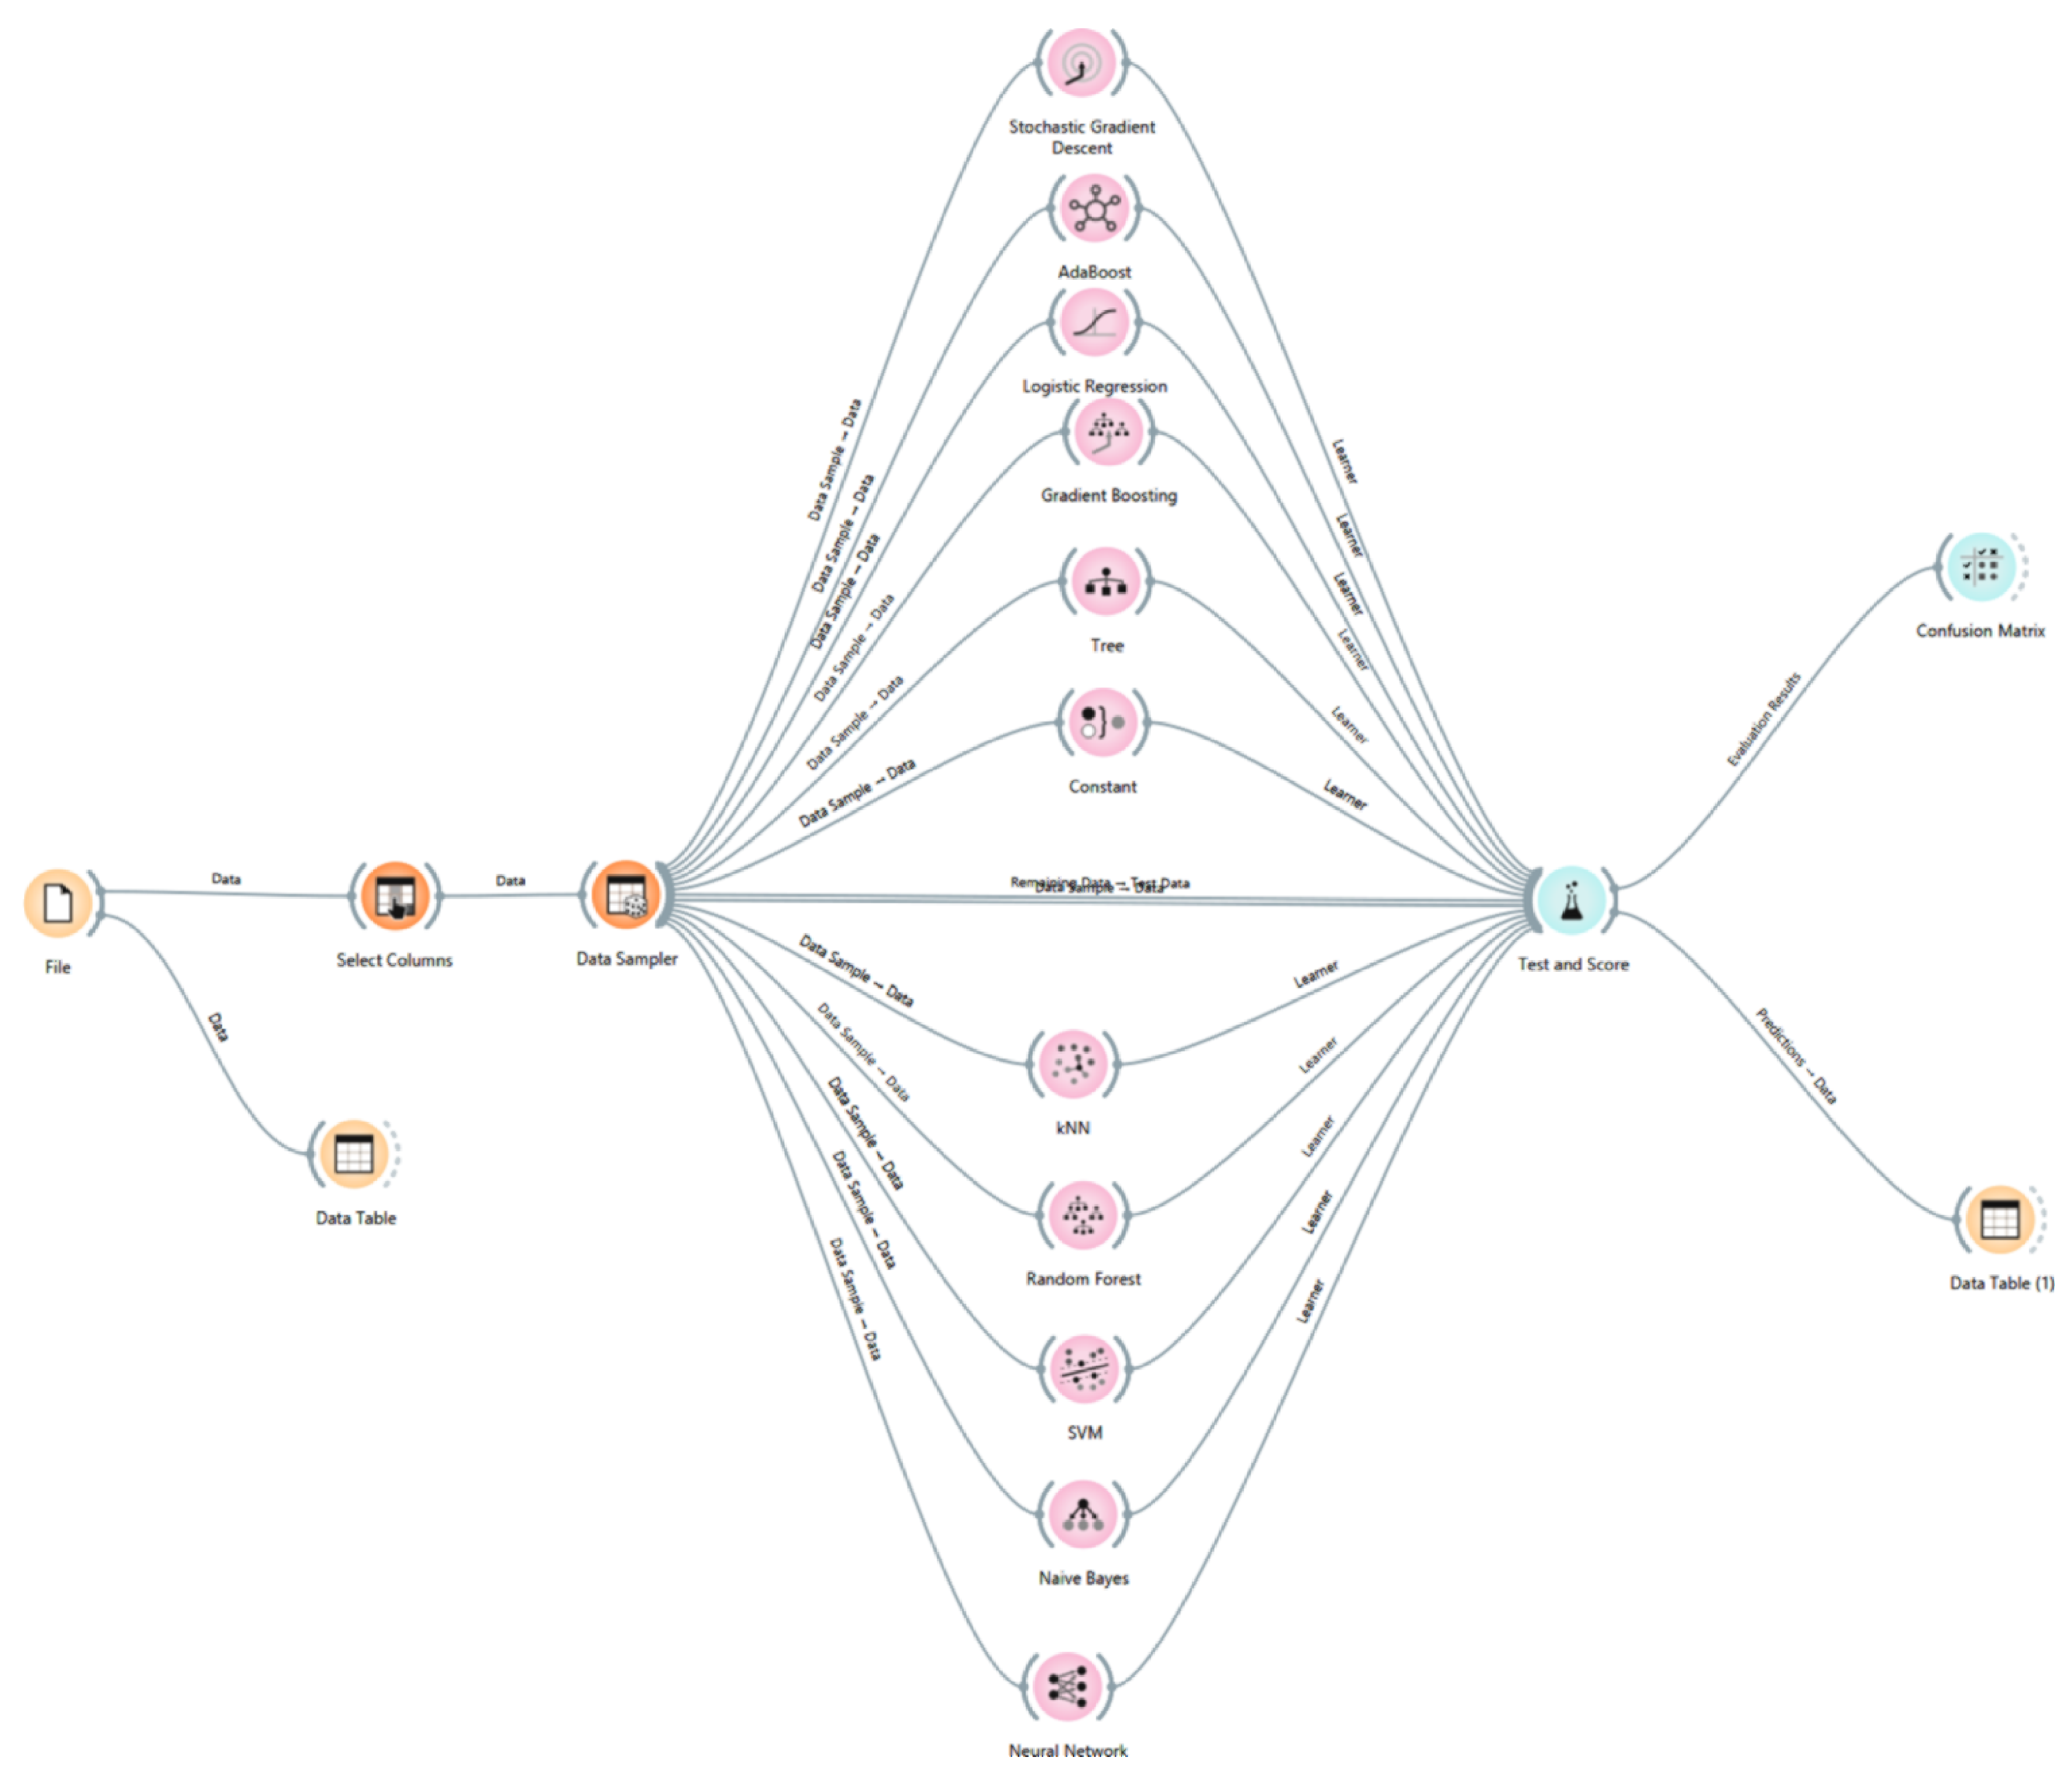
Orange Data Mining Pipelines: These illustrate the application of several machine learning algorithms (MLAs) for the numerical prediction of MoCA scores and the classification of neurodegenerative diseases are presented below. The pipeline comprises four main stages. First, data are imported using the File and Data Table widgets. Next, data transformation is carried out through the Select Columns and Data Sampler widgets. The Select Columns widget is used for preprocessing tasks such as removing irrelevant variables and specifying the target and predictor variables, while the Data Sampler widget defines the proportion of data allocated for training and testing. Cross-validation is also conducted at this stage.
Following data preparation, the learning phase is performed using several machine learning algorithms, each represented by its corresponding widget within the pipeline. Finally, model performance is evaluated using metrics appropriate for both classification and numerical prediction tasks through the Test and Score widget, which also facilitates fine-tuning of data sampling and cross-validation settings. In addition, the Confusion Matrix widget is used to assess the effectiveness of the classification algorithms.
2.1. Data Preprocessing
The dataset, originally formatted as an Excel spreadsheet, was imported into Orange Data Mining platform using the File widget. The refined dataset comprised 64 observations and 23 features, with an overall missing data of 13%.
2.2. Classification Framework
For the categorical prediction of neurodegenerative disease status (target variable: LD_MoCA Required Fields.NeuroDiagnosis), the preprocessed data was partitioned into a training set (84%) and a holdout test set (16%). Eleven machine learning algorithms (MLAs) [15,16] were implemented and evaluated:
- Baseline: Constant
- Instance-based: k-Nearest Neighbors (k-NN)
- Ensemble Methods: Random Forest, Gradient Boosting, AdaBoost
- Linear & Kernel Models: Support Vector Machine (SVM), Logistic Regression, Stochastic Gradient Descent (SGD)
- Probabilistic & Connectionist: Naïve Bayes, Neural Network
- Rule-based: Decision Tree
Model performance was rigorously assessed via the Test and Score module and validated through Confusion Matrices. While a comprehensive suite of metrics was recorded—including Area Under the ROC Curve (AUC), Classification Accuracy (CA), F1-score, Precision, Matthews Correlation Coefficient (MCC), Specificity, and Log Loss—CA and AUC were designated as the primary indicators of model efficacy.
2.3. Regression Analysis
In addition to categorical classification, regression modeling was performed to predict the Total MoCA Score as a continuous outcome variable. For this task, Naïve Bayes and Logistic Regression were excluded, and Linear Regression was incorporated, resulting in a total of ten evaluated algorithms. Predictive performance was assessed using Mean Squared Error (MSE), Root Mean Squared Error (RMSE), and Mean Absolute Error (MAE), Mean Absolute Percentage Error (MAPE), and the coefficient of determination ( ).
Figure 1.
Orange data mining pipeline for the MLA neurodegenerative diseases classification.
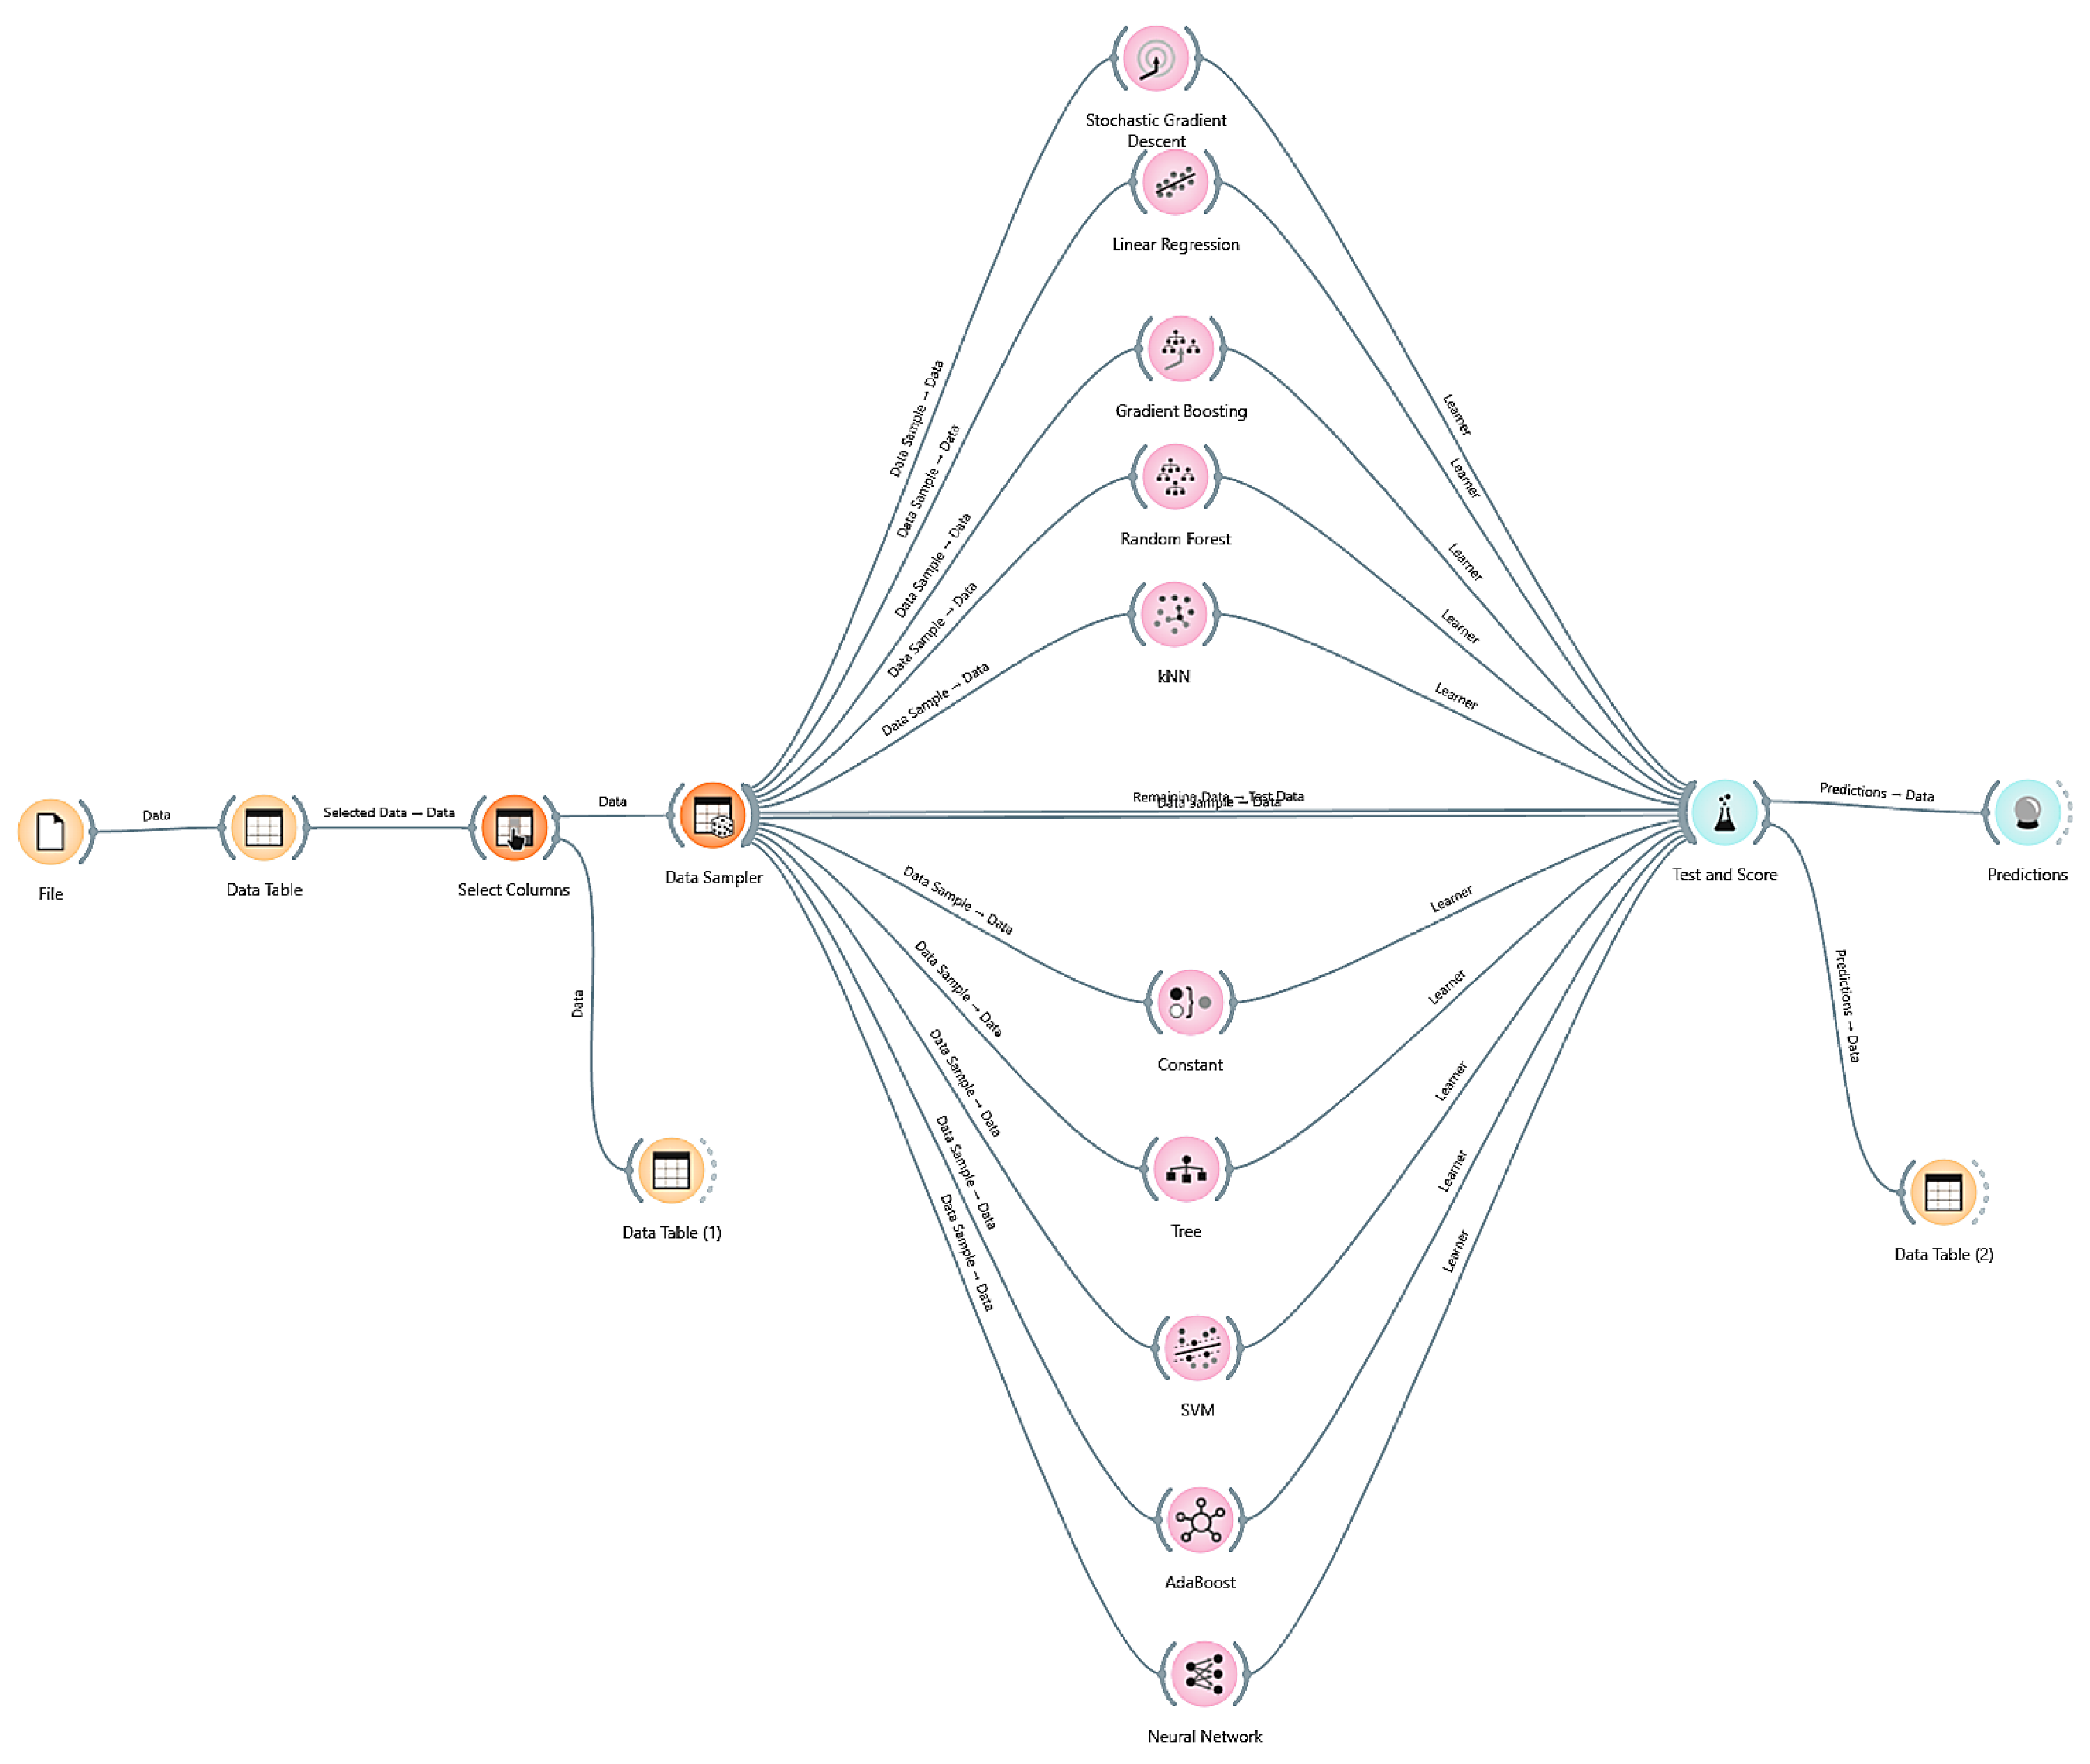
Figure 2.
Orange data mining pipeline for the MLA neurodegenerative diseases MoCA assessment score numerical prediction.
Figure 2.
Orange data mining pipeline for the MLA neurodegenerative diseases MoCA assessment score numerical prediction.
3. Results
This study evaluated supervised machine-learning approaches for two related yet distinct prediction problems derived from the Montreal Cognitive Assessment (MoCA) dataset: a multiclass classification task predicting neurological diagnoses and a regression task predicting the MoCA total score. Across both tasks, model performance was assessed in Orange using cross-validation, and results were interpreted alongside computational training time to understand practical tradeoffs between accuracy and complexity.
3.1. Classification Performance for Neurodiagnostic Group Prediction
In the multiclass classification framework, models were tasked with distinguishing among seven neurological diagnostic categories, including Parkinson’s Disease, Progressive Supranuclear Palsy, and Corticobasal Degeneration, among others. Performance was systematically modest across all algorithms. The k-Nearest Neighbors model achieved the highest area under the ROC curve at 0.560, closely followed by the Neural Network and Naive Bayes, yet these values indicate only slightly better-than-random discriminative capability. Logistic Regression offered the most balanced results, with the best F1-score (0.362), Matthews Correlation Coefficient (0.089), and the lowest logarithmic loss (2.755), suggesting a relatively better calibration of predicted probabilities. Notably, a simple Constant classifier, likely benefiting from class imbalance, recorded the highest accuracy (0.463) but showed no true predictive association, as reflected by an MCC of zero. Overall, these results imply that MoCA subdomain features alone possess limited power to accurately differentiate between complex Parkinsonian syndromes in a multiclass setting.
For the classification analysis (Table 1), the target variable was neurological diagnosis, a seven-class outcome (Corticobasal Degeneration, Essential Tremor, Multiple System Atrophy, No Neurological Diagnosis, Other, Parkinson’s Disease, and Progressive Supranuclear Palsy). Models were evaluated using 2-fold stratified cross-validation, and performance was summarized with standard classification metrics, including AUC, classification accuracy (CA), F1-score, precision, and Matthews correlation coefficient (MCC). Overall discrimination was modest: even the best-performing model achieved an AUC only slightly above 0.60, indicating limited separability among diagnostic classes using the available predictors. Among the evaluated models, Random Forest emerged as the most robust in terms of AUC (approximately 0.603) while also maintaining a comparatively short training time. Logistic Regression produced the highest reported accuracy among the learned models (CA approximately 0.407), but this improvement was not sufficient to surpass the baseline behavior of the dataset. A key finding in Table 1 was the unusually strong performance of the Constant (majority-class) baseline, which achieved a CA of approximately 0.463. The fact that many trained models performed worse than the Constant model in accuracy strongly suggests that the dataset is highly imbalanced, with one diagnosis category comprising a large proportion of cases. In such circumstances, accuracy becomes a misleading indicator of clinical usefulness because a model can achieve a seemingly competitive CA by predicting the majority diagnosis for most or all cases while failing to identify minority diagnoses. This imbalance is also consistent with the generally low MCC values observed across models; MCC values near zero indicate weak overall correlation between predictions and true labels when all classes are considered. The poor performance of Naive Bayes—with extremely low accuracy (approximately 0.056) and a slightly negative MCC—further indicates that simple distributional assumptions do not fit the structure of these data and may lead to systematic misclassification. From a clinical and measurement perspective, the difficulty of the classification task is not unexpected. The MoCA is designed as a broad cognitive screening tool rather than a disease-specific diagnostic instrument [17,18]. Multiple neurological conditions can produce overlapping cognitive profiles, and MoCA sub-scores may reflect general impairment severity more strongly than they reflect diagnosis-specific patterns. When diagnostic categories share similar cognitive presentations or when variability within categories is high, models trained primarily on MoCA-derived features will struggle to separate classes. Therefore, these results indicate that with the current feature set and validation approach, diagnosis prediction is challenging and is largely constrained by class imbalance and overlapping feature distributions, rather than by model choice alone.
3.2. Regression Performance for Predicting MoCA Total Score
Conversely, regression models predicting the continuous MoCA total score demonstrated remarkably strong performance. Here the target was MoCA total score, evaluated with 3-fold cross-validation using regression metrics such as MSE, RMSE, MAE, and . Stochastic Gradient Descent and Linear Regression approached near-perfect results, with R² values of 0.996 and 1.000, respectively, and minimal error metrics. Gradient Boosting and AdaBoost also performed robustly, with R² scores around 0.70. This high predictive accuracy, however, largely reflects the deterministic, arithmetic relationship between the MoCA subdomain scores and their sum; the total score is directly derived from its components. Thus, these results validate internal consistency rather than independent predictive generalization. Models like Random Forest and kNN achieved moderate success, while the Neural Network exhibited severe instability, indicating potential overfitting or optimization issues. Although at first glance a perfect regression fit might suggest an exceptionally strong predictive relationship, in practice this pattern is more consistent with target leakage or definitional overlap between predictors and the target.
Inspection of the regression dataset supports this interpretation. The available predictors include numerous MoCA component and subdomain variables (e.g., visuospatial/executive, naming, attention items such as digits and serial 7s, language components, abstraction, delayed recall, orientation, and an education indicator). In standard scoring, MoCA total score is computed as an additive function of these subscores (sometimes with an education adjustment). When the component items used to compute the total score are included as input features, predicting MoCA total becomes equivalent to reconstructing a score from its parts. Under these conditions, a linear model is expected to perform nearly perfectly—even under cross-validation—because the mapping is deterministic and holds in every fold. The near-perfect performance of SGD further supports the presence of a strong linear structure, while the failure of the neural network likely reflects mismatch between model settings and data scale, insufficient tuning, or instability in a small dataset rather than the absence of signal. Training-time comparisons reinforced the central observation that higher computational cost did not guarantee better performance. In the classification task, Random Forest provided the best overall discrimination while remaining efficient, whereas more computationally expensive approaches such as Gradient Boosting required substantially more training time without delivering superior results. In the regression task, the fastest models were also the most accurate: Linear Regression trained quickly and achieved perfect prediction, and SGD was only slightly slower while remaining near-perfect. These patterns emphasize that, for both tasks, model suitability to the underlying data-generating structure mattered more than algorithmic complexity.
The comparative overview highlights a fundamental insight: MoCA subdomain variables are excellent predictors of the instrument’s own total score, demonstrating strong internal coherence. Yet, they provide insufficient discriminative signal to reliably distinguish among specific neurological diagnoses. This suggests that while the MoCA effectively captures a global cognitive profile, differentiating between complex neurodegenerative conditions likely requires integration with additional clinical, imaging, or biomarker data.

Table 2.
Numerical prediction model performance.
| Model | Train(s) | Test(s) | MSE | RMSE | MAE | MAPE | |
|---|---|---|---|---|---|---|---|
| kNN | 0.025 | 0.044 | 2.922 | 1.709 | 1.273 | 0.055 | 0.596 |
| Constant | 0.000 | 0.001 | 7.370 | 2.715 | 2.034 | 0.085 | -0.018 |
| Random Forest | 0.068 | 0.021 | 3.070 | 1.752 | 1.184 | 0.051 | 0.576 |
| Tree | 0.114 | 0.000 | 5.878 | 2.424 | 1.577 | 0.066 | 0.188 |
| Gradient Boosting | 0.205 | 0.018 | 2.202 | 1.484 | 0.985 | 0.043 | 0.696 |
| SVM | 0.045 | 0.030 | 4.711 | 2.170 | 1.559 | 0.066 | 0.349 |
| Linear Regression | 0.026 | 0.018 | 0.000 | 0.000 | 0.000 | 0.000 | 1.000 |
| AdaBoost | 0.263 | 0.035 | 2.346 | 1.532 | 1.077 | 0.046 | 0.676 |
| Neural Network | 0.328 | 0.030 | 111.062 | 10.539 | 9.838 | 0.383 | -14.388 |
| Stochastic Gradient Descent | 0.045 | 0.026 | 0.029 | 0.170 | 0.119 | 0.005 | 0.996 |
4. Discussion
The findings of this study reveal a pronounced disparity in the performance of machine learning models when applied to two distinct clinical objectives: multiclass diagnosis prediction and total score estimation using the MoCA. While models demonstrated a strong capacity to reconstruct the MoCA total score from its subsections, they showed only modest ability to differentiate between specific neurological disorders based on cognitive domain profiles alone.
For the diagnostic classification task—aimed at distinguishing between Parkinson’s Disease, Progressive Supranuclear Palsy, Essential Tremor, Multiple System Atrophy, Corticobasal Degeneration, and related conditions—model performance was limited. The k-nearest neighbors algorithm achieved the highest area under the curve at 0.560, whereas logistic regression yielded the best balanced metrics, with an F1-score of 0.362 and a Matthews correlation coefficient of 0.089. These results suggest that although cognitive impairment manifests across these disorders, MoCA domain scores lack the specificity required for reliable differential diagnosis. Several factors likely contribute to this limitation, including overlapping cognitive profiles among parkinsonian syndromes, class imbalance with a predominance of Parkinson’s Disease cases, and the MoCA’s primary design as a screening rather than a diagnostic tool. The absence of substantial improvement with tree-based ensemble methods further indicates limited non-linear separability within the available cognitive features.
In contrast, regression models tasked with predicting the MoCA total score performed exceptionally well. Linear regression achieved perfect reconstruction with an R² of 1.000, and stochastic gradient descent closely followed with an R² of 0.996. This high performance is anticipated, given that the total score is derived directly from the sum of its subscores, necessitating little beyond straightforward linear aggregation. Gradient boosting and AdaBoost also performed strongly, though with slightly lower R² values of 0.696 and 0.676, respectively, capturing minor non-linear variations. Notably, neural networks exhibited instability, underscoring the risk of overfitting in smaller clinical datasets.
Clinically and methodologically, these outcomes emphasize three key insights: the structural robustness of the MoCA for total score calculation, its insufficiency as a standalone tool for precise neurological differential diagnosis, and the competitive performance of linear models over more complex algorithms when handling structured clinical scoring data. To enhance diagnostic accuracy, future modeling efforts should consider integrating multimodal data sources, such as neuroimaging biomarkers, motor severity scales like the UPDRS, longitudinal progression metrics, demographic variables, and advanced feature engineering techniques.
The study benefits from a comparative analysis of multiple algorithms, a cross-validation framework, and the simultaneous evaluation of classification and regression tasks. However, it is constrained by class imbalance, potential feature redundancy, the absence of an external validation cohort, and possible data leakage in the regression task, particularly given the arithmetic relationship between predictors and the target variable. These limitations highlight important considerations for the design and interpretation of machine learning applications in clinical cognitive assessment.
4.1. Comparative Analysis with Similar Studies
This study contrasts sharply with the multimodal, large-scale machine learning frameworks used in the four referenced investigations, particularly in terms of data scope, modeling depth, and diagnostic ambition. We analyzed a small dataset () derived solely from MoCA subdomain scores to perform both multiclass diagnostic classification across Parkinsonian syndromes and regression of total MoCA scores. While regression performance was near-perfect (), this reflected the arithmetic derivation of the total score from its components rather than true predictive generalization. Diagnostic classification performance was modest (AUC ≈ 0.56 at best), highlighting the limited discriminative capacity of MoCA subscores alone for differentiating complex neurodegenerative disorders.
In contrast, Gorji and Jouzdani [19] leveraged a substantially larger cohort () from the PPMI database and integrated deep radiomic features from DAT SPECT imaging with 17 clinical biomarkers. Their models achieved markedly higher predictive performance for cognitive decline, particularly when using MoCA-based definitions (AUC up to 0.89 in year 4), demonstrating the advantage of multimodal data fusion over cognitive scores alone. Similarly, Gourdeau et al. [20] analyzed 38,746 observations from the NACC database and employed advanced ensemble methods (e.g., XGBoost with nested grouped cross-validation), achieving improved Youden indices and robust subtype discrimination, especially for Alzheimer’s disease and primary progressive aphasia. These studies collectively illustrate how larger datasets, external validation strategies, and integration of demographic or biomarker-derived metrics enhance generalizability and clinical relevance.
Methodologically, the contrast is equally pronounced in terms of feature engineering and interpretability. This study relied primarily on MoCA subdomain aggregates within the Orange Data Mining platform, emphasizing internal consistency and basic supervised classifiers. Their findings suggest MoCA is structurally coherent but diagnostically insufficient as a standalone biomarker. By comparison, Chudzik and Przybyszewski [21] extended MoCA utility by incorporating temporal response dynamics (instrumental reaction time and time to submit) into machine learning and rough set theory models, increasing diagnostic accuracy from 80% to 93.4%, thereby demonstrating that behavioral metadata can meaningfully augment screening sensitivity. The Frontiers in Neuroscience study, Gourdeau et al. [20], further advanced interpretability using SHAP value analysis to identify disease-specific cognitive signatures (e.g., delayed recall in Alzheimer’s disease, verbal fluency in PPA), transforming MoCA from a simple cutoff-based screen into a precision-oriented diagnostic aid. Meanwhile, Jeon et al. [22] showed that even within PD cohorts, machine learning using MoCA domain scores (accuracy ≈ 0.74–0.78) outperformed or stabilized performance relative to fixed cutoffs, especially when dataset stringency increased.
Collectively, while this study provides important evidence about the limitations of MoCA-only models in small samples, the four comparison studies demonstrate that performance improves substantially when MoCA is embedded within multimodal, demographically adjusted, temporally enriched, or large-scale machine learning frameworks [23,24].
5. Conclusions
This study demonstrates the divergent strengths of machine learning models when applied to cognitive screening data for neurodegenerative disease research. While regression algorithms—particularly Linear Regression and Stochastic Gradient Descent—accurately reconstructed MoCA total scores with near-perfect precision, multiclass diagnostic models showed only modest discriminative capability. These findings highlight that MoCA subdomain features are highly effective for quantifying global cognitive performance but lack sufficient disease-specific granularity to reliably differentiate among complex parkinsonian and related neurodegenerative syndromes. The limited diagnostic performance likely reflects several interacting factors, including overlapping cognitive profiles across disorders, sample size constraints, and the MoCA’s design as a screening rather than a disease-classification instrument. Collectively, the results underscore that MoCA alone is insufficient as a standalone predictive biomarker for nuanced neurological differential diagnosis. Future work should integrate MoCA-derived cognitive indicators with complementary data modalities—such as neuroimaging biomarkers, motor function scores, longitudinal progression patterns, and advanced clinical or demographic variables—to enhance diagnostic specificity. Incorporating larger, more balanced cohorts and external validation datasets will also strengthen generalizability. Overall, the study provides important insights into the capabilities and limitations of ML-driven cognitive assessment analysis and supports a multimodal, precision-medicine approach to early identification and characterization of neurodegenerative diseases.
6. Limitations and Considerations
The MoCA has become a vital tool in assessing cognitive impairment across PD, ET, CBD, MSA, and PSP. Its multidomain design, focus on executive functions, and strong psychometric properties make it better than traditional screening tools such as the MMSE for detecting early and frontal-subcortical cognitive deficits. As awareness of non-motor symptoms in movement disorders grows, MoCA plays an important role in early diagnosis, prognosis, and research classification. Future studies combining MoCA with biomarkers and neuroimaging could further improve precision medicine strategies for the management of neurodegenerative diseases. Although MoCA has strengths, it functions as a screening tool rather than a full neuropsychological battery. Factors like education level, cultural background, and language skills can affect scores. Adjusted cutoff points might be needed for different populations. Additionally, disease-specific cognitive patterns may call for additional assessments. Nonetheless, the literature consistently supports MoCA as one of the most sensitive brief screening instruments for detecting cognitive impairment in neurodegenerative movement disorders.
Author Contributions
Conceptualization, Ngozi Mbue; Methodology, Kazeem Bode Olanrewaju and Ngozi Mbue; Software, Kazeem Bode Olanrewaju; Formal analysis, Kazeem Bode Olanrewaju; Resources, Kazeem Bode Olanrewaju and Ngozi Mbue; Writing – original draft, Kazeem Bode Olanrewaju and Ngozi Mbue; Writing – review & editing, Kazeem Bode Olanrewaju and Ngozi Mbue; Visualization, Kazeem Bode Olanrewaju; Funding acquisition, Kazeem Bode Olanrewaju. All authors have read and agreed to the published version of the manuscript.
Funding
This work was supported by Prairie A & M University through the Faculty Enhancement Program.
Conflicts of Interest
The authors declare no conflicts of interest.
Abbreviations
| Abbreviations | Meaning |
| MoCA | Montreal Cognitive Assessment |
| MCI | Mild Cognitive Impairment |
| AUC | Area Under the ROC Curve |
| MSE | Mean Squared Error |
| PD | Parkinson’s disease |
| ET | Essential Tremor |
| CBD | Corticobasal Degeneration |
| MSA | Multiple System Atrophy |
| PSP | Progressive Supranuclear Palsy |
| ML | Machine learning |
| AD | Alzheimer’s disease |
| SVM | Support Vector Machine |
| CNN | Convolutional Neural Network |
| MRI | Magnetic Resonance Imaging |
| PET | Positron Emission Tomography |
| NINDS | National Institute of Neurological Disorders and Stroke |
| NIH | National Institutes of Health |
| MLA | Machine learning algorithm |
| k-NN | k-Nearest Neighbors |
| SGD | Stochastic Gradient Descent |
| CA | Classification Accuracy |
| MCC | Matthews Correlation Coefficient |
| RMSE | Root Mean Squared Error |
| MAE | Mean Absolute Error |
| MAPE | Mean Absolute Percentage Error |
References
- Erkkinen, M. G.; Kim, M.; Geschwind, M.D. Clinical Neurology and Epidemiology of the Major Neurodegenerative Diseases. Cold Spring Harb. Perspect. Biol. 2018, 10, a033118. [Google Scholar] [CrossRef] [PubMed]
- Nasreddine, Z.S.; Phillips, N.A.; Bédirian, V.; Charbonneau, S.; Whitehead, V.; Collin, I.; Cummings, J.L.; Chertkow, H. The Montreal Cognitive Assessment, MoCA: a brief screening tool for mild cognitive impairment. J. Am. Geriatr. Soc. 2005, 53, 695–699. [Google Scholar] [CrossRef] [PubMed]
- Ricetti, C.; Carrara, L.; La Torre, D. The potential of machine learning in diagnosing neurological and psychiatric diseases: a review. Discov. Artif. Intell. 2025, 5, 105. [Google Scholar] [CrossRef]
- Wang, J.; Chen, Y.; Xie, X.; Wang, P.; Hu, H.; Han, H.; Wang, L.; Zhang, L. Diagnostic classification of mild cognitive impairment in Parkinson’s disease using subject-level stratified machine-learning analysis. Front. Aging Neurosci. 2025, 17, 1687925. [Google Scholar] [CrossRef]
- Wang, Z.; Yan, J. Interpretable machine learning for cognitive impairment prediction in Parkinson’s disease: a multicenter validation study with SHAP analysis. Front. Aging Neurosci. 2025, 17, 1688653. [Google Scholar] [CrossRef] [PubMed]
- Khalifa, M.; Albadawy, M. AI in diagnostic imaging: revolutionising accuracy and efficiency. Comput. Methods Programs Biomed. Update 2024, 5, 100146. [Google Scholar] [CrossRef]
- Hoops, S.; Nazem, S.; Siderowf, A.; Duda, J.; Xie, S.; Stern, M.; Weintraub, D. Validity of the MoCA and MMSE in the detection of MCI and dementia in Parkinson disease. Neurology 2009, 73, 1738–1745. [Google Scholar] [CrossRef] [PubMed]
- Julayanont, P.; Phillips, N.; Chertkow, H.; Nasreddine, Z.S. Montreal Cognitive Assessment (MoCA): concept and clinical review. In Cognitive screening instruments: A practical approach; Springer, 2012; pp. 111–151. [Google Scholar]
- Bruijnen, C.J.; Dijkstra, B.A.; Walvoort, S.J.; Budy, M.J.; Beurmanjer, H.; De Jong, C.A.; Kessels, R.P. Psychometric properties of the Montreal Cognitive Assessment (MoCA) in healthy participants aged 18–70. Int. J. Psychiatry Clin. Pract. 2020, 24, 293–300. [Google Scholar] [CrossRef] [PubMed]
- Coen, R.F.; Robertson, D.A.; Kenny, R.A.; King-Kallimanis, B.L. Strengths and limitations of the MoCA for assessing cognitive functioning: findings from a large representative sample of Irish older adults. J. Geriatr. Psychiatry Neurol. 2016, 29, 18–24. [Google Scholar] [CrossRef] [PubMed]
- Ratcliffe, L.N.; Hale, A.C.; McDonald, T.; Hewitt, K.C.; Nguyen, C.M.; Spencer, R.J.; Loring, D.W. The Montreal Cognitive Assessment: norms and reliable change indices for standard and MoCA-22 administrations. Arch. Clin. Neuropsychol. 2024, 39, 747–765. [Google Scholar] [CrossRef] [PubMed]
- Mikaeili, N.; Naeim, M.; Narimani, M. Reimagining mental health with Artificial Intelligence: early detection, personalized care, and a preventive ecosystem. J. Multidiscip. Healthc. 2025, 7355–7373. [Google Scholar] [CrossRef] [PubMed]
- Rehmat, M.A.; Ejaz, A. AI-Driven Mental Health Diagnosis: Early Detection of Psychological Disorders. J. Bus. Insight Innov. 2025, 4, 51–66. [Google Scholar]
- Demšar, J.; Curk, T.; Erjavec, A.; Gorup, Č.; Hočevar, T.; Milutinovič, M.; Možina, M.; Polajnar, M.; Toplak, M.; Starič, A.; et al. Orange: data mining toolbox in Python. J. Mach. Learn. Res. 2013, 14, 2349–2353. [Google Scholar]
- Saravanan, R.; Sujatha, P. A state of art techniques on machine learning algorithms: a perspective of supervised learning approaches in data classification. In Proceedings of the 2018 Second international conference on intelligent computing and control systems (ICICCS); IEEE, 2018; pp. 945–949. [Google Scholar]
- Singh, A.; Thakur, N.; Sharma, A. A review of supervised machine learning algorithms. In Proceedings of the 2016 3rd international conference on computing for sustainable global development (INDIACom); Ieee, 2016; pp. 1310–1315. [Google Scholar]
- Ilardi, C.R.; Menichelli, A.; Michelutti, M.; Cattaruzza, T.; Federico, G.; Salvatore, M.; Iavarone, A.; Manganotti, P. On the clinimetrics of the montreal cognitive assessment: cutoff analysis in patients with mild cognitive impairment due to alzheimer’s disease. J. Alzheimer’s Dis. 2024, 101, 293–308. [Google Scholar] [CrossRef] [PubMed]
- Larner, A.J. The usage of cognitive screening instruments: test characteristics and suspected diagnosis. In Cognitive Screening Instruments: A Practical Approach; Springer, 2017; pp. 315–339. [Google Scholar]
- Gorji, A.; Fathi Jouzdani, A. Machine learning for predicting cognitive decline within five years in Parkinson’s disease: Comparing cognitive assessment scales with DAT SPECT and clinical biomarkers. PLoS ONE 2024, 19, e0304355. [Google Scholar] [CrossRef] [PubMed]
- Gourdeau, C.; Gourdeau, C.L.; Bernier, P.J.; Laforce, R. Enhanced diagnostic interpretation of the MoCA using machine learning. Front. Neurosci. 2026, 20, 1679649. [Google Scholar] [CrossRef] [PubMed]
- Chudzik, A.; Przybyszewski, A.W. Classification of Parkinson’s disease using machine learning with MoCA response dynamics. Appl. Sci. 2024, 14, 2979. [Google Scholar] [CrossRef]
- Jeon, J.; Kim, K.; Baek, K.; Chung, S.J.; Yoon, J.; Kim, Y.J. Accuracy of machine learning using the Montreal Cognitive Assessment for the diagnosis of cognitive impairment in Parkinson’s disease. J. Mov. Disord. 2022, 15, 132. [Google Scholar] [CrossRef] [PubMed]
- Patil, S.; Kukreja, S. Early detection of cognitive decline with deep learning and graph-based modeling. MethodsX 2025, 14, 103405. [Google Scholar] [CrossRef] [PubMed]
- de Filippis, R.; Al Foysal, A. Deep Learning for Predicting Post-Stroke Cognitive Decline Using Multimodal Data: A Synthetic Proof-of-Concept Study. Open Access Libr. J. 2026, 13, 1–22. [Google Scholar] [CrossRef]
Table 1.
Cross-validated multiclass classification performance for neurological diagnosis prediction.
Table 1.
Cross-validated multiclass classification performance for neurological diagnosis prediction.
| Model | AUC | CA | F1 | Precision | Recall | MCC | Spec | LogLoss |
| Constant | 0.448 | 0.463 | 0.293 | 0.214 | 0.463 | 0.000 | 0.537 | 2.730 |
| kNN | 0.560 | 0.352 | 0.313 | 0.370 | 0.352 | 0.063 | 0.682 | 7.561 |
| Tree | 0.483 | 0.274 | 0.271 | 0.278 | 0.274 | -0.008 | 0.667 | 23.476 |
| Random Forest | 0.389 | 0.330 | 0.292 | 0.309 | 0.330 | 0.033 | 0.626 | 4.466 |
| Gradient Boosting | 0.484 | 0.296 | 0.289 | 0.284 | 0.296 | 0.008 | 0.726 | 6.316 |
| SVM | 0.428 | 0.328 | 0.327 | 0.426 | 0.328 | 0.003 | 0.595 | 2.815 |
| Logistic Regression | 0.487 | 0.366 | 0.362 | 0.407 | 0.366 | 0.089 | 0.667 | 2.755 |
| Naive Bayes | 0.537 | 0.355 | 0.355 | 0.407 | 0.355 | 0.017 | 0.632 | 4.477 |
| AdaBoost | 0.459 | 0.230 | 0.224 | 0.241 | 0.230 | -0.058 | 0.759 | 3.045 |
| Neural Network | 0.550 | 0.315 | 0.315 | 0.305 | 0.315 | 0.016 | 0.697 | 3.811 |
| SGD | 0.533 | 0.321 | 0.321 | 0.343 | 0.321 | 0.065 | 0.753 | 24.697 |
Disclaimer/Publisher’s Note: The statements, opinions and data contained in all publications are solely those of the individual author(s) and contributor(s) and not of MDPI and/or the editor(s). MDPI and/or the editor(s) disclaim responsibility for any injury to people or property resulting from any ideas, methods, instructions or products referred to in the content. |
© 2026 by the authors. Licensee MDPI, Basel, Switzerland. This article is an open access article distributed under the terms and conditions of the Creative Commons Attribution (CC BY) license (http://creativecommons.org/licenses/by/4.0/).
Copyright: This open access article is published under a Creative Commons CC BY 4.0 license, which permit the free download, distribution, and reuse, provided that the author and preprint are cited in any reuse.


