

Submitted:
22 May 2026
Posted:
25 May 2026
You are already at the latest version
Abstract
Assessing the effects of opencast coal mining on surface water is often complex, requiring integrated approaches that combine guideline-based assessments, water quality indices, hydrochemical tools, and statistical analyses. This study evaluated multi-year water qual-ity data (2018 – 2023) from five sites along the Leeuwfonteinspruit, a tributary of the Oli-fants River Catchment, in the Mpumalanga Province of South Africa. Water quality pa-rameters were assessed against the South African Water Quality Guidelines (SAWQG) for domestic, agricultural, and aquatic ecosystem uses. The results indicated frequent ex-ceedances of SAWQGs for Key parameters such as sulphate (SO4), electrical conductivity (EC), total dissolved solids (TDS), magnesium (mg), calcium (Ca), iron (Fe), aluminium (Al), and manganese (Mn), especially at the downstream site, indicating the influence of coal mining activities. Weighted Arithmetic Water Quality Index (WA-WQI) and Canadi-an Council of Ministers of the Environment Water Quality Index (CCME-WQI) assess-ments classified water quality from good at some upstream sites to consistently poor/marginal water quality at downstream. Irrigation suitability, based on sodium ad-sorption ratio (SAR) and exchangeable sodium percentage (ESP), indicated that water is generally suitable for irrigation, though episodic SAR and ESP peaks indicate localised sodicity risks, which may decrease crop productivity in the particular area. Hydrogeo-chemical evaluation using Gibbs diagrams indicated that the upstream water chemistry is dominated by natural rock-water interactions and dilution, while midstream to down-stream sites increasingly reflect evaporation-crystallisation and anthropogenic inputs. The application of multivariate statistical analysis, such as Principal Component Analy-sis (PCA) and correlation analysis, indicated that the quality of water is primarily con-trolled by mining-related salinity and mineralisation, with secondary contributions from agricultural inputs. These findings demonstrate that opencast coal mining significantly compromises surface water quality in the Leeuwfonteinspruit, and highlight the need for strengthened monitoring, proactive mine water management and regulatory enforcement.
Keywords:
opencast coal mining
; surface water pollution
; olifants river
; water quality index
; multivariate statistical analysis
; sodium adsorption ratio
; exchangeable sodium percentage
; sequential Mann-Kendall
; Gibbs diagram
1. Introduction
Despite significant advancements in renewable energy sources such as wind, photovoltaic, hydropower, and natural gas, coal continues to dominate the global power production sector, driving infrastructural development and economic growth worldwide (International Energy Agency, 2024; Bulmer et al., 2021; Acharya and Kharel, 2020). However, coal mining and processing have significantly impacted the environment by destroying habitats (Dontala et al., 2015), polluting water resources (Mbedzi et al., 2020; Kamble and Kumbhar, 2019), and causing soil erosion (Kumar et al., 2023). These activities have also adversely impacted human health through the release of harmful pollutants, such as coal dust and toxic chemicals, which can lead to respiratory problems and other serious illnesses (Finkelman et al., 2021). Furthermore, the burning of coal for energy has resulted in the release of greenhouse gases that contribute to climate change (Nunes, 2023; Masood et al., 2020; Munawer, 2018).
Extensive research has examined the impacts of coal mining on water resources globally, including India (Kumar et al., 2023), the United States (Acharya and Kharel, 2020), China (Zhou et al., 2020), Nigeria (Ekwule et al., 2019), and Australia (Wright et al., 2017). Reported impacts of coal mining on water resources include the destruction of aquifers, formation of acid mine drainage (AMD), and contamination of both groundwater and surface water (Moyo et al., 2024; Esterhuyse and Buschke, 2020; Ray and Dey, 2020; Masood et al., 2020). Unlike energy sources, water has no substitute, making its sustainable management critically important (Mnyango et al., 2022).
South Africa continues to rely significantly on coal for its economic development (Hanto et al., 2022; Hassan, 2022). The Mpumalanga Province, which hosts 80% of the country’s coal mines, is the epicentre of coal supply in South Africa (Simpson et al., 2019). The Highveld and Witbank coalfields in Mpumalanga, located within the Olifants River Catchment, constitute the largest region of active coal mining operations in the country, significantly contributing to the river’s designation as one of the most polluted in southern Africa (Oberholster et al., 2021). The Olifants River Catchment, covering approximately 85 000 square kilometres, spans segments in both Mozambique and South Africa (Association for Water and Rural Development [AWARD], 2017). Extensive coal mining in this catchment area has severely affected water quantity and quality. The decline in water quality and availability due to irresponsible mining practices exacerbates South Africa’s water scarcity challenges, posing a potential water security crisis (Simpson et al., 2019). Sustainable practices and behavioural changes are crucial to protect both the ecological integrity and socio-economic wellbeing (Nkosi et al., 2021).
Among the various mining methods, opencast coal mining is widely utilised in South Africa due to its cost efficiency and high recovery rates (Ngwenyama and de Graaf, 2021; Ratshomo and Nembahe, 2018). However, this method poses significant environmental threats, particularly to water resources, which are already scarce and susceptible in South Africa (Laisani and Jegede, 2019). The primary sources of surface water pollution in opencast coal mining include dewatering of mine affected water, wastewater from dust suppression systems, seepage during excavations and leachate runoff from waste dumps, processing plants and product stockpiles (Ray and Dey, 2020). Additionally, AMD from exposed sulphide minerals, sediment-laden runoff from disturbed land, explosives residues from blasting, and spills of fuels and chemicals from mining equipment contribute to contamination (Singh et al., 2010).
Monitoring physicochemical parameters in mining areas provides insights into contamination sources and potential environmental impacts (Basharat et al., 2025; Mnyango et al., 2022; Iji et al., 2021). Due to the complexity of parameters involved in surface water quality assessment, various statistical analyses and hydrochemical tools have been developed to interpret water quality data. Hydrochemical tools, such as SAR, ESP, Water Quality Indices (WQIs), and Gibbs diagrams, are commonly used to evaluate water quality, identify potential pollution risks, and understand dominant hydrochemical processes (Basharat et al., 2025; Monira et al., 2024; Owolabi and Belle, 2023; Rawat et al., 2018). Similarly, multivariate statistical analysis, such as cluster analysis, PCA, factor analysis, as well as correlation analysis, and trend detection methods like Sequential Mann-Kendall (SMK), are frequently used to categorise contamination sources, detect spatial and temporal trends, and explore relationships between key water quality parameters (Akiner et al., 2024; Maremane et al., 2024; Atangana and Dzhangi, 2023; Han et al., 2023; Piroozfar et al., 2021).
Despite well-documented impacts of coal mining on the Olifants River (Atangana and Oberholster, 2021; Oberholster et al., 2021; Lebepe et al., 2019; Oberholster et al., 2017; Dabrowski et al., 2014), there is a notable lack of studies investigating how opencast coal mining activities affect smaller tributaries, such as Leeuwfonteinspruit, that directly feed into the Olifants River, and affect the health of downstream water users. These tributaries play a critical role in the overall health of the catchment, acting as conduits that transport pollutants from mining sites to larger water bodies. Their degradation can further lead to long-term ecological consequences, affecting biodiversity, human livelihoods, and water security. This leaves a crucial gap in our understanding of localised pollution sources and their implications for the broader environment, aquatic systems, and human health.
To address this critical gap, the present study examined the Leeuwfonteinspruit, a tributary of the Olifants River, to evaluate the effects of opencast coal mining activities on surface water quality. By analysing temporal and spatial variations in key water quality parameters and identifying potential sources of contamination, the research provided a scientific basis for understanding how mining activities affect downstream water users and ecosystem integrity. The objectives of the study were to (1) determine the current water quality status of the stream, (2) analyse spatial and temporal trends across the monitoring sites, (3) investigate the potential sources and pathways of contamination, (4) determine the suitability of the water for downstream users, and (5) develop management and mitigation strategies to protect downstream water users.
2. Materials and Methods
2.1. Study Area
The study area is located within the Mpumalanga Province of South Africa, approximately 23 km west of Hendrina and 40 km south of Middelburg. It falls within the upper Olifants River Catchment, specifically within quaternary catchment B11B, which includes the Leeuwfonteinspruit. This catchment falls within the larger Limpopo River Basin, an international drainage system shared by South Africa, Zimbabwe, Botswana, and Mozambique (AWARD, 2017).
The upper section of the Olifants River flows into the Witbank Dam, which subsequently drains into the Doornpoort Dam. The water from the Witbank Dam is utilised for both industrial and domestic purposes. In addition, the dam serves as key recreational site, supporting activities such as birdwatching, fishing, camping, sailing, boating and other leisure activities along its banks.
The Leeuwfonteinspruit catchment area is characterised by primarily grassland natural vegetation, alongside widespread irrigated and dry-land agricultural activities. Livestock farming in various forms is also prevalent. The area is dotted with several small towns and smaller urban settlements, predominantly serving as satellite communities for the nearby coal mines and power stations dispersed throughout the region. Figure 1 indicate the study area in relation to the quaternary catchments, surrounding towns and major tributaries of the Olifants River.
2.2. Study Design
This study employed a quantitative research method, using historical physicochemical water quality data collected over a period of six years (from 2018 to 2023). The dataset comprises monthly monitoring data of five surface water monitoring points within the Leeuwfonteinspruit and its unnamed tributaries, both upstream and downstream of the active coal mining activities. Figure 2 displays the monitoring locations, while Table 1 provides descriptions of the sampling sites in relation to mining area boundary, along with their geographical coordinates.
2.3. Field Data Collection
All the field data was captured in the water monitoring field book, which included essential details for each monitoring point. The sampling date and time were documented to establish a temporal context for the data. Weather conditions at the time of sampling were noted, as they can significantly influence water quality parameters. Each sample was assigned a unique identifier (sample name) to ensure traceability. Detailed descriptions of each monitoring site were provided, including any notable features or conditions. Any relevant observations, such as unusual water colour, the presence of algae, or visible contamination, were recorded. The precise geographical coordinates of each monitoring point were documented using a GPS device. Pictures of each monitoring location were taken to offer a visual reference and assist in identifying changes over time.
Surface water samples were collected monthly using the grab sampling method. Clean 1-litre sampling bottles, sterilised and provided by the laboratory, were used for sample collection to ensure that samples were free from contamination. Each sample bottle was clearly labelled with the sample identity, date and time of collection using a permanent marker, facilitating accurate tracking and identification of samples. The collection process involved submerging the bottles just below the water surface to avoid collecting debris or surface scum, ensuring the bottles were filled completely without any air space, which can result in oxidation. After collection, the samples were immediately placed in a cooler box with ice packs to maintain a lower temperature and preserve their integrity until they could be submitted to the laboratory. Samples were transported to the laboratory within the same day they were collected, minimising the potential for changes in water quality parameters.
On-site measurements of key physical parameters were conducted using specialised instruments to ensure accuracy and reliability. A pH was measured using the properly calibrated pH meter at each monitoring point, with the meter calibrated before each use, using standard buffer solutions. The EC and TDS levels were measured using an Extech DO700 meter, which was properly calibrated prior to use.
2.4. Chemical Analysis of the Samples and Data Management
Collected water samples were submitted to SANAS accredited laboratory (Regen Water (Pty) Ltd laboratory in Witbank) for the chemical analyses of the following elements: suspended solids, nitrate and nitrite as N, chloride (Cl), total hardness as CaCO3, total alkalinity as CaCO3, potassium (K), fluoride (F), Turbidity, Phosphate (PO4), SO4, Na, Fe, Ca, Mg, Mn, and Al. All the laboratory analyses were performed according to the South African Bureau of Standards.
The suspended solids were quantified through gravimetric analysis, which involved heating samples to 103 – 105 °C to evaporate water and determine the solid residue mass. For elemental analysis, including Mg, Ca, Na, K, Mn, Fe, and Al, Inductively Coupled Plasma – Optical Emission Spectrometry (Agilent 5110 ICP-OES) and Inductively Coupled Plasma – Mass Spectrometry (Agilent 7900 ICP-MS) methodologies were utilised, offering high sensitivity and specificity in detecting trace metals. Additionally, SO4, Cl, and F concentrations were determined via Flow Injection Analysis, ensuring rapid and accurate results for these key ions. Total alkalinity and total hardness were measured using either automated or manual titration methods.
Once the results were received from the laboratory, the data were captured and organised in an Excel spreadsheet. This spreadsheet served as a central source for all water quality data, facilitating easy access and analysis. Data entry involved manual input, which was double-checked for accuracy against the original data sources. Regular audits were conducted to validate the correctness and completeness of the database. To prevent data loss, the spreadsheet was backed up regularly on both local and cloud-based storage systems. Access to the spreadsheet was restricted to authorised personnel to ensure data security, with password protection and user permissions in place.
2.5. Data Analysis
2.5.1. Water Quality Analysis
Water quality analysis provides a comprehensive assessment of the water within the coal mines, offering insights into areas of concern, the most detrimental parameters, the primary contaminants, and the sources of contamination (Kamble and Kumbhar, 2019). By monitoring the physical and chemical aspects, it provides data on the presence of substances and their concentrations (Iji et al., 2021). This monitoring aids in identifying the most effective methods for reducing water resource pollution and implementing appropriate measures to prevent contamination and serves as a preliminary alert mechanism to support effective and efficient planning (Mnyango et al., 2022). Assessing water quality in coal mining is particularly important for human health and water resource management (da Silva Bonifácio et al., 2021; Prathap and Chakraborty, 2019).
The water quality data was assessed against the SAWQG developed by the Department of Water Affairs and Forestry (DWAF), now known as the Department of Water and Sanitation (DWS). The SAWQG provide essential guidance for evaluating the suitability of water for various uses and supporting water quality management decisions. A key component of these guidelines is the Target Water Quality Range (TWQR), which defines the acceptable concentration range of specific constituents to ensure water remains fit for its intended use, even with long-term continuous exposure. In addition to safeguarding human uses, the TWQR also protects aquatic ecosystems (DWAF, 1996a).
In determining the appropriate guidelines for comparison, potential downstream users were identified through a review of aerial photographs, literature, and site visit observations. The evaluation of downstream users of the Leeuwfonteinspruit up to its confluence with Olifants River included several usage classes: domestic users who use the water for washing and other domestic activities, aquatic species, irrigation users, and livestock watering. Therefore, the water quality was compared against the following guidelines:
- SAWQG Volume 1: Domestic Water Use (DWAF, 1996a).
- SAWQG Volume 4: Agricultural Water Use – Irrigation (DWAF, 1996b).
- SAWQG Volume 5: Agricultural Water Use – Livestock Watering (DWAF, 1996c).
- SAWQG Volume 7: Aquatic ecosystem (DWAF, 1996d).
2.5.2. Water Quality Indices
The WQI is a mathematical approach that combines diverse factors, primarily physical and chemical, to evaluate the condition of surface water, groundwater, and lake water (Akiner et al., 2024). It synthesises the collective effects of multiple water quality parameters, facilitating easy interpretation and utilisation by water managers (Atangana, 2023). WQIs were computed to provide an overall assessment of water quality at each sampling site. These indices integrate multiple parameters into a single value, making it easy to compare water quality across different locations and identify areas of concern (Akiner et al., 2024; Atangana and Dzhangi, 2023; Mnyango et al., 2022). This study employed both the WA-WQI and CCME-WQI as complementary assessment tools, with the WA-WQI providing a weighted, parameter-based assessment and the CCME-WQI assessing compliance with the guideline limits, together strengthening the overall water quality assessment.
2.5.2.1. The Weighted Arithmetic Water Quality Index
The Weighted Arithmetic Water Quality Index (WA-WQI) was computed using the weighted arithmetic index method, based on the class 1 drinking water quality standards set by the South African Bureau of Standards (Owolabi and Belle, 2023). The WA-WQI method was adopted due to its ability to produce reliable results using a smaller set of water quality parameters. The method categorises water quality into five classes based on WQI scores ranging from 0 to over 100 (Basharat et al., 2025). In this study, the following classification was used: excellent (0 – 25), good (26 – 50), poor (51 – 75), very poor (76 – 100), and unsuitable for use (> 100). The mathematical formula of the WA-WQI is presented below:
We determine the unit weight, Wi, of each parameter using the equation below:
where K (constant of proportionality) is given by:
= Standard permissible value of the ith parameter.
The Sub-Index (Qi) value was calculated by using the following equation:
Where;
= measured concentration of the ith parameters,
= Ideal value of the parameters in pure water (generally zero for most parameters and 7 for pH).
Finally, the WA-WQI was computed as:
2.5.2.2. Canadian Council of Ministers of the Environment Water Quality Index
The application of the CCME-WQI has been on the rise in assessing the pollution of water. This index efficiently consolidates various sets of biological, chemical, and physical data pertaining to water quality into a singular metric, indicating contamination levels (Akiner et al., 2024). The CCME-WQI provides a practical approach to simplify complex water quality data, making it more accessible for communication to a wide audience (Atangana and Dzhangi, 2023). Table 2 presents the water quality classifications based on the CCME-WQI.
The mathematical formula of the CCME-WQI is presented below:
F1 represents the percentage of variables that deviate from their objectives at least once, relative to the total number of variables measured.
F2 represents the percentage of individual tests that fail to meet their objectives.
F₃ is an asymptotic capping function that adjusts the normalised sum of the excursions from objectives (nse), ensuring the results fall within a range of 0 to 100.
For instances where the test value must not exceed the objective:
For instances where the test value must not fall below the objective:
For instances where the objective is zero:
2.5.3. Water Quality Suitability for Irrigation
Evaluating the SAR and ESP is essential for determining the suitability of surface water for irrigation. High SAR and ESP values can negatively affect soil structure by reducing hydraulic conductivity (Basharat et al., 2025; El Bilali and Taleb, 2020). Based on SAR, water is classified as excellent (<10), good (10 – 18), doubtful (18 – 26), and unsuitable (>26). Similarly, ESP categorises water as excellent (<20%), good (20 – 40%), permissible (40 – 60%), doubtful (60 – 80%), and unsuitable (>80%) for irrigation purposes (Rawat et al., 2018). SAR and ESP were calculated using the equations below:
2.5.4. Gibbs Diagram Analysis
The Gibbs diagram is a hydrogeochemical tool used to identify the dominant natural processes controlling the evolution of water quality (Gibbs, 1970). It helps to interpret environmental processes such as dilution, evaporation-concentration, mineral dissolution, mixing, and the influence of water residence time within the reservoir. In this study, Gibbs diagrams were constructed by plotting TDS against the ratio of Na to the sum of Na and Ca for cations, and the ratio of Cl to the sum of Cl and SO4 for anions (Owolabi and Belle, 2023; Marandi and Shand, 2018).
This approach enables the determination of the prevailing geochemical control field by relating the cation and anion dominance against TDS concentrations. The three possible control fields are:
- Precipitation dominance – characterised by low TDS value against minimal SO4 and Ca concentrations.
- Rock dominance – associated with moderate TDS and water chemistry influenced by the dissolution of silicate and carbonate rocks.
- Evaporation-crystallisation dominance – defined by high TDS and elevated ion concentrations due to evaporation or poor drainage.
2.5.5. Statistical Analysis
The water quality data was analysed by calculating the mean, median, standard deviation, and range for each parameter using Microsoft Excel. This approach provided an overview of the data distribution, highlighting central tendencies and variability, and helped identify any anomalies in the dataset. Microsoft Excel was also used to conduct temporal trend analysis for WQI, SAR and ESP for each monitoring point.
The SMK test was applied using RStudio to detect temporal trends in ESP, SAR, and WQI across the monitoring sites. The SMK analysis identifies temporal oscillations that display as either positive or negative trends throughout the statistical sequence, allowing assessments of periods of water quality deterioration or improvement over the monitoring period (Owolabi et al., 2022).
The IBM SPSS, a commercial statistical software program, was used to perform multivariate statistical analysis, such as PCA, to determine potential sources of contamination affecting Leeuwfonteinspruit. PCA reduced the dataset’s dimensionality, revealed patterns among water quality parameters, and identified underlying factors representing the possible pollution sources (Akiner et al., 2024; Piroozfar et al., 2021). Additionally, correlation analysis was used to determine the level of association between the key water quality parameters (Han et al., 2023).
3. Results and Discussion
3.1. Water Chemistry
The annual average water quality results from 2018 to 2023 for the selected parameters are presented in Table 3. The annual average water quality results were assessed against the applicable SAWQG as developed by DWAF. This section focuses on parameters that either exceed the TWQR limits on more than two occasions during the monitoring period or are recognised in the literature as key indicators of coal mining impacts on surface water quality.
The concentrations of TDS ranged from 182.50 mg/l to a peak of 690.50 mg/l. The upstream sites (Sites 1-4) generally indicated lower TDS levels compared to the downstream site (Site 5), which consistently recorded high concentrations throughout the study period. Notably, TDS at Site 5 increased from 249 mg/l in 2018 to 690.50 mg/l in 2023, indicating a progressive accumulation of dissolved solids, attributable to the cumulative influence of mining activities. The TDS levels at most sites complied with the DWAF’s TWQR for domestic use, which is set at 450 mg/l (DWAF, 1996a). However, exceedances of this limit were recorded during specific years, Site 2 (2018 and 2020), Site 3 (2021), Site 4 (2023) and Site 5 (2020, 2021, 2022, and 2023). Although the TDS levels remained within the limit for livestock watering set at 1000 mg/l (DWAF, 1996c), TDS levels consistently exceeded the TWQR limit for irrigation purposes set at 40 mg/l (DWAF, 1996b), throughout the study period, indicating unsuitability for irrigation purposes without prior treatment.
Electrical Conductivity (EC), which reflects TDS and overall water salinity, varied from 24.55 mS/m to a peak of 95.21 mS/m. The EC trends closely mirrored the TDS trends, with a significant increase observed at Site 4 (from 28.18 mS/m in 2018 to 95.21 mS/m in 2023). The increasing EC levels indicate a gradual accumulation of dissolved ions over time, potentially linked to ongoing mining activities in the catchment (Atangana and Dzhangi, 2023). The EC concentrations exceeded DWAF’s (1996a) TWQR for domestic use (70 mS/m) at various sites and years, notably at Site 2 and Site 3 in 2018; Site 2, Site 3, and Site 5 in 2021; Site 4 and Site 5 in 2023. For irrigation purposes, with a limit of 40 mS/m (DWAF, 1996b), EC values were consistently above the limit across most sites, except at Site 4 between 2018 and 2021, and Site 1 in 2022. Despite these exceedances, all EC concentrations remained within the limit for livestock watering (150 mS/m) throughout the monitoring period (DWAF, 1996c).
The pH values remained relatively stable across all the monitoring sites and generally reflected neutral water conditions. Measurements ranged from 6.76 to 8.31 and were consistently within the DWAF TWQR for both domestic use and irrigation (DWAF, 1996a; DWAF, 1996b). Site 4 recorded the lowest pH values, suggesting a greater susceptibility to acidification. Despite elevated SO4 concentrations, Site 5 maintained neutral pH levels (7.27 – 7.88), likely due to natural buffering mechanisms. These results align with studies showing that alkaline minerals can buffer acidity and maintain neutral pH (Ray and Dey, 2020; Lebepe et al., 2019; Arkoç et al., 2016).
The SO4 concentrations ranged from 23.89 mg/l to a peak of 366 mg/l. Upstream sites indicated lower SO4 concentrations and were all within the TWQR for domestic use with a limit of 200 mg/l (DWAF, 1996a). However, exceedances at the downstream site (Site 5) were recorded in 2020, 2021, and 2023, indicating potential influence from AMD. Despite these exceedances, all values complied with the TWQR for livestock watering with a limit of 1000 mg/l (DWAF, 1996c).
On the other hand, Ca concentrations ranged from 16.6 to 77.78 mg/l, with frequent exceedances of the DWAF TWQR for domestic use with a limit of 32 mg/l (DWAF, 1996a). Elevated Ca levels were notable at Sites 2, 3, and 5, while Site 1 consistently recorded lower, compliant values. Site 5 indicated an increasing trend over the monitoring period, from 28.91 mg/l to 77.78 mg/l in 2023. Despite the exceedances for domestic use, all sites remained well within the TWQR for livestock watering with a limit of 1000 mg/l (DWAF, 1996c).
With Mg, the levels ranged from 6.73 mg/l to 39.00 mg/l, with several sites exceeding the TWQR for domestic use with a limit of 30 mg/l (DWAF, 1996a), including Site 2 (2020), Site 3 (2021), and Site 5 (2021 and 2023). However, all sites remained compliant with the TWQR for livestock watering, which has a limit of 500 mg/l (DWAF, 1996c).
While Na levels were generally within the domestic use limit of 100 mg/l (DWAF, 1996a) at all the sites throughout the monitoring period. However, exceedances of DWAF (1996b) TWQR for irrigation with a limit of 70 mg/l were noted at Site 2 in 2018 and 2020, Site 3 in 2018, and Site 5 in both 2021 and 2023. Despite these occasional exceedances, all sites remained within the acceptable TWQR for livestock watering with a limit of 2000 mg/l (DWAF, 1996c).
For metals such as Fe, Al and Mn, variations in the concentrations were also observed at the different sites. The levels of Fe consistently exceeded the DWAF (1996a) TWQR for domestic use (0.1 mg/l) across all sites and years, except for Site 5 in 2018 and 2021. The highest Fe concentrations were recorded at Site 4 in 2019 (4.93 mg/l) and 2021 (4.53 mg/l). However, all sites remained within acceptable limits for irrigation (5 mg/l) and livestock watering (10 mg/l) throughout the entire study period (DWAF, 1996b; DWAF, 1996c).
The concentrations of Mn indicated significant variability across monitoring sites, with the highest levels recorded at Site 3 in 2018 (2.52 mg/l) and Site 2 in 2020 (2.95 mg/l). Most sites consistently exceeded both the DWAF TWQR for domestic use (0.05 mg/l) and the irrigation limit of 0.02 mg/l (DWAF, 1996a; DWAF, 1996b). Notable exceptions to irrigation exceedances included Site 1 in 2018, 2020, 2021, and 2022, as well as Site 5 in 2018. Mn levels regularly exceeded the aquatic ecosystem guideline of 0.18 mg/l (DWAF, 1996d), with Site 3 consistently above the limit throughout the monitoring period and Site 4 exceeding the limit in all the years except for 2018. Despite these exceedances, all sites remained well within the TWQR for livestock watering with a limit of 10 mg/l (DWAF, 1996c).
The Al concentrations consistently exceeded the DWAF TWQRs for domestic use (0.15 mg/l) and aquatic ecosystem (0.05 mg/l) across all monitoring sites and years (DWAF, 1996a; DWAF, 1996d). However, all sites remained within the acceptable limits for both irrigation and livestock watering (5 mg/l) throughout the entire period (DWAF, 1996b; DWAF, 1996c).
3.2. Water Quality Indices
Weighted arithmetic water quality index
The WA-WQI was computed to evaluate the overall water quality status in the Leeuwfonteinspruit across five sites. The distribution of WQI values is presented in Figure 3 and Table 4. Across the 72 sampling events, WQI values ranged from 12.45% to >100%, reflecting substantial temporal and spatial variability. The interquartile ranges varied across sites as follows: Site 1 (33 – 92), Site 2 (43 – >100), Site 3 (47 – >100), Site 4 (49 – >100), and Site 5 (46 – >100). These ranges indicate that most sites fluctuated between good to poor water quality classes, with episodic exceedances into severely degraded water quality (>100%).
In terms of water quality classifications, Sites 1 and 2 recorded the highest frequency of excellent water quality, with six and seven samples, respectively, followed by Site 5 with five instances. In contrast, Sites 3 and 4 each recorded only two excellent water quality events. For the good water quality category, Site 1 stood out with 27 samples, indicating relatively stable and favourable conditions, possibly due to its upstream position and limited exposure to intensive pollution sources. In contrast, the downstream site (Site 5), recorded a combined total of 33 samples in the poor and very-poor categories, reflecting the cumulative impact of upstream pollution exacerbated by runoff or direct discharges from mining activities.
The most critical concern arises from the unsuitable for use category. Site 3 recorded the highest frequency of such events, despite being upstream, suggesting the presence of persistent pollution sources from the upper catchment. Similarly, Sites 2 and 4 also exhibited notable occurrences of unsuitable water quality, indicating that upstream areas of the catchment are also vulnerable to significant water degradation. Overall, Site 1 emerged as the least impacted, showing the most consistent good to excellent water quality. In contrast, Site 3 appeared the most vulnerable, reflecting persistent upstream pollution, while Site 5 presented a mixed water quality profile, characterised by both episodic improvements and cumulative degradation.
CCME-WQI assessment
The CCME-WQI was calculated to evaluate the annual surface water quality at five sites within the Leeuwfonteinspruit catchment. The annual CCME-WQI and corresponding ranking for each sampling site are presented in Table 5.
In 2018, water quality for Sites 4 and 5 was classified as good and Site 1 as fair. However, Sites 2 and 3 exhibited early signs of water quality degradation, with marginal to poor rankings. These early poor water qualities reflect the impacts of upstream anthropogenic activities, including mining and agricultural activities. Between 2019 and 2021, water quality degraded at all sites, with marginal and poor classifications becoming dominant. Notably, Site 3 ranked poor in both 2019 and 2021, while Site 2 never exceeded marginal quality within that period, indicating an ongoing degradation.
A temporary improvement was observed in 2022, when Site 1 improved to good (WQI = 87.07) and Site 2 to fair (WQI = 68.2). This short-term improvement in water quality may have been influenced by improved management practices, favourable climatic conditions (e.g., dilution during high rainfall events), or seasonal hydrological variability. However, these improvements were not sustained, as most sites reverted to marginal in 2023, and Site 4 indicated a sharp decline to poor (WQI = 35.55).
Site 5 reflected the cumulative impact of upstream disturbances, especially from mining activities. Initially classified as good in 2018 (WQI = 82.69), indicating a relatively healthy catchment prior to intensified mining activities. However, subsequent years indicate consistently marginal water quality, with WQI ranging between 46.96 (2019) and 59.63 (2023). This degradation trend, especially after 2019, correlates with increased surface disturbances, runoff, and potential discharge events.
3.3. Water Quality Suitability for Irrigation
Sodium (Na) is a key parameter in assessing the irrigation water quality. Elevated Na levels can displace Ca and Mg, leading to soil structural deterioration, reduced permeability, and impede water and air movement, ultimately reducing crop productivity. Furthermore, interactions with carbonate and chloride can result in the development of alkaline or saline soils (Rawat et al., 2018; Ayers and Wescot, 1985).
Sodium adsorption ratio
The SAR is used to determine the risk of Na accumulation in soils, which can displace Ca, Mg and K, thereby reducing water movement and prolonging percolation time (Rawat et al., 2018).
Figure 4 presents the boxplot of SAR across the sites. Across all five sites in the Leeuwfonteinspruit, the SAR values consistently remained below 10 meq/L, indicating that Na is not dominant relative to Ca and Mg, and the risk of sodicity-related soil degradation is currently minimal.
Site specific differences were also observed. Sites 1 and 2 recorded median SAR values of about 1.5 meq/L but showed occasional peaks approaching 3.6 meq/l. Site 3 exhibited the highest variability, with values exceeding 4.0 meq/L during certain periods, pointing to localised Na enrichment and increased susceptibility to sodicity, which can negatively affect the soil structure and plant growth. In contrast, Site 4 consistently recorded the lowest values (median 1.0 meq/L), reflecting possible natural dilution. Downstream at Site 5, SAR values were intermediate (median of 1.5 meq/L, maximum 2.6 meq/L), indicating partial attenuation and recovery of Na impacts.
Exchangeable sodium percentage
The ESP values across the five sites of the Leeuwfonteinspruit demonstrate both spatial and temporal variability over the monitoring period, with values ranging as low as 13% at Site 4 to as high as 66% at Site 3, as illustrated in the boxplot (Figure 5). Based on the classification of Rawat et al. (2018), irrigation water within the catchment generally fluctuates between the excellent (<20%), good (20 – 40%), permissible (40 – 60%), and occasionally doubtful (60 – 80%) categories.
At Site 1, ESP values varied considerably (17 – 56%), with a median of 40% placing it on the threshold between the good and permissible categories. Recurrent peaks above 50% highlight periodic sodicity hazards. Site 2 displayed narrow range (23 – 47%), mostly within the good category. The overall irrigation suitability at Site 2 appeared to be stable compared to the other sites. Site 3 exhibited the highest variability (22 – 66%), with a median of 40% placing it at the threshold between good and permissible categories. In contrast, Site 4 recorded the lowest ESP values (13 – 48%), with a median of 25% (good category). Downstream, Site 5 showed intermediate values (19 – 45%) with a median of 33%, generally within the good category, although occasional exceedances into the permissible category were observed.
Overall, the ESP analysis indicates that irrigation water from the Leeuwfonteinspruit is broadly suitable, predominantly falling within the good to permissible categories. However, the localised peaks, particularly at Sites 1 and 3, indicate the potential for sodicity risks, which can negatively affect soil structure and plant growth. These risks are likely influenced by both natural hydrological variability and anthropogenic activities, including coal mining.
3.4. Spatial and Temporal Trends
Temporal trends analysis
Temporal trends for the WA-WQI, SAR, and ESP were analysed across the five sampling sites to assess the changes over the monitoring period. The analysis allows for the identification of periods of deterioration or improvement in water quality, highlighting both episodic events and sustained trends influenced by anthropogenic and natural factors. The temporal trend results are presented in Figure 6.
The temporal trends for the WA-WQI across the sites are indicated in Figure 6(a). The WQI time-series shows that deterioration peaked during 2019-2022, with frequent and extreme episodic spikes across Sites 3, 4, and 5. Although Sites 1 and 2 generally recorded lower WQI values, both experienced occasional contamination events. Conditions appeared to stabilise in 2023; however, the recurrence of extreme events underscores the catchment’s continued susceptibility to anthropogenic pressures.
Figure 6(b) presents the SAR temporal trends across all sites. The SAR values for most sites were stable; however, a gradual increase has been evident at several sites after 2020, suggesting cumulative effects of land use and coal mining activities. The SAR patterns indicate that the natural buffering processes within the catchment currently mitigate Na-related impacts. However, localised anthropogenic activities appear to drive variability across the sites. Although present values remain within safe irrigation limits, episodic peaks highlight the potential for future sodicity risks should Na enrichment become more frequent or sustained.
The temporal trend analysis for ESP across all the sampling sites are presented in Figure 6(c). Site 1 fluctuated widely with repeated short-term increases followed by decreases, indicating strong temporal variability. Episodic peaks above 50% occurred intermittently, suggesting periods of elevated sodicity influence. Site 2 was mostly stable across the monitoring period; however, peaks occurred during 2018 – 2019 and 2021 – 2022. Site 3 exhibited the highest temporal variability, characterised by sharp increases such as in September 2018 and October 2022, reflecting sporadic Na enrichment likely associated with upstream activities. At Site 4, ESP values remained relatively low and stable over time, although a slight increase was observed during 2022 – 2023, indicating seasonal or short-term influences. Temporal fluctuations at Site 5 were moderate, with occasional fluctuations.
Gibbs diagrams
The Gibbs diagrams were utilised to assess the dominant processes influencing the water chemistry at each monitoring point, helping to distinguish between the natural geochemical variations and potential impacts from coal mining activities. The Gibbs diagrams for the five sampling sites are presented in Figure 7.
At Site 1 (upstream), the water chemistry is primarily governed by rock-water interactions, indicative of carbonate and silicate mineral weathering, with some contribution from the local geology. Despite evidence of pollution at this site, the geochemical signature suggests that natural geological substrates have a greater influence on the quality of water than the mining activities. The clustering of data points within the rock dominance and freshening zones further indicates that dilution from precipitation and surface water recharge plays a significant role in moderating salinity levels.
Site 2 is characterised by elevated TDS and high Na and Cl ratios, pointing to evaporative concentration processes, possible saline seepage, and anthropogenic inputs. The shift of data points toward the evaporation-crystallisation dominance zone suggests increasing susceptibility to salination and progressive deterioration of water quality.
At Site 3, the analysis reflects significant pollution stress, primarily driven by saline concentration processes linked to coal mine leachates and other upstream anthropogenic activities. The noticeable shift of several samples toward the evaporation-crystallisation dominance zone, especially in the anion plot, indicates elevated Cl ratios associated with evaporative enrichment. Collectively, these conditions highlight a highly vulnerable system with reduced buffering capacity and progressive deterioration in water quality.
Site 4 indicates that water chemistry is influenced by a combination of rock-weathering and evaporation-crystallisation processes. While most samples fall within the rock dominance field (anion plot), several shift toward the freshening and evaporation zones, pointing to a moderate salinity build-up likely linked to anthropogenic inputs. This suggests that Site 4 represents a transitional zone, where natural geogenic processes and human activities converge, contributing to the observed changes in water quality.
At Site 5, water quality is significantly impacted by increased salinity, driven by evaporation and mining effluents, as reflected by high TDS, Na, and Cl levels. Its downstream position results in the accumulation of upstream inputs, and the data clustering within the evaporation crystallisation dominance field confirms that mining activities are a major contributor to the water quality degradation at this site.
Sequential Mann-Kendall (SMK)
The SMK test was applied to evaluate temporal trends in WQI, SAR, and ESP across five sampling sites, with ±2 serving as the confidence limit, which enables identification of the significance of the trend. Values greater than +2 indicate a statistically significant increasing trend, while values less than -2 indicate a significant decreasing trend. The SMK results are presented in Figure 8.
For WQI (Figure 8 (a)), site 1 indicated a temporary increase from 2018 to early 2019, followed by stabilisation and fluctuations, suggesting limited anthropogenic influence upstream. Site 2 consistently exceeded the confidence limit between 2019 and mid-2021, before stabilising between 2022 and 2023. Site 3 fluctuated throughout the monitoring period without a clear monotonic trend. Site 4 displayed a pronounced increasing trend from May 2021, indicating progressive water quality deterioration. Site 5, downstream, exhibited an increasing trend from 2019 to 2020, indicating cumulative impacts from upstream activities, before stabilising around the baseline after 2021.
For SAR (Figure 8(b)), the upstream Sites (1-3) largely remained within the confidence limits. All three Sites showed early increases during 2018, followed by declines until March 2020. Site 1 subsequently fluctuated without a significant monotonic trend, while Site 2 indicated temporary variability during 2021 – 2022 but showed a consistent decreasing trend from 2022 to December 2023, suggesting reduced sodicity risks, possibly due to dilution or reduced saline inflows. Site 3 followed a similar pattern, with short-term declines but overall stability, indicating minimal long-term change. In contrast, Site 4 indicated a statistically significant increasing trend beginning in 2020 and continuing steeply until December 2023, representing the strongest SAR increase across all sites and highlighting Na enrichment linked to anthropogenic activities. Site 5 was initially stable from 2018 to 2019, but from 2020 onwards showed a sustained increasing trend, crossing the confidence limit in September 2020 and remaining elevated until December 2022. Despite temporary stabilisation in early 2023, SAR levels resumed an upward trend towards the end of the year, reflecting cumulative impacts of upstream activities and progressive downstream water quality deterioration.
For ESP (Figure 8(c)), upstream Sites (1-3) exhibited short-term variability, including temporary increases in 2018 followed by decreases in 2019 and 2020, and subsequent oscillations around the baseline, indicating no significant monotonic trend. Site 2, however, displayed a gradual negative trend by 2023, indicating a progressive reduction in sodicity, likely linked to dilution. In contrast, Site 4 exhibited a strong and sustained positive trend, with sharp intensification after 2020, reflecting substantial Na enrichment. Site 5 indicated the mining-driven increases between 2018 and 2020 period but shifted into a decreasing trend from 2021, reflecting complex cumulative effects of upstream contributions, dilution, and temporal variability.
Overall, the SMK analysis indicates that water quality trends in the Leeuwfonteinspruit are influenced by both natural buffering and anthropogenic pressures. While Sites 1 – 3 generally exhibited short-term fluctuations without consistent monotonic trends, localised deterioration was evident at times. In contrast, Site 4 consistently displayed the strongest and most consistent increasing trends across WQI, SAR, and ESP after 2020, indicating its susceptibility to localised anthropogenic stressors. Downstream at Site 5, cumulative effects of upstream inputs initially drove deterioration between 2018 and 2020, but subsequent stabilisation and partial improvement after 2021 suggest complex interactions between dilution, hydrological variability, and pollutant loading. Collectively, these results show that while natural processes provide some resilience in the upper catchment, both upstream and downstream sites are vulnerable, with Site 4 emerging as the most vulnerable locality.
3.5. Principal Component Analysis
The PCA results revealed the strong data suitability for dimensionality reduction across all sites, as indicated by Kaiser-Meyer-Olkin values with a score of 0.69 at Site 1, 0.83 at Site 2, 0.77 at Site 3, 0.70 at Site 4, and 0.77 at Site 5. This confirms that the correlation patterns among water quality variables were sufficient to extract the meaningful principal components. The rotated component matrix further demonstrates that certain parameters group together strongly at each sampling site, suggesting common pollution sources influencing the water quality.
Across the five monitoring sites, the PCA revealed that the majority of water quality variability is explained by a limited number of components with eigenvalues greater than 1 (Table 6). Site 1 extracted six components accounting for 81.2% of variance, Site 2 extracted four components explaining 80.8%, Site 3 extracted six components explaining 82.3%, Site 4 extracted six components explaining 83.8%, and Site 5 extracted five components explaining 83.2%. Table 7 presents the rotated component matrix of squared variable loadings for all the sampling sites, rotated with Varimax and Kaiser Normalisation.
The PCA results across the five sampling sites revealed patterns indicating that salinity and mineralisation processes are the dominant factors influencing water quality within the Leeuwfonteinspruit. Parameters such as TDS, EC, SO4, Na, Mg, Ca, and hardness were persistently associated with the first principal component at all sites, highlighting the pervasive influence of ionic enrichment and dissolved solids derived from coal mining activities and related hydrogeochemical processes. Upstream sites (Sites 1 and 2) reflected relatively stronger natural geochemical signatures, with secondary contributions from agricultural inputs, soil erosion, and diffuse nutrient enrichment, whereas Sites 3 – 5 exhibited clearer evidence of mining-related impacts, including elevated metals (such as Mn, Fe and Al) and AMD influences. The appearance of nutrient-related parameters (N and PO4) and SS in higher-order components across multiple sites further indicates episodic agricultural runoff, domestic effluent discharge, and sediment mobilisation. Collectively, the PCA results demonstrate a progressive downstream intensification of anthropogenic influences, where mining, agriculture, and natural processes interact synergistically to shape the spatial variation of surface water quality within Leeuwfonteinspruit.
3.6. Correlation Analysis
The correlation analysis for the selected physicochemical parameters was conducted to determine the relationships and differences between the parameters (Figure 9). The results indicated strong positive relationship (r > 0.9) among several key physicochemical parameters. The strongest correlation was observed between TDS and EC (r = 0.98), which was expected as TDS directly influences the EC by increasing the concentration of ions in solution (Basharat et al., 2025). Similarly, TDS exhibited strong positive correlations with Mg (r = 0.96) and Ca (r = 0.96), indicating that these divalent cations are major contributors to the dissolved solids in the system. Both Mg and Ca also correlated strongly with EC (r = 0.97 and r = 0.93, respectively), further confirming their influence on water conductivity. Na followed the same pattern, with high correlation with EC (r = 0.95). The strong association between Mg and Ca (r = 0.92) suggests a shared source, likely linked to carbonate and silicate weathering.
In contrast, notable negative correlations (r < -0.4) were observed between pH and certain metals, particularly Fe and Al. The inverse relationship between Fe and pH (r = -0.50) suggests that Fe concentrations tend to be higher in more acidic conditions, due to increased solubility (Khomo et al., 2023). A similar pattern was evident for Al, which also indicated a strong negative correlation with pH (r = -0.56). These relationships are consistent with known geochemical behaviour of these metals under low pH conditions, such as those found in AMD areas. Additionally, weaker negative correlations were observed between TDS and Al (r = -0.37) and between Mg and Al (r = -0.47), implying that Al may originate from different geochemical processes than those contributing to general salinity and water hardness.
Iron (Fe) exhibited weak or negative correlations with most parameters, indicating that its mobility is primarily controlled by pH and redox conditions rather than ionic load. Additionally, Mn showed weak to moderate positive correlations with TDS and EC, although its behaviour was less consistent, suggesting localised redox variability. The SO4 exhibited a moderate correlation with TDS (r = 0.76) and weaker correlations with Ca and Mg, indicating that while it contributes to the dissolved solids, its role is secondary compared to the dominant influence of major cations.
4. Conclusions and Recommendations
This study presents a comprehensive assessment of the effects of opencast coal mining on the water quality of the Leeuwfonteinspruit, a tributary of the Olifants River, between 2018 and 2023. By analysing multi-year physicochemical water quality data, the study determined the current water quality status, evaluated spatial and temporal trends, identified key contaminants of concern, and investigated their potential sources and pathways.
The current water quality status of Leeuwfonteinspruit was successfully evaluated through comparison with the SAWQGs, WQIs, and irrigation suitability assessments. Results revealed consistent deterioration at the downstream site (Site 5), with elevated TDS, EC, SO4, Ca, Mg, Mn, Fe, and Al, indicating cumulative mining impacts and potential AMD contributions despite the neutral pH. While most parameters met the TWQRs for livestock, there were frequent exceedances of domestic, aquatic life and irrigation, highlighting risks to human health, aquatic ecosystems, and agriculture. The WQI assessments placed Site 5 in marginal to poor categories, compared to moderate to good conditions at upstream sites (Sites 1 and 2). Irrigation assessments (SAR and ESP) confirmed overall suitability, though localised Na enrichment at Sites 1 and 3 suggested long-term sodicity risks.
The spatial analysis revealed a distinct gradient of deterioration along the Leeuwfonteinspruit. Upstream sites (particularly Site 1 and Site 2) reflected mostly natural geogenic controls, while Site 3 and 4 exhibited degradations in water quality despite being upstream of the current study area, indicating additional catchment pressures such as agriculture and other coal mining operations. The most pronounced impacts occurred at downstream site (Site 5), where salinity, SO4, and metals exceeded SAWQGs. Gibbs plots confirmed the transition from geogenic dominance upstream to anthropogenic influence downstream.
Temporally water quality declined significantly after 2019, with peak deterioration between 2019 and 2022 coinciding with the intensified mining operations during that period. Similarly, WA-WQI and CCME-WQI confirm the episodic contamination during that period. Although partial recovery occurred in 2022 – 2023, improvements were unstable and influenced by hydrological variability. The SMK tests indicated stable conditions at upstream sites (Sites 1 – 3), while Sites 4 and 5 revealed sustained long-term deterioration. The SMK plots for Site 4 indicated strong and most persistent increases in WQI, SAR, and ESP after 2020, pointing to localised significant anthropogenic stress. Downstream at Site 5, water quality initially deteriorated due to cumulative upstream impacts but later showed partial stabilisation after 2021. Likely linked to dilution, hydrological variability, and pollutant loading.
The PCA revealed that the primary components were strongly associated with EC, TDS, SO4, Na, Ca, and Mg, indicating that salinity and mineralisation from mining-related activities are the dominant drivers of water quality variability. Secondary components loaded heavily with Fe, Mn, and Al, highlighting localised AMD influences, while minor components associated with nutrients reflected diffuse agricultural inputs. These findings align with the correlation analysis, which demonstrated that major ions (Ca, Mg, and Na) primarily drive TDS and EC, whereas Fe and Al correlate inversely with pH, reflecting AMD-related solubility processes. Mining emerged as the principal contamination source, particularly through AMD and effluent discharges; however, upstream degradation at Sites 3 and 4 indicated additional contributions from agricultural runoff and other catchment activities. Pollution pathways include direct discharges, seepage, and cumulative land-use impacts, emphasising the complex interplay of anthropogenic and natural drivers on water quality.
Recommendations and mitigation strategies
The following recommendations are proposed to mitigate the impacts of coal mining on the Leeuwfonteinspruit and protect downstream water users:
- Targeted management of key contaminants: Priority intervention should focus on the dominant contaminants identified in the study, including salinity related parameters (TDS, EC, SO4, Ca and Mg) and trace metals (Fe, Mn, and Al) associated with AMD processes. Appropriate treatment and mitigation measures should aim to limit metal mobilisation and reduce salinity enrichment in the Leeuwfonteinspruit.
- Control of sources and pathways of contamination: Pollution prevention measures must address the confirmed sources and pathways, including mine effluent discharges, seepage from discard dumps and pollution control dams, surface runoff from disturbed mining areas, and AMD generation. This includes the improved lining of the pollution control dams, seepage interception system, controlled discharge protocols, and rehabilitation of contaminated flow paths.
- Stormwater and mine water management: Clean and dirty water systems must be strictly separated. Clean stormwater should be diverted away from disturbed areas (such as active mining zones, coal stockpiles, carbonaceous material storage areas, discard dumps, haul roads, wash bays, workshops, and loading/ offloading zones), while contaminated water should be contained in lined pollution control dams for treatment, reuse, or compliant discharges. This is critical during high-risk temporal periods, particularly wet seasons and high-runoff events.
- Temporal risk management and adaptive monitoring: Monitoring and management strategies should explicitly account for periods of elevated risk, particularly during intensified mining phases and hydrologically sensitive periods. Adaptive monitoring programmes should be implemented to increase sampling frequency during high-risk periods to allow early detection and rapid management response to episodic contamination events.
- Protection of vulnerable downstream users: Management interventions must prioritise downstream user vulnerabilities, including domestic water users, agricultural users (irrigation and livestock), and aquatic ecosystems. This includes improving water treatment for community use, and ensuring ecological flow and quality requirements are maintained to protect aquatic biodiversity.
- Regulatory enforcement: Relevant authorities (DWS) should strengthen regulatory enforcement measures to ensure that the coal mining operations are held accountable for the degradation of water resources. This includes conducting regular inspections, ensuring compliance with water use licenses and environmental management plans, and imposing penalties or remediation requirements on mines found to be contributing to water pollution.
- Progressive rehabilitation: Active and disturbed mining areas should undergo concurrent rehabilitation to restore ecosystem functions, reduce long-term pollution risks, limit contaminant mobilisation and ensure post-mining land use sustainability.
- Integrated catchment management: An integrated catchment management approach should be implemented to effectively address cumulative impacts from mining, agriculture, domestic activities, and other land uses.
Author Contributions
Conceptualization, C.M.; methodology, C.M.; software, C.M.; validation, C.M., G.B. and P.O.; formal analysis, C.M.; investigation, C.M.; data curation, C.M.; writing—original draft preparation, C.M.; writing—review and editing, C.M., G.B. and P.O.; supervision, G.B. and P.O.; project administration, C.M., G.B. and P.O.; funding acquisition, C.M. All authors have read and agreed to the published version of the manuscript.
Funding
This research was funded by the Centre for Graduate Support, University of the Free State and Geovicon Environmental (Pty) Limited.
Data Availability Statement
The data presented in this study are available on request from the corresponding author, subject to reasonable request and applicable confidentiality restrictions.
Acknowledgments
I wish to express my deepest gratitude to my supervisors, Gladys Belle and Paul Oberholster, for their continuous mentorship, encouragement, invaluable guidance and constructive feedback throughout this study. Their expertise and support greatly contributed to the successful completion of this research. My sincere appreciation also goes to the University of the Free State, particularly the Centre for Environmental Management, for providing me with the opportunity and platform to further my studies. I am also grateful to Geovicon Environmental (Pty) Limited, its management, and my colleagues for their support, for allowing me access to data, for their advice and discussions, and for affording me flexibility to balance my professional responsibilities with my studies. Finally, I am appreciative of my whole family for their constant love, motivation, encouragement and unwavering support throughout this journey. To my parents, thank you for instilling in me the belief that education is the key to opening many doors. Your faith in me have been an enduring source of motivation.
Conflicts of Interest
The authors declare no conflicts of interest. The funders had no role in the design of the study; in the collection, analyses, or interpretation of data; in the writing of the manuscript; or in the decision to publish the results.
Abbreviations
The following abbreviations are used in this manuscript:
| Al | Aluminium |
| AMD | Acid Mine Drainage |
| AWARD | Association for Water and Rural Development |
| Ca | Calcium |
| CCME-WQI | Canadian Council of Ministers of the Environment Water Quality Index |
| Cl | Chloride |
| DWAF | Department of Water Affairs and Forestry |
| DWS | Department of Water and Sanitation |
| EC | Electrical Conductivity |
| ESP | Exchangeable Sodium Percentage |
| F | Fluoride |
| Fe | Iron |
| K | Potassium |
| Mg | Magnesium |
| Mn | Manganese |
| N | Nitrate and nitrite |
| PCA | Principal Component Analysis |
| PO4 | Phosphate |
| SAR | Sodium Adsorption Ratio |
| SAWQG | South African Water Quality Guidelines |
| SMK | Sequential Mann-Kendall |
| SO4 | Sulphate |
| TDS | Total Dissolved Solids |
| TWQR | Target Water Quality Range |
| WA-WQI | Weighted Arithmetic Water Quality Index |
| WQI | Water Quality Index |
References
- Acharya, B.S.; Kharel, G. Acid mine drainage from coal mining in the United States–An overview. Journal of Hydrology 2020, 588, 1–14. [Google Scholar] [CrossRef]
- Akiner, M.E.; Chauhan, P.; Singh, S.K. Evaluation of Surface Water Quality in the Betwa River Basin through the Water Quality Index Model and Multivariate Statistical Techniques. Environmental Science and Pollution Research 2024, 1–16. [Google Scholar] [CrossRef] [PubMed]
- Arkoç, O.; Ucar, S.; Ozcan, C. Assessment of impact of coal mining on ground and surface waters in Tozaklı coal field, Kırklareli, northeast of Thrace, Turkey. Environmental Earth Sciences 2016, 75, 1–13. [Google Scholar] [CrossRef]
- Association for Water and Rural Development (AWARD). The role of the Wilge River in maintaining ecosystem integrity and associated benefits in the upper Olifants Catchment. Association for Water and Rural Development 2017, 1–39. Available online: https://cer.org.za/wp-content/uploads/2017/09/Annexure-G-Role-of-the-Wilge-AWARD-Sep-2017.pdf.
- Atangana, E.; Dzhangi, T.R. Evaluation of the impact of coal mining on surface water in the Boesmanspruit, Mpumalanga, South Africa; 2023; pp. 1–21. [Google Scholar] [CrossRef]
- Atangana, E.; Oberholster, P.J. Using heavy metal pollution indices to assess water quality of surface and groundwater on catchment levels in South Africa. Journal of African Earth Sciences 2021, 182, 1–12. [Google Scholar] [CrossRef]
- Atangana, E. An indices-based water quality model to evaluate surface water quality: A case study in Vaalwaterspruit, Mpumalanga, South Africa. Journal of African Earth Sciences 2023, 205, 1–15. [Google Scholar] [CrossRef]
- Ayers, R.S.; Westcot, D.W. Water quality for agriculture; Food and agriculture organization of the United Nations: Rome, 1985; pp. 1–174. [Google Scholar]
- Basharat, U.; Zhang, W.; Abbasi, A.; Mahroof, S.; Han, C.; Khan, S.H.; Li, S. Integrated assessment of groundwater hydrogeochemistry and quality using multivariate statistical analysis, self-organizing maps, and water quality indices in District Bagh, AJK, Pakistan. Ecotoxicology and Environmental Safety 2025, 301, 1–24. [Google Scholar] [CrossRef]
- Bulmer, E.; Pela, K.; Eberhard-Ruiz, A.; Montoya, J. Global perspective on coal jobs and managing labor transition out of coal. World Bank, Washington, DC. Lic.: Creative Commons Attribution CC BY 3: 21. 2021. Available online: https://documents1.worldbank.org/curated/en/099415103242235561/pdf/P1711940ae202d0cc09c1301e5b09e6e876.pdf.
- da Silva Bonifácio, A.; de Lima Brum, R.; Tavella, R.A.; Ramires, P.F.; Lessa, I.M.; Dos Santos, M.; da Silva Júnior, F.M.R. Human health risk assessment of metals and anions in surface water from a mineral coal region in Brazil. Environmental Monitoring and Assessment 2021, 193, 567. [Google Scholar] [CrossRef]
- Dabrowski, J.M.; Dabrowski, J.; Hill, L.; Macmillan, P.; Oberholster, P.J. Fate, transport and effects of pollutants originating from acid mine drainage in the Olifants River, South Africa. River Research and Applications 2014, 31, 1354–1364. [Google Scholar] [CrossRef]
- Dontala, S.P.; Reddy, T.B.; Vadde, R. Environmental aspects and impacts its mitigation measures of corporate coal mining. Procedia Earth and Planetary Science 2015, 11, 2–7. [Google Scholar] [CrossRef]
- DWAF (Department of Water Affairs and Forestry). South African Water Quality Guidelines. Volume 1: Domestic use. 2nd edition. Pretoria. 1996a. Available online: https://www.dws.gov.za/iwqs/wq_guide/Pol_saWQguideFRESHDomesticusevol1.PDF.
- DWAF (Department of Water Affairs and Forestry). South African Water Quality Guidelines. Volume 4: Agricultural use: Irrigation. 2nd edition. Pretoria. 1996b. Available online: https://www.dws.gov.za/iwqs/wq_guide/Pol_saWQguideFRESHIrrigationvol4.pdf.
- DWAF (Department of Water Affairs and Forestry). South African Water Quality Guidelines. Volume 5: Agricultural use: Livestock watering. 2nd edition. Pretoria. 1996c. Available online: https://www.dws.gov.za/iwqs/wq_guide/edited/Pol_saWQguideFRESH_vol5_Livestockwatering.pdf.
- DWAF (Department of Water Affairs and Forestry). South African Water Quality Guidelines. Volume 7: Aquatic ecosystems. 2nd edition. Pretoria, 1996d. Available online: https://www.dws.gov.za/iwqs/wq_guide/edited/Pol_saWQguideFRESH_vol7_Aquaticecosystems.pdf.
- Ekwule, O.R.; Akpen, G.D.; Ugbede, G.M. The effect of coal mining on the water quality of water sources in Nigeria. Bartın University International Journal of Natural and Applied Sciences 2019, 2, 251–260. Available online: https://www.researchgate.net/publication/344391020.
- El Bilali, A.; Taleb, A. Prediction of irrigation water quality parameters using machine learning models in a semi-arid environment. Journal of the Saudi Society of Agricultural Sciences 2020, 19, 439–451. [Google Scholar] [CrossRef]
- Esterhuyse, S.; Buschke, F. Coal and Water: Exploiting One Precious Natural Resource at the Expense of Another? Coal and Energy in South Africa 2022, 88–90. Available online: https://www.jstor.org/stable/10.3366/jj.7358700.15.
- Finkelman, R.B.; Wolfe, A.; Hendryx, M.S. The future environmental and health impacts of coal. Energy Geoscience 2021, 2, 99–112. [Google Scholar] [CrossRef]
- Gibbs, R.J. Mechanisms controlling world water chemistry. Science 1970, 170, 1088–1090. [Google Scholar] [CrossRef]
- Han, X.; Tang, F.; Liu, A.L. Drinking water quality evaluation in supply systems in Wuhan, China: application of entropy weight water quality index and multivariate statistical analysis. Environmental Science and Pollution Research 2023, 31, 280–292. [Google Scholar] [CrossRef] [PubMed]
- Hanto, J.; Schroth, A.; Krawielicki, L.; Oei, P.Y.; Burton, J. South Africa’s energy transition–unraveling its political economy. Energy for Sustainable Development 2022, 69, 164–178. [Google Scholar] [CrossRef]
- Hassan, A.S. Coal mining and environmental sustainability in South Africa: do institutions matter? Environmental Science and Pollution Research 2022, 30, 20431–20449. [Google Scholar] [CrossRef]
- Iji, O.T.; Njoya, E.M.; Madikizela, B.; Myburgh, J.G.; McGaw, L.J. Evaluation of the genotoxic potential of water impacted by acid mine drainage from a coal mine in Mpumalanga, South Africa, using the Ames test and Comet assay. Water SA 2021, 47, 456–465. [Google Scholar] [CrossRef]
- International Energy Agency (IEA). World Energy Outlook 2024. International Energy Agency. 2024. Available online: https://www.iea.org/reports/world-energy-outlook-2024.
- Kamble, P.H.; Kumbhar, J.S. An overview of impact of coal mining on water resources. Int. J. Sci. Res. In Multidisciplinary Studies 2019, Vol, 5, 115–121. Available online: https://www.researchgate.net/publication/338570899.
- Khomo, L.; Mosebi, S.; Ntushelo, K. Microbiological impacts of acid mine drainage on urban agriculture in Soweto, South Africa. Scientific African 2023, 23, 1–9. [Google Scholar] [CrossRef]
- Kumar, M.; Srivastava, M.K.; Kishor, K.; Singh, A.K. An Assessment of the Environmental Impact of Coal Mining through Acid Mine Drainage and Soil Degradation from Makum Coalfields, Upper Assam, India: A Case Study. Journal of the Geological Society of India 2023, 99, 1113–1120. [Google Scholar] [CrossRef]
- Laisani, J.; Jegede, A.O. Impacts of coal mining in Witbank, Mpumalanga province of South Africa: An eco-legal perspective. Journal of Reviews on Global Economics 2019, 8, 1586–1597. [Google Scholar] [CrossRef]
- Lebepe, J.; Oberholster, P.J.; Ncube, I.; Smit, W.; Luus-Powell, W.J. Metal levels in two fish species from a waterbody impacted by metallurgic industries and acid mine drainage from coal mining in South Africa. Journal of Environmental Science and Health, Part A 2019, 55, 421–432. [Google Scholar] [CrossRef] [PubMed]
- Marandi, A.; Shand, P. Groundwater chemistry and the Gibbs Diagram. Applied Geochemistry 2018, 97, 209–212. [Google Scholar] [CrossRef]
- Maremane, S.; Belle, G.; Oberholster, P. Assessment of effluent wastewater quality and the application of an integrated wastewater resource recovery model: The Burgersfort wastewater resource recovery case study. Water 2024, 16, 1–20. [Google Scholar] [CrossRef]
- Masood, N.; Hudson-Edwards, K.; Farooqi, A. True cost of coal: Coal mining industry and its associated environmental impacts on water resource development. Journal of Sustainable Mining 2020, 19, 135–149. [Google Scholar] [CrossRef]
- Mbedzi, M.D.; van der Poll, H.M.; van der Poll, J.A. Enhancing a decision-making framework to address environmental impacts of the South African coalmining industry. Energies 2020, 13, 1–23. [Google Scholar] [CrossRef]
- Mnyango, S.S.; Thwala, M.; Oberholster, P.J.; Truter, C.J. Using multiple indices for the water resource management of a monomictic man-made dam in Southern Africa. Water 2022, 14, 1–19. [Google Scholar] [CrossRef]
- Monira, U.; Sattar, G.S.; Mostafa, M.G. Assessment of surface water quality using the Water Quality Index (WQI) and multivariate statistical analysis (MSA), around tannery industry effluent discharge areas. H2Open Journal 2024, 7, 130–148. [Google Scholar] [CrossRef]
- Moyo, A.; Filho, J.R. Do Amaral; Harrison, S.T.; Broadhurst, J.L. Acid mine drainage and metal (loid) risk potential of South African coal processing wastes. Minerals Engineering 2024, 215, 1–11. [Google Scholar] [CrossRef]
- Munawer, M.E. Human health and environmental impacts of coal combustion and post-combustion wastes. Journal of Sustainable Mining 2018, 17, 87–96. [Google Scholar] [CrossRef]
- Ngwenyama, P.L.; de Graaf, W.W. Risks and challenges affecting opencast pillar mining in previously mined underground bord and pillar workings. Journal of the Southern African Institute of Mining and Metallurgy 2021, 121, 623–631. [Google Scholar] [CrossRef]
- Nkosi, M.; Mathivha, F.I.; Odiyo, J.O. Impact of land management on water resources, a South African context. Sustainability 2021, 13, 1–32. [Google Scholar] [CrossRef]
- Nunes, L.J. The rising threat of atmospheric CO2: a review on the causes, impacts, and mitigation strategies. Environments 2023, 10, 1–22. [Google Scholar] [CrossRef]
- Oberholster, P.F.; Goldin, J.; Xu, Y.; Kanyerere, T.; Oberholster, P.J.; Botha, A.M. Assessing the adverse effects of a mixture of AMD and sewage effluent on a sub-tropical dam situated in a nature conservation area using a modified pollution index. International Journal of Environmental Research 2021, 15, 321–333. [Google Scholar] [CrossRef]
- Oberholster, P.J.; Botha, A.M.; Hill, L.; Strydom, W.F. River catchment responses to anthropogenic acidification in relationship with sewage effluent: An ecotoxicology screening application. Chemosphere 2017, 189, 407–417. [Google Scholar] [CrossRef]
- Owolabi, S.T.; Belle, J.A. Investigating extreme hydrological risk impact on water quality; evidence from Buffalo catchment headwater, Eastern Cape, South Africa. Environmental Science and Pollution Research 2023, 30, 73425–73450. [Google Scholar] [CrossRef]
- Owolabi, S.T.; Belle, J.A.; Mazinyo, S. Quantifying intra-catchment streamflow processes and response to climate change within a climatic transitional zone: a case study of Buffalo catchment, Eastern Cape, South Africa. Mathematics 2022, 10, 1–20. [Google Scholar] [CrossRef]
- Piroozfar, P.; Alipour, S.; Modabberi, S.; Cohen, D. Using multivariate statistical analysis in assessment of surface water quality and identification of heavy metal pollution sources in Sarough watershed, NW of Iran. Environmental Monitoring and Assessment 2021, 193, 1–20. [Google Scholar] [CrossRef] [PubMed]
- Prathap, A.; Chakraborty, S. Assessment of surface water quality around opencast coal mines for sustainable utilization potentials: a case study in Jharkhand, India. Environment, development and sustainability 2019, 22, 3179–3205. [Google Scholar] [CrossRef]
- Ratshomo, K.; Nembahe, R. South African energy sector report; Department of Energy South Africa, 2018; pp. 1–25. [Google Scholar]
- Rawat, K.S.; Singh, S.K.; Gautam, S.K. Assessment of groundwater quality for irrigation use: a peninsular case study. Applied Water Science 2018, 8, 1–24. [Google Scholar] [CrossRef]
- Ray, S.; Dey, K. Coal mine water drainage: the current status and challenges. Journal of the Institution of Engineers (india): Series D 2020, 101, 165–172. [Google Scholar] [CrossRef]
- Simpson, G.B.; Badenhorst, J.; Jewitt, G.P.; Berchner, M.; Davies, E. Competition for land: The water-energy-food nexus and coal mining in Mpumalanga Province, South Africa. Frontiers in Environmental Science 2019, 7, 1–12. [Google Scholar] [CrossRef]
- Singh, G.; Pal, A.; Niranjan, R.K.; Kumar, M. Assessment of environmental impacts by mining activities: A case study from Jhansi open cast mining site-Uttar Pradesh, India. Journal of Experimental sciences 2010, 1, 9–13. [Google Scholar]
- Wright, I.A.; Belmer, N.; Davies, P.J. Coal mine water pollution and ecological impairment of one of Australia’s most ‘protected’ high conservation-value rivers. Water, Air, and Soil Pollution 2017, vol. 228, 1–18. [Google Scholar] [CrossRef]
- Zhou, M.; Li, X.; Zhang, M.; Liu, B.; Zhang, Y.; Gao, Y.; Ullah, H.; Peng, L.; He, A.; Yu, H. Water quality in a worldwide coal mining city: A scenario in water chemistry and health risks exploration. Journal of Geochemical Exploration 2020, 213, 1–12. [Google Scholar] [CrossRef]
Figure 1.
Map of the study area showing the quaternary catchments and surrounding towns.
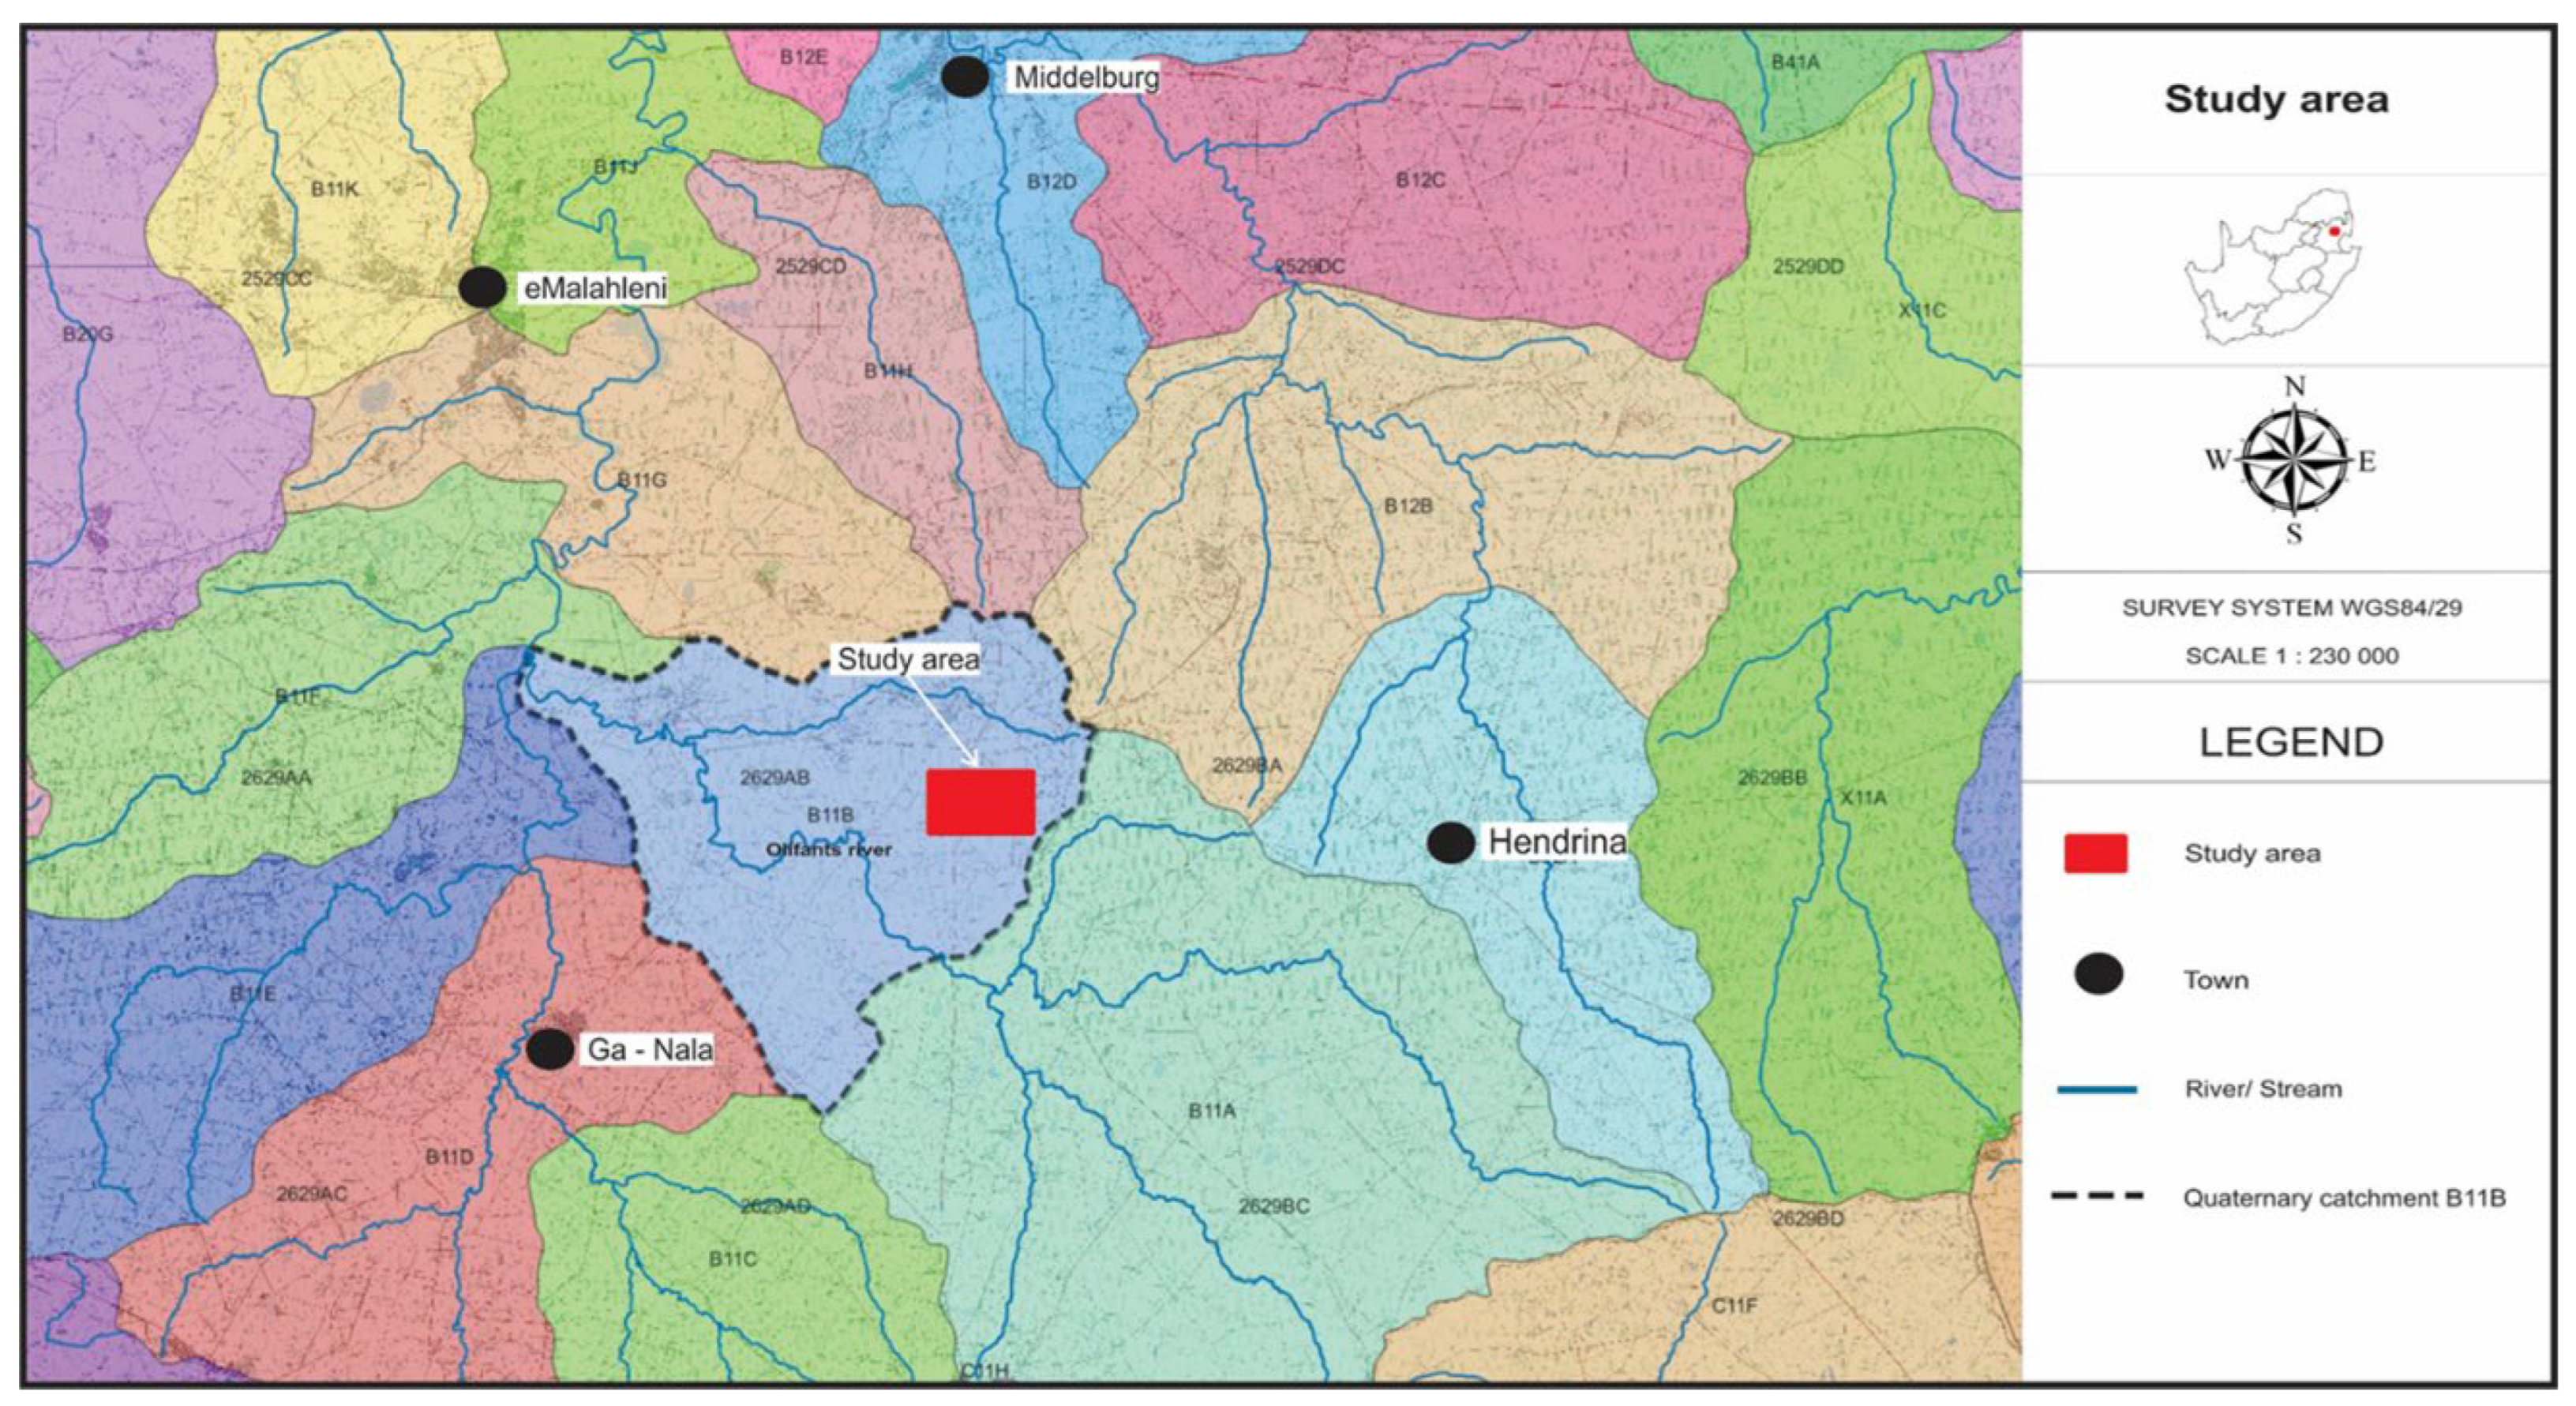
Figure 2.
Surface water monitoring sites along Leeuwfonteinspruit.
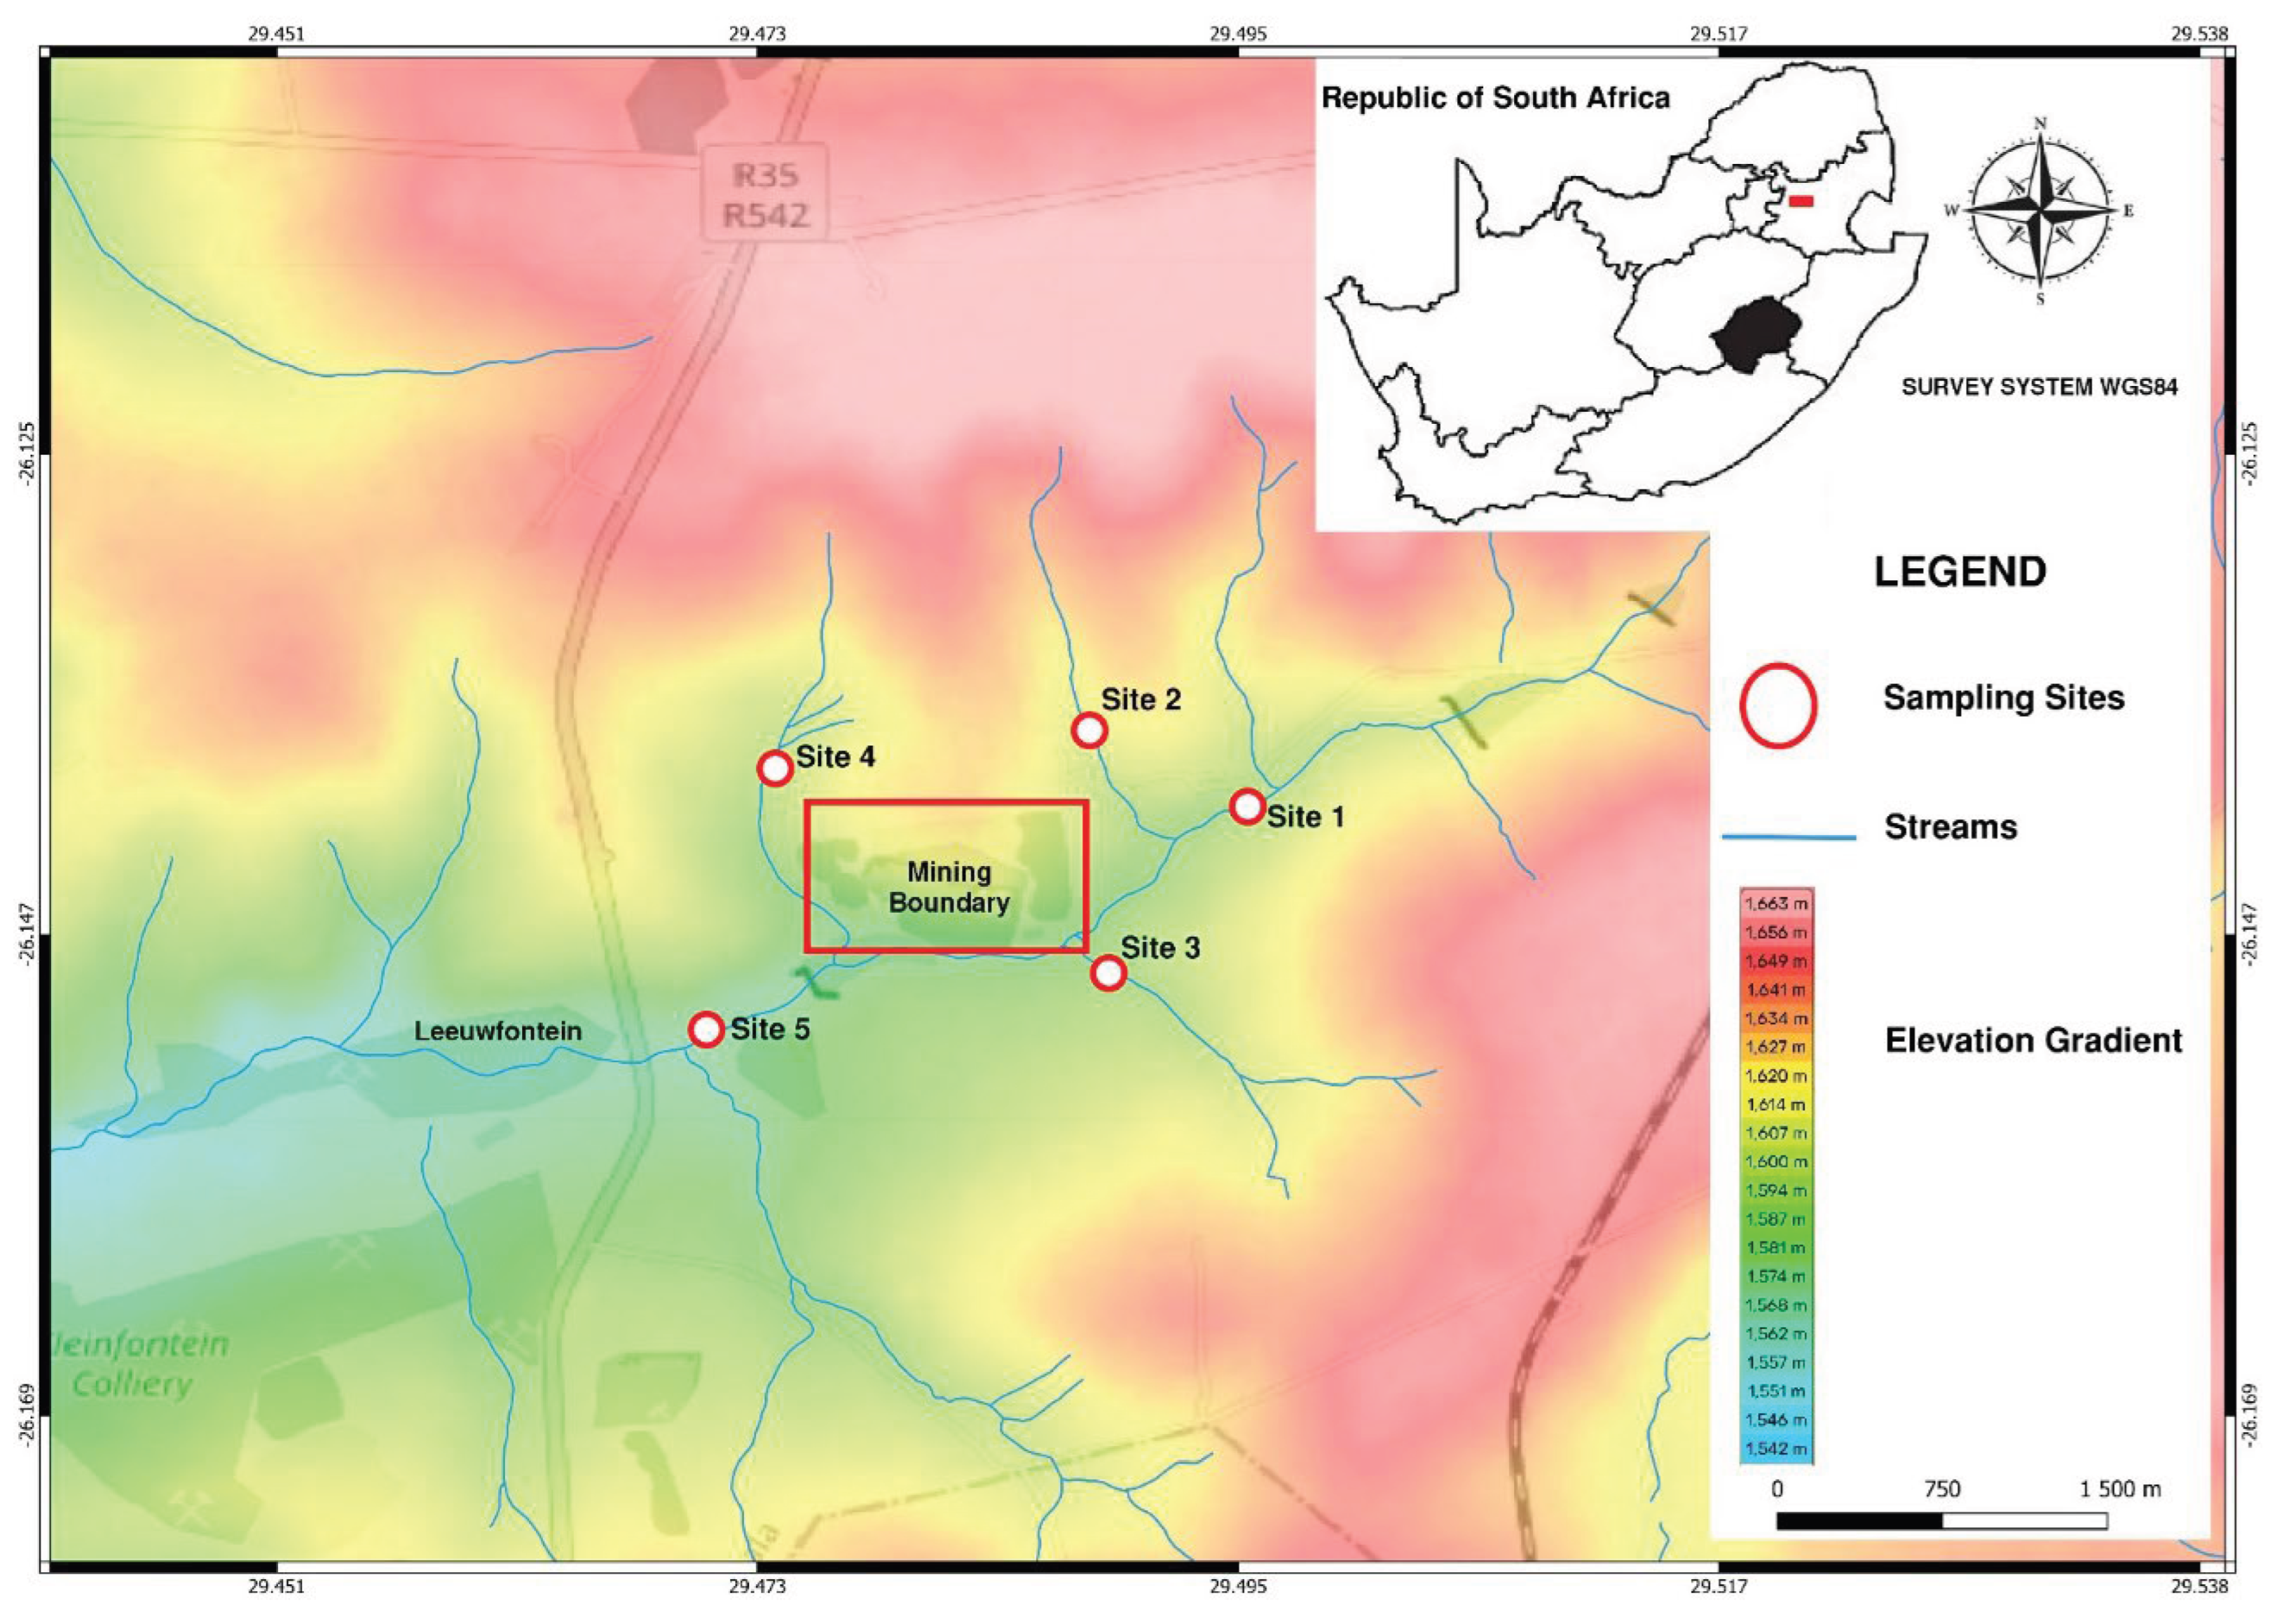
Figure 3.
The distribution of WQI values at five sites (Sites 1 - 5) within Leeuwfonteinspruit.
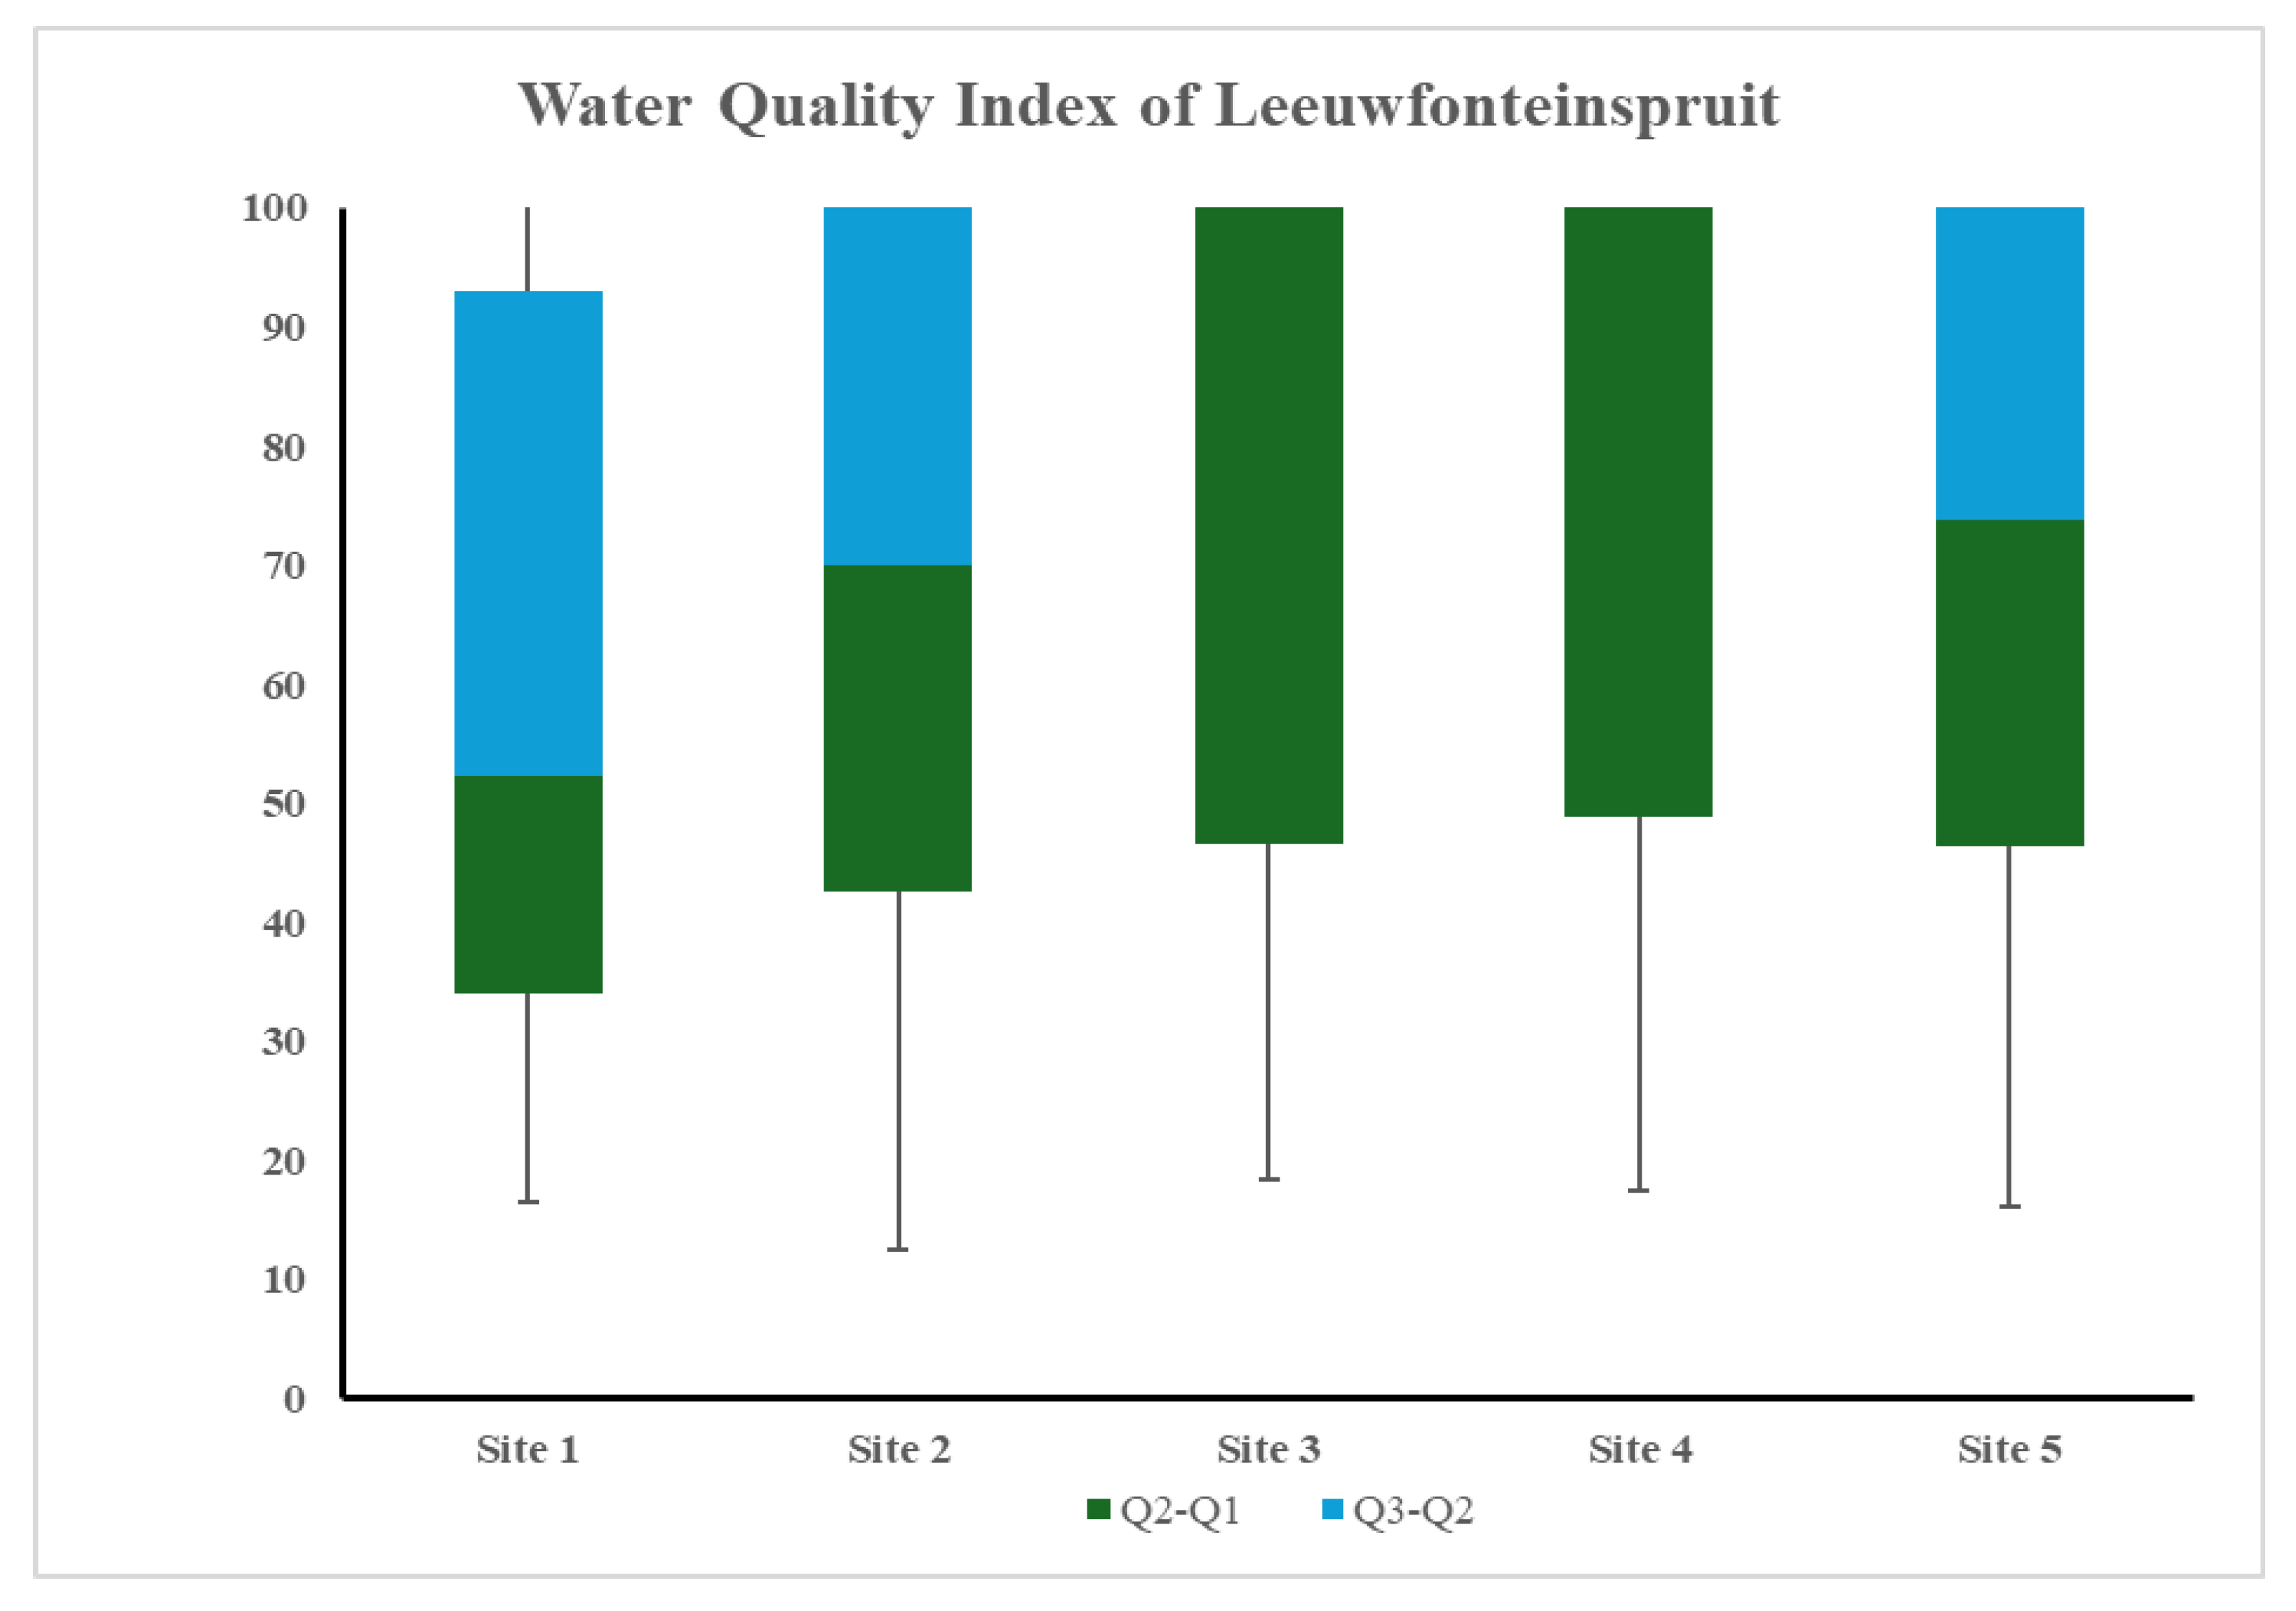
Figure 4.
The distribution of SAR values at five sites within Leeuwfonteinspruit.
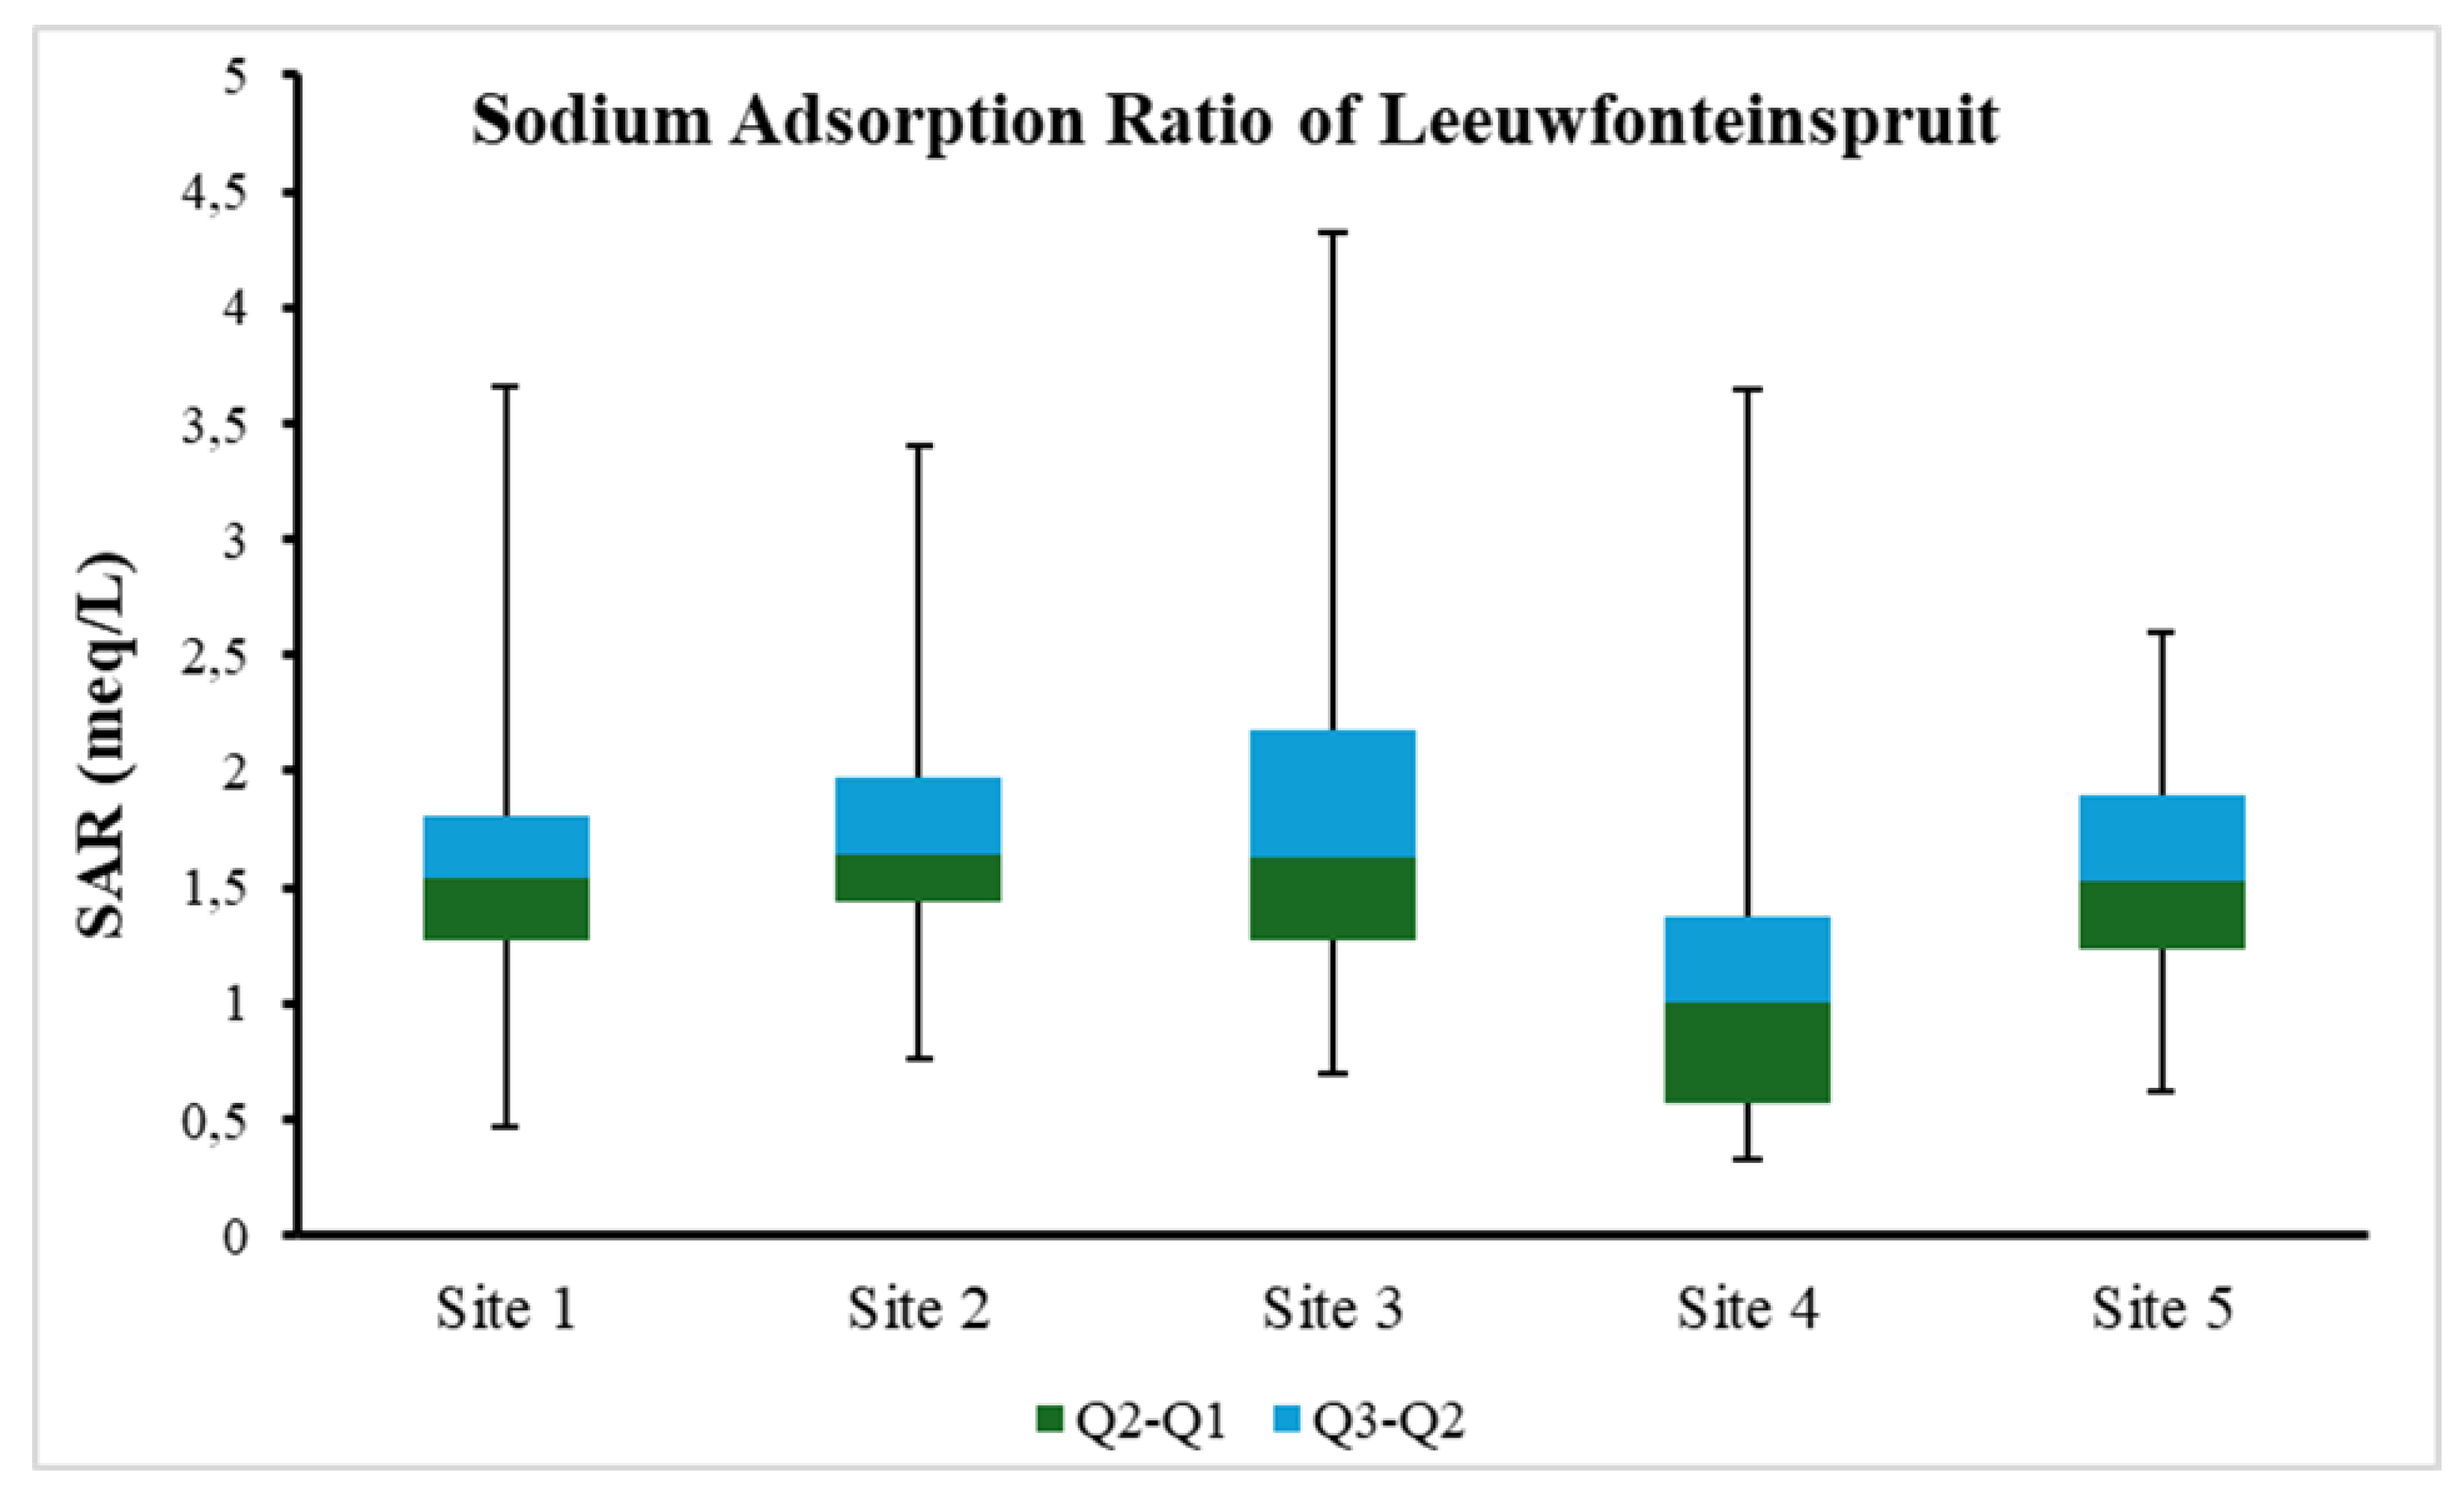
Figure 5.
The distribution of ESP values at five sites within Leeuwfonteinspruit.
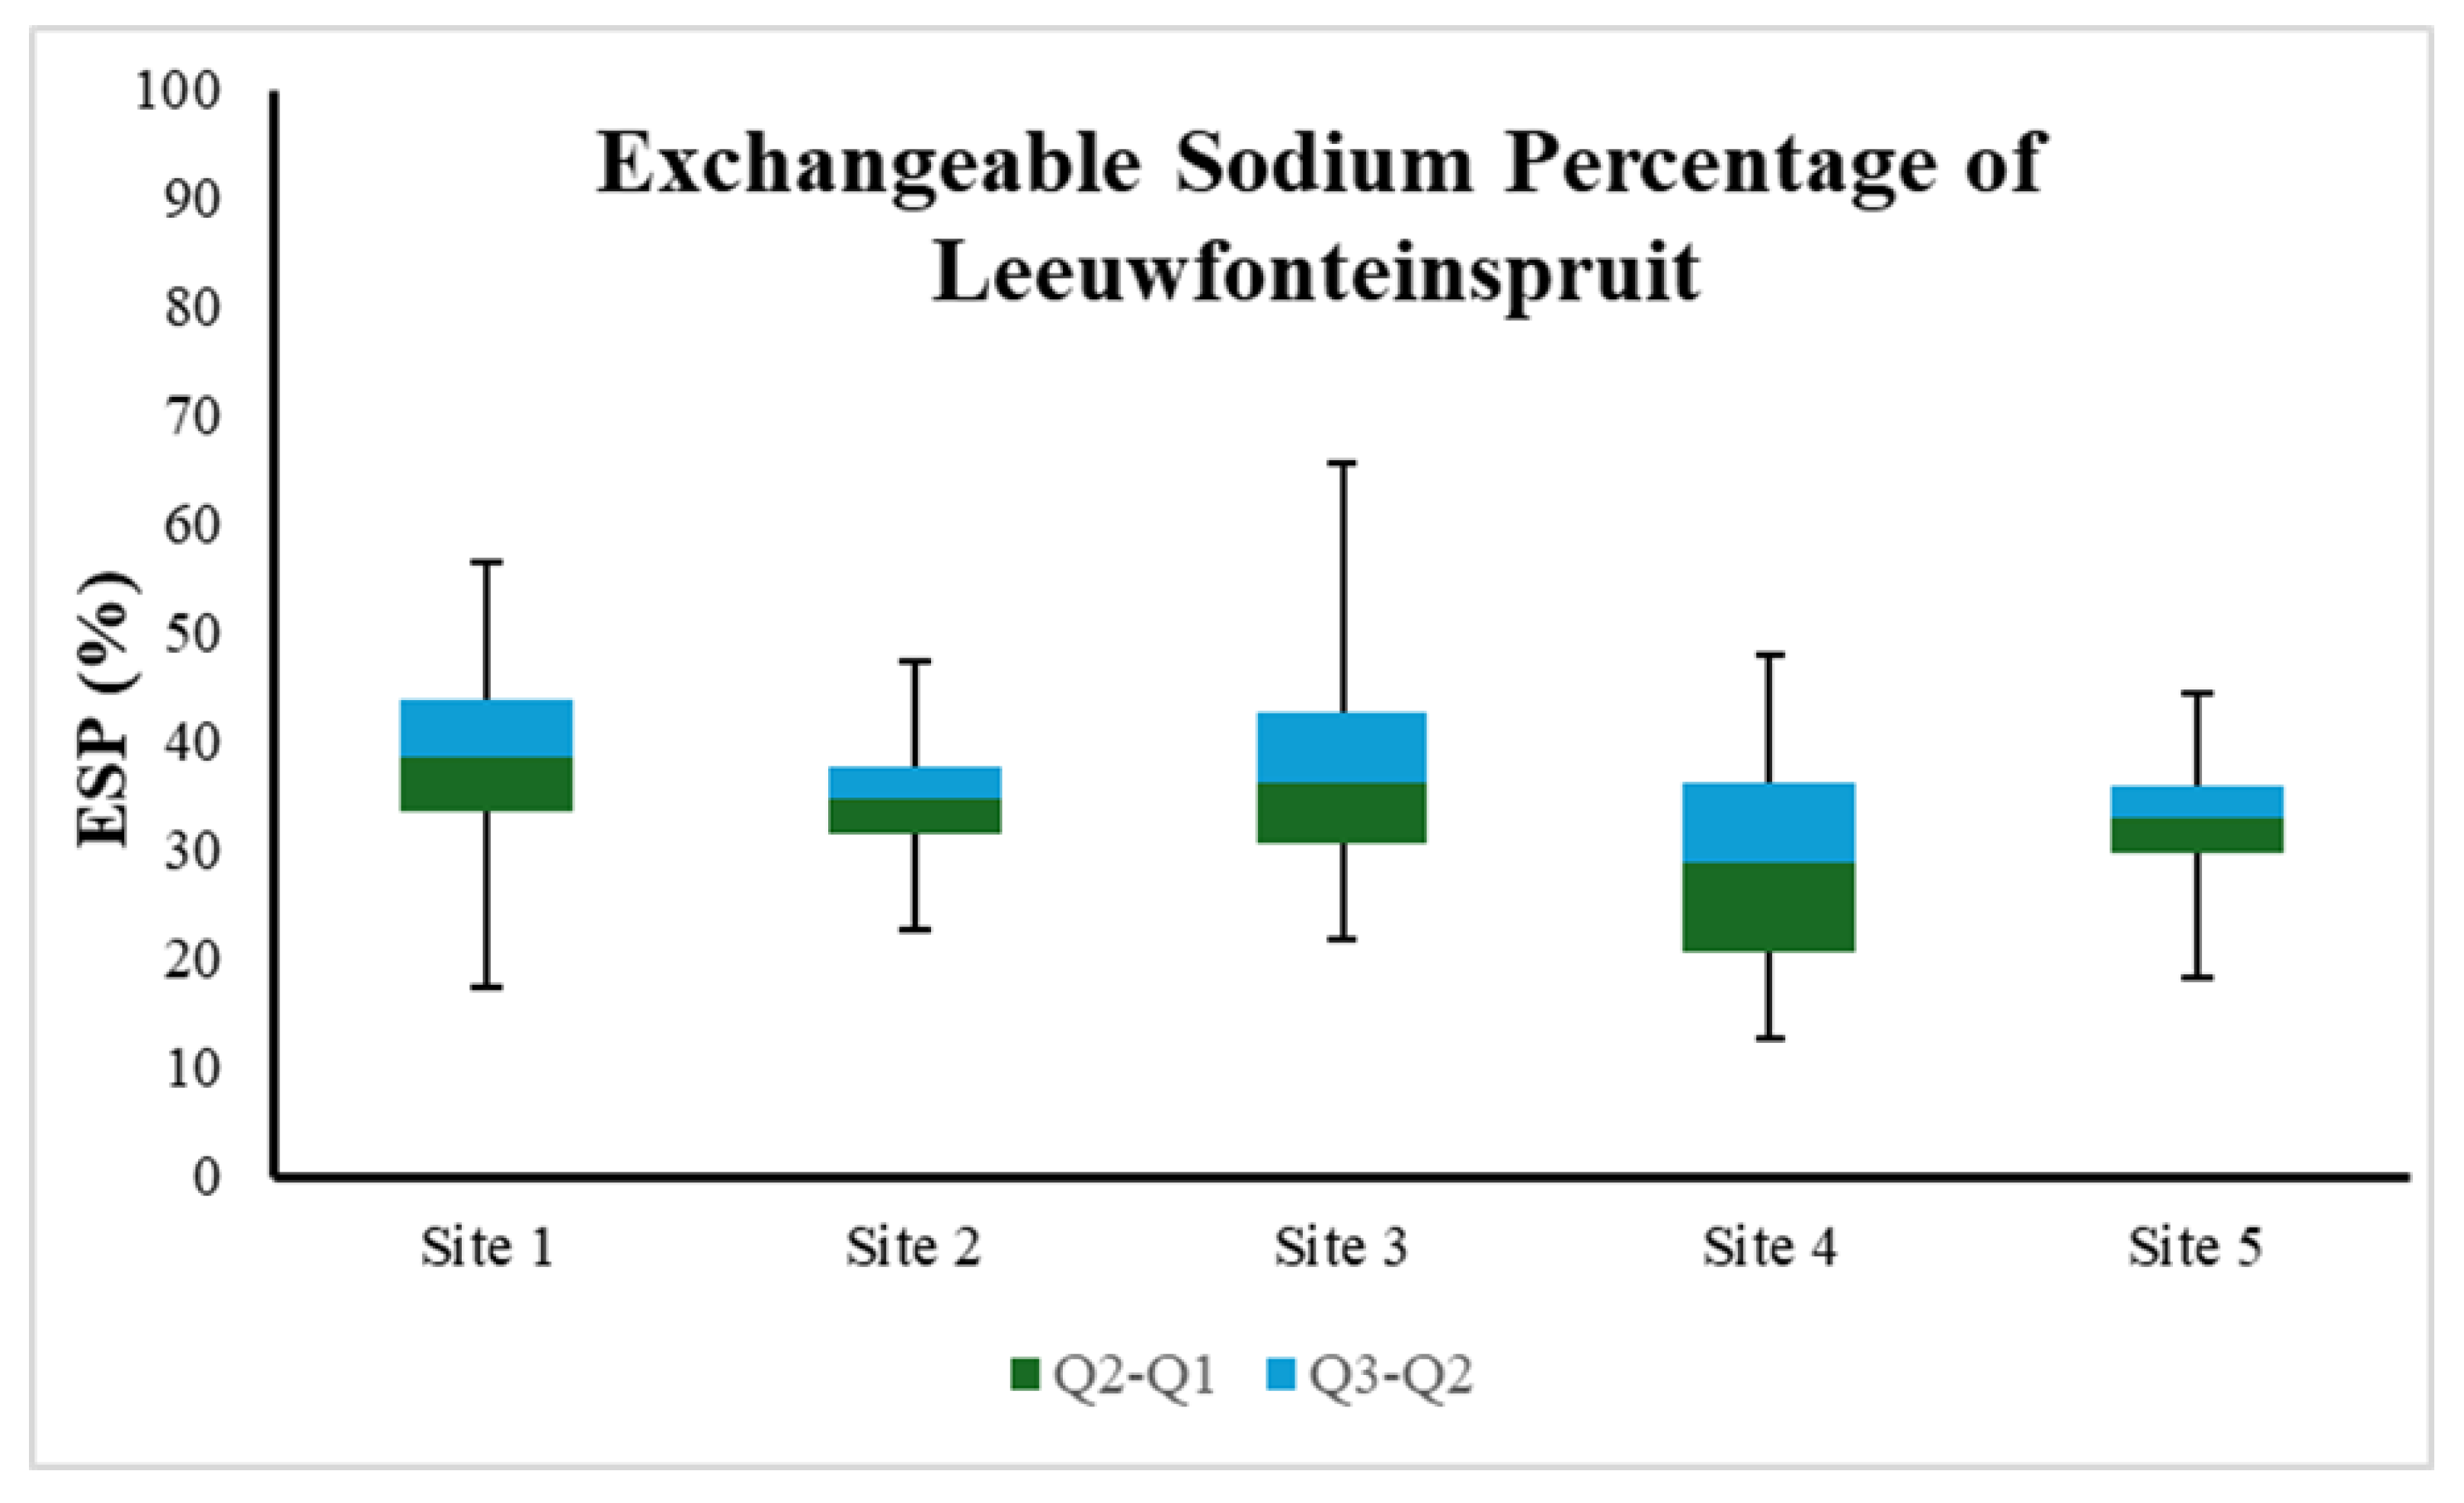
Figure 6.
Temporal variations of (a) WQI, (b) SAR and (c) ESP across sampling sites from 2018 – 2023.
Figure 6.
Temporal variations of (a) WQI, (b) SAR and (c) ESP across sampling sites from 2018 – 2023.
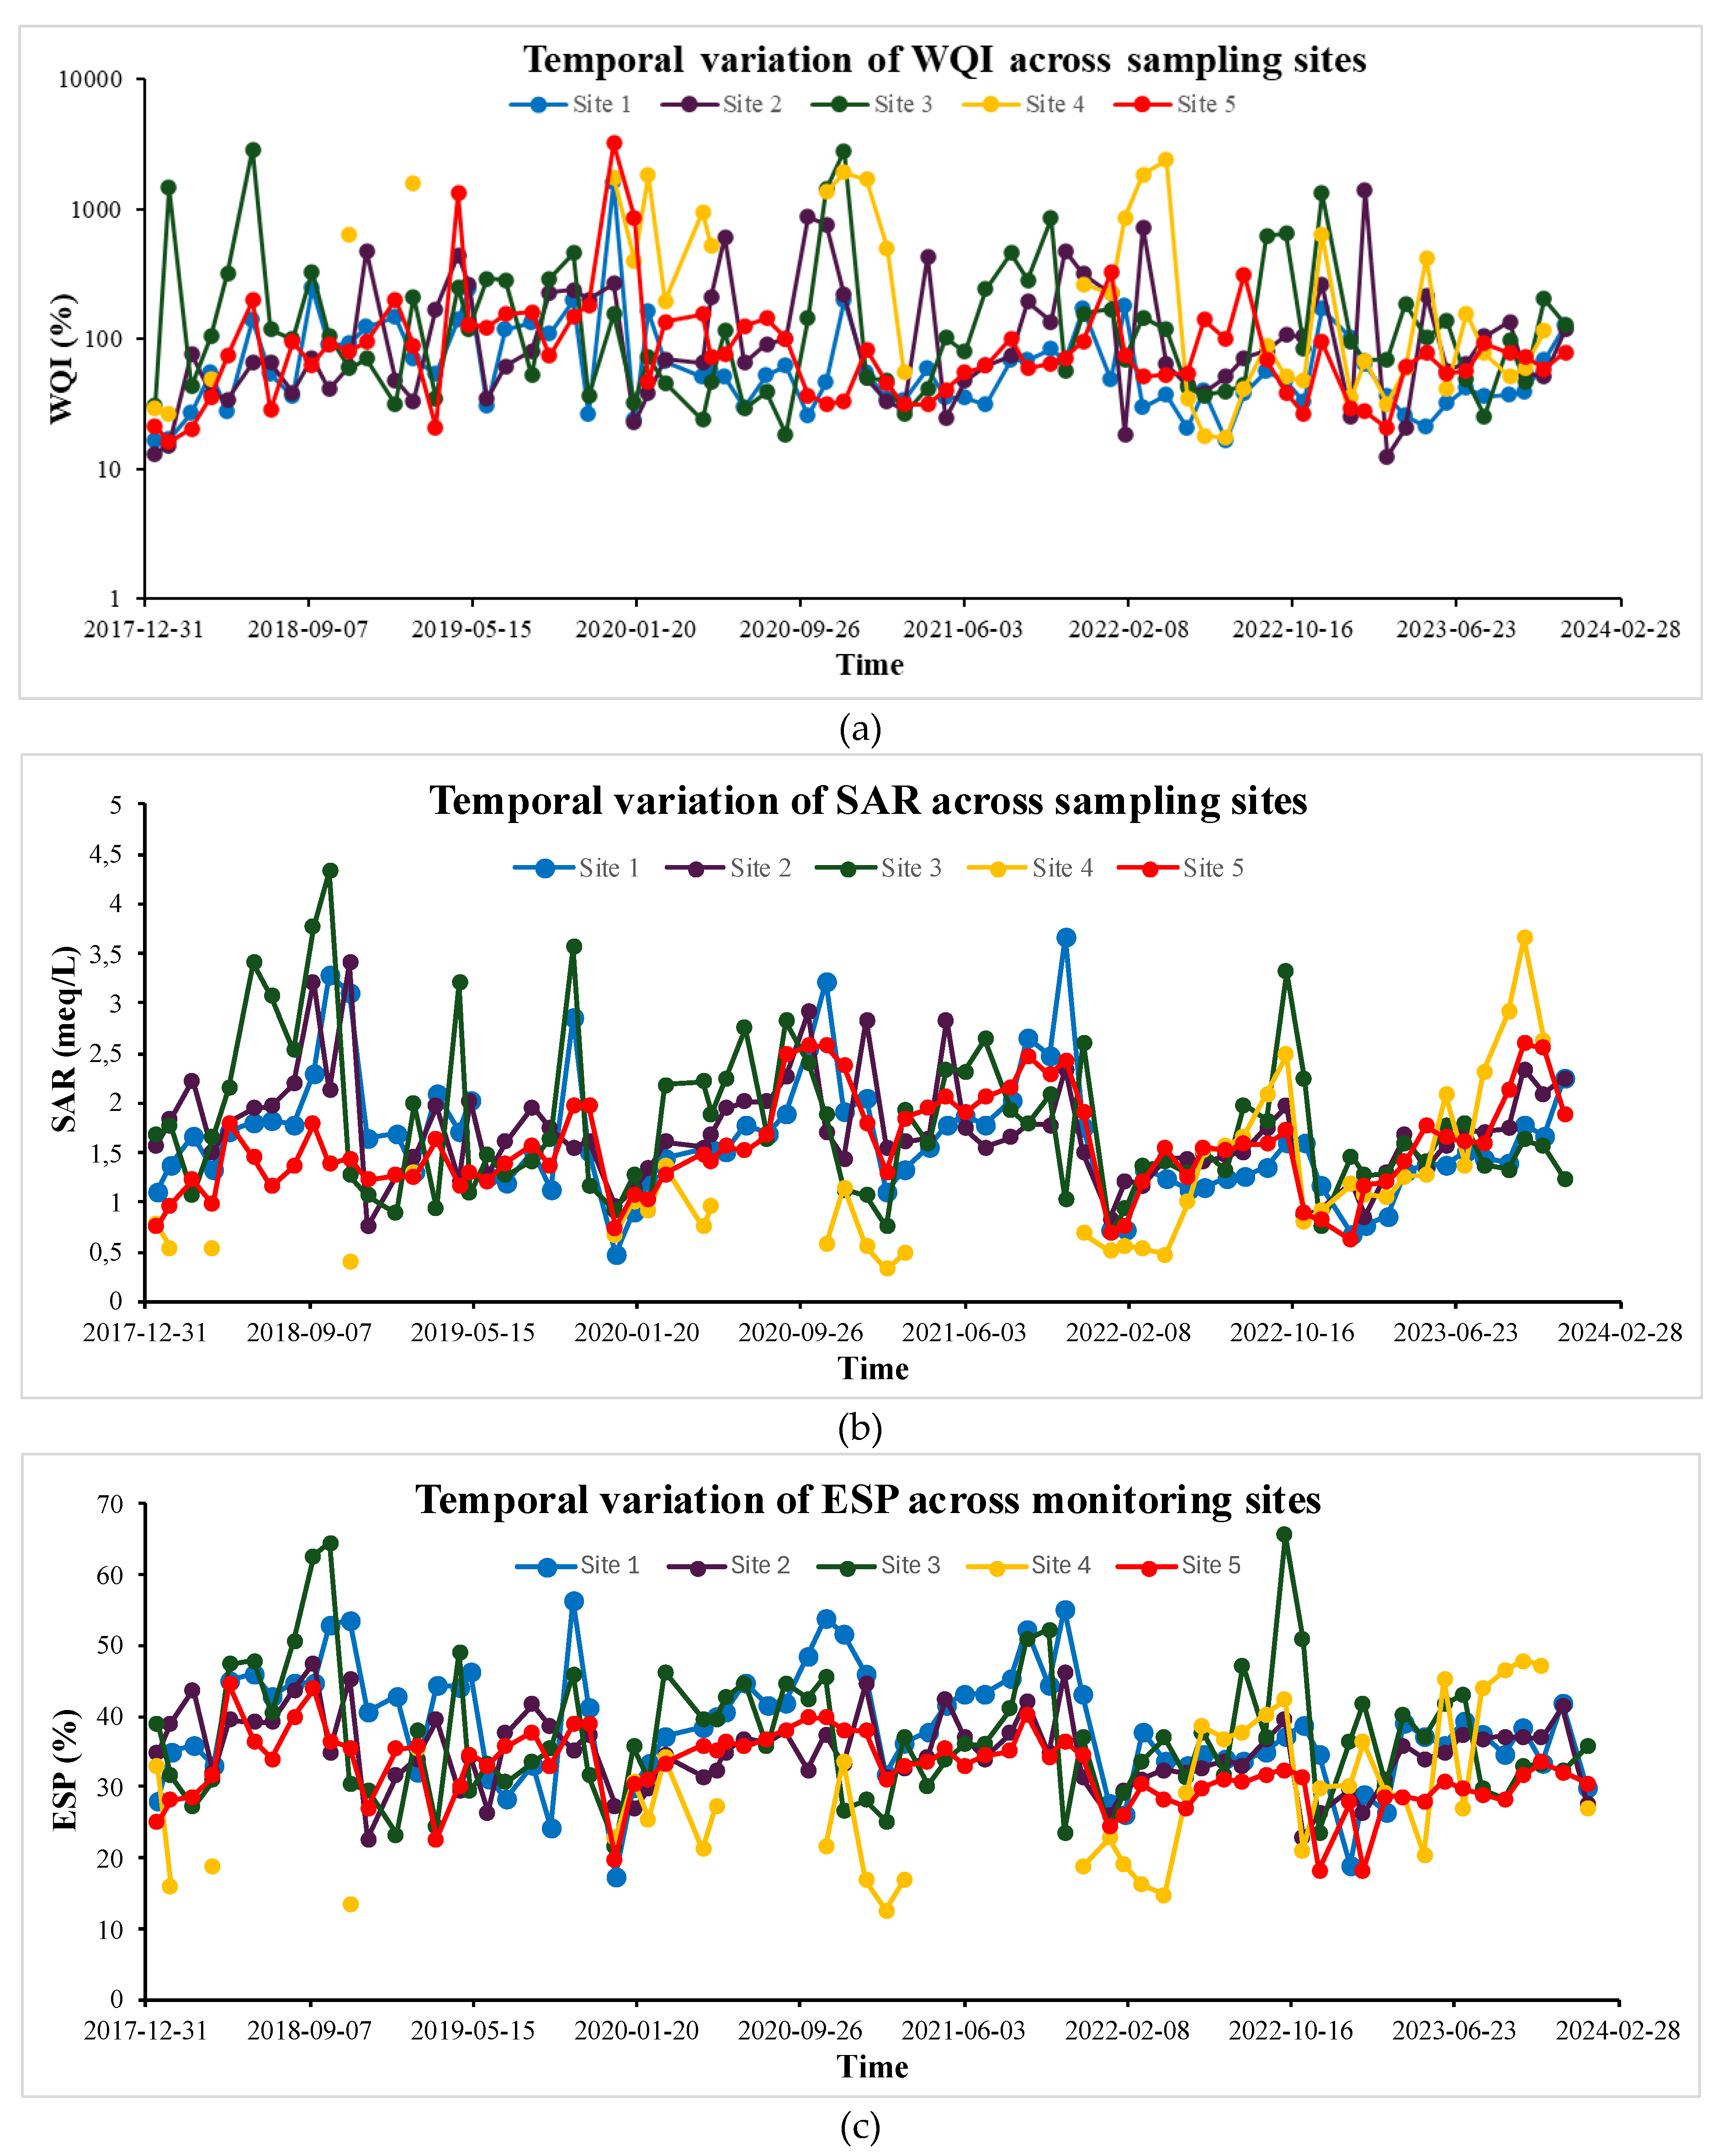
Figure 7.
Gibbs Diagrams for monitoring Sites 1 – 5.
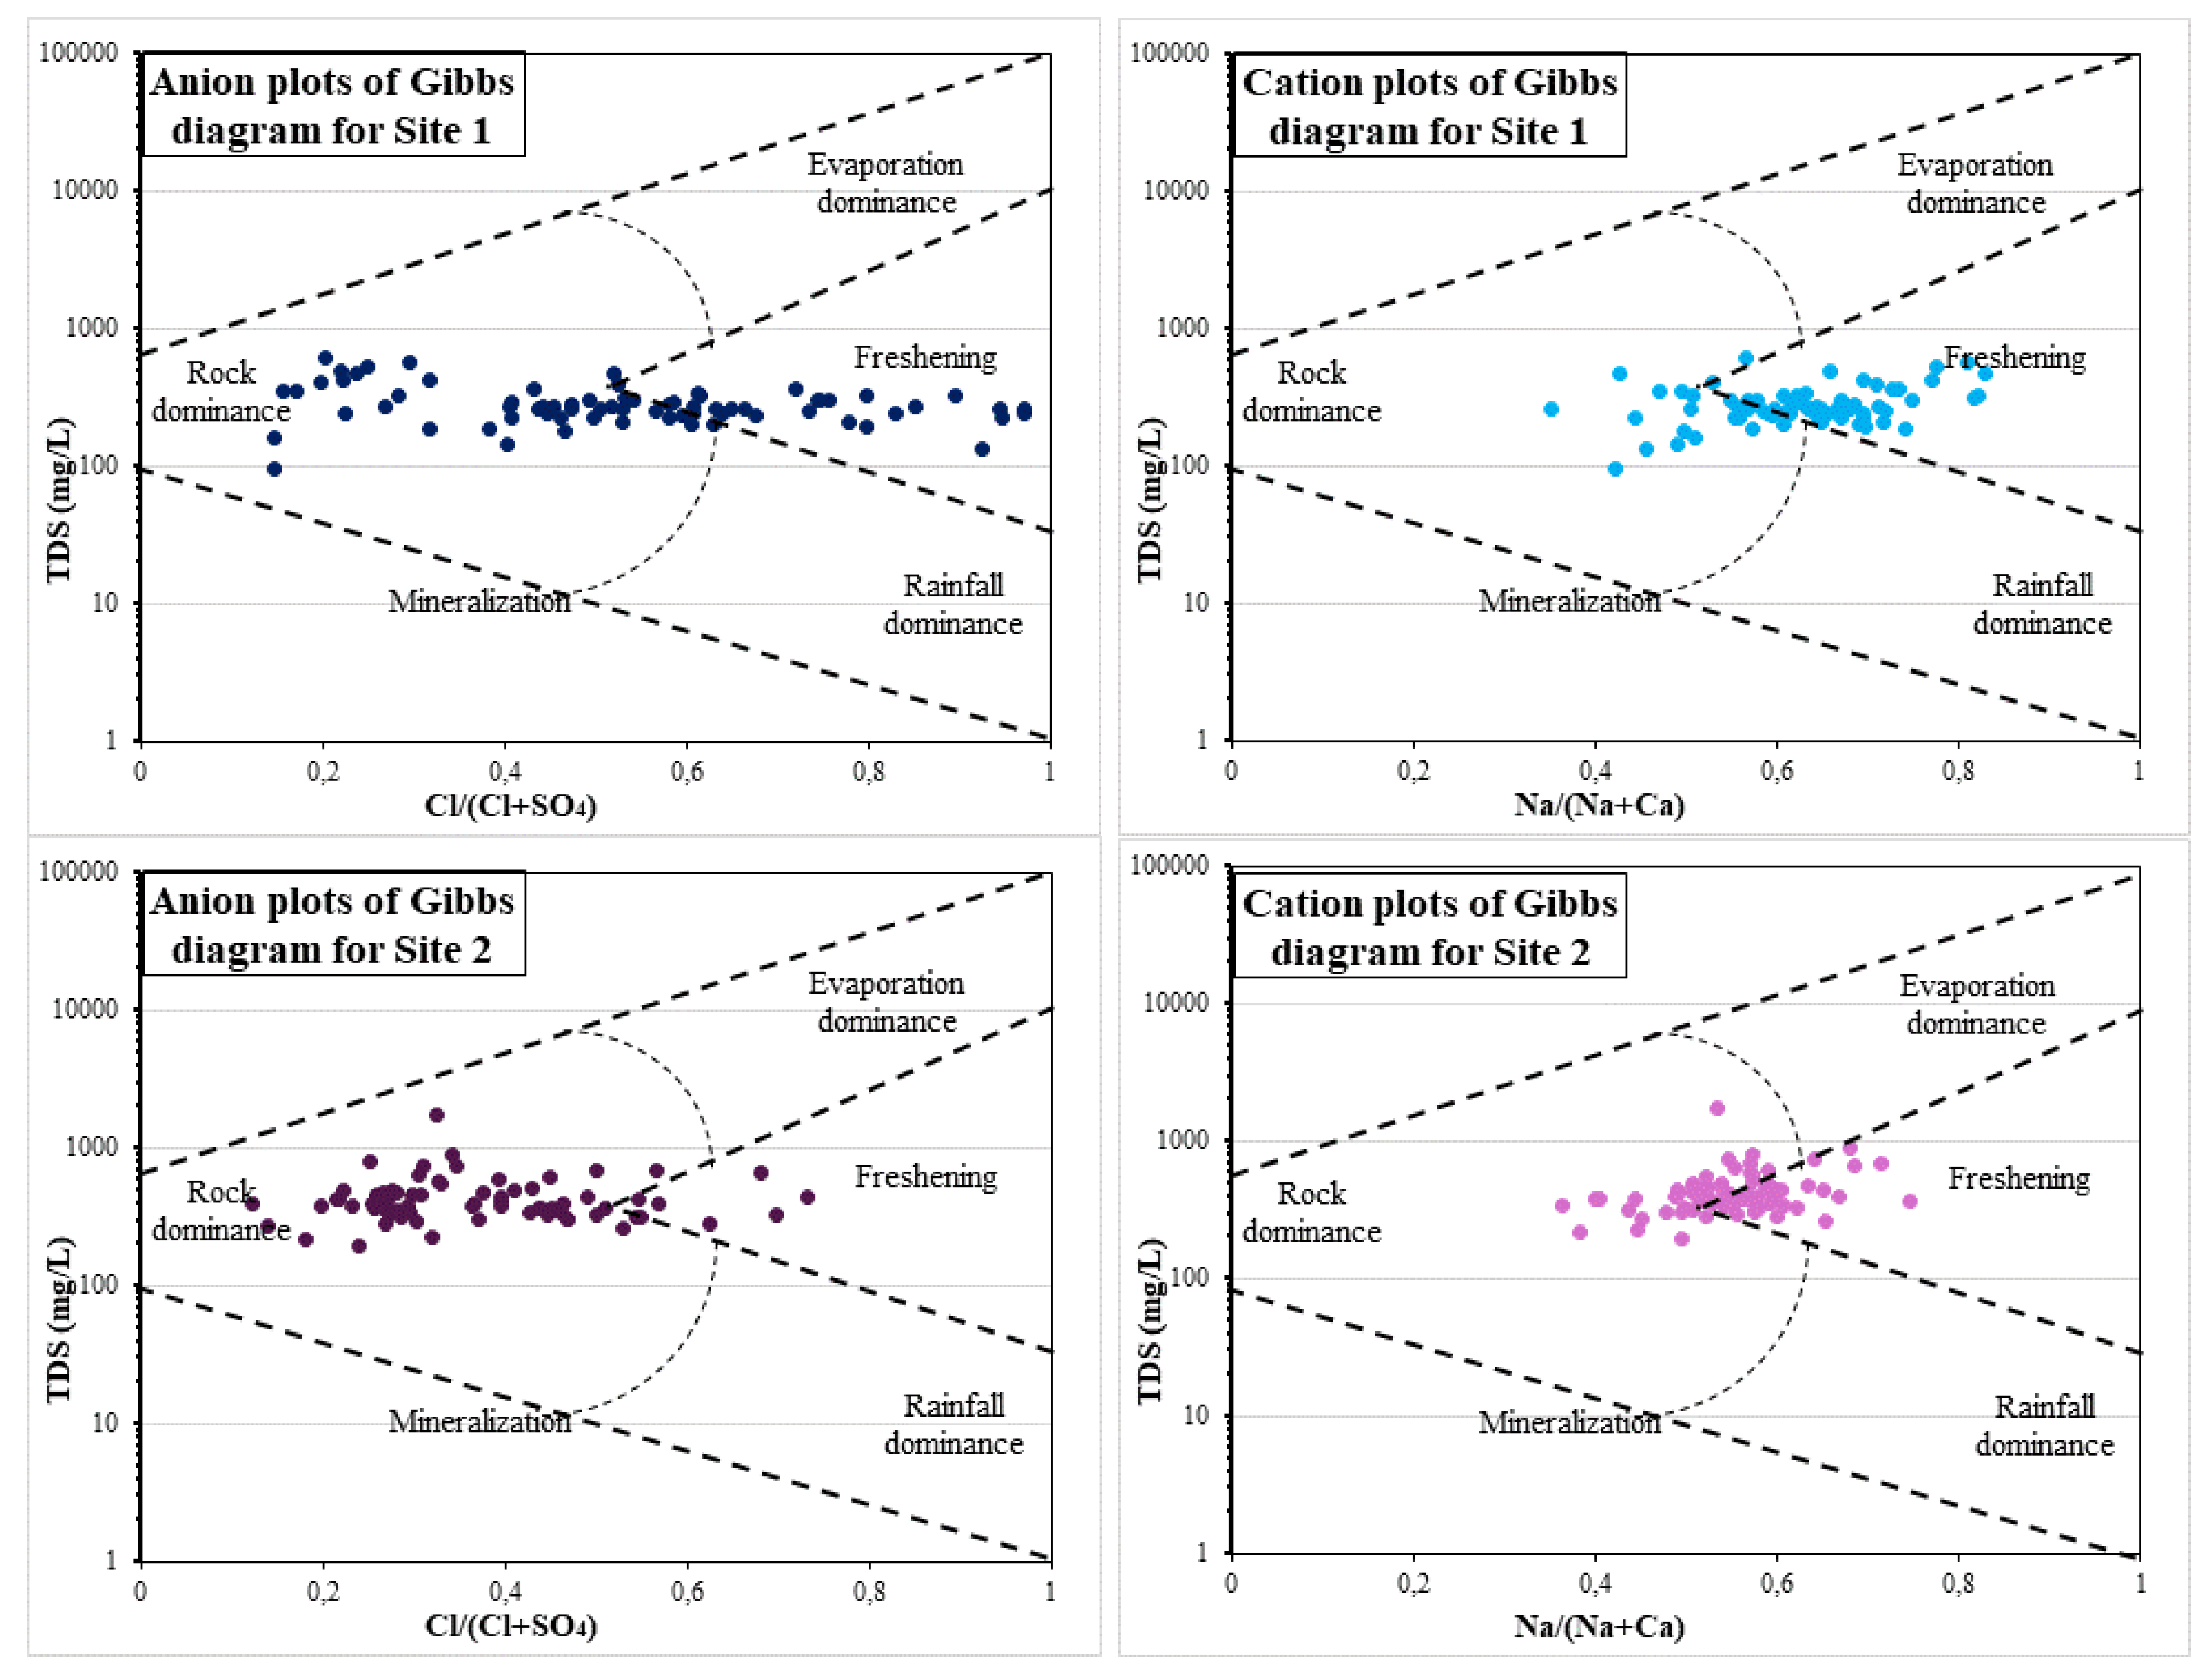
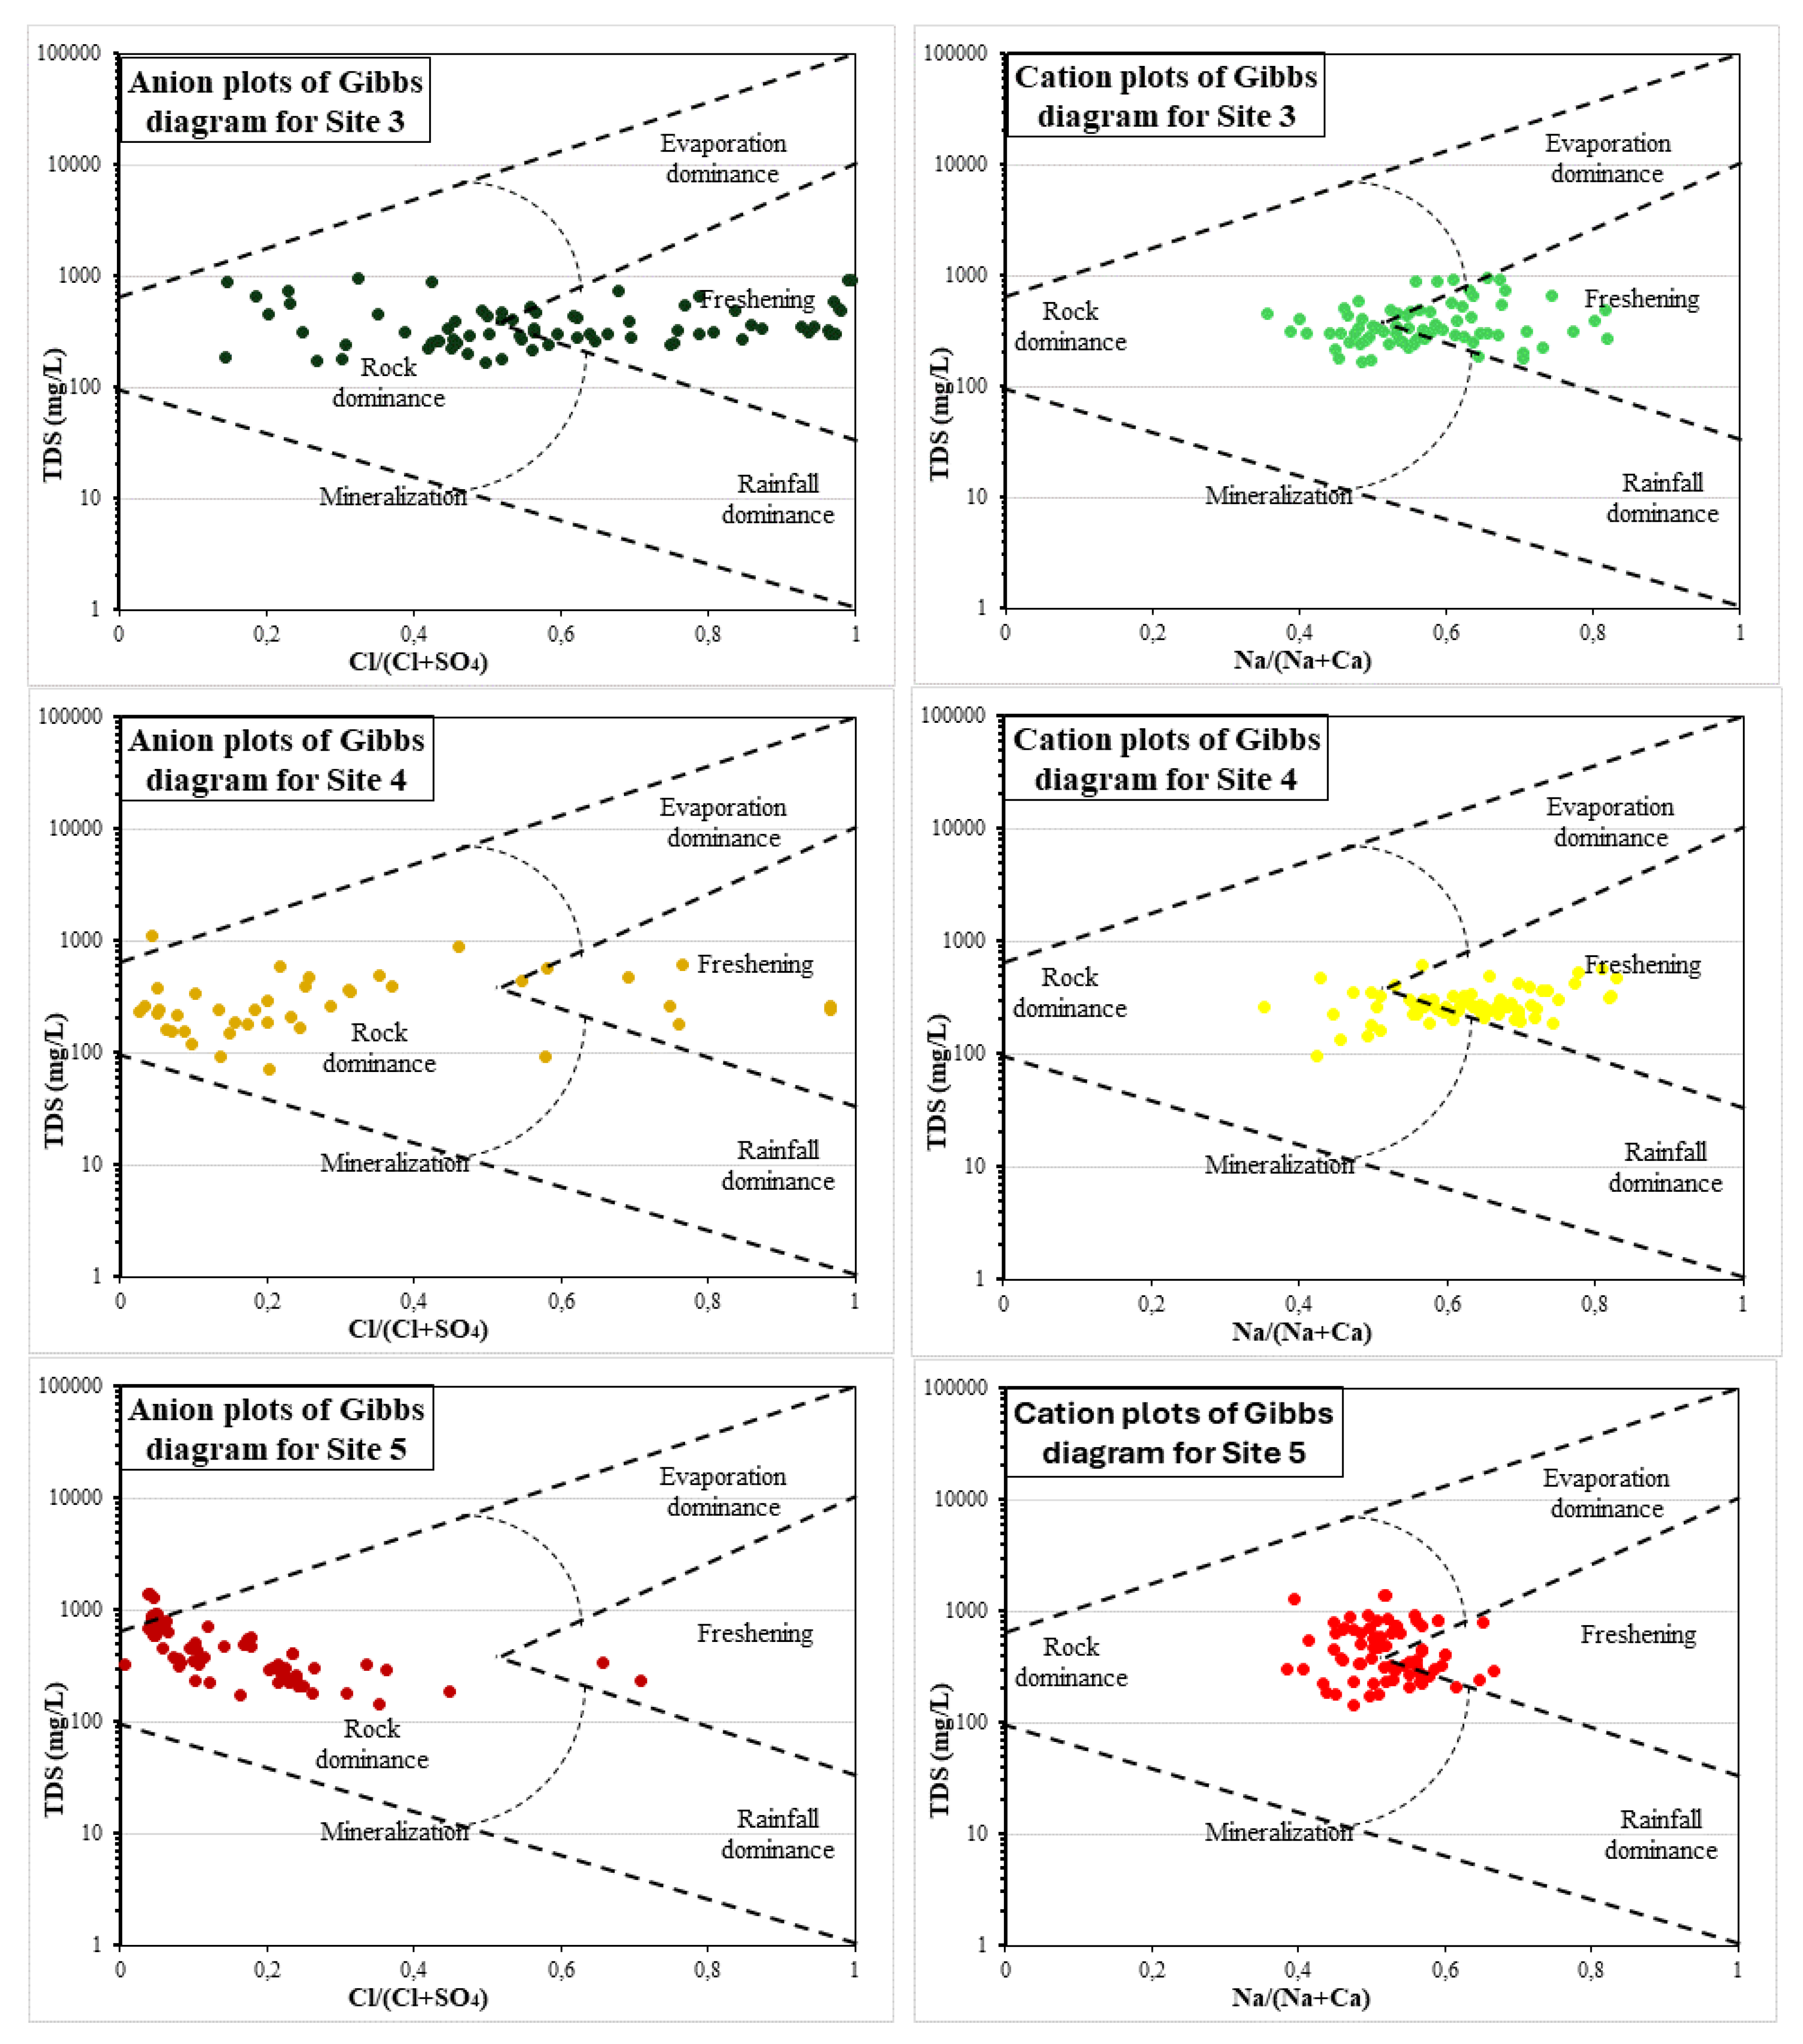
Figure 8.
Sequential Mann-Kendall trends of (a) WQI, (b) SAR and (c) ESP across sampling sites from 2018 – 2023.
Figure 8.
Sequential Mann-Kendall trends of (a) WQI, (b) SAR and (c) ESP across sampling sites from 2018 – 2023.
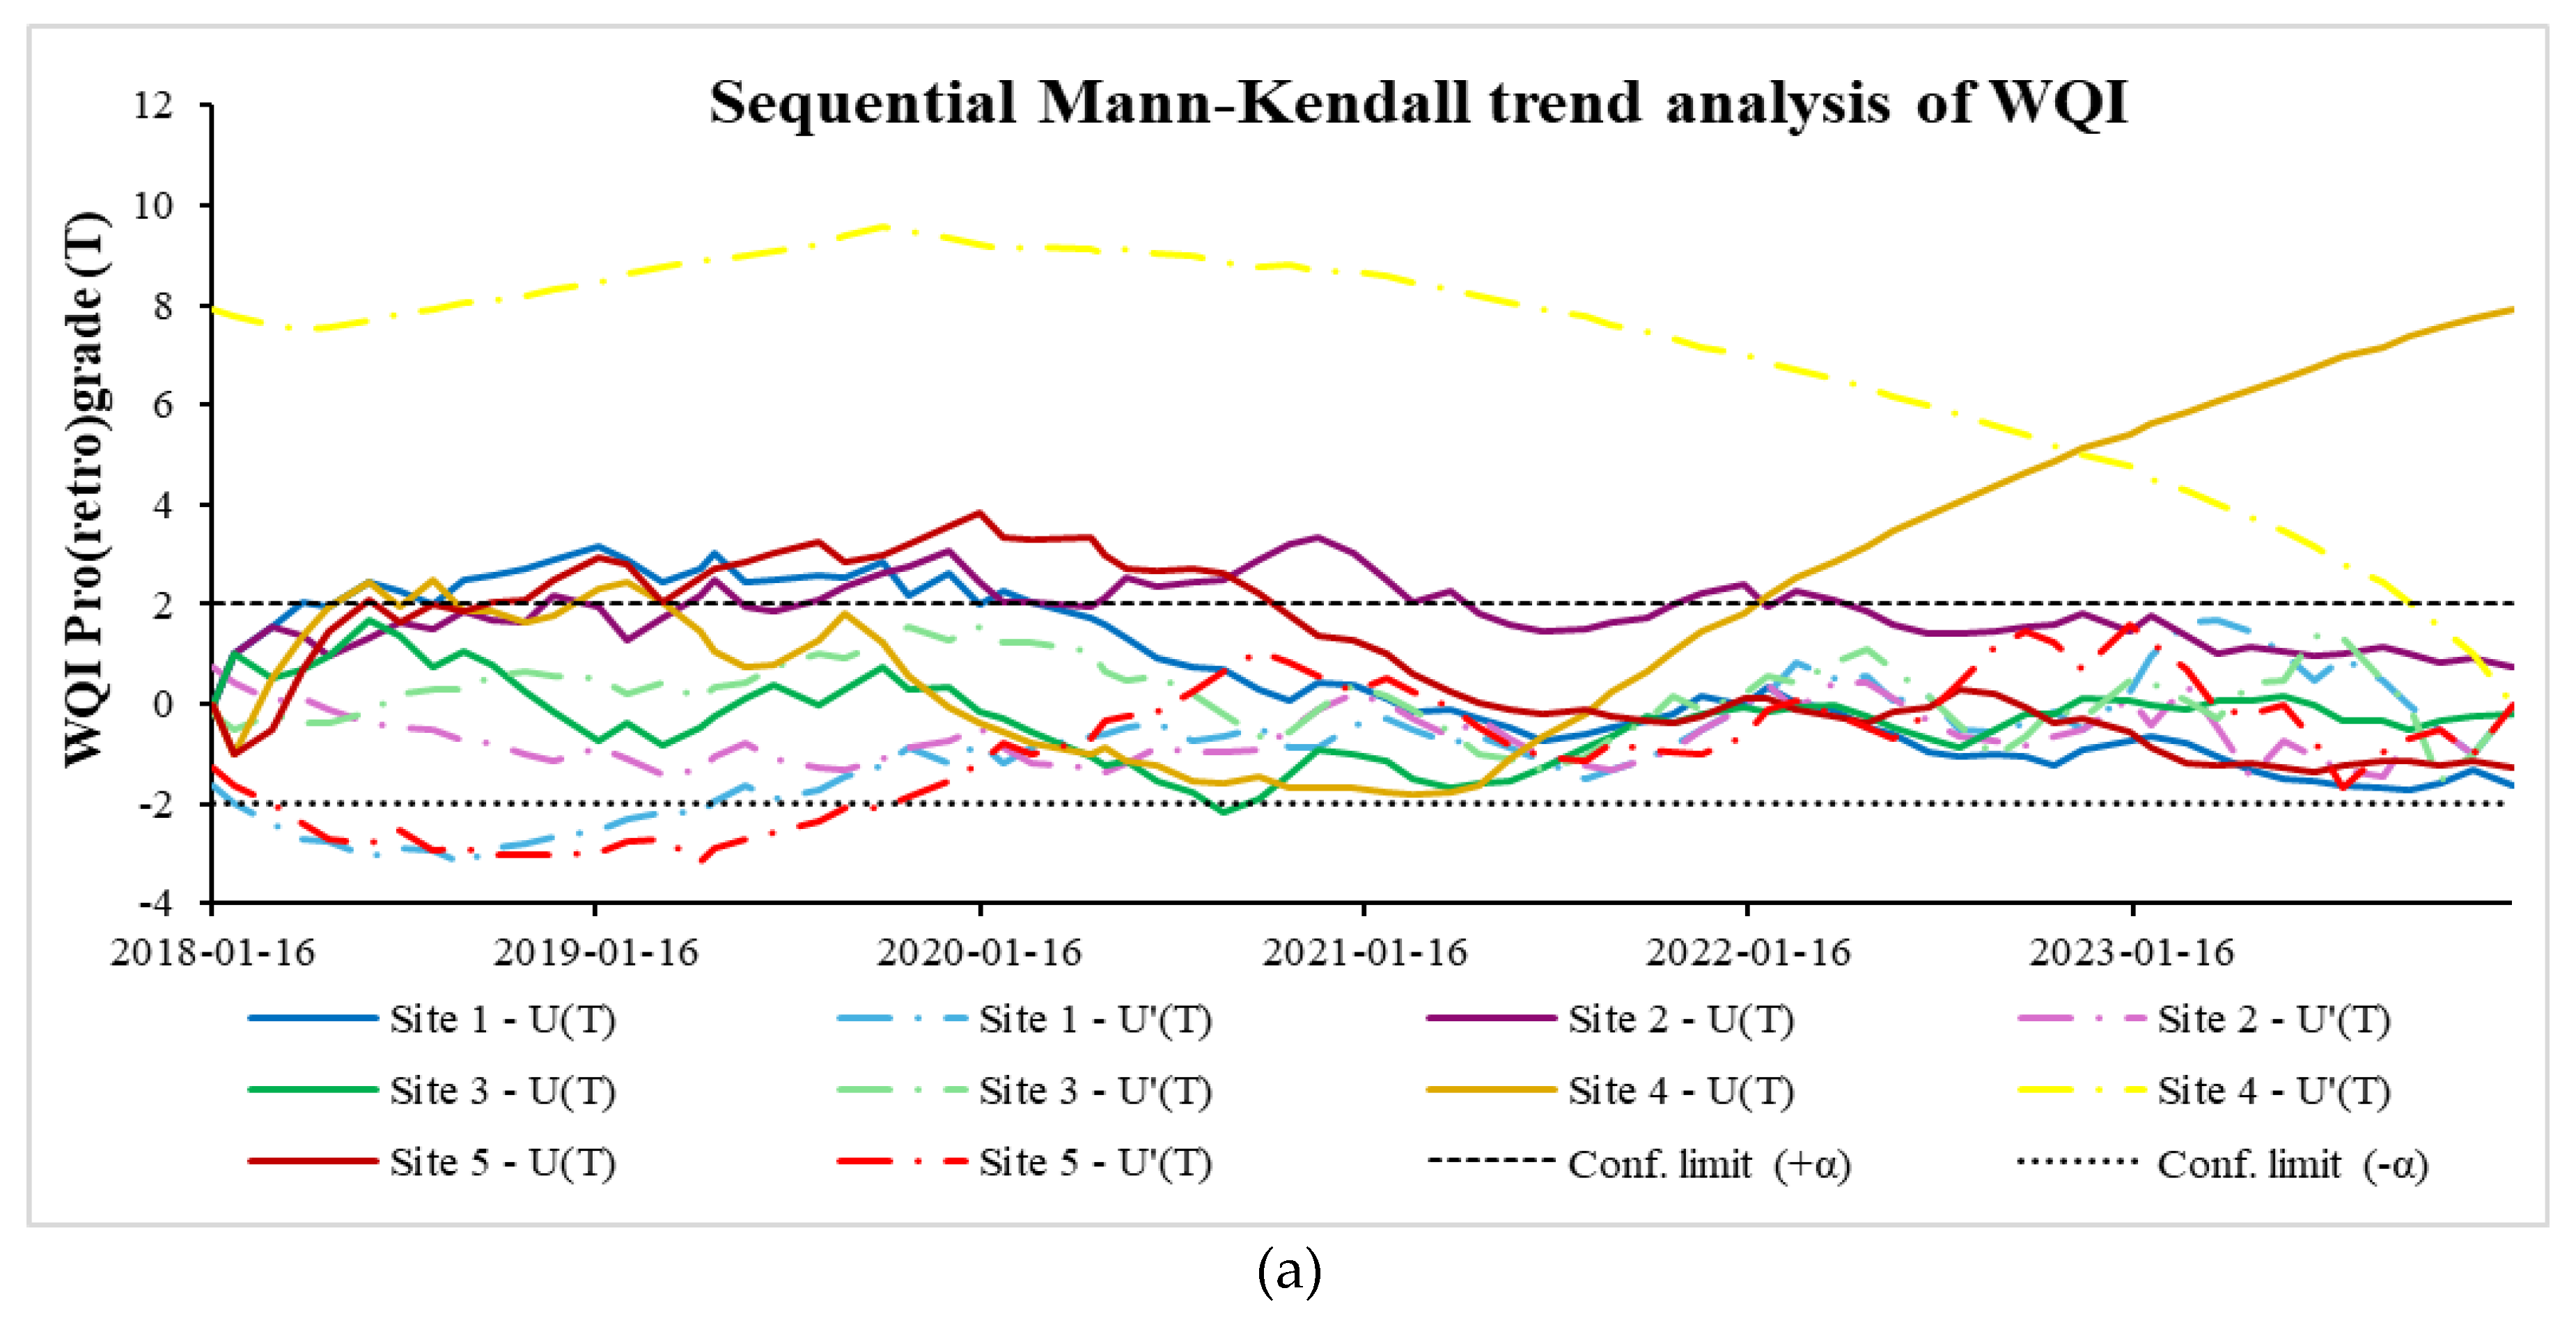
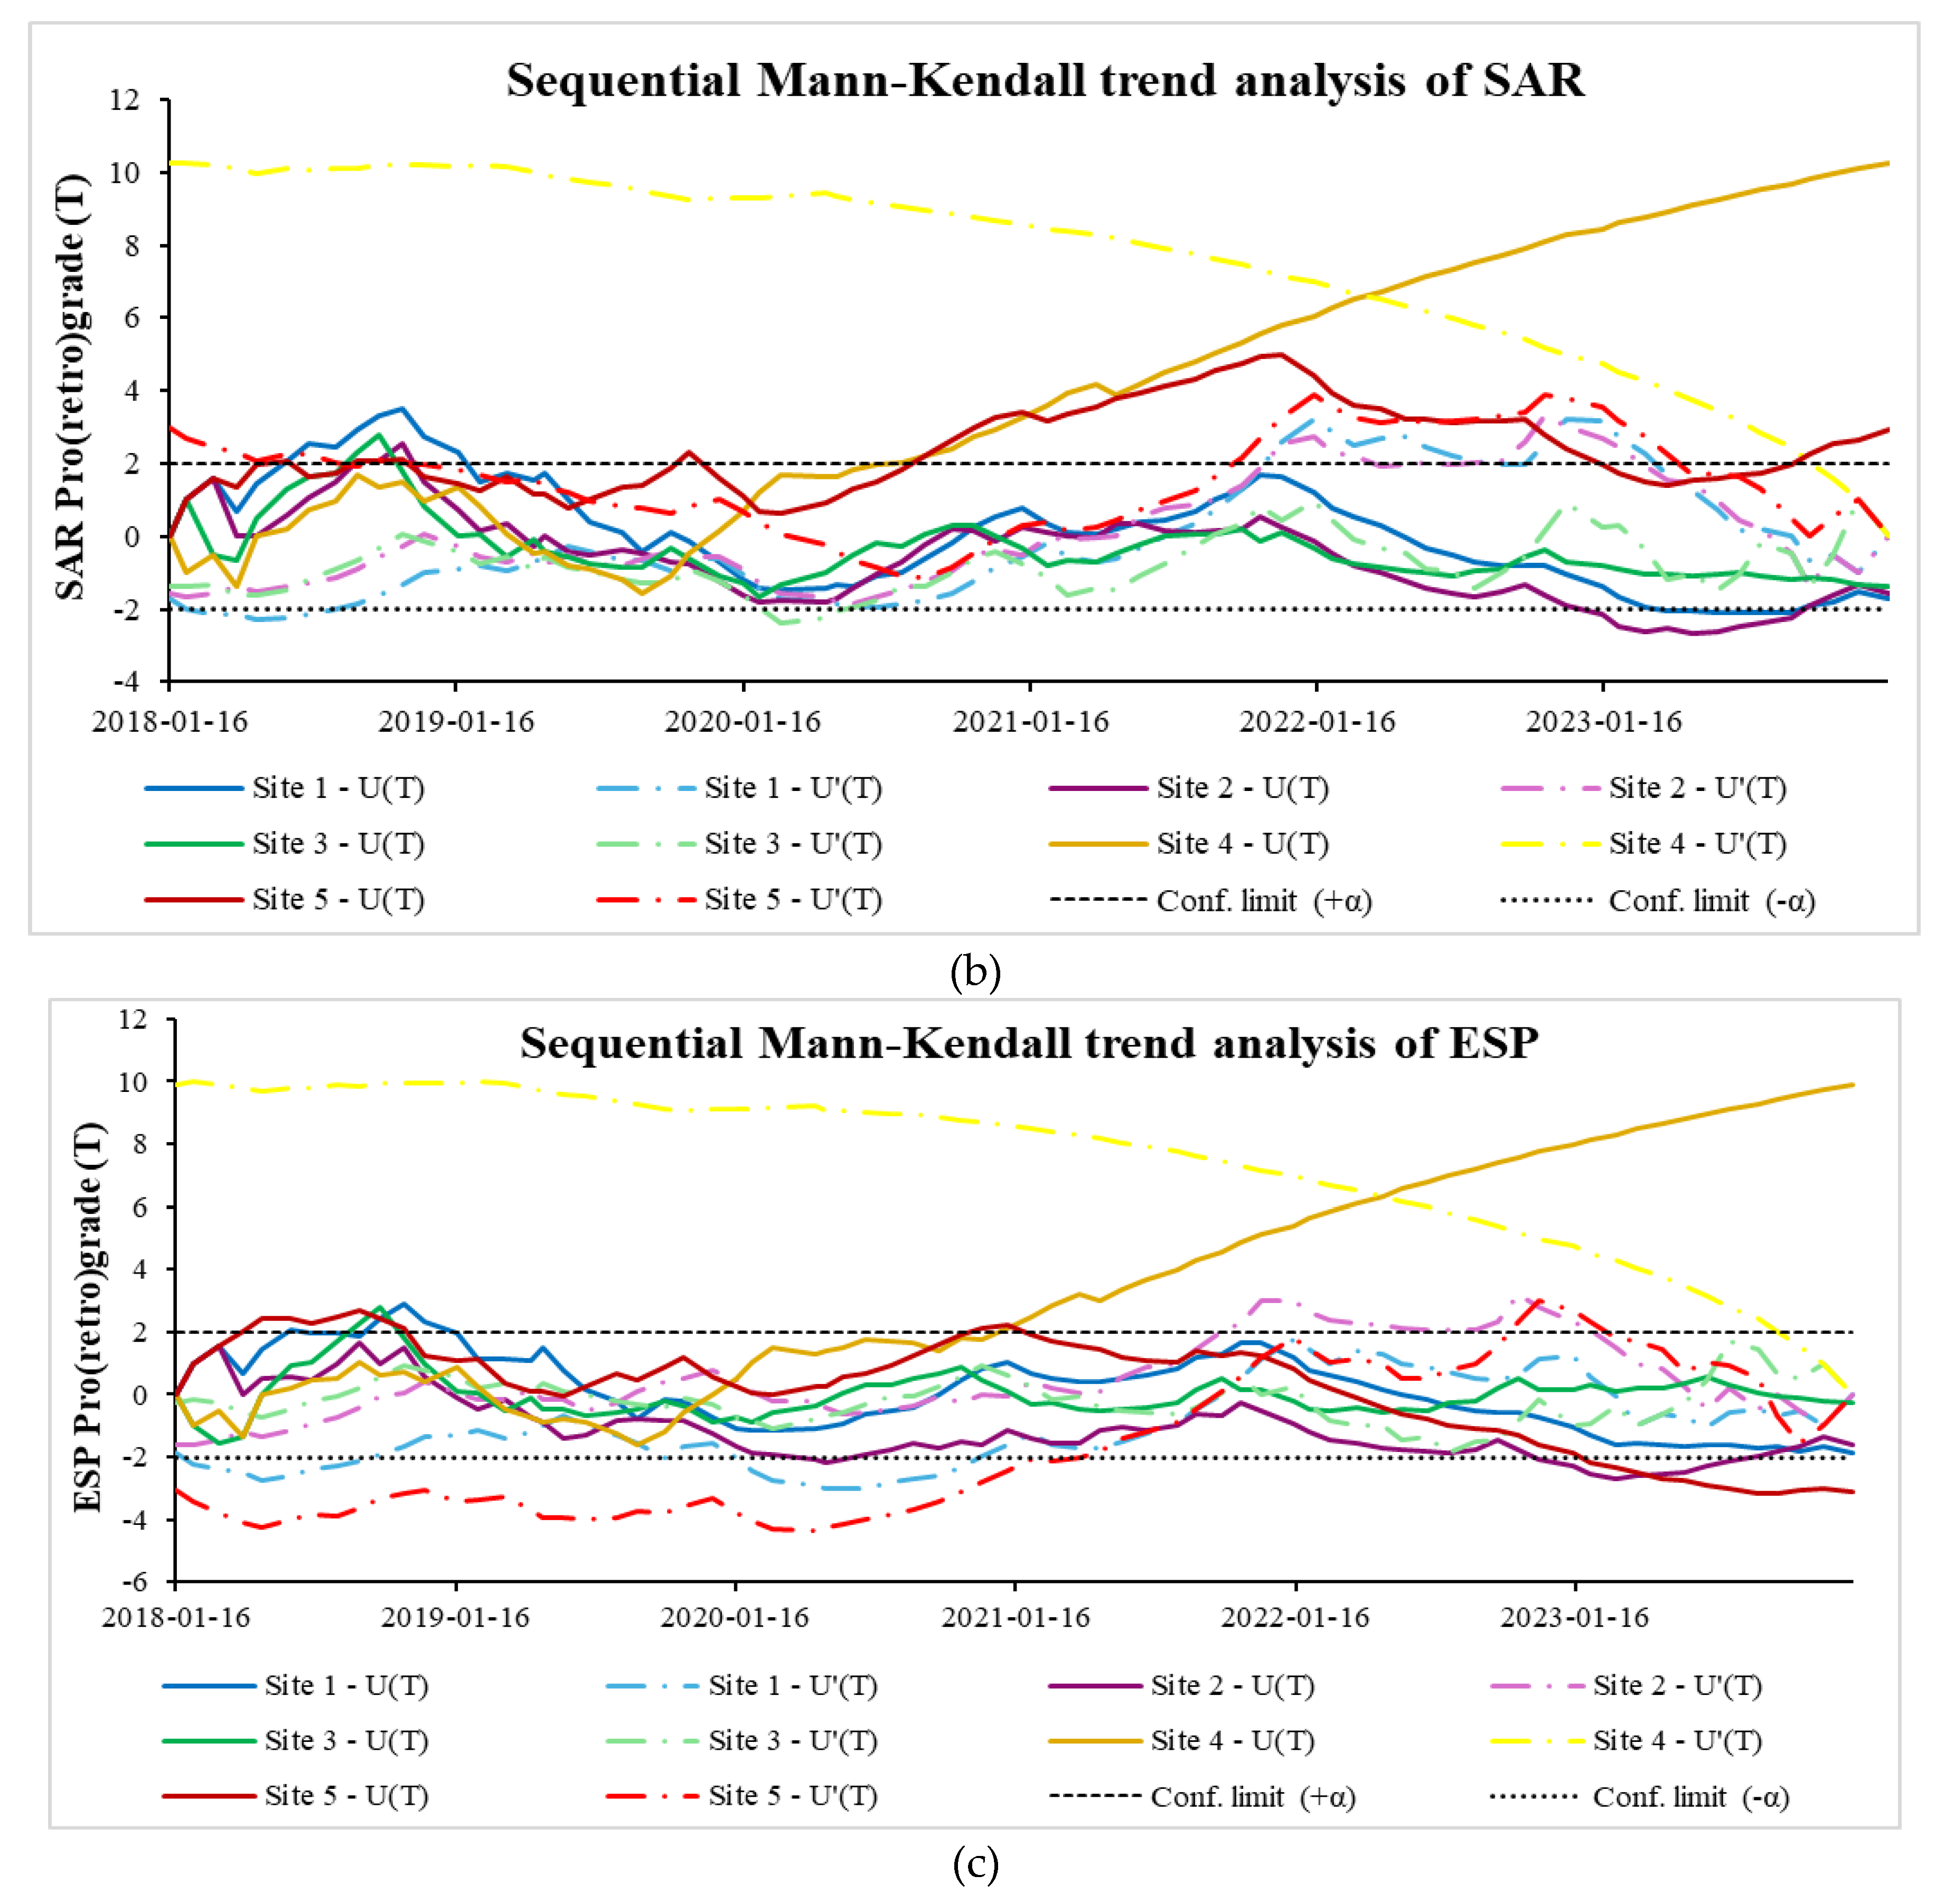
Figure 9.
Correlation heat map for the selected water quality variables (key indicators of coal mining impacts).
Figure 9.
Correlation heat map for the selected water quality variables (key indicators of coal mining impacts).
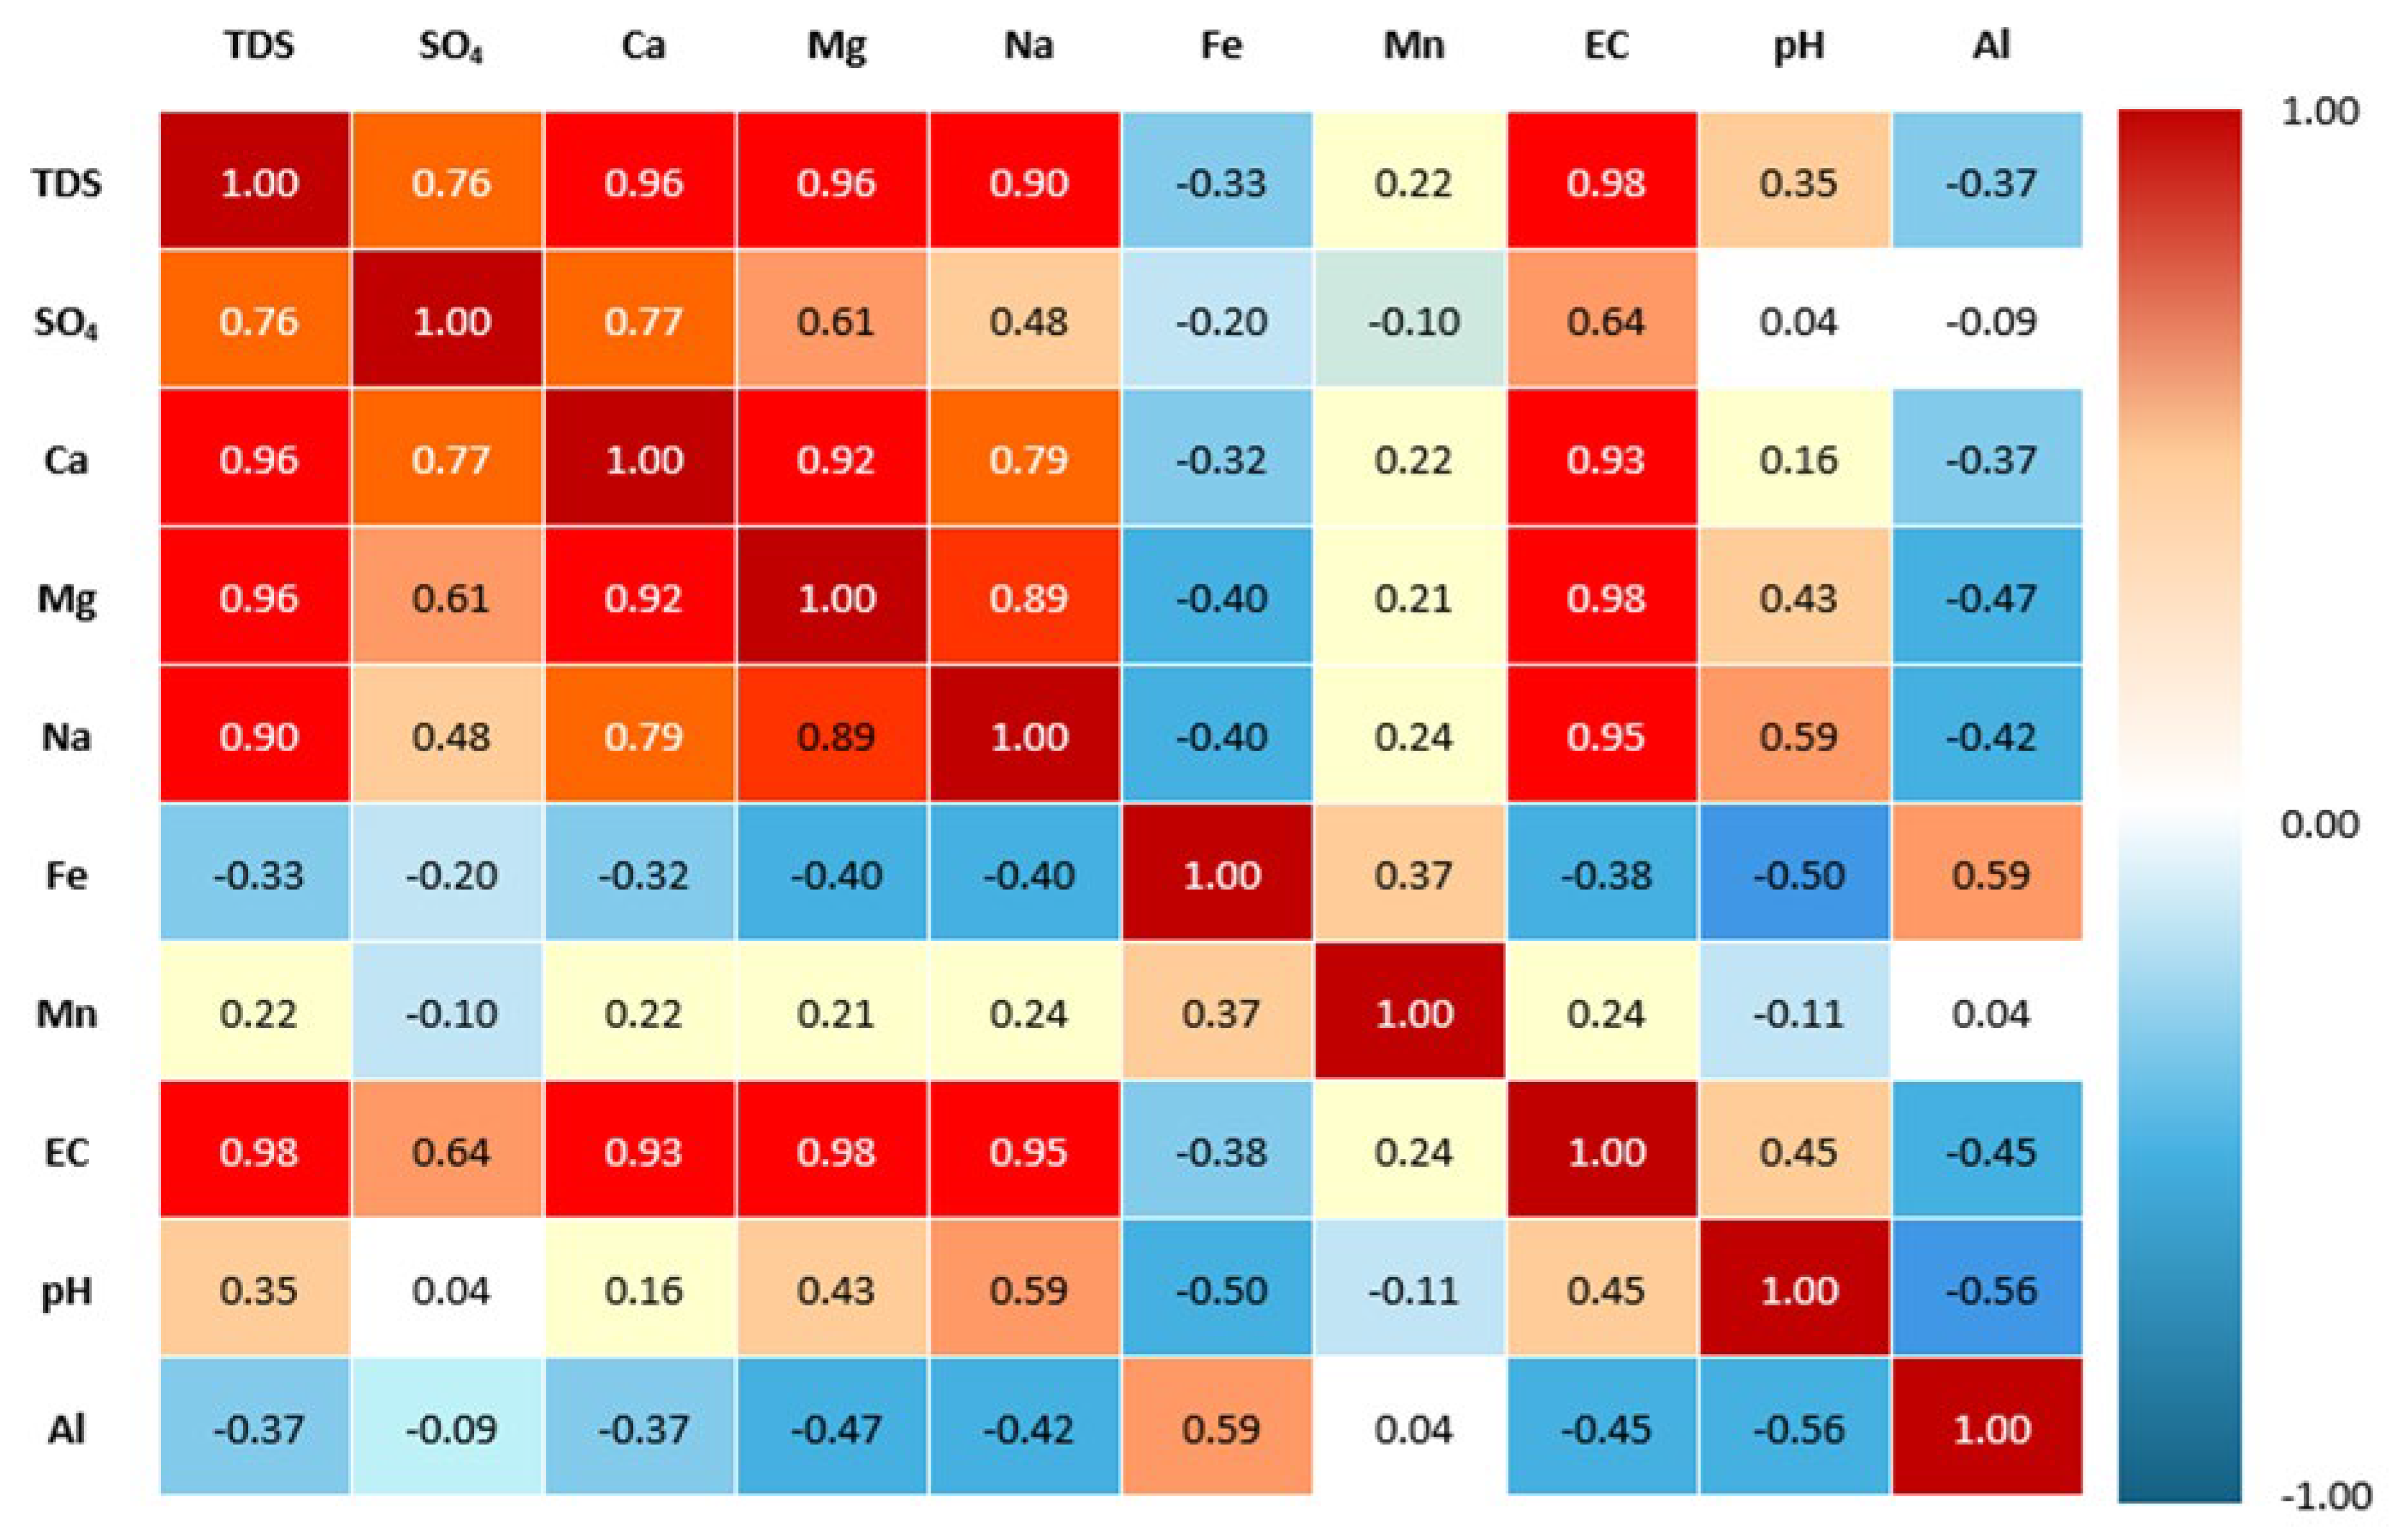

Table 1.
Monitoring localities and geographical coordinates.
| Site | Co-ordinates | Description | |
|---|---|---|---|
| Latitude | Longitude | ||
| Site 1 | 26° 08' 26.03" S | 29° 29' 46.85" E | Located upstream of the mining area in Leeuwfonteinspruit. |
| Site 2 | 26° 08' 16.00" S | 29° 29' 16.69" E | Located upstream of the mining area (north-east) in a non-perennial stream of the Leeuwfonteinspruit. |
| Site 3 | 26° 08' 54.67" S | 29° 29' 18.78" E | Located upstream of the mining area (southeast) in a non-perennial stream of the Leeuwfonteinspruit. |
| Site 4 | 26° 08' 21.39" S | 29° 28' 24.83" E | Located upstream of the mining area (northern site) in a non-perennial stream of the Leeuwfonteinspruit. |
| Site 5 | 26° 09' 6.64" S | 29° 28' 11.68" E | Located downstream of the mining area in the Leeuwfonteinspruit. |
Table 2.
CCME-WQI rankings for the water quality classifications.
| Water Quality Index Level | Water quality rank |
|---|---|
| 0 – 44 | Poor |
| 45 – 64 | Marginal |
| 65 – 79 | Fair |
| 80 – 94 | Good |
| 95 - 100 | Excellent |
Table 3.
Annual average water quality results for selected parameters from 2018 to 2023.
| Chemical Variables | TDS (mg/l) | SO4 (mg/l) |
Ca (mg/l) |
Mg (mg/l) |
Na (mg/l) |
Fe (mg/l) |
Mn (mg/l) |
EC (mS/m) |
pH | Al (mg/l) |
|
|---|---|---|---|---|---|---|---|---|---|---|---|
| TWQR | Domestic use | 450 | 200 | 32 | 30 | 100 | 0,10 | 0,05 | 70 | 6.0-9.0 | 0,15 |
| Aquatic ecosystem | NA | NA | NA | NA | NA | NA | 0,18 | NA | NA | 0,01 | |
| Agricultural: Irrigation | 40 | NA | NA | NA | 70 | 5 | 0,02 | 40 | 6.5-8.4 | 5 | |
| Agricultural: Livestock | 1000 | 1000 | 1000 | 500 | 2000 | 10 | 10 | 150 | NA | 5 | |
| 2018 | Site 1 | 296,00 | 40,30 | 23,18 | 16,36 | 49,16 | 0,45 | 0,02 | 49,54 | 8,16 | 0,08 |
| Site 2 | 486,33 | 108,48 | 47,04 | 26,99 | 72,87 | 0,20 | 0,17 | 75,75 | 7,77 | 0,14 | |
| Site 3 | 445,83 | 23,89 | 46,44 | 24,03 | 74,76 | 2,65 | 2,52 | 72,98 | 7,62 | 0,46 | |
| Site 4 | 182,50 | 57,31 | 30,83 | 8,02 | 12,71 | 0,22 | 0,03 | 28,18 | 6,77 | 0,24 | |
| Site 5 | 249,00 | 65,15 | 28,91 | 13,54 | 33,03 | 0,10 | 0,01 | 40,43 | 7,45 | 0,09 | |
| 2019 | Site 1 | 294,67 | 59,18 | 27,19 | 16,94 | 41,07 | 0,40 | 0,04 | 47,28 | 8,06 | 0,49 |
| Site 2 | 355,50 | 77,52 | 42,45 | 19,69 | 48,76 | 0,43 | 0,63 | 56,47 | 7,53 | 0,30 | |
| Site 3 | 421,17 | 69,07 | 45,33 | 24,14 | 57,02 | 1,02 | 0,91 | 65,86 | 7,36 | 0,14 | |
| Site 4 | 196,00 | 89,00 | 16,60 | 6,73 | 19,35 | 4,93 | 0,67 | 24,55 | 6,76 | 2,65 | |
| Site 5 | 369,00 | 137,58 | 38,58 | 18,98 | 41,45 | 0,77 | 0,06 | 54,79 | 7,36 | 1,06 | |
| 2020 | Site 1 | 277,17 | 55,99 | 22,02 | 14,78 | 44,20 | 0,24 | 0,02 | 44,44 | 8,00 | 0,11 |
| Site 2 | 584,17 | 144,49 | 61,22 | 34,48 | 72,62 | 0,70 | 2,95 | 86,89 | 7,86 | 0,43 | |
| Site 3 | 377,50 | 52,19 | 38,89 | 21,02 | 62,20 | 0,49 | 0,32 | 60,82 | 7,62 | 0,92 | |
| Site 4 | 204,00 | 89,31 | 20,24 | 7,49 | 19,98 | 1,08 | 0,20 | 25,45 | 6,82 | 2,34 | |
| Site 5 | 477,83 | 234,58 | 46,97 | 21,83 | 60,65 | 0,22 | 0,06 | 67,98 | 7,75 | 0,29 | |
| 2021 | Site 1 | 310,67 | 64,76 | 22,23 | 16,59 | 51,89 | 0,20 | 0,01 | 50,28 | 8,31 | 0,10 |
| Site 2 | 441,83 | 104,84 | 45,01 | 26,04 | 64,88 | 0,25 | 0,06 | 71,34 | 7,83 | 0,31 | |
| Site 3 | 495,50 | 58,84 | 49,52 | 33,05 | 68,72 | 0,67 | 0,34 | 77,62 | 7,84 | 0,25 | |
| Site 4 | 222,50 | 71,90 | 25,25 | 10,31 | 12,22 | 4,53 | 1,19 | 32,38 | 6,98 | 0,48 | |
| Site 5 | 674,00 | 366,00 | 70,96 | 33,93 | 82,82 | 0,10 | 0,03 | 94,28 | 7,88 | 0,08 | |
| 2022 | Site 1 | 238,83 | 26,05 | 22,50 | 14,32 | 30,43 | 0,13 | 0,02 | 37,28 | 7,68 | 0,08 |
| Site 2 | 355,17 | 75,04 | 39,84 | 20,79 | 42,20 | 0,41 | 0,07 | 55,51 | 7,54 | 0,28 | |
| Site 3 | 285,17 | 26,61 | 29,28 | 14,01 | 39,46 | 1,30 | 0,47 | 42,67 | 7,44 | 0,38 | |
| Site 4 | 311,00 | 83,83 | 32,04 | 14,82 | 34,19 | 1,30 | 0,54 | 45,08 | 7,07 | 1,02 | |
| Site 5 | 467,17 | 188,36 | 53,25 | 28,75 | 49,53 | 0,39 | 0,19 | 66,66 | 7,27 | 0,16 | |
| 2023 | Site 1 | 285,50 | 37,23 | 26,87 | 18,82 | 38,27 | 0,17 | 1,09 | 45,98 | 7,59 | 0,06 |
| Site 2 | 412,00 | 86,86 | 42,93 | 24,59 | 55,96 | 0,34 | 0,16 | 64,91 | 7,59 | 0,39 | |
| Site 3 | 322,33 | 32,17 | 36,61 | 20,05 | 43,86 | 0,42 | 0,29 | 53,19 | 7,34 | 0,08 | |
| Site 4 | 503,27 | 159,90 | 51,57 | 25,08 | 65,88 | 0,16 | 1,74 | 73,16 | 7,20 | 0,15 | |
| Site 5 | 690,50 | 360,30 | 77,78 | 39,00 | 72,92 | 0,13 | 0,03 | 95,21 | 7,51 | 0,08 | |
Table 4.
Frequency distribution of WQI classes across monitoring sites in the Leeuwfonteinspruit.
| WQI Class | Range | Site 1 | Site 2 | Site 3 | Site 4 | Site 5 |
|---|---|---|---|---|---|---|
| Excellent | WQI ≤ 25 | 6 | 7 | 2 | 2 | 5 |
| Good | 26 ≤ WQI ≤ 50 | 27 | 14 | 20 | 9 | 14 |
| Poor | 51 ≤ WQI ≤ 75 | 18 | 18 | 9 | 6 | 19 |
| Very Poor | 76 ≤ WQI ≤ 100 | 3 | 5 | 5 | 2 | 14 |
| Unsuitable for Use | WQI > 100 | 18 | 28 | 36 | 22 | 20 |
Table 5.
Annual CCME-WQI scores and water quality rankings for sampling Sites 1-5 (2018-2023).
| Year | Sampling Site | F1 | F2 | F3 | CCME WQI | WQI Ranking |
|---|---|---|---|---|---|---|
| 2018 | Site 1 | 42,86 | 10,71 | 21,43 | 71,92 | Fair |
| Site 2 | 78,57 | 30,36 | 29,55 | 49,23 | Marginal | |
| Site 3 | 71,43 | 30,36 | 84,98 | 34,07 | Poor | |
| Site 4 | 28,57 | 21,43 | 16,99 | 79,83 | Good | |
| Site 5 | 28,57 | 38,69 | 4,74 | 82,69 | Good | |
| 2019 | Site 1 | 50,00 | 17,26 | 30,34 | 64,79 | Fair |
| Site 2 | 64,29 | 24,40 | 55,15 | 49,11 | Marginal | |
| Site 3 | 71,43 | 25,00 | 67,06 | 41,62 | Poor | |
| Site 4 | 21,43 | 21,43 | 84,65 | 48,09 | Marginal | |
| Site 5 | 71,43 | 25,60 | 51,79 | 46,96 | Marginal | |
| 2020 | Site 1 | 42,86 | 8,93 | 10,80 | 73,97 | Fair |
| Site 2 | 78,57 | 35,12 | 83,09 | 30,93 | Poor | |
| Site 3 | 64,29 | 20,24 | 53,92 | 50,17 | Marginal | |
| Site 4 | 21,43 | 14,29 | 66,67 | 58,74 | Marginal | |
| Site 5 | 71,43 | 26,79 | 27,62 | 53,16 | Marginal | |
| 2021 | Site 1 | 57,14 | 10,71 | 8,33 | 66,09 | Fair |
| Site 2 | 78,57 | 30,36 | 23,61 | 49,49 | Marginal | |
| Site 3 | 78,57 | 30,36 | 51,76 | 42,92 | Poor | |
| Site 4 | 28,57 | 21,43 | 83,25 | 47,70 | Marginal | |
| Site 5 | 64,29 | 38,69 | 19,66 | 55,22 | Marginal | |
| 2022 | Site 1 | 21,43 | 4,76 | 4,44 | 87,07 | Good |
| Site 2 | 42,86 | 20,24 | 28,01 | 68,22 | Fair | |
| Site 3 | 35,71 | 13,69 | 60,88 | 58,49 | Marginal | |
| Site 4 | 57,14 | 21,43 | 67,01 | 47,67 | Marginal | |
| Site 5 | 64,29 | 30,95 | 36,81 | 53,65 | Marginal | |
| 2023 | Site 1 | 50,00 | 11,90 | 61,04 | 53,93 | Marginal |
| Site 2 | 71,43 | 24,40 | 35,95 | 51,73 | Marginal | |
| Site 3 | 50,00 | 17,26 | 38,54 | 62,21 | Marginal | |
| Site 4 | 78,57 | 31,82 | 72,62 | 35,55 | Poor | |
| Site 5 | 57,14 | 31,55 | 25,07 | 59,63 | Marginal |
Table 6.
Summary of the principal axis factoring for Sites 1 – 5 (components with eigenvalues > 1).
| Sampling Sites | Component | Initial Eigenvalues | Rotation sums of squared loadings | ||||
|---|---|---|---|---|---|---|---|
| Total | % of variance | Cumulative % | Total | % of variance | Cumulative % | ||
| Site 1 | 1 | 6,77 | 35,64 | 35,64 | 5,83 | 30,68 | 30,68 |
| 2 | 2,53 | 13,32 | 48,95 | 2,32 | 12,23 | 42,91 | |
| 3 | 2,14 | 11,25 | 60,85 | 2,18 | 11,47 | 54,38 | |
| 4 | 1,83 | 9,65 | 69,85 | 2,13 | 11,21 | 65,59 | |
| 5 | 1,15 | 6,05 | 75,90 | 1,94 | 10,19 | 75,78 | |
| 6 | 1,00 | 5,28 | 81,18 | 1,03 | 5,40 | 81,18 | |
| Site 2 | 1 | 9,27 | 48,81 | 48,81 | 8,77 | 46,16 | 46,16 |
| 2 | 3,10 | 16,29 | 65,10 | 3,06 | 16,09 | 62,24 | |
| 3 | 1,85 | 9,73 | 74,83 | 2,38 | 12,55 | 74,79 | |
| 4 | 1,13 | 5,96 | 80,79 | 1,14 | 6,00 | 80,79 | |
| Site 3 | 1 | 8,07 | 42,46 | 42,46 | 7,30 | 38,41 | 38,41 |
| 2 | 2,35 | 12,37 | 54,83 | 2,36 | 12,39 | 50,80 | |
| 3 | 1,77 | 9,33 | 64,17 | 2,09 | 10,98 | 61,78 | |
| 4 | 1,20 | 6,31 | 70,48 | 1,44 | 7,60 | 69,37 | |
| 5 | 1,14 | 6,00 | 76,47 | 1,27 | 6,69 | 76,06 | |
| 6 | 1,10 | 5,79 | 82,26 | 1,18 | 6,20 | 82,26 | |
| Site 4 | 1 | 7,63 | 40,16 | 40,16 | 5,89 | 30,99 | 30,99 |
| 2 | 3,10 | 16,29 | 56,45 | 3,97 | 20,89 | 51,87 | |
| 3 | 1,78 | 9,35 | 65,80 | 2,51 | 13,23 | 65,10 | |
| 4 | 1,39 | 7,33 | 73,12 | 1,43 | 7,51 | 72,61 | |
| 5 | 1,03 | 5,40 | 78,52 | 1,10 | 5,77 | 78,38 | |
| 6 | 1,01 | 5,29 | 83,81 | 1,03 | 5,43 | 83,81 | |
| Site 5 | 1 | 7,44 | 39,18 | 39,18 | 7,15 | 37,65 | 37,65 |
| 2 | 3,53 | 18,59 | 57,76 | 3,13 | 16,45 | 54,10 | |
| 3 | 1,93 | 10,16 | 67,92 | 2,16 | 11,39 | 65,49 | |
| 4 | 1,85 | 9,73 | 77,65 | 2,05 | 10,78 | 76,27 | |
| 5 | 1,06 | 5,57 | 83,22 | 1,32 | 6,95 | 83,22 | |
Table 7.
Rotated component matrix of squared variable loadings for Site 1 – 5.
| Sites | Component | Variables | ||||||||||||||||||
|---|---|---|---|---|---|---|---|---|---|---|---|---|---|---|---|---|---|---|---|---|
| Turbidity | Na | EC | TDS | K | SO4 | Mg | pH | N | Ca | SS | Al | Fe | Cl | F | Alk | Mn | PO4 | Hardness | ||
| Site 1 | 1 | 0,94 | 0,89 | 0,88 | 0,79 | 0,69 | 0,67 | 0,61 | 0,95 | 0,52 | ||||||||||
| 2 | 0,44 | 0,73 | 0,65 | 0,61 | 0,53 | |||||||||||||||
| 3 | 0,66 | 0,87 | 0,76 | |||||||||||||||||
| 4 | 0,42 | 0,87 | 0,82 | |||||||||||||||||
| 5 | 0,47 | 0,57 | 0,78 | 0,57 | ||||||||||||||||
| 6 | 0.96 | |||||||||||||||||||
| Site 2 | 1 | 0,86 | 0,94 | 0,97 | 0,60 | 0,85 | 0,97 | 0,92 | 0,64 | 0,92 | 0,60 | 0,84 | 0,98 | |||||||
| 2 | 0,94 | 0,51 | 0,90 | 0,74 | 0,49 | 0,41 | ||||||||||||||
| 3 | 0,72 | 0,74 | 0,60 | |||||||||||||||||
| 4 | 0,96 | |||||||||||||||||||
| Site 3 | 1 | 0,87 | 0,96 | 0,96 | 0,80 | 0,55 | 0,92 | 0,77 | 0,87 | 0,62 | 0,26 | 0,89 | ||||||||
| 2 | 0,54 | 0,54 | 0,64 | 0,83 | ||||||||||||||||
| 3 | 0,78 | 0,46 | 0,74 | 0,58 | ||||||||||||||||
| 4 | 0,87 | 0,48 | ||||||||||||||||||
| 5 | 0,74 | 0,59 | ||||||||||||||||||
| 6 | 0,90 | |||||||||||||||||||
| Site 4 | 1 | 0,48 | 0,75 | 0,88 | 0,94 | 0,82 | 0,93 | 0,81 | 0,91 | |||||||||||
| 2 | 0,83 | 0,63 | 0,63 | 0,88 | 0,86 | |||||||||||||||
| 3 | 0,76 | 0,84 | 0,55 | 0,83 | ||||||||||||||||
| 4 | 0,69 | 0,91 | ||||||||||||||||||
| 5 | 0,97 | |||||||||||||||||||
| 6 | 0,98 | |||||||||||||||||||
| Site 5 | 1 | 0.93 | 0.98 | 0.98 | 0.97 | 0.96 | 0.53 | 0.97 | 0.98 | |||||||||||
| 2 | 0.52 | 0.93 | 0.93 | 0.90 | ||||||||||||||||
| 3 | 0.85 | 0.56 | 0.88 | |||||||||||||||||
| 4 | 0.96 | 0.92 | ||||||||||||||||||
| 5 | 0.62 | 0.77 | 0.49 | |||||||||||||||||
Disclaimer/Publisher’s Note: The statements, opinions and data contained in all publications are solely those of the individual author(s) and contributor(s) and not of MDPI and/or the editor(s). MDPI and/or the editor(s) disclaim responsibility for any injury to people or property resulting from any ideas, methods, instructions or products referred to in the content. |
© 2026 by the authors. Licensee MDPI, Basel, Switzerland. This article is an open access article distributed under the terms and conditions of the Creative Commons Attribution (CC BY) license (http://creativecommons.org/licenses/by/4.0/).
Copyright: This open access article is published under a Creative Commons CC BY 4.0 license, which permit the free download, distribution, and reuse, provided that the author and preprint are cited in any reuse.


