

Submitted:
22 May 2026
Posted:
25 May 2026
You are already at the latest version
Abstract
This study presents a hydrogeochemical assessment of formation waters from the Karazhanbas, Zhetybay, and Uzen oil fields in the Mangystau Region of Kazakhstan, with the objective of elucidating the distribution of lithium, identifying the geochemical factors governing its accumulation, and evaluating its extraction potential. The investigation considered key physicochemical parameters, ionic composition, lithium concentrations, and the relationships between Li, total dissolved solids (TDS), pH, and major cations. Major ions were determined by standard hydrochemical methods, while lithium concentrations were analyzed via inductively coupled plasma optical emission spectrometry (ICP-OES). Results indicate that all investigated waters belong primarily to the calcium-chloride type according to Sulin’s classification. In terms of TDS, the sequence of increasing salinity is Uzen > Zhetybay > Karazhanbas. Specifically, TDS values for Karazhanbas range from 3,725.9 to 40,891.3 mg/dm³, for Zhetybay from 110,800.1 to 150,104.8 mg/dm³, and for Uzen from 130,387.4 to 163,107.1 mg/dm³. Lithium content varies from 0.30-0.70 mg/dm³ in Karazhanbas waters to 1.40-1.85 mg/dm³ in Zhetybay, while Uzen waters reach concentrations of 1.51 mg/dm³. Positive correlations were established between Li and Ca²⁺, Mg²⁺, and Na⁺+K⁺, suggesting that lithium accumulation is linked to the overall salt matrix and water-rock interaction processes. The data demonstrate that maximum mineralization does not always correspond to maximum lithium content. Zhetybay is identified as the most promising site for further lithium-oriented research. The formation waters of the Mangystau Region may be considered a potential secondary hydromineral resource; however, their industrial feasibility requires further geochemical, technological, and environmental evaluation.
Keywords:
lithium
; hydrogeochemistry
; water mineralization
; formation waters
; oil fields
; ion-salt composition of water
1. Introduction
Lithium has emerged as one of the most sought-after critical elements in recent years, playing a pivotal role in the development of modern energy technologies. Its primary application lies in the production of lithium-ion batteries, which are integral to electric vehicles, portable electronics, and renewable energy storage systems. The escalating global demand for lithium is driven by nations transitioning to a low-carbon economy, the expansion of the electric vehicle market, and the increasing need for energy storage from solar and wind sources. Consequently, the exploration for novel lithium sources has become a critical objective not only for geologists and chemists but also for the energy, industrial, and environmental policy sectors of numerous countries [1,2].
Traditionally, lithium is sourced from two main types of raw materials: hard rock ores, primarily pegmatites, and natural brines from closed salt-lake basins. However, in recent years, increasing attention has been directed towards unconventional aqueous lithium sources, including geothermal waters, oilfield formation waters, and produced water from oil and gas operations [3,4,5]. These waters are particularly compelling because they are already brought to the surface during oil and gas extraction. Thus, with efficient processing technologies, they can be re-evaluated not merely as waste products but as potential hydromineral resources [6,7].
Historically, formation and produced waters were often regarded as complex byproducts of oil extraction, necessitating treatment, disposal, or reinjection into the reservoir. However, contemporary research indicates that highly mineralized waters from oil and gas basins can contain not only major salts of sodium, calcium, and magnesium but also valuable trace components, including lithium, strontium, barium, and bromine [4,6,8]. Liu et al. emphasize that evaluating the feasibility of lithium extraction from oil and gas produced water requires consideration of not only lithium concentration but also the volume of produced water, total salinity, the composition of co-occurring ions, and the availability of processing technologies [6]. Similarly, Gerardo et al. demonstrate that the viability of produced waters as a lithium source is dictated by regional conditions, production volumes, and the proximity of target sites to processing infrastructure [7].
Lithium accumulation in formation waters is governed by a confluence of geological and geochemical factors. These include lithological composition of the host rocks, temperature, pH, total mineralization, residence time of water-rock interaction, dissolution of evaporite minerals, evaporative concentration, and ion exchange processes [8,9,10]. Lithium can enter solution through interaction with argillaceous, volcanic, sedimentary, or saline rock formations. Therefore, its distribution in natural waters is typically linked not to a single factor but to the protracted geochemical evolution of the aqueous system. Yu et al., for instance, demonstrated that lithium enrichment in oilfield brines of the Jianghan Basin is correlated with the interaction of brines with lithium-bearing minerals in sedimentary rocks, as well as with the isotopic and hydrochemical characteristics of the formation waters [8,9].
Concurrently with geochemical investigations, direct lithium extraction (DLE) technologies from brines are rapidly advancing. These include selective adsorption, ion exchange, membrane processes, solvent extraction, electrochemical methods, and integrated pre-treatment schemes [11,12,13,14,15]. In contrast to traditional evaporative methods, DLE technologies potentially enable faster lithium recovery and require smaller land footprints. However, their efficiency is highly dependent on the specific water composition, including high mineralization, Li/Mg ratio, concentrations of Ca²⁺ and Mg²⁺, organic matter content, and other competing components [12,13]. Wang et al. underscored that the composition of oil and gas produced waters significantly influences the effectiveness of DLE, highlighting the necessity for a distinct geochemical and technological appraisal for each aqueous system [13].
The Mangystau region of Kazakhstan presents a compelling case for studying lithium in oilfield waters. Situated in the western part of the country along the Caspian Sea coastline, the region is characterized by an arid climate, limited freshwater resources, complex geological structures, and significant oil and gas reserves. Extensive sedimentary, carbonate, and evaporite formations are widespread here, alongside major oil fields. While available information suggests that the Mangystau region contains saline and mineralized waters that could be potential sources of lithium and other strategically important elements, the hydrogeochemical characteristics of these waters, particularly concerning lithium, remain insufficiently understood.
For Kazakhstan, the study of lithium in formation and produced waters from oil operations holds both scientific and practical significance. From a scientific perspective, such investigations contribute to understanding the processes that control lithium accumulation in highly mineralized waters within arid oil- and gas-bearing regions. From a practical standpoint, they allow for the assessment of oilfield waters as a secondary source of critical elements. This is particularly relevant for Mangystau, where a substantial oil and gas infrastructure, freshwater scarcity, and the imperative for environmentally sustainable management of industrial water streams coexist.
The objective of the present study is to conduct a comprehensive hydrogeochemical assessment of oilfield waters in the Mangystau region, focusing on lithium content, ionic-salt composition characteristics, patterns of Li distribution, and prospects for its future extraction. The findings of this research are intended to provide a foundation for subsequent investigations into the lithium potential of Kazakhstan’s formation waters and for the development of environmentally sound technologies for processing highly mineralized waters.
2. Materials and Methods
2.1. Study Area and Objects
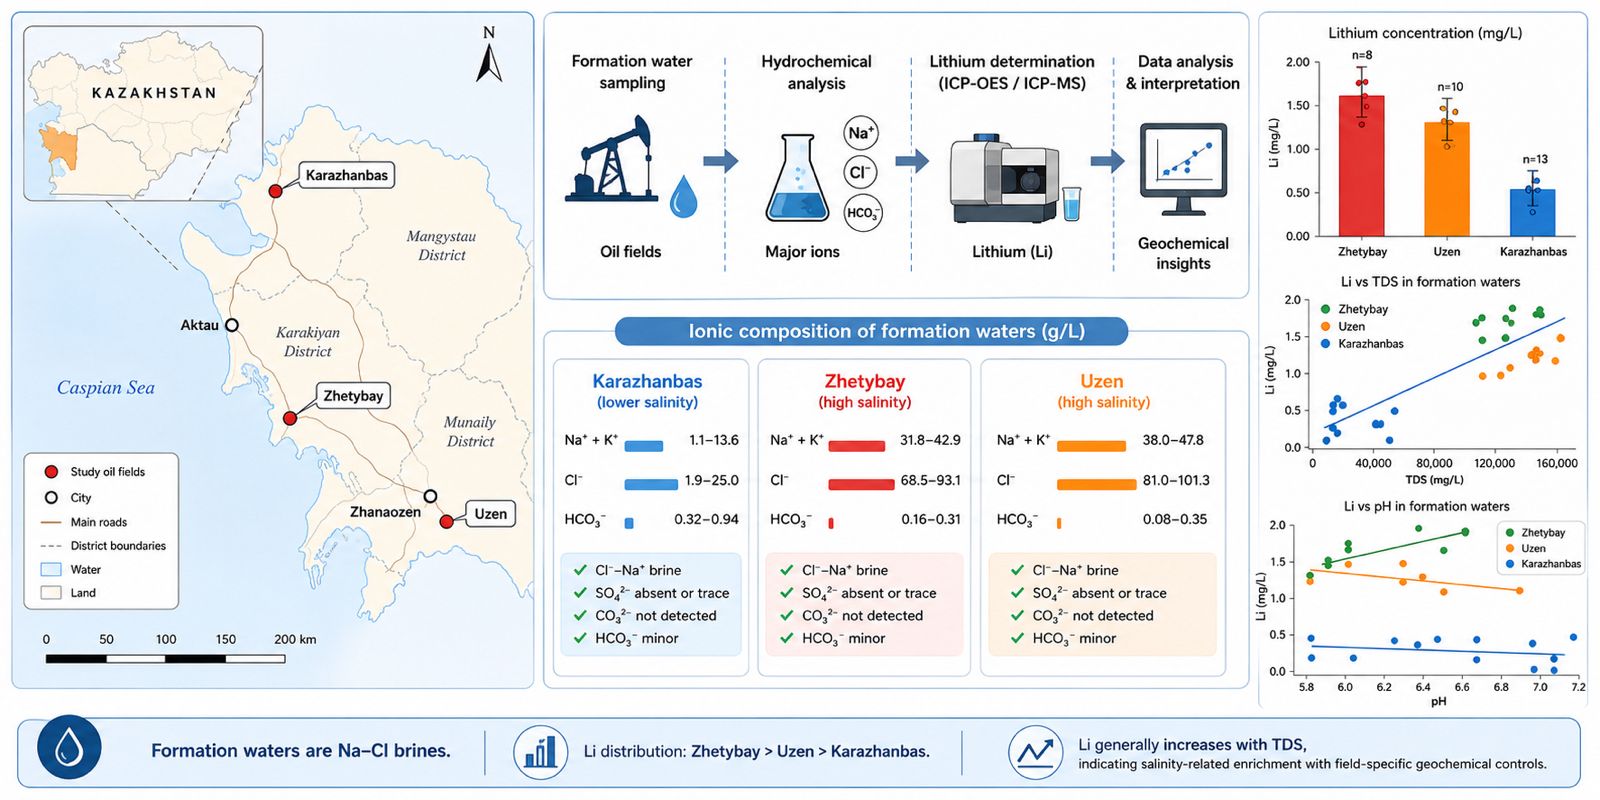
The objects of this study were the formation waters from the Karazhanbas, Zhetybay, and Uzen oil fields, all situated within the Mangystau region of the Republic of Kazakhstan. These fields represent some of the largest oil and gas deposits in the region, located within the Mangystau oil and gas basin. This basin is characterized by arid climatic conditions, extensive sedimentary rock formations, and high mineralization of both groundwater and formation waters. The geographical locations of the studied sites within the Mangystau region are depicted in Figure 1.
The Karazhanbas field, located on the Buzachi in the northwestern part of the Mangystau region, is recognized for its highly mineralized formation waters. These waters are formed under conditions of intense interaction between water and saline sequences within the sedimentary complex. The Zhetybay field is situated in the southern part of the Mangystau region and is a major oil and gas asset of the South Mangyshlak oil and gas province. The Uzen field, located near the city of Zhanaozen, is also among the most significant oil fields in the region, distinguished by its complex geological structure and the widespread occurrence of highly mineralized formation waters.
2.2. Sample Collection and Preservation
Formation water samples were meticulously collected from representative wells across the Karazhanbas, Zhetybay, and Uzen oil fields. Sampling points were strategically selected to capture the hydrogeochemical variability across the primary productive zones. To prevent contamination and preserve the inherent chemical integrity of the samples, standardized procedures for collection, filtration, preservation, and transportation were employed. Such rigorous field protocols are widely adopted in international studies of oilfield brines and produced waters, as sample integrity is crucial for accurate interpretation of major ion and trace element concentrations [15,16].
All samples were collected into pre-cleaned, acid-washed HDPE or PFA bottles, utilizing pre-rinsed tubing and contact surfaces. Prior to sample collection, sampling lines were thoroughly flushed to remove stagnant water and ensure the acquisition of a representative formation water sample. Metadata recorded in the field included sampling point coordinates, collection time, sample identification number, instrument settings, stabilization criteria, and quality assurance/quality control (QA/QC) tags. The acquired data were subsequently integrated into a database linked to a Geographic Information System (GIS), ensuring traceability, reproducibility, and facilitating subsequent spatial interpretation.
For chemical analysis, each sample was aliquoted into separate containers intended for: major ion analysis; trace elements and metals, including lithium; and auxiliary components such as barium and strontium. Aliquots designated for the analysis of dissolved elements were filtered in the field through 0.45 µm membrane filters. This filtration threshold aligns with the approach of US EPA Method 200.7, where dissolved components are defined as substances passing through a 0.45 µm membrane filter prior to acidification [17].
Aliquots for trace element analysis were acidified with ultra-pure nitric acid to a pH of < 2, whereas samples for major ion determination were stored without acidification. The use of high-purity nitric acid and sample acidification is recommended for trace element analysis, as it stabilizes dissolved metal species and minimizes the risk of analytical loss during storage [18]. All samples were stored in insulated containers at 4 ± 2 °C and transported to the laboratory within 48 hours. Chain-of-custody forms accompanied all stages from field collection to laboratory analysis. Quality control procedures included transportation blanks, field blanks, equipment blanks, and blind duplicates. Duplicates were collected at a minimum frequency of one duplicate sample for every ten field samples. These procedures were implemented to control for potential contamination during sample collection, filtration, transportation, and laboratory preparation.
2.3. Analytical Methods
In the laboratory, the fundamental physicochemical parameters of the samples were determined, including temperature, pH, density, total dissolved solids (TDS), total mineralization, and total hardness. pH values were measured potentiometrically using a pre-calibrated pH-meter. Density and total mineralization were determined in accordance with standard hydrochemical procedures applicable to the analysis of natural, groundwater, and highly mineralized water samples [19].
The concentrations of major ions, including Ca²⁺, Mg²⁺, Na⁺ + K⁺, Cl⁻, SO₄²⁻, CO₃²⁻, and HCO₃⁻, were analyzed using titrimetric methods. Chloride ions were determined by argentometric titration with a silver nitrate solution. Bicarbonate and carbonate ions were quantified by acid-base titration with a standard acid solution, employing appropriate indicators. Calcium and magnesium concentrations were ascertained by complexometric titration with EDTA, and total hardness was calculated from the sum of Ca²⁺ and Mg²⁺ concentrations. Sulfate ions were determined titrimetrically following precipitation as a sparingly soluble barium compound. The sum of sodium and potassium ions was calculated through the ionic balance, considering the measured concentrations of cations and anions, as well as the total mineralization of each sample. Utilizing the major ion balance is a common approach in hydrochemical interpretation of natural and oilfield waters, as it allows for assessing the consistency of analytical results and the specific features of the water’s saline composition [19,20].
The hydrochemical type of the investigated waters was interpreted according to Sulin’s classification, which is widely applied in petroleum hydrogeology to determine the genetic type and evolutionary stage of formation waters. This classification is instrumental in assessing the relationship between water chemistry and hydrocarbon-bearing sedimentary basins, water-rock interaction processes, dissolution of evaporite deposits, and the long-term geochemical transformation of reservoir fluids [20].
The concentrations of lithium and associated trace elements were determined using inductively coupled plasma optical emission spectrometry (ICP-OES) with a Shimadzu ICPE-9000 spectrometer (Japan). The ICP-OES method relies on the excitation of atoms and ions in a high-temperature argon plasma, followed by the measurement of their characteristic emission lines. This method is extensively employed for the quantitative determination of metals and trace elements in natural, groundwater, and oilfield waters due to its capability for multi-element analysis and high sensitivity [17,18].
Prior to instrumental analysis, samples were filtered through 0.45 µm membrane filters to isolate the dissolved fraction. Aliquots designated for lithium and trace element determination were acidified with ultra-pure nitric acid (HNO₃) to a pH of < 2. This procedure ensures the stabilization of dissolved metal forms, prevents their sorption onto container walls, and reduces the risk of compositional changes during storage. Comparable sample preparation protocols are recommended by international guidelines for the analysis of dissolved metals in aqueous samples, including US EPA methods 200.7 and 200.8 [17,18].
Given the high mineralization of the formation waters, selected samples were appropriately diluted with deionized water before ICP-OES analysis. Dilution was performed to mitigate matrix effects, minimize potential spectral and non-spectral interferences, and ensure the analytical signal fell within the established calibration range. Matrix effects, primarily caused by high concentrations of dissolved salts, are considered a significant analytical challenge in determining trace elements in saline waters and oilfield brines by ICP-OES [17,21,22].
Quantitative determination of lithium was performed using calibration curves constructed from standard lithium solutions of known concentrations. Prepared samples were introduced into the nebulizer system, where the solution was converted into an aerosol and transported into the argon plasma. In the plasma, lithium atoms and ions were excited, and the intensity of the characteristic emission line was used to calculate the Li concentration. Results were expressed in mg/L.
The quality of analytical data was controlled using blanks, replicate measurements, calibration verification standards, and analytical signal stability checks. These QA/QC procedures were implemented to minimize analytical uncertainty and ensure reliable determination of lithium and major components in highly mineralized formation waters. This approach aligns with contemporary research practices in oilfield brine analysis, where high mineralization and complex ionic composition necessitate stringent quality control of analytical data [15,16,21,22].
3. Results and Discussion
3.1. General Hydrochemical Characteristics of the Studied Waters
The results of this investigation reveal significant variations in the overall mineralization and ionic-salt composition of formation waters from the Karazhanbas, Zhetybay, and Uzen oil fields. Across all analyzed samples, the predominant components are chloride ions, the sum of sodium and potassium ions, and calcium and magnesium. This composition signifies a pronounced chloride character of the waters, indicating their association with deep-seated reservoir systems within hydrocarbon-bearing sedimentary basins. According to Sulin’s classification, the sampled waters predominantly fall into the chloride-calcium (Cl–Ca) type. This classification is typical for highly mineralized formation waters that evolve under prolonged interaction with sedimentary and evaporitic rock sequences. Raw data pertaining to the ionic composition of waters from Uzen, Karazhanbas, and Zhetybay are presented in Table 3 and Table 4.
Тable 3. Ionic composition of formation waters from the Uzen oil field.
The highest mineralization was observed in the formation waters of the Uzen field. The total dissolved solids (TDS) range from 130,387.4 to 163,107.1 mg/dm³, with an average value of approximately 151,305.6 mg/dm³. Formation waters from Uzen are characterized by exceptionally high concentrations of chloride ions and the sum of sodium and potassium ions. The average Cl⁻ concentration was 93,931.5 mg/dm³, with a range of 81,035.9–101,294.8 mg/dm³, while the average Na⁺ + K⁺ concentration was 44,307.9 mg/ dm³. Calcium and magnesium were also present in elevated concentrations, with average values of 10,410.8 and 2,505.0 mg/dm³, respectively. Sulfate and carbonate ions were not detected in the analyzed samples, whereas bicarbonate content was relatively low, varying between 81.3 and 345.7 mg/dm³.
Тable 4. Ionic composition of formation waters from the Karazhanbas and Zhetybay oil fields.
Formation waters from the Karazhanbas field exhibit moderate mineralization, with average concentrations of Cl⁻ at 13143.6 mg/dm³ and Na⁺ + K⁺ at 7011.8 mg/dm³. Bicarbonate content is comparatively elevated, averaging 557.6 mg/dm³. In contrast, Zhetybay formation waters demonstrate significantly higher mineralization, characterized by average Cl⁻ concentrations reaching 81403.7 mg/dm³ and Na⁺ + K⁺ at 38218.7 mg/dm³, indicating a more pronounced degree of geochemical evolution.
Thus, in terms of overall mineralization, the investigated waters can be ranked as follows: Uzen > Zhetybay > Karazhanbas.
This progression suggests that waters from Uzen and Zhetybay are at a more advanced stage of salt concentration and geochemical evolution, whereas Karazhanbas waters possess a less mineralized and more variable composition. High concentrations of Cl⁻ and Na⁺ + K⁺ can be attributed to the dissolution of highly soluble salts, the accumulation of dissolved components in closed formation systems, and prolonged water-rock interaction within sedimentary strata. Conversely, elevated concentrations of Ca²⁺ and Mg²⁺ may be associated with water-rock interaction processes, ion exchange, and mineral transformation within hydrocarbon-bearing horizons.
These findings align with international research on oilfield brines. For instance, Yu et al. (references [6,7] not provided) demonstrated that brines from the Jianghan Basin are characterized by high mineralization, a predominance of chloride ions, and complex geochemical evolution linked to evaporite dissolution, ion exchange, and prolonged interaction with sedimentary rocks. Similar characteristics are observed in the formation waters of the Mangistau region, confirming their classification as deep, highly mineralized waters typical of hydrocarbon-bearing sedimentary basins.
3.2. Distribution of Lithium in Formation Waters
The lithium content in the investigated formation waters varies depending on the field. Minimum concentrations (0.30-0.70 mg/dm³) were observed in Karazhanbas waters. In Uzen waters, lithium content reaches up to 1.51 mg/dm³, while maximum values (1.40-1.85 mg/dm³) were detected in Zhetybay waters. Based on lithium content, the studied fields rank as follows: Zhetybay > Uzen > Karazhanbas (Figure 2).
As depicted in Figure 1, the mean lithium concentrations (considering standard deviation) support this trend: the highest values are characteristic of Zhetybay, intermediate for Uzen, and minimal for Karazhanbas. This finding represents one of the most significant results of this study. It indicates that the distribution of lithium does not directly mirror the overall mineralization trend. Although the most highly mineralized waters were found in Uzen, the maximum lithium concentrations are characteristic of Zhetybay. Consequently, lithium accumulation is not solely governed by the total dissolved solids content.
Higher lithium content in Zhytybay waters may be attributed to several factors including the lithological composition of productive horizons, the presence of argillaceous or evaporitic components, reservoir depth, temperature, duration of water-rock interaction, and the degree of closure of the formation system. This suggests that lithium should be considered not merely an indicator of water salinity but also an element sensitive to the geological and geochemical conditions governing formation water evolution [6,7,19].
This conclusion is consistent with findings by Yu et al., which demonstrate that lithium distribution in oilfield brines is influenced not only by mineralization but also by Li input sources, isotopic composition, water-rock interaction, and the stage of geochemical evolution of the brine system [6,7].
3.3. Relationship Between Lithium Content and TDS
Figure 3 illustrates the relationship between lithium content and total dissolved solids (TDS) in formation waters from the Karazhanbas, Uzen, and Zhytybay fields.
The findings indicate that less mineralized formation waters from Karazhanbas exhibit lower lithium (Li) concentrations. Conversely, waters from Uzen and Zhetybai are characterized by significantly higher total dissolved solids (TDS) and elevated Li content. This observation suggests that TDS can serve as a general indicator of the salinity enrichment degree in formation waters.
However, the relationship between Li concentration and TDS is not strictly linear. If lithium enrichment were solely controlled by mineralization, the highest Li concentrations would be expected in Uzen waters. In practice, the maximum Li concentrations were recorded in Zhetybai. This dichotomy highlights that while TDS is a crucial factor, it is not the exclusive determinant influencing lithium enrichment [6,7,19].
From a scientific perspective, this outcome underscores the necessity of a comprehensive approach for evaluating the lithium potential of formation waters. It is insufficient to consider only mineralization; a thorough analysis must also incorporate Li/Cl, Mg/Li, and Na/Cl ratios, alongside the lithology of the producing horizons and the history of water-rock interactions.
3.4. Dependence of Lithium Content on Major Cations
To further elucidate the factors controlling lithium distribution in formation waters, its relationship with major cations – Ca²⁺, Mg²⁺, and the sum of Na⁺ + K⁺ – was investigated. It is important to note that sodium and potassium were reported collectively as Na⁺ + K⁺ in the original analytical data, precluding separate analyses of Li-K and Li-Na dependencies.
Pearson’s correlation coefficient, which quantifies the strength and direction of a linear relationship between two quantitative variables, was employed for the correlation analysis [20]. The coefficient for each pair of parameters, such as Li–Ca²⁺, Li–Mg²⁺, and Li–Na⁺ + K⁺, was calculated using the following formula:
where represents the lithium concentration in an individual sample, denotes the concentration of the corresponding cation, and и are the mean values of Li and the respective cation, and is the number of paired observations. Only samples with quantifiable lithium content were included in the calculations; samples where Li was not detected were excluded. This methodology aligns with standard practice for applying Pearson’s coefficient to assess linear relationships between quantitative geochemical parameters [20]. Pearson’s coefficient ranges from –1 to +1; positive values indicate a concomitant increase in both parameters, while negative values signify an inverse relationship.

Table 5.
Relationship between lithium and major cations in formation waters of the studied oil fields.
Table 5.
Relationship between lithium and major cations in formation waters of the studied oil fields.
| Oil field | n3 | Mean Li, mg/dm³ | Mean Ca²⁺, mg/dm³ | Mean Mg²⁺, mg/dm³ | Mean Na⁺ + K⁺, mg/dm³ | Ca/Li | Mg/Li | (Na⁺ + K⁺)/Li |
|---|---|---|---|---|---|---|---|---|
| Karazhanbas | 13 | 0.53 | 616.6 | 336.7 | 6980.3 | 1161.7 | 634.4 | 13151.3 |
| Zhetybay | 8 | 1.64 | 9657.2 | 1884.1 | 38218.7 | 5893.0 | 1149.7 | 23321.8 |
| Uzen | 8 | 1.36 | 10207.9 | 2508.0 | 43843.3 | 7485.2 | 1839.0 | 32149.0 |
3 number of samples with detected Li. For Uzen, samples in which lithium was not detected were excluded from ratio calculations.
Correlation analysis revealed a positive association between lithium content and major cations. The strongest correlation was observed between Li and Ca²⁺, with a Pearson correlation coefficient of r = 0.906. Strong positive dependencies were also identified between Li and Na⁺ + K⁺ (r = 0.878), and between Li and Mg²⁺ (r = 0.845). These findings indicate that an increase in lithium concentration in the studied waters is generally accompanied by a corresponding rise in the concentrations of these major cations.
Table 6.
Correlation between lithium and major cations.
| Parameter pair | n4 | Pearson r5 | p-value5 | Interpretation |
|---|---|---|---|---|
| Li — Ca²⁺ | 29 | 0.906 | <0.001 | Very strong positive correlation |
| Li — Mg²⁺ | 29 | 0.845 | <0.001 | Strong positive correlation |
| Li — Na⁺ + K⁺ | 29 | 0.878 | <0.001 | Strong positive correlation |
4 represents the number of paired observations; 5shows the strength of the linear relationship between Li and major cations, only samples with detected Li were included; Na⁺ and K⁺ were analyzed as a combined parameter; 5correlations are significant at p < 0.001.
The observed dependencies indicate that lithium concentration is intrinsically linked to the overall saline saturation of formation waters and their geochemical evolution. Elevated concentrations of Ca²⁺, Mg²⁺, and Na⁺ + K⁺ reflect prolonged interaction between formation waters and sedimentary and evaporitic rocks, as well as ion exchange processes. In this context, the positive correlation between Li and these major cations confirms that lithium accumulates not in isolation, but in conjunction with other components of the brine system [6,7,19].
For a more comprehensive geochemical interpretation, the ratios of Ca/Li, Mg/Li, and (Na⁺ + K⁺)/Li were utilized. Such ionic ratios are widely applied in studies of lithium-bearing brines, as they enable evaluation not only of the absolute lithium concentration but also its position within the overall salt matrix [6,7,19,21,22,23]. For instance, Yu et al. (2013) employed hydrochemical ratios, including Mg/Li, Na/Cl, and Cl/Br, to interpret halite dissolution, water-rock interaction, and lithium enrichment processes in oilfield brines from the Qianjiang Formation [6,7].
The comparison of Mg/Li and (Na⁺ + K⁺)/Li ratios is particularly significant, possessing both geochemical and technological implications. High Mg/Li values indicate a complex salt matrix, as Mg²⁺ is a primary interfering cation during the selective extraction of lithium. The literature emphasizes that a high Mg/Li ratio complicates the separation of Li⁺ and Mg²⁺ from brines due to their chemical similitude and competitive behavior in sorption, ion exchange, membrane separation, and extraction processes [3,4,21,22,23].
Uzen waters are characterized by the highest Mg/Li and (Na⁺ + K⁺)/Li ratios, signifying a greater proportion of competing ions relative to lithium. Zhetybay waters, despite their high mineralization, exhibit a higher average Li content and a more favorable Mg/Li ratio compared to Uzen. Consequently, Zhetybay can be considered the most promising target for future lithium-oriented investigations among the three studied fields.
However, it is crucial to consider that the identified correlations were calculated from a combined dataset spanning three fields. Therefore, they reflect both within-group relationships and inter-field differences. For more rigorous statistical inference, future research should involve increasing the number of samples and conducting separate correlation analyses within each individual field.
Overall, the analysis of lithium’s dependence on Ca²⁺, Mg²⁺, and Na⁺ + K⁺ confirms that Li distribution is governed by a complex interplay of factors: overall mineralization, major ion composition, water-rock interaction, and the specific lithology of the productive horizons. This result demonstrates that lithium accumulation is associated not only with water salinity but also with the ratios of major cations in formation waters.
3.5. Relationship Between Lithium Content and pH
Figure 4 illustrates the relationship between lithium content and pH in the formation waters of the investigated fields. The pH values of the studied waters predominantly fall within a slightly acidic to near-neutral range. For Karazhanbas, pH varies from 5.9 to 7.2; for Zhetybay, it ranges from 5.8 to 6.6; and for Uzen, it is between 5.8 and 6.9. The highest lithium concentrations are observed in Zhetybay waters within the pH range of 5.8-6.6. However, Karazhanbas waters, while having partially similar pH values, contain significantly less lithium. This suggests that pH, within the studied range, is not the primary factor determining Li accumulation.
The potential role of pH is primarily in maintaining lithium in dissolved form. However, observed differences between the fields are more attributable to mineralization, major ion composition, lithology of the productive horizons, and the duration of water-rock interaction, rather than solely to environmental acidity.
3.6. General Interpretation of Results and Comparison with International Studies
Overall, the study demonstrates that formation waters from the Karazhanbas, Zhetybay, and Uzen fields are highly mineralized chloride waters, formed under conditions of prolonged interaction with sedimentary and evaporitic rocks. The predominant components of these waters are Cl⁻, Na⁺ + K⁺, Ca²⁺, and Mg²⁺, which is characteristic of formation waters in hydrocarbon-bearing sedimentary basins. In terms of overall mineralization, the investigated waters can be ranked as follows: Uzen > Zhetybay > Karazhanbas. This indicates that waters from Uzen and Zhetybay have undergone a more pronounced stage of salt concentration and geochemical evolution, while Karazhanbas waters exhibit lower mineralization and a more variable composition [6,7,18,19].
The obtained data align well with the findings of Yu et al. [6], who investigated the lithium and chemical composition of oilfield brines from the Qianjiang Formation in the Jianghan Basin, China. Their work showed that such brines possess a pronounced chloride composition, high mineralization, and are formed under the influence of salt dissolution, water-rock interaction, and prolonged evolution of the brine system. Our study also identified the predominance of Cl⁻, Na⁺ + K⁺, Ca²⁺, and Mg²⁺, supporting a similar type of geochemical formation for these formation waters. However, a key distinction is that Li concentrations in the Mangystau waters are considerably lower than those in the lithium-enriched brines of the Jianghan Basin.
In a separate study, Yu et al. [7] attributed the origin of lithium in oilfield brines not only to overall mineralization but also to the isotopic characteristics of Li and Sr, the lithology of water-bearing rocks, and prolonged water-rock interaction. Our results corroborate this approach: while maximum mineralization is observed in Uzen waters, the highest lithium content is found in Zhetybay waters. Consequently, lithium in Mangystau formation waters is not a simple indicator of salinity but rather reflects more complex geological and geochemical processes [6,7,19].
A comparison with the work by Liu et al. [4], focusing on lithium extraction from oil and gas produced water, reveals that Mangystau region waters exhibit lower Li concentrations compared to several international oil and gas basins. Liu et al. note that produced waters can be considered a potential source of lithium, but their suitability depends not only on Li content but also on overall mineralization, the composition of co-occurring ions, the volume of produced water, and the availability of processing technologies. This is particularly relevant for our data, as Zhetybay and Uzen waters contain measurable lithium concentrations but are simultaneously characterized by a high salt matrix, which can complicate selective Li extraction.
Marza et al. [19], in their study of North American sedimentary brines, emphasize that the lithium potential of formation waters is determined not only by Li concentration but also by the basin’s geological conditions, water productivity, and potential sources of lithium enrichment. This strongly agrees with our results: different fields within the Mangystau region exhibit varying Li levels, despite belonging to the same hydrocarbon-bearing region. Thus, even within a single area, lithium distribution can be highly dependent on local lithology, depth, duration of water-rock contact, and the composition of the formation system.
The analysis of Mg/Li, Ca/Li, and (Na⁺ + K⁺)/Li ratios holds particular significance. In international literature, these ratios are employed to assess not only the geochemical origin of brines but also the complexity of lithium extraction [6,7,19,21,22,23]. A high Mg/Li ratio is considered an unfavorable factor, as Mg²⁺ competes with Li⁺ during sorption, ion exchange, and membrane separation processes. Knapik et al. [3] and Liu et al. [4] highlight that highly mineralized oilfield brines often require pre-treatment, as high concentrations of Mg²⁺, Ca²⁺, and Na⁺ reduce the efficiency of direct lithium extraction technologies [3,4,21,22,23]. In our study, the highest Mg/Li and (Na⁺ + K⁺)/Li values are characteristic of Uzen, indicating a more complex salt matrix. Zhetybay, conversely, exhibits a higher average Li content and a more favorable Mg/Li ratio compared to Uzen, making it a more promising candidate for further lithium-oriented investigations.
Compared to highly enriched international brines, Mangystau region waters cannot currently be considered a commercially rich source of lithium, as Li concentrations do not exceed 1.85 mg/dm³. However, the scientific value of this work extends beyond assessing industrial potential. The main advantage of the current study lies in establishing the first systematic regional database on Li content and ionic composition of formation waters from major oil fields in the Mangystau region. Unlike many international studies focused on already known lithium-enriched brines, this work provides a baseline for lithium occurrence in a less-studied region of Central Asia [6,7,19].
Therefore, the research findings hold dual significance. From a scientific perspective, they demonstrate that lithium accumulation in formation waters is controlled not only by mineralization but also by the ratios of major cations, the lithology of productive horizons, and water-rock interaction. From a practical standpoint, Zhetybay is identified as the most promising target for further investigation, Uzen as a highly mineralized system with a complex salt matrix, and Karazhanbas as a less lithium-bearing but important comparative system. The main conclusion of this section is that maximum mineralization does not equate to maximum lithium content. Consequently, the evaluation of lithium potential in formation waters must be based on a comprehensive analysis of Li, TDS, pH, major ions, and relevant geochemical ratios [3,4,6,7,19,21,22,23].
3.7. Lithium Extraction Potential from Mangystau Region Formation Waters
The obtained results allow for a preliminary assessment of the formation waters from the Karazhanbas, Zhetybay, and Uzen fields as potential lithium sources. Although the determined Li concentrations do not align with those of highly enriched industrial brines, the presence of measurable lithium concentrations in all studied areas holds significant scientific and applied value. Maximum lithium concentrations were detected in Zhetybay waters, ranging from 1.40–1.85 mg/dm³, while Uzen waters reached up to 1.51 mg/dm³. Karazhanbas waters exhibited lower values, typically between 0.30–0.70 mg/dm³. This clearly designates Zhetybay as the most promising target for future lithium-oriented investigations.
Comparison with international lithium-enriched brines reveals that Mangystau region waters generally have lower Li content. In various oilfield and geothermal brines worldwide, lithium concentrations can reach tens to hundreds of mg/L [3,4,6,7,8,11,13,19]. Therefore, at this stage, Mangystau waters cannot be considered an immediate industrial source of lithium. Their potential primarily lies in contributing to a regional database, identifying prospective areas, and further evaluating technologies for lithium extraction from highly mineralized oilfield waters.
A critical factor determining the feasibility of lithium extraction is not merely its absolute concentration but also the composition of the salt matrix. High concentrations of Na⁺, Ca²⁺, and Mg²⁺ can impede the selective extraction of Li⁺, as these ions compete with lithium in sorption, ion exchange, membrane separation, and extraction processes [3,4,21,22,23]. The Mg/Li ratio is particularly indicative: a higher ratio implies greater difficulty in separating lithium from magnesium. In the investigated waters, the highest Mg/Li values characterize Uzen, suggesting a more challenging technological matrix. Conversely, Zhetybay waters possess a higher average Li content and a more favorable Mg/Li ratio compared to Uzen, thereby presenting greater interest for subsequent testing.
From a technological standpoint, direct lithium extraction from Mangystau region formation waters necessitates the use of highly selective methods. Promising approaches include selective adsorption, ion-exchange materials, membrane techniques, electrochemical extraction, and integrated schemes for pre-concentration [3,4,9,10,11,12,13,21,22,23]. However, prior to selecting a specific technology, laboratory tests on actual formation water samples are essential, as high mineralization and the presence of competing ions can significantly reduce extraction efficiency [3,4,21,22,23].
The ecological aspect is also of fundamental importance. The Mangystau region is an arid area with limited freshwater resources and a high anthropogenic load. Consequently, potential lithium extraction technologies must be designed to minimize waste generation, promote water reuse, incorporate closed-loop technological cycles, and integrate with existing water treatment or formation water disposal processes [3,4,12,14]. Such an approach would position lithium extraction not only as a resource recovery task but also as an element of more sustainable management of oilfield waters.
In conclusion, the practical potential of the investigated formation waters should be assessed cautiously. At this stage, they do not represent industrial-grade, highly concentrated lithium brines; however, they constitute an important subject for further research. The most promising avenues include detailed studies of Zhetybay and Uzen waters, calculation of geochemical ratios such as Li/Cl, Mg/Li, Ca/Sr, and Na/Cl, expansion of sampling, seasonal monitoring, and laboratory tests for preliminary concentration and selective lithium extraction. The primary practical implication is that Mangystau region formation waters can be regarded as a potential secondary hydromineral resource, but their industrial applicability requires additional geochemical, technological, and environmental evaluation [3,4,6,7,19,21,22,23].
4. Conclusions
The study revealed that formation waters from the Karazhanbas, Zhetybay, and Uzen fields predominantly classify as chloride-calcium (Cl–Ca) type and are characterized by high mineralization. In terms of overall mineralization, the waters array as Uzen > Zhetybay > Karazhanbas. Specifically, mineralization ranged from 3725.9-40891.3 mg/dm³ for Karazhanbas, 110800.1-150104.8 mg/dm³ for Zhetybay, and 130387.4-163107.1 mg/dm³ for Uzen. Lithium concentrations varied significantly, from 0.30–0.70 mg/dm³ in Karazhanbas waters to 1.40–1.85 mg/dm³ in Zhetybay waters, with Uzen waters reaching up to 1.51 mg/dm³. Ranking the studied sites by lithium content yields Zhetybay > Uzen > Karazhanbas. This demonstrates that maximal mineralization does not consistently correspond to maximal lithium content. The proposed comprehensive hydrogeochemical assessment method effectively elucidated the relationship between lithium and key formation water parameters, including TDS, pH, Ca²⁺, Mg²⁺, Na⁺ + K⁺, as well as geochemical ratios such as Mg/Li, Ca/Li, and (Na⁺ + K⁺)/Li. The established positive correlations between Li and major cations indicate that lithium accumulation is influenced not merely by water salinity but also by ionic composition and water-rock interaction processes. This work suggests that formation waters of the Mangystau region can be considered a potential secondary hydromineral resource. Zhetybay emerges as the most promising target for further investigation due to its maximal lithium concentrations and a more favorable Mg/Li ratio compared to Uzen. Future research should focus on expanding the number of samples, implementing seasonal monitoring, determining additional trace elements and isotopic compositions of the waters, calculating Li/Cl, Mg/Li, Ca/Sr, and Na/Cl ratios, and conducting laboratory tests on selective lithium extraction methods. These steps will enable a more precise evaluation of the industrial potential of Mangystau region formation waters.
Author Contributions
Conceptualization, A.B.; methodology, A.B.; validation, A.B. and A.S.; formal analysis, A.B. and A.S.; investigation, A.B.; resources, A.S.; data curation, A.S.; writing—original draft preparation, A.B.; writing—review and editing, A.B. and A.S.; visualization, A.B.; supervision, A.S.; project administration, A.B.; funding acquisition, A.B. All authors have read and agreed to the published version of the manuscript.
Funding
This research was financially supported by the Science Committee of the Ministry of Science and Higher Education of the Republic of Kazakhstan, Grant No. AP22686075, “Investigation of the ion-salt composition of lithium-containing natural and wastewater of the Mangystau region and identification of industrial lithium sources.”.
Data Availability Statement
All data are contained within the article.
Conflicts of Interest
The authors declare no conflicts of interest. The funders had no role in the design of the study; in the collection, analyses, or interpretation of data; in the writing of the manuscript; or in the decision to publish the results.
References
- U.S. Geological Survey. Lithium. Mineral Commodity Summaries 2025; U.S. Geological Survey: Reston, VA, USA, 2025. [Google Scholar]
- International Energy Agency. Global Critical Minerals Outlook 2024; International Energy Agency: Paris, France, 2024. [Google Scholar]
- Knapik, E.; Rotko, G.; Marszałek, M. Recovery of lithium from oilfield brines—Current achievements and future perspectives: A mini review. Energies 2023, 16, 6628. [Google Scholar] [CrossRef]
- Liu, Q.; Yang, P.; Tu, W. Lithium recovery from oil and gas produced water: Opportunities, challenges, and future outlook. J. Water Process Eng. 2023, 55, 104148. [Google Scholar] [CrossRef]
- Gerardo, S.; Song, W. Lithium recovery from U.S. oil and gas produced waters: Resource quality and siting considerations. Environ. Sci. Water Res. Technol. 2025. [Google Scholar] [CrossRef]
- Yu, X.; Huang, H.; Wang, C.; Wang, J.; Yan, K. Lithium and brine geochemistry in the Qianjiang Formation of the Jianghan Basin, central China. Sci. Rep. 2023, 13, 4445. [Google Scholar] [CrossRef] [PubMed]
- Yu, X.; Wang, C.; Huang, H.; Yan, K. Origin of lithium in oilfield brines in continental petroliferous basin: Insights from Li and Sr isotopes in the Jianghan Basin, central China. Mar. Pet. Geol. 2024, 160, 106576. [Google Scholar] [CrossRef]
- Kölbel, L.; Herrmann, L.; Kölbel, T.; Schneider, J. Lithium extraction from geothermal brines: Adsorption–desorption studies on ²²⁶Ra (²²⁸Ra) and ²¹⁰Pb on lithium-titanium-oxides (LTO). Appl. Geochem. 2024, 162, 105913. [Google Scholar] [CrossRef]
- International Lithium Association. Direct Lithium Extraction (DLE): An Introduction; International Lithium Association: London, UK, 2024. [Google Scholar]
- Kiemde, A.F.; Díaz Nieto, C.H.; Marin, J.; Flexer, V.; Chagnes, A. Direct lithium extraction from natural brines with co-valorization of boron, magnesium and sodium by combining solvent extraction and electrodialysis operations. Sustain. Mater. Technol. 2025, 46, e01749. [Google Scholar] [CrossRef]
- Wang, X.; Numedahl, N.; Jiang, C. Direct lithium extraction from Canadian oil and gas produced water using functional ionic liquids—A preliminary study. Appl. Geochem. 2024, 172, 106126. [Google Scholar] [CrossRef]
- Zegeye, R.B.; Tufa, R.A.; Santoro, S.; Inzillo, B.M.; Aquino, M.; Politano, G.G.; Embaye, A.S.; Argurio, P.; De Bartolo, L.; Curcio, E. Sustainable lithium recovery from geothermal brine via integrated membrane distillation–selective electrodialysis. Green. Chem. 2025, 27, 4205–4221. [Google Scholar] [CrossRef]
- Jakaria, M.; Ling, K.; Pu, H.; Crowell, J.J. Lithium and salt extraction from the Bakken produced water. J. Pet. Explor. Prod. Technol. 2025. [Google Scholar] [CrossRef]
- Barthel, R.; Banzhaf, S. Groundwater and climate change: No longer a hidden resource. Hydrogeol. J. 2016, 24, 1931–1934. [Google Scholar]
- U.S. Environmental Protection Agency. Method 200.7: Determination of Metals and Trace Elements in Water and Wastes by Inductively Coupled Plasma-Atomic Emission Spectrometry, Revision 4.4; U.S. Environmental Protection Agency: Cincinnati, OH, USA, 1994. [Google Scholar]
- U.S. Environmental Protection Agency. Method 200.8: Determination of Trace Elements in Waters and Wastes by Inductively Coupled Plasma-Mass Spectrometry, Revision 5.4; U.S. Environmental Protection Agency: Cincinnati, OH, USA, 1994. [Google Scholar]
- Lipps, W.C.; Braun-Howland, E.B.; Baxter, T.E. (Eds.) Standard Methods for the Examination of Water and Wastewater, 24th ed.; APHA Press: Washington, DC, USA, 2023. [Google Scholar]
- Collins, A.G. Geochemistry of Oilfield Waters; Elsevier Scientific Publishing Company: Amsterdam, The Netherlands, 1975. [Google Scholar]
- Marza, M.; Ferguson, G.; Thorson, J.; Barton, I.; Kim, J.-H.; Ma, L.; McIntosh, J. Geological controls on lithium production from basinal brines across North America. J. Geochem. Explor. 2024, 257, 107383. [Google Scholar] [CrossRef]
- Schober, P.; Boer, C.; Schwarte, L.A. Correlation coefficients: Appropriate use and interpretation. Anesth. Analg. 2018, 126, 1763–1768. [Google Scholar] [CrossRef] [PubMed]
- Zhang, Y.; Xu, R.; Wang, L.; Sun, W. Separation of magnesium from lithium in salt-lake brine through struvite precipitation. Miner. Eng. 2022, 180, 107468. [Google Scholar] [CrossRef]
- Khalil, A.; Mohammed, S.; Hashaikeh, R.; Hilal, N. Lithium recovery from brine: Recent developments and challenges. Desalination 2022, 528, 115611. [Google Scholar] [CrossRef]
- Murphy, O.; Haji, M.N. A review of technologies for direct lithium extraction from low Li⁺ concentration aqueous solutions. Front. Chem. Eng. 2022, 4, 1008680. [Google Scholar] [CrossRef]
Figure 1.
Location map of the studied oil fields in Mangystau Region, Kazakhstan.
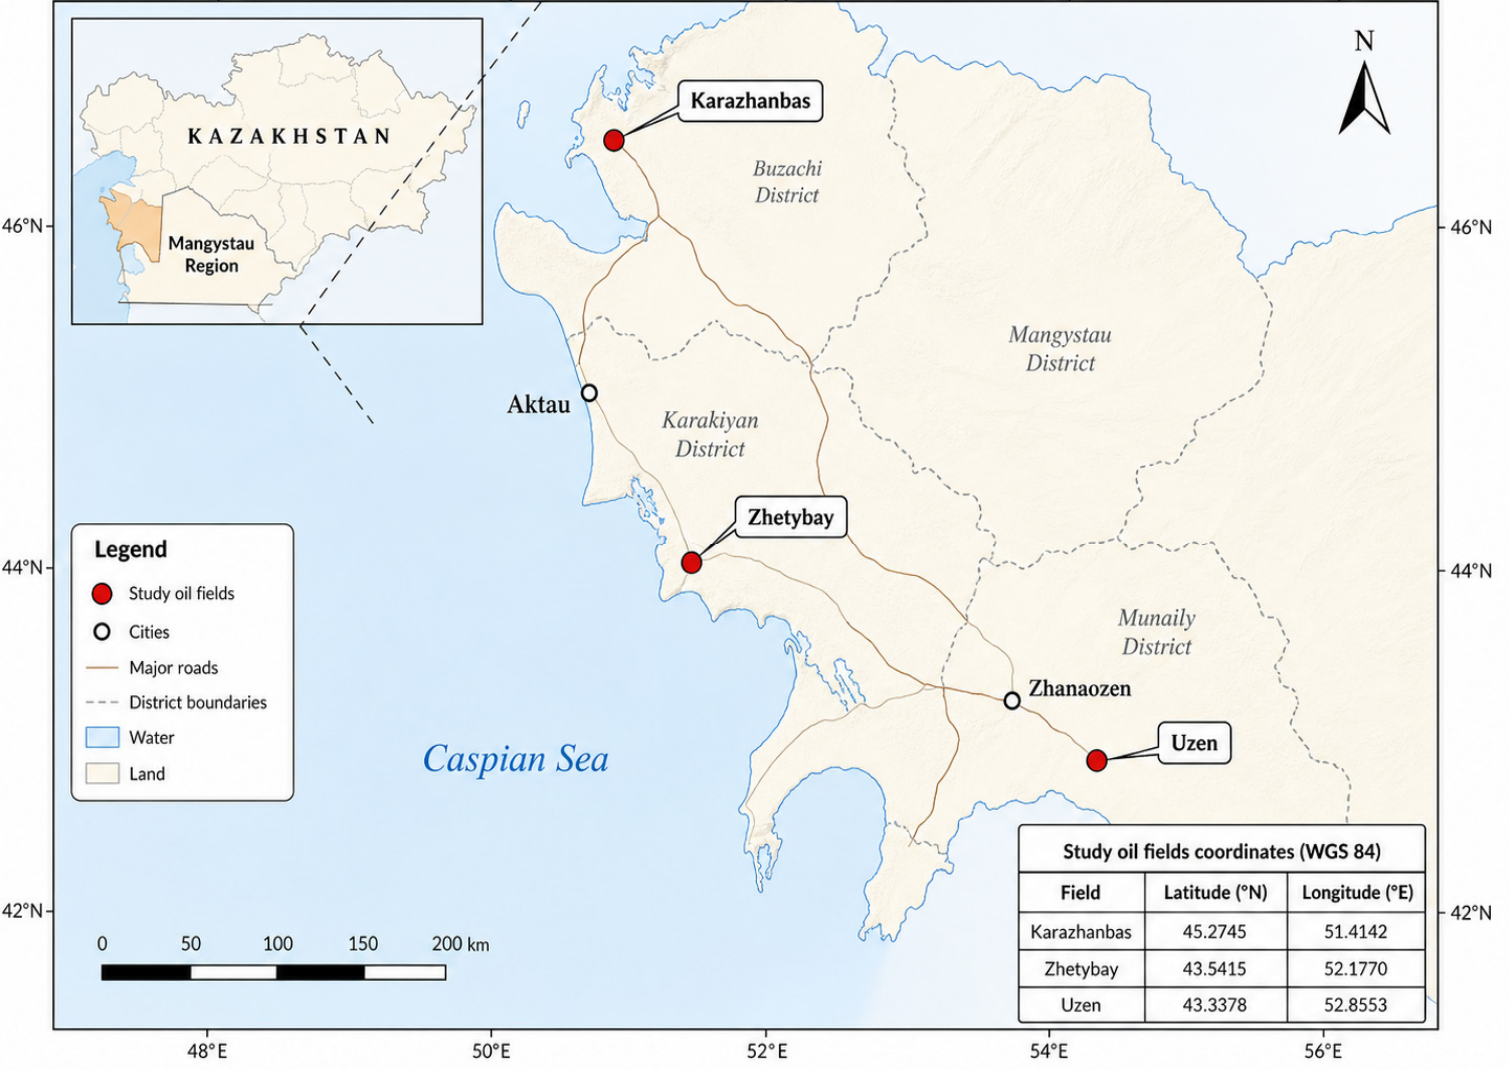
Figure 2.
Lithium concentration in formation waters of the studied oil fields.
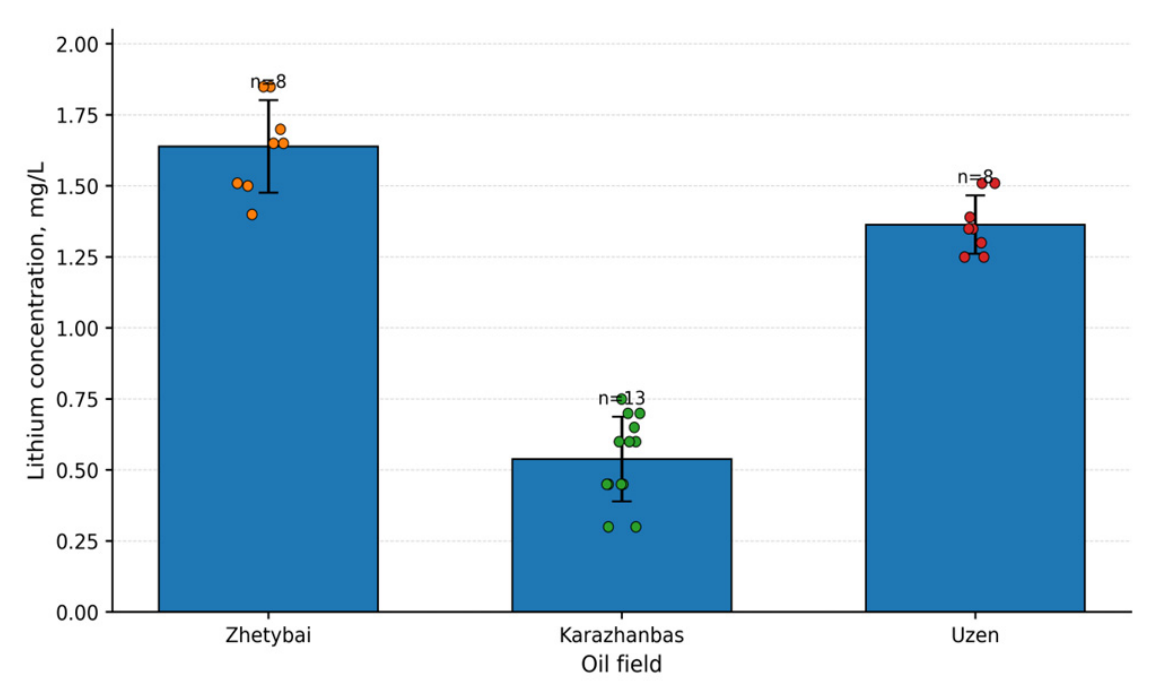
Figure 3.
Relationship between lithium concentration and total dissolved solids (TDS) in formation waters of the Karazhanbas, Uzen and Zhetybay oil fields (Mangystau region, Kazakhstan).
Figure 3.
Relationship between lithium concentration and total dissolved solids (TDS) in formation waters of the Karazhanbas, Uzen and Zhetybay oil fields (Mangystau region, Kazakhstan).
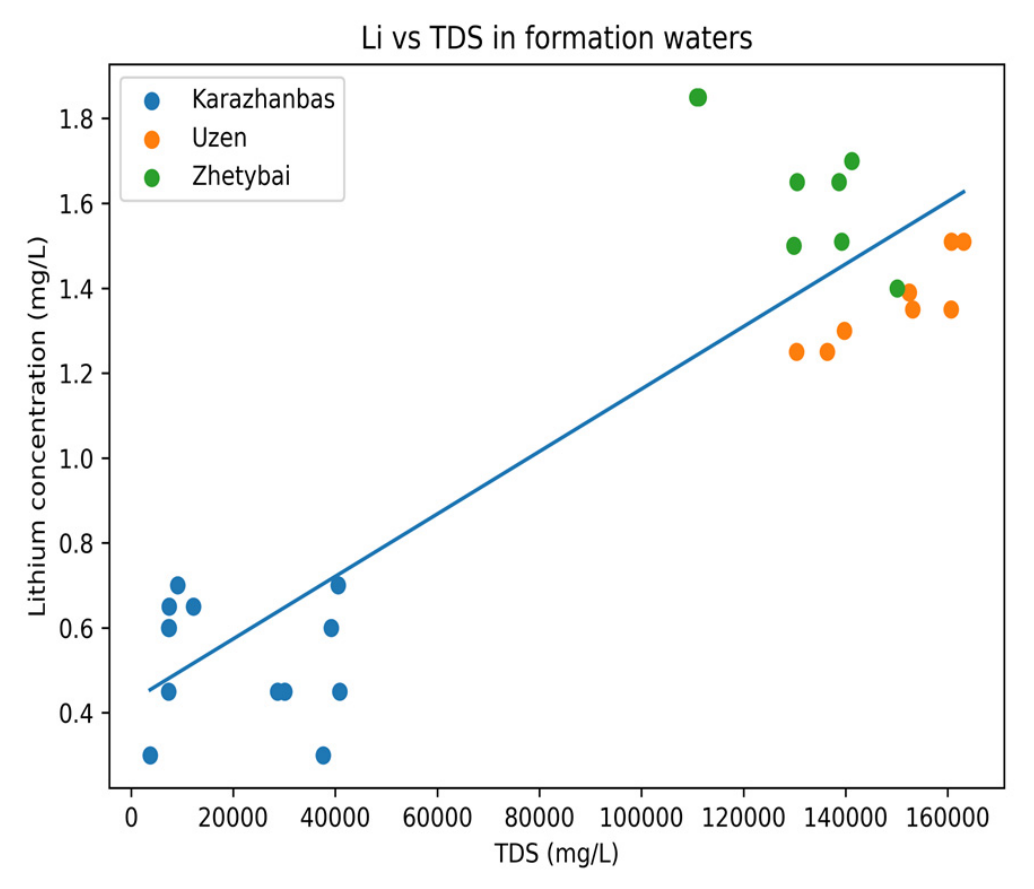
Figure 4.
Relationship between lithium concentration and pH in formation waters of the Karazhanbas, Uzen and Zhetybay oil fields (Mangystau region, Kazakhstan).
Figure 4.
Relationship between lithium concentration and pH in formation waters of the Karazhanbas, Uzen and Zhetybay oil fields (Mangystau region, Kazakhstan).
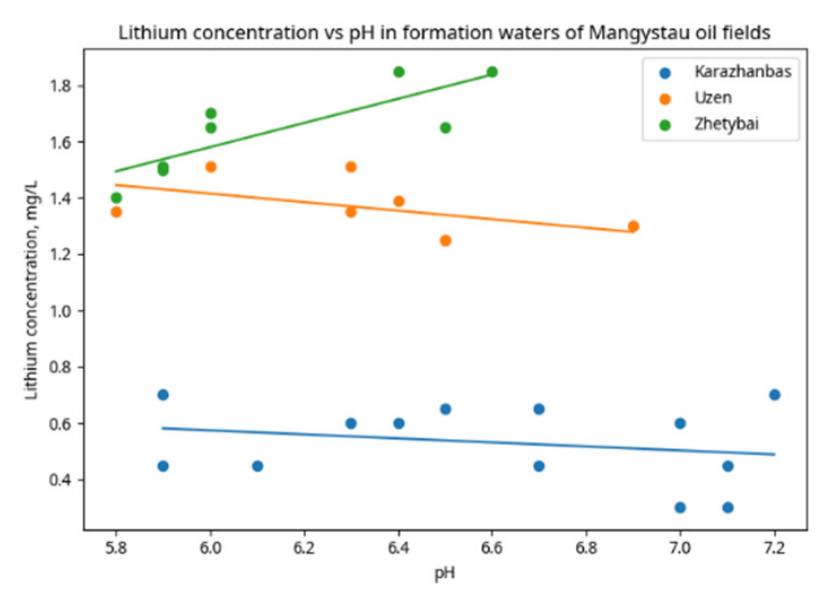
Table 1.
Coordinates of the studied oil fields.
| Oil field | Coordinates (WGS 84) |
|---|---|
| Karazhanbas | 45.2745° N, 51.4142° E |
| Zhetybay | 43.5415° N, 52.1770° E |
| Uzen | 43.3378° N, 52.8553° E |
Table 2.
General hydrogeochemical characteristics of the studied formation waters.
| Oil field | pH | Total mineralization, mg/dm³ | Water type according to Sulin | Li, mg/dm³ |
|---|---|---|---|---|
| Karazhanbas | 5.9–7.2 | 3725.9–40891.3 | Cl–Ca* | 0.30–0.70 |
| Zhetybay | 5.8–6.6 | 110800.1–150104.8 | Cl–Ca | 1.40–1.85 |
| Uzen | 5.8–6.9 | 130387.4–163107.1 | Cl–Ca | up to 1.51 |
* chloride–calcium water type according to Sulin’s classification.
Table 3.
Ionic composition of formation waters from the Uzen oil field.
| Sample No. | Ca²⁺ (mg/dm³) | Mg²⁺ (mg/dm³) | Na⁺ + K⁺ (mg/dm³) | Cl⁻ (mg/dm³) | SO₄²⁻ (mg/dm³) | CO₃²⁻ (mg/dm³) | HCO₃⁻ (mg/dm³) |
|---|---|---|---|---|---|---|---|
| 1 | 8216,4 | 2553,6 | 40716,8 | 84542,2 | n.d.1 | n.d. | 345,7 |
| 2 | 11623,2 | 2553,6 | 46641 | 99736,4 | n.d. | n.d. | 284,7 |
| 3 | 10821,6 | 2432 | 45692,3 | 96619,7 | n.d. | n.d. | 81,3 |
| 4 | 11222,4 | 2675,2 | 47813 | 101294,8 | n.d. | n.d. | 101,7 |
| 5 | 10621,2 | 2432 | 44919 | 95061,3 | n.d. | n.d. | 101,7 |
| 6 | 11623,2 | 2553,6 | 46587,3 | 99736,4 | n.d. | n.d. | 142,3 |
| 7 | 10521 | 2492,8 | 44666,2 | 94671,7 | n.d. | n.d. | 101,7 |
| 8 | 8817,6 | 2371,2 | 38020,4 | 81035,9 | n.d. | n.d. | 142,3 |
| 9 | 9218,4 | 2553,6 | 40991,3 | 86879,8 | n.d. | n.d. | 101,7 |
| 10 | 11422,8 | 2432 | 47032 | 99736,4 | n.d. | n.d. | 101,7 |
1not detected.
Table 4.
Ionic composition of formation waters from the Karazhanbas and Zhetybay oil fields.
| Sample No. | Ca²⁺ (mg/dm³) |
Mg²⁺ (mg/dm³) | Na⁺ + K⁺ (mg/dm³) | Cl⁻ (mg/dm³) |
SO₄²⁻ (mg/dm³) | CO₃²⁻ (mg/dm³) | HCO₃⁻ (mg/dm³) |
|---|---|---|---|---|---|---|---|
| Karazhanbas | |||||||
| 1 | 100.2 | 60.8 | 2482.8 | 4168.9 | 17.3 | n.d.1 | 536.8 |
| 2 | 100.2 | 60.8 | 2474.6 | 4168.9 | traces2 | n.d. | 671 |
| 3 | 501.0 | 304.0 | 3583.0 | 7295.6 | n.d. | n.d. | 536.8 |
| 4 | 1102.2 | 486.4 | 9760.2 | 18412.7 | traces | n.d. | 329.4 |
| 5 | 200.4 | 60.8 | 3035.7 | 5211.2 | traces | n.d. | 622.2 |
| 6 | 1202.4 | 851.2 | 12674.0 | 24145 | n.d. | n.d. | 317.2 |
| 7 | 1102.2 | 425.6 | 12805.1 | 22929.1 | n.d. | n.d. | 378.2 |
| 8 | 1102.2 | 729.6 | 13357.0 | 24666.1 | n.d. | n.d. | 719.8 |
| 9 | 1102.2 | 729.4 | 13582.4 | 25013.5 | n.d. | n.d. | 463.6 |
| 10 | 50.1 | 30.4 | 1124.6 | 1910.8 | n.d. | n.d. | 610 |
| 11 | 1102.2 | 486.4 | 9084.0 | 17370.5 | n.d. | n.d. | 622.2 |
| 12 | 200.4 | 121.6 | 3165.8 | 5558.6 | 41.2 | n.d. | 939.4 |
| 13 | 150.3 | 30.4 | 3614.5 | 5906 | 27.2 | n.d. | 500.2 |
| Zhetybay | |||||||
| 1 | 8670.7 | 1514.3 | 42743.8 | 85485.1 | n.d. | n.d. | 268.4 |
| 2 | 12024 | 1945.6 | 42895.8 | 93056.3 | 12.3 | n.d. | 170.8 |
| 3 | 10621.2 | 2188.8 | 40538.4 | 87659.0 | n.d. | n.d. | 219.6 |
| 4 | 9118.2 | 1884.8 | 38388.4 | 80772.8 | 36.2 | n.d. | 305.0 |
| 5 | 10470.9 | 2036.8 | 40153.3 | 86356,2 | traces | n.d. | 225.7 |
| 6 | 8116.2 | 2006.4 | 31812.5 | 69010.5 | 144,9 | n.d. | 219.6 |
| 7 | 8216.4 | 1672 | 31929.6 | 68489.4 | 187.7 | n.d. | 305.0 |
| 8 | 10020 | 1824 | 37287.6 | 80400.6 | 163.0 | n.d. | 158.6 |
1not detected; 2 below detection limit.
Disclaimer/Publisher’s Note: The statements, opinions and data contained in all publications are solely those of the individual author(s) and contributor(s) and not of MDPI and/or the editor(s). MDPI and/or the editor(s) disclaim responsibility for any injury to people or property resulting from any ideas, methods, instructions or products referred to in the content. |
© 2026 by the authors. Licensee MDPI, Basel, Switzerland. This article is an open access article distributed under the terms and conditions of the Creative Commons Attribution (CC BY) license (http://creativecommons.org/licenses/by/4.0/).
Copyright: This open access article is published under a Creative Commons CC BY 4.0 license, which permit the free download, distribution, and reuse, provided that the author and preprint are cited in any reuse.


