Submitted:
22 May 2026
Posted:
25 May 2026
You are already at the latest version
Abstract
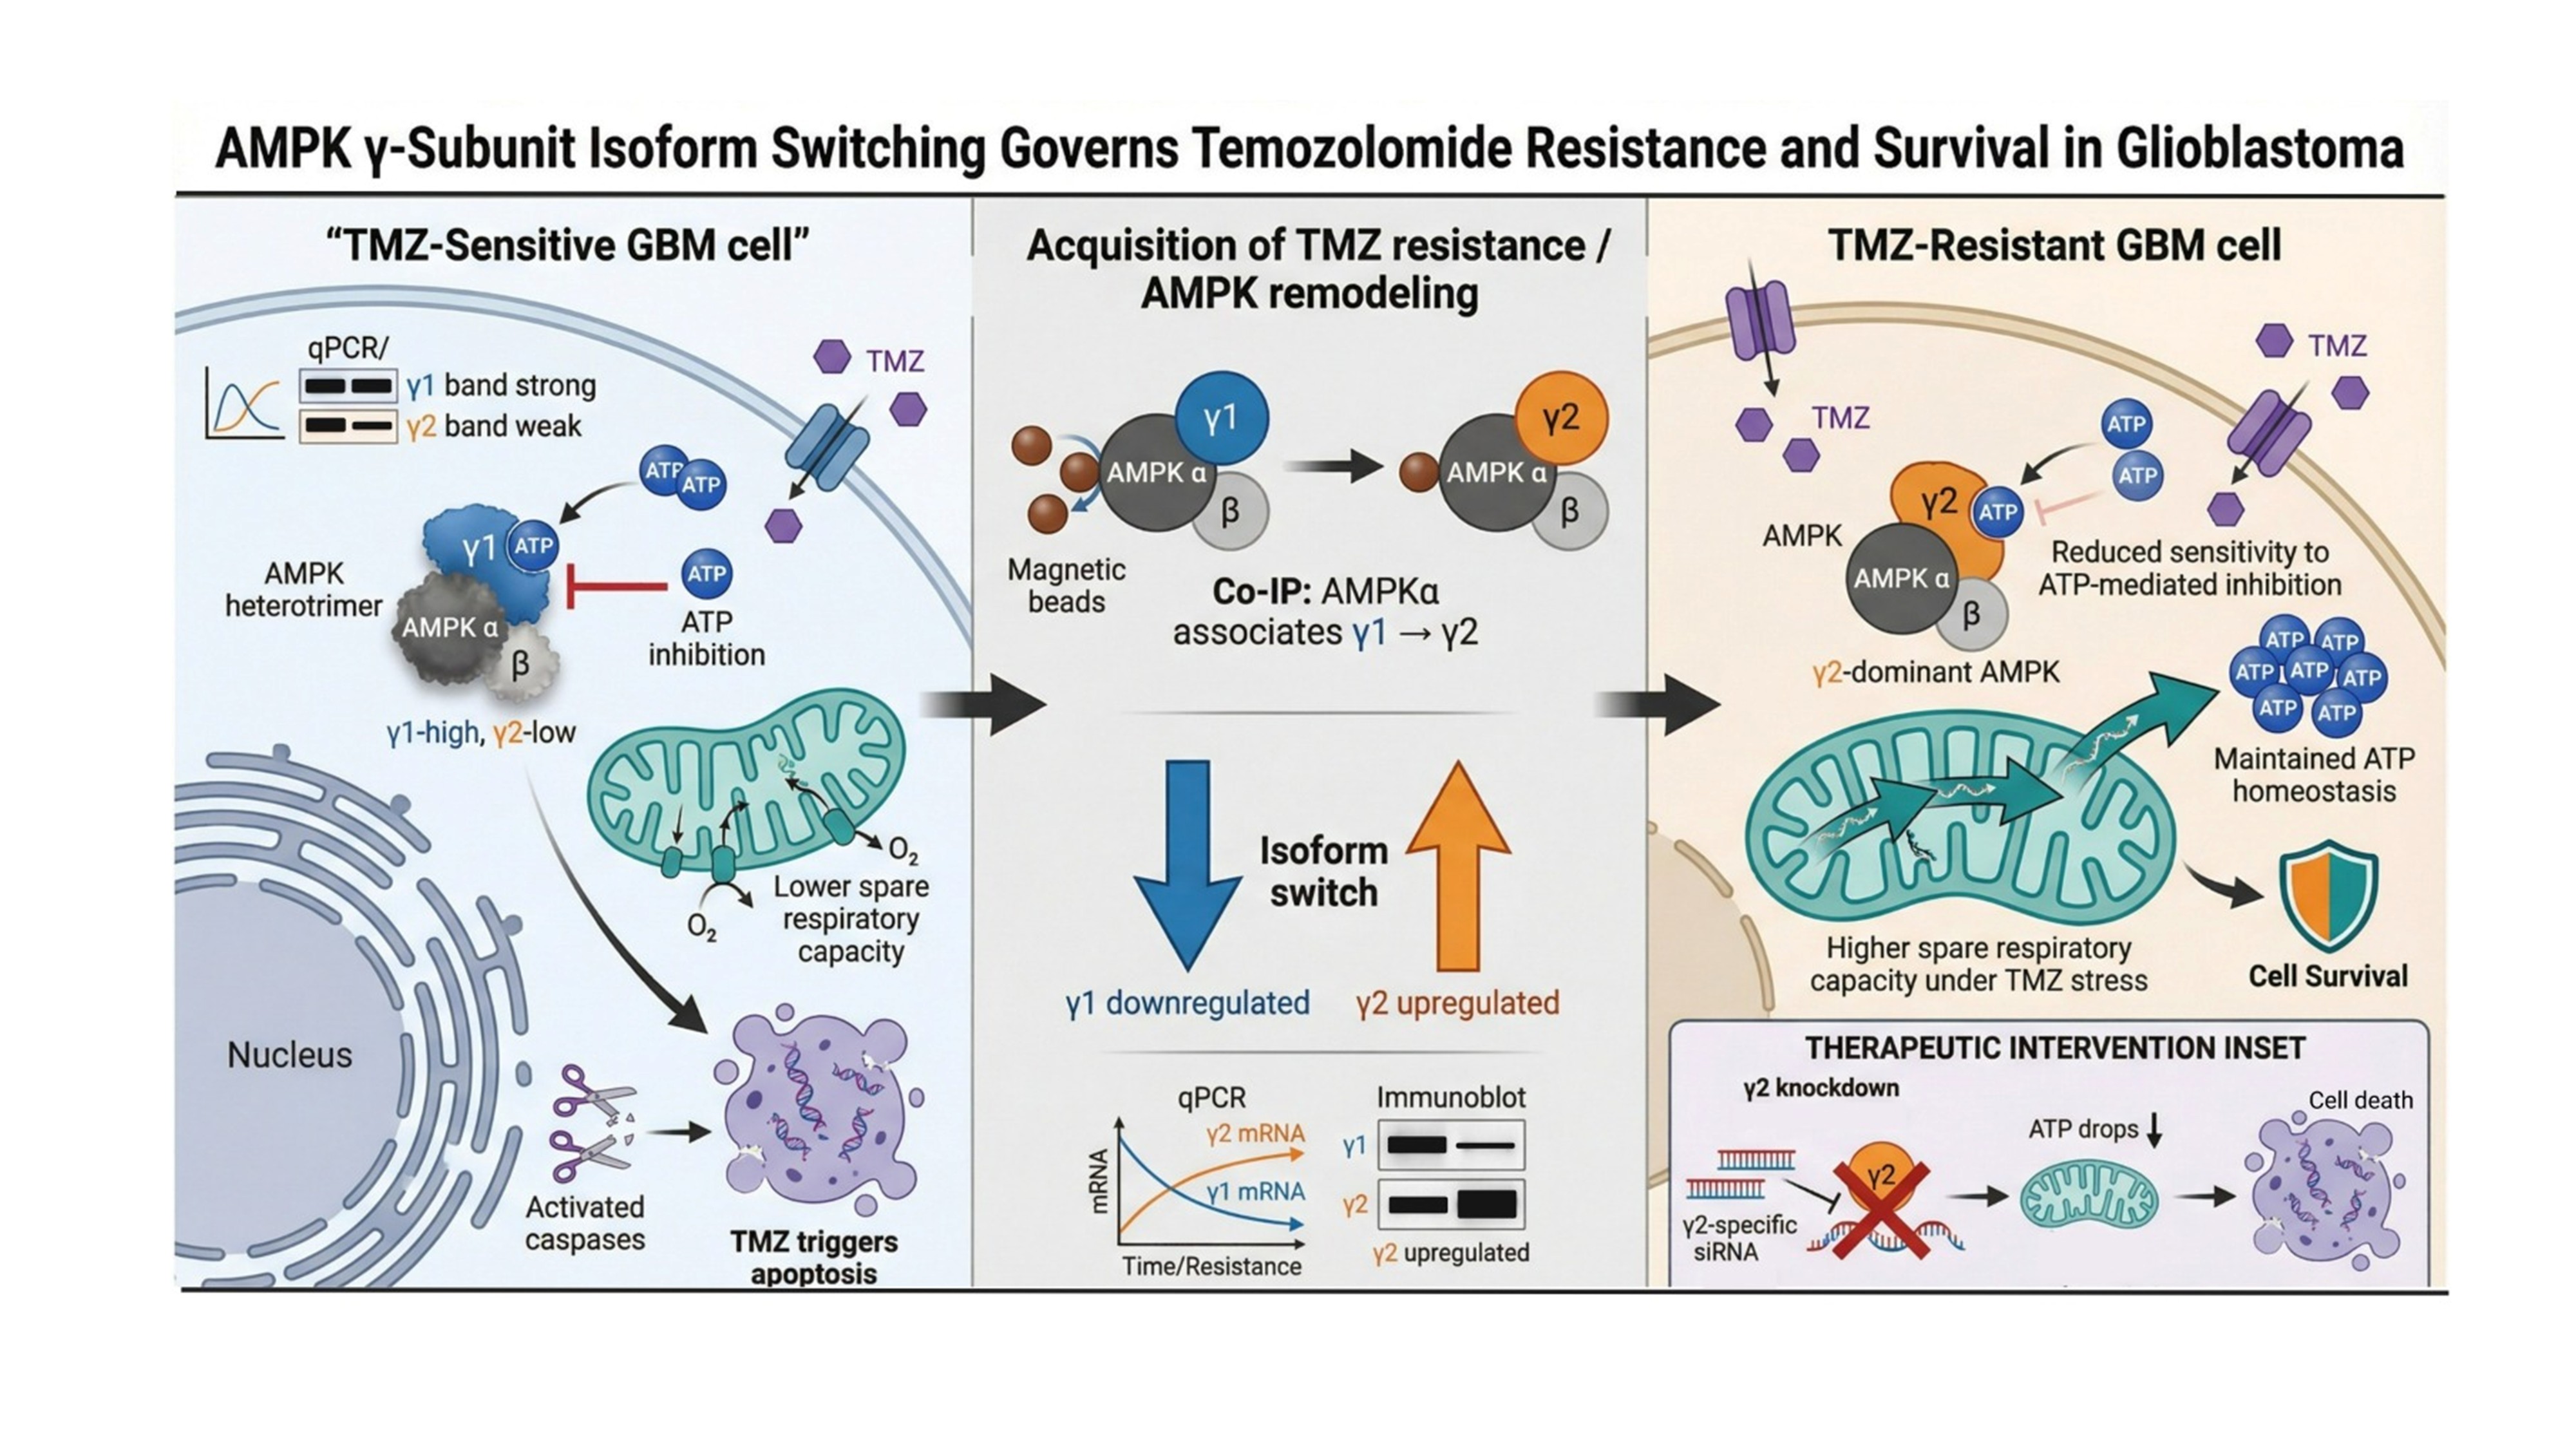
Temozolomide (TMZ) resistance remains a fundamental obstacle in the treatment of Glioblastoma (GBM). While the metabolic sensor AMPK is known to influence cancer cell survival, the specific role of its regulatory γ-subunit isoforms in orchestrating chemoresistance is poorly understood. This study investigates how dynamic remodeling of the AMPK heterotrimer contributes to TMZ evasion in GBM. We observed significantly low expression of AMPKγ2 in glioma patient samples, but treatment of GBM cell lines with TMZ led to a robust increase in AMPKγ2 expression with a concomitant decrease in AMPKγ1 expression. We identified a significant "isoform switch" in TMZ-treated cells, characterized by a marked downregulation of the γ1 subunit and a reciprocal upregulation of γ2. Structural remodeling of the AMPK complex was validated using co-immunoprecipitation (Co-IP). Co-IP analysis confirmed that the AMPK α catalytic subunit shifts its primary association from γ1 to γ2 during the TMZ treatment. Functionally, γ2 dominant complexes exhibited reduced sensitivity to ATP-mediated inhibition, allowing resistant cells to maintain better ATP homeostasis and sustained AMPK activation under TMZ-induced stress. Furthermore, knockdown of the γ2 subunit abolished this metabolic advantage, resulting in re-sensitization of GBM cell lines to TMZ-induced cell death. Our findings reveal that AMPK γ-subunit isoform switching is a previously unrecognized metabolic adaptation that drives TMZ resistance in GBM. Targeting the γ2-specific complex or preventing this isoform transition represents a promising therapeutic strategy to overcome chemoresistance in malignant gliomas.
Keywords:
AMPK subunit
; glioblastoma (GBM)
; autophagy
; temozolomide
; chemoresistance
; cancer metabolism
Introduction
Cellular survival depends on the ability to sense and adapt to fluctuating energy demands across eukaryotes. AMP-activated protein kinase (AMPK) functions as a key regulator of this process[1,2]. It is a conserved serine/threonine kinase that functions as a molecular energy sensor. AMPK acts as a molecular switch by monitoring adenine nucleotide levels and activating catabolic pathways to restore ATP while suppressing anabolic processes[3]. Although initially it was characterized as a cell-autonomous fuel gauge in multicellular organisms, it has evolved to integrate nutrient and hormonal signals and hence coordinate the energy balance across tissues[4]. AMPK functions as a heterotrimeric complex composed of a catalytic α subunit, a scaffold β subunit that connects the α and γ subunits together, and a regulatory γ subunit[5]. Each subunit exists in multiple isoforms: α1/α2 (encoded by PRKAA1 and PRKAA2), β1/β2 (PRKAB1, PRKAB2), γ1/γ2/γ3 (PRKAG1, PRKAG2, PRKAG3)[6], giving rise to a variety of functional AMPK complexes in human cells[7]. AMPK regulates numerous metabolic processes, including glucose and lipid metabolism, autophagy, and mitochondrial biogenesis, by phosphorylating downstream targets[8]. AMPK activation is primarily mediated by phosphorylation at T172 by upstream kinases such as LKB1[9] and CaMKKβ in response to cellular energy stress[10].
Glioblastoma multiforme (GBM) is the most aggressive and invasive form of glioma and represents the most common primary malignant brain tumor in adults[11]. It originates within the brain rather than arising from metastatic spread of tumors from other organs[12]. GBM accounts for nearly 60% of the adult brain tumors and is characterized by rapid proliferation, extensive heterogeneity, metabolic reprogramming, and poor clinical prognosis[13]. Despite advances in surgical resection, radiotherapy, and chemotherapy, the median survival of GBM patients remains limited. In GBM treatment, the development of chemoresistance is a major challenge. Including temozolomide (TMZ), a standard chemotherapeutic drug used in GBM therapy[14]. Tumor cells often adapt to metabolic and therapeutic stress by activating survival pathways that promote proliferation and resistance to apoptosis[15]. In this context, AMPK signaling has been shown to promote adaptive survival mechanisms, including autophagy and metabolic reprogramming, in response to chemotherapeutic stress[16,17].
Increasing evidence suggests that metabolic regulators play a crucial role in mediating this adaptive response. Recent studies have implicated AMPK signaling in cancer progression and therapy response, including glioblastoma[18]. While AMPK has traditionally been described as a tumor suppressor due to its role in inhibiting anabolic growth pathways, cancer cells can exploit AMPK signaling to survive under metabolic stress conditions induced by hypoxia, nutrient limitations, or chemotherapy[19]. The regulatory γ subunit of AMPK is particularly important because it senses cellular energy status through binding of AMP, ADP, and ATP, thereby controlling AMPK activation[20]. However, the isoform-specific contribution of AMPKγ subunits in glioblastoma remains poorly understood. In particular, differential expression or functional switching between γ1 and γ2 isoforms may alter AMPK signaling dynamics and influence cellular adaptation to chemotherapeutic stress[21]. Given that γ subunits determine nucleotide sensitivity and activation dynamics of AMPK[22], isoform-specific switching may represent a critical but underexplored mechanism of metabolic adaptation in glioblastoma. In this study, we investigate the expression and functional significance of AMPKγ subunits in glioblastoma, revealing a potential γ-subunit isoform switching phenomenon associated with temozolomide response. Understanding this mechanism may provide new insight into AMPK-mediated metabolic adaptation and chemoresistance in GBM.
Material & Methods
- GBM Sample collection: GBM tumor tissues (Table 1) were obtained from surgical resection from the Department of Neurosurgery at All India Institute of Medical Sciences, Delhi, India. All samples were collected with the patient’s consent and in accordance with the protocol approved by the Institutional Ethics Committee (IEC-711/07.08.2020, RP-43/2020) for subsequent PCR analysis.
- 2.
- In-silico analysis: Clinical data were obtained from public databases to understand the expression of AMPK genes. Databases including GEPIA[41], GlioVis, and the Human Protein Atlas (HPA)[42] were analyzed for the expression analysis. GlioVis is a user-friendly database for visualization and analysis of brain tumor expression datasets. It offers an interactive interface to analyze gene expression profiles across brain cancer and normal tissues, survival analysis, correlation analysis between gene expressions, etc. We analyzed the RNA sequencing data from brain cancer/normal tissues in The Cancer Genome Atlas (TCGA) and the Clinical Proteomic Tumor Analysis Consortium (CPTAC) to assess protein expression. HPA was used to get IHC images. For the survival plot, GEPIA was used.
3.Molecular Docking Simulations
Molecular docking simulations were conducted to evaluate the binding interaction between the ligand, Temozolomide, ATP, and the gamma-1 subunit of AMPK.
3.1. Ligand Preparation
The three-dimensional structure of Temozolomide (PubChem CID: 5394) and ATP (PubChem CID:5486828) was retrieved from the NCBI PubChem database[43] in Structure Data Format (SDF). The ligand file was subsequently converted to the Protein Data Bank (PDB) format using Open Babel[44]. During this conversion, a weighted rotor search was applied to generate the lowest energy conformer. Final ligand preparation for docking, including the addition of polar hydrogens, calculation of Gasteiger charges, and definition of rotatable bonds via root selection, was performed using Raccoon. The processed ligand was saved in the Protein Data Bank, Partial Charge (Q), & Atom Type (T) (PDBQT) format.
3.2. Receptor Preparation
The three-dimensional crystal structure of AMPK was obtained from the RCSB Protein Data Bank[45] with the PDB ID: 4QFR. To isolate the gamma-1 subunit for targeted docking, the alpha and beta subunits were removed, leaving only the gamma-1 chain. The remaining gamma-1 structure was further prepared by removing all heteroatoms, including water molecules, cofactors, and any bound ligands, using BIOVIA Discovery Studio Visualizer[46] and PyMOL[47]. The isolated gamma-1 subunit was then subjected to energy minimization using the Swiss PDB Viewer[48] with the GROMOS-14B1 force field. For docking preparation, polar hydrogen atoms were added, and Kollman charges were assigned (resulting in partial charges of α-A: -8.376 and α-G: -6.248) using AutoDock Tools v1.5.7[49]. The fully prepared gamma-1 receptor was saved in PDBQT format.
3.3. Docking Protocol and Analysis
Molecular docking was performed using the CB-Dock web server[50], an automated protein-ligand docking tool that employs curvature-based cavity detection for binding site prediction. The server identifies potential binding cavities on the gamma-1 subunit, calculates their centers and sizes, and customizes the docking box dimensions accordingly. The actual docking calculation was executed by AutoDock Vina[51]. Following the simulation, the resulting binding poses were analyzed. The most favorable binding configuration was selected based on the highest AutoDock Vina binding affinity score (kcal/mol) and the appropriateness of the cavity volume for Temozolomide and visualized in discovery studio 2025 client[52].
- 4.
- Cell culture and reagents: Human Glioblastoma cells (LN229 and U87MG) were procured from the National Centre for Cell Sciences (NCCS), Pune, India. The cells were cultured in Dulbecco’s Modified Eagle Medium (DMEM) (11965-092, Gibco), supplemented with 10% Fetal Bovine Serum (FBS) (A5256701 Gibco) and 1% antibiotic (streptomycin and penicillin) in a humidified atmosphere of 5% CO2 at 37° C and were sub-cultured twice a week. For Temozolomide (TMZ) drug (100mM stock solution) dissolved in dimethyl sulfoxide (DMSO) (TC185, HI media) and stored at -20° C.
- 5.
- RNA isolation and PCR: One microgram of total RNA (isolated using the TRIzol method) was used for first-strand cDNA synthesis with the cDNA synthesis kit (Verso, Thermo Fisher). PCR was performed using the EmeraldAmp PCR Master Mix and Eurofins Genomics primer in (Table 2) a Veriti 96-well thermal cycler (Applied Biosystems, Thermo Fisher Scientific). Samples were run in agarose gel electrophoresis, and gel image analysis and quantification were performed by using ImageJ. The graphpad prism was used for graph preparation and statistical analysis.
- 6.
- Plasmid Transfection and shRNA: Plasmids pWZL Neo Myr Flag PRKAG2 (Addgene ID: 20656), pECE-M2-AMPKα2 wt (Addgene ID: 31652), AMPKβ1 Flag (Addgene ID: 40602), AMPKγ1 HA (Addgene ID: 40605), AMPKβ2 MYC (Addgene ID: 40606) were used for overexpressing the gene. Flag AMPKα1 was obtained from Dr. Jingyue Jia, Assistant Professor, Department of Internal Medicine, University of New Mexico, Albuquerque, New Mexico, USA. The shAMPKγ2 plasmid (Clone ID: TRNC0000003148, Target seq- GAAGTGCAATAAGCTGGAAAT, Gene ID: 51422, Ref Seq: NM_016203) was used for the knockdown experiments. Cells were transfected using the Xfect Transfection Reagent (Takara #631317) according to the manufacturer’s protocol.
- 7.
- Cell viability (MTT) assay: LN229 and U87MG cells grown in complete DMEM media in 96-well plate to reach ~70% confluency. Different concentrations of temozolomide (100μM, 200μM, and 400μM) were used for the treatment of 24 hours. To measure cell viability, the 3-(4,5-dimethylthiazol-2-yl)-2,5-diphenyl-tetrazolium bromide (MTT) assay was used. After completion of treatment, 10μL of MTT (5mg/mL) was added to each well and incubated at 37 °C. After 2-3 hours of incubation, the media with MTT was discarded, and 100 μL of DMSO was added to each vial to suspend the crystal. The absorbance readings were obtained using a microplate reader at 570nm. IC 50 was calculated using the OD readings.
- 8.
- Antibodies: The antibodies were purchased from either Cell Signaling Technology (CST) or Proteintech. Antibodies against AMPKα1 Mouse mAb (66536-1-Ig), AMPKα2 Rabbit pAb (18167-1-AP), AMPKβ1 (71C10) Rabbit mAb (#4178), AMPKβ2 Rabbit pAb (#4148), AMPKγ1 Rabbit pAb (#4187), AMPKγ2 Rabbit pAb (#2536), pAMPK alpha (T172) (40H9) Rabbit mAb (#2535T), LC3A/B (D3U4C) XP (R) Rabbit mAb (#1271T), Beta-actin Mouse mAb (8H10D10), Anti-mouse IgG HRP-linked antibody (7076P2), and Anti-rabbit IgG HRP-linked antibody (#7074) were used.
- 9.
- Whole cell lysate preparation and Western blotting: Cell lysate was prepared from 60-100mm culture dishes. Cells were washed with phosphate buffer saline (PBS) and lysed with NP-40 lysis buffer (25 mM Tris pH 8, 150Mm NaCl, 0.1% NP-40, 0.1mM EDTA), and 1x protease inhibitor cocktail (PIC) (ML051, Himedia) was added. The lysate was incubated on ice for 20-25 minutes with vortexing every 5 minutes. The clear supernatant was collected by centrifugation at 12,000 rpm for 15 minutes at 4 °C. Protein concentration was determined using the Bicinchoninic Acid (BCA, Thermo Fisher) reagents. For SDS-PAGE, 100μg of protein lysate was loaded onto a gel and separated under denaturing conditions. The separated proteins were then transferred onto a Bio-Rad immunoblot PDVF membrane (charged with methanol) using the wet transfer method. The membrane was blocked for 1 hour with 3% BSA (blocking buffer) on a rocker at room temperature. It was then incubated with primary antibody (1:1000 dilution in 3% BSA) overnight at 4 °C. Afterward, the membrane was gently washed three times with TBST (TBS buffer with 0.1% Tween-20) and incubated with an HRP-tagged secondary antibody (1:3000) for 2 hours. Following three very gentle TBST washes, the blot was visualized using a blot scanner.
- 10.
- JC-1 mitochondrial membrane integrity analysis: JC-1 dye (5,5’,6,6’-tetrachloro-1,1’,3,3’-tetraethybenimidazolylcarbocyanine iodide) (Thermo Fisher Scientific #T3168) was dissolved in DMSO to prepare a stock solution of 100mM. Phosphate-buffered saline (PBS) was used for the washing steps. Cells were harvested after 24 hours of transfection and 24 hours of TMZ treatment, and washed twice with PBS. JC-1 dye was added at a final working concentration of 0.3 mM, and cells were incubated in the dark at 37 °C for 20 minutes. Following incubation, cells were washed twice with PBS to remove excess dye. Fluorescence was measured using a fluorescence microscope.
- 11.
- AMPKα (pT172) kinase activity assay: AMPK kinase activity was determined by measuring phosphorylation of AMPKα at T172 using AMPKα (pT172) ELISA kit (Thermo Fisher Scientific #KHO0651), according to the manual instructions. Cells from different treatment conditions were lysed in the provided buffer containing protease and phosphatase inhibitors, and clarified lysates were collected after centrifugation. An equal amount of protein was added to the ELISA wells pre-coated with phospho-specific AMPKα (Thr 172) antibody and incubated, followed by detection using secondary antibody. The absorbance was measured at 450nm.
- 12.
- Statistical analysis: All data analyses were done using GraphPad Prism 8.0. We used multiple tests, such as One-way ANOVA, Two-way ANOVA, and t-tests, depending on variables, to estimate the difference between groups. A p-value of <0.05 were considered as significant in whole study (*=p<0.05, **=p<0.01, ***=p<0.001, ****=p<0.0001). All the experiments were performed in triplicates.
Results
- Differential expression of AMPK subunits in GBM
The transcriptional landscape of AMPK subunits in Glioma was assessed using the GlioVis[23] platform. It integrates multiple large-scale brain tumor datasets, including TCGA RNA-seq profiles, and enables standardized visualization of gene expression across tumor subtypes and clinical annotations. Using the database, we examined the mRNA expression patterns of AMPKα (PRKAA1/2), AMPKβ (PRKAB1/2), and AMPKγ (PRKAG1/2) subunits across glioma samples. We first assessed the AMPK subunit expression in non-tumor and GBM (Figure 1A) and observed clear subtype-specific differences. PRKAA1, PRKAB1, and PRKAG1 were significantly highly expressed, whereas expression of PRKAA2, PRKAB2, and PRKAG2 was significantly low in GBM compared to the non-tumor sample. When the datasets were further stratified by WHO tumor grade (I-IV) classification (Figure 1B), a similar divergence emerged. These observations align with earlier transcriptomic studies, which have shown that AMPK components may undergo independent transcriptional regulation in cancer[24], with the selective enrichment or suppression of individual subunits contributing to metabolic rewiring and tumor progression. A significant decrease in PRKAG2 expression was also observed across histological subtypes, including oligodendroglioma, astrocytoma, and GBM (Figure 1C). Although AMPK operates as a heterotrimeric kinase complex, the individual subunits displayed distinct, non-uniform expression profiles. Notably, AMPKγ2 (PRKAG2) showed a consistent and significant decrease in GBM compared to non-tumor brain tissue as well as lower-grade gliomas in both histology-based and grade-based analyses. This suppression appeared to be specific to γ2 and was not uniformly observed for γ1. Immunohistochemistry analysis of AMPKγ2 expression from human protein atlas (HPA) represents a clear difference between normal brain tissue and GBM (Figure 1D).
Supporting these data, correlation analysis of AMPK subunit demonstrates distinct association patterns, suggesting coordinated yet selective regulation within AMPK complexes (Supp. Figure 1A). PRKAG2 expression was observed to be significantly lower in GBM compared to normal brain, determined by transcript-level validation using TCGA datasets (Supp. Figure 1B). This reduction was constant across patient age group and did not show a discernible age-dependent trend (Supp. Figure 1C). To investigate potential mechanisms underlying PRKAG2 downregulation, promoter methylation analysis revealed increased methylation levels in GBM tumors compared to normal samples (Supp. Figure 1D), while age-stratified analysis showed no consistent methylation pattern across groups (Supp. Figure 1E). Interestingly, CpG site-specific analysis revealed no statistically significant difference for PRKAG1, whereas PRKAG2 showed a trend towards increased methylation in tumor samples (Supp. Figure 1G). Consistent with transcriptomic data, proteomic analysis from CPTAC datasets demonstrated reduced PRKAG2 protein levels in GBM tumors relative to normal tissue (Supp. Figure 1F), confirming downregulation at multiple levels. The γ-subunit is critical because it governs AMP/ATP sensing and thereby dictates AMPK activation in response to metabolic stress[25]. To determine whether γ-subunit regulation affects tumor inhibition or supports tumor survival, we examined the expression patterns of AMPKγ1 and AMPKγ2 in glioma patient samples. Analysis of GBM and LGG patient samples revealed distinct expression differences between the two isoforms. Real time-PCR revealed that while AMPKγ1 was consistently expressed across all groups, AMPKγ2 displayed notably reduced expression in both GBM and LGG (Low Grade Glioma) compared to NB (Normal Brain) (Figure 1E). This selective loss of γ2 suggests attenuation of potentially stress-responsive AMPK function during glioma progression.
- 2.
- AMPK subunit expression is altered under TMZ treatment
To determine whether AMPK subunit expression is altered under therapeutic stress, we examined their expression in GBM cell lines, U87MG and LN229 following treatment with Temozolomide (TMZ). TMZ is a DNA-alkylating agent and the current clinical standard for GBM therapy. It is known to activate AMPK signaling and induce metabolic stress responses in glioblastoma cells [26]. To further examine the kinetics of AMPK activation, U87MG cells were treated with TMZ (358 μM) and harvested at different time points (0, 4, 8, and 12 hours). Western blot analysis revealed that phosphorylated AMPK (pAMPK) levels increased over time, and densitometric analysis was performed by plotting pAMPK/AMPK ratio, which confirmed maximal activation at the 8-hour time point (Supp. Figure 2A). This observation is consistent with previous reports demonstrating time-dependent activation of AMPK upon TMZ treatment, with maximal phosphorylation observed around 8 hours in U87MG cells[27]. U87MG and LN229 cells were divided into two groups: untreated control and TMZ-treated at their respective IC50 concentrations (Supp Figure 2B). Real-time PCR analysis revealed that TMZ induced differential expression of AMPK subunits. AMPKγ2 exhibited the most pronounced transcriptional upregulation, with a significant increase in both U87MG (Figure 2A) and LN229 cell lines (Supp. Figure 2C) following TMZ exposure suggesting a stress-responsive activation pattern. In contrast, AMPKγ1 showed a decrease in the TMZ-treated group.
To determine whether these transcriptional trends were represented at the protein level, western blotting was performed. Based on these findings, subsequent experiments were performed for TMZ (358 μM) for 8 hours. Consistent with mRNA data, AMPKγ2 protein levels were markedly elevated upon TMZ treatment, and AMPKγ1 levels decreased (Figure 2B). In addition to total AMPK subunits, we assessed AMPK activation status by measuring phosphorylated AMPK (pAMPK). Quantification showed that pAMPK levels increased approximately 2.5 to 3-fold in TMZ-treated cells compared to the control (Figure 2C), indicating robust activation of AMPK signaling upon TMZ exposure. Overall, AMPKγ2 was reduced in clinical glioma samples, yet it becomes actively upregulated in response to TMZ. TMZ selectively enhances AMPKγ2 expression at both mRNA and protein levels, suggesting a γ2-driven AMPK response during TMZ-induced cellular stress. These findings indicate that γ2 represents a more treatment-responsive AMPK isoform and may play a key role in shifting AMPK towards a resistant state during chemotherapy.
- 3.
- Overexpression of AMPKγ2 reduces TMZ sensitivity in glioblastoma cell lines
We further investigated how individual AMPK subunits affect TMZ-induced cytotoxicity at increasing concentrations of the drug in glioblastoma cell lines. U87MG and LN229 cells were first transfected with AMPK subunit plasmids. After overexpressing each AMPK subunit, cells were treated with increasing doses of TMZ (100, 200, and 400μM), and cell viability was evaluated using the MTT assay. Phase contrast images (Figure 3A) revealed that cells overexpressing AMPKγ2 followed by TMZ treatment, retained higher cell density and confluency with more visible adherent cells compared to TMZ-treated control and other subunit-transfected conditions. The concentration-dependent viability curves (Figure 3C) showed that overexpression of AMPKα1, AMPKα2, AMPKβ1, AMPKβ2, and AMPKγ1 further intensified these effects, resulting in pronounced loss of confluency even at lower TMZ concentrations and extensive cell death, consistent with the known role of AMPKα-β complexes in amplifying metabolic stress and promoting apoptosis under chemotherapeutic pressure. In contrast, overexpression of AMPKγ2 showed a clear protective effect, preserving cell morphology and supporting significantly higher cell viability compared to TMZ alone. A similar protective trend was observed in LN229 cells (Supp. Figure 3), where γ2-overexpressing cells exhibited minimal reduction in viability even at 400μM TMZ, while other subunits showed substantial dose-dependent cell death. This indicates a γ2-specific survival advantage. These data suggest that while AMPKα and β subunits sensitize GBM cells to TMZ-induced stress, AMPKγ2 uniquely confers a cytoprotective response, supporting its potential role in modulating chemotherapy resistance.
- 4.
- TMZ treatment in GBM Cells Exhibits a Distinct AMPK γ -Subunit Profile
To investigate the role of AMPK in response to TMZ treatment in GBM, U87MG cells were treated with increasing concentrations of TMZ, and the expression of the AMPK γ subunit was examined. Semi-quantitative and Real time PCR analysis revealed a dose-dependent alteration in γ-subunit expression (Figure 4A). While AMPKγ1 expression gradually decreased with increasing TMZ concentrations, AMPKγ2 expression showed a marked increase. Quantitative analysis confirmed a significant reduction in AMPKγ1 at higher TMZ doses (200-400μM), whereas AMPKγ2 expression increased significantly compared to untreated controls. To further assess whether these changes were reversible, cells were analyzed following TMZ withdrawal (recovery condition). As shown in Figure 4B, TMZ treatment resulted in a significant decrease in AMPKγ1 transcript levels, whereas AMPKγ2 expression increased markedly. Upon removal of TMZ, partial restoration of γ1 expression and reduction of γ2 levels were observed. Quantitative analysis demonstrated that TMZ treatment significantly suppressed AMPKγ1 while inducing AMPKγ2 expression compared with control cells. γ2/γ1 expression ratio revealed a pronounced shift in AMPK regulatory subunit composition (Figure 4C). TMZ-treated cells exhibited nearly a three-fold increase in the γ2/γ1 ratio relative to untreated controls, indicating a substantial alteration in the AMPK subunit balance following chemotherapy exposure. These transcriptional changes were further validated at the protein level by western blot analysis (Figure 4D). Consistent with the mRNA data, TMZ treatment reduced AMPKγ1 protein levels while significantly increasing AMPKγ2 expression. Upon drug removal, partial normalization of γ1 and γ2 protein levels was observed. Densitometric quantification confirmed a significant decrease in γ1 and a corresponding increase in γ2 following TMZ treatment.
This transcriptional regulation was further validated using an independent transcriptomic dataset (GSE158772). Analysis of this dataset confirmed the differential expression of AMPK gamma subunits following TMZ treatment. Consistent with our cellular models, PRKAG2 showed a significant upregulation (Log2FC = 2.53), although PRKAG1 was also elevated (Log2FC = 1.52) but not as robust as PRKAG2. In contrast, PRKAG3 (AMPKγ3) expression remained low and was not significantly altered (Supp. Figure 4A). To identify the biological processes and pathways affected by TMZ treatment, we performed pathway enrichment analysis on the transcriptomic data. Among the top 20 significantly upregulated pathways (Supp. Figure 4B), we observed a strong enrichment of metabolic and stress-responsive signalling cascades, including the AGE-RAGE signalling pathway in diabetic complications, Diabetic cardiomyopathy, and Energetics. Notably, multiple inflammatory and immune-related pathways were also prominently upregulated, such as IL-17 signalling pathway, TNF signalling pathway, NF-kappa B signalling pathway, JAK-STAT signalling pathway, and NOD-like receptor signalling pathway. This suggests that TMZ-induced AMPK activation may be coupled with a pro-inflammatory transcriptional program. Additionally, pathways related to structural remodelling, including cytoskeleton in muscle cells and ECM-receptor interaction, were among the most significantly upregulated. Conversely, examination of the top 20 downregulated pathways (Supp. Figure 4C) revealed a suppression of processes associated with specialized metabolic functions and tissue homeostasis, further supporting a metabolic shift in response to TMZ-induced stress. The significance and gene count for these enriched pathways are summarized in Supp. Figure 4B-C.
- 5.
- Silencing AMPKγ2 sensitizes glioblastoma cell lines to TMZ
To validate the observation that AMPKγ2 overexpression reduces TMZ sensitivity, we next examined whether silencing AMPKγ2 expression levels could directly modulate the concentration-dependent cytotoxicity response to TMZ. Semi-quantitative PCR analysis confirmed efficient modulation of AMPKγ2 expression. AMPKγ2 transcript levels were reduced in shAMPKγ2-transfected cells and elevated in AMPKγ2-overexpressing cells (Figure 5A). Further validation across six experimental conditions (control, TMZ, γ2 knockdown, γ2 knockdown +TMZ, γ2 overexpression, γ2 overexpression + TMZ) showed distinct expression patterns (Figure 5B), where AMPKγ2 expression increased upon TMZ treatment, decreased in knockdown cells, and was markedly elevated in overexpressing cells, with the highest expression observed in the TMZ-treated γ2 overexpressing cells. Quantitative analysis supported these trends, confirming successful knockdown and overexpression of AMPKγ2. U87MG and LN229 cell lines were transfected to knock down AMPKγ2 using shAMPKγ2 plasmid and overexpressed via the AMPKγ2 plasmid, followed by treatment with increasing TMZ concentrations (Figure 5C and Supp. Figure 5A). Crystal violet-stained phase contrast images in control cells, TMZ induced a progressive reduction in cell density and increased cellular rounding in a dose-dependent manner. This cytotoxic effect was markedly amplified in knockdown cells, which showed extensive cell shrinkage and detachment even at 100-200μM TMZ, indicating enhanced drug vulnerability. In contrast, AMPKγ2-overexpressed cells retained higher confluency and maintained a spindle-like morphology across all TMZ concentrations. Consistent with these phenotypic observations, cell viability measurements demonstrated that knockdown cells exhibited a decline in survival with increasing TMZ doses, whereas overexpressing cells maintained significant viability at 200-400μM (Supp. Figure 5B).
- 6.
- AMPKγ2 knockdown diminishes while overexpression enhances AMPK activation under TMZ treatment
To investigate whether AMPKγ2 modulated AMPK activation under stress, U87MG cells were subjected to γ2 knockdown and overexpression, followed by TMZ treatment. Western blot analysis (Figure 6A) showed that pAMPK levels increased after TMZ exposure in control cells, consistent with initial time course observations. Notably, γ2 knockdown attenuated this TMZ-induced rise in pAMPK, whereas γ2 overexpression markedly enhanced AMPK phosphorylation, indicating that γ2 expression directly influences AMPK activation efficiently. Total AMPK levels remained stable across all groups, confirming that changes in phosphorylation were not due to altered AMPK abundance. AMPKγ2 protein levels corresponded appropriately to knockdown and overexpression conditions. We further assessed autophagic flux by monitoring LC3A/B. LC3 (microtubule-associated protein 1 light chain 3) is a key autophagy marker, and its conversion from LC3-I to LC3-II reflects autophagosome formation, serving as an indicator of autophagic activity[28]. This conversion occurs via lipidation, wherein LC3-I is conjugated to phosphatidylethanolamine to form the membrane-bound LC3-II[29]. TMZ treatment increased the lipidated LC3-II form, and this shift was more prominent under γ2 overexpression, whereas γ2 knockdown blunted the LC3 conversion pattern, implying AMPKγ2-dependent enhancement of autophagy signaling. Quantification of pAMPK normalized to AMPK showed the highest activation in γ2-overexpressing TMZ-treated cells (Figure 6B), supporting the western blot observations. Finally, kinase activity assay demonstrated a similar trend (Figure 6C): γ2 knockdown reduced AMPK activity in response to TMZ, whereas γ2 overexpression significantly elevated kinase activity, particularly under TMZ treatment. To evaluate mitochondrial health, JC-1 staining was performed (Supp. Figure 6). Control cells exhibit strong red fluorescence, indicating intact mitochondrial membrane potential. TMZ treatment led to a marked reduction in red fluorescence with a corresponding increase in green signal, suggesting mitochondrial depolarization. In contrast, γ2 overexpression in TMZ-treated cells restored red fluorescence intensity, indicating improved mitochondrial membrane potential compared to TMZ alone. Quantitative analysis of the red/green fluorescence ratio further supported these observations, showing a significant decrease in TMZ-treated cells relative to control, while γ2 overexpression significantly increased the ratio under TMZ conditions. Together, these results demonstrate that AMPKγ2 amplifies TMZ-induced AMPK activation, positioning γ2 as the preferred and functionally dominant AMPK subunit during chemotherapy stress.
- 7.
- Co-Immunoprecipitation Confirms Structural Remodeling of the AMPK Heterotrimer
We next asked whether the observed expression changes resulted in the formation of new AMPK complexes. To establish if AMPKγ2 serves as the dominant regulatory subunit engaged during TMZ-induced AMPK activation, we performed co-immunoprecipitation (co-IP) assays in U87MG cells treated with TMZ (Figure 7A). AMPKα was immunoprecipitated from control and TMZ-treated lysates, and the presence of AMPKγ1 and AMPKγ2 in the AMPKα complex was examined to assess subunit-specific association. In untreated cells, both γ1 and γ2 were detectable in the AMPKα immunoprecipitated, although γ1 exhibited slightly higher basal association. In parental cells, the AMPK α1 catalytic subunit was primarily associated with the γ1 isoform. However, in TMZ-resistant cells, there was a robust shift in binding occupancy: α1 association with γ1 significantly decreased, while its association with γ2 increased by double (Figure 7B). These data provide definitive evidence that the AMPK heterotrimer undergoes physical remodeling (a “subunit switch”) during the acquisition of TMZ resistance. Following TMZ treatment, a clear shift in subunit preference emerged. AMPKγ2 co-precipitation increased markedly, indicating enhanced recruitment of γ2 to the AMPKα complex under metabolic stress. In contrast, γ1 association showed minimal change, suggesting that γ1 does not respond dynamically to TMZ-induced activation cues. Input controls confirmed in co-IP intensities reflected altered binding rather than differences in protein abundance. Importantly, the increase in γ2 association paralleled the heightened AMPK phosphorylation observed under TMZ treatment, supporting a model in which γ2 facilitates or stabilizes stress-induced AMPK activation. The preferential interaction between AMPKγ2 and AMPKα reinforces earlier findings from overexpression and knockdown experiments, where γ2 abundance strongly correlated with enhanced pAMPK levels and kinase activity. These co-IP results provide biochemical evidence that AMPKγ2 is selectively engaged during TMZ-triggered AMPK activation, thereby functioning as the preferred regulatory subunit orchestrating AMPK signaling under chemotherapeutic stress.
To complement these co-IP observations, we next performed molecular docking simulations to assess whether TMZ directly interacts with AMPKγ isoforms and whether structural determinants could account for the preferential engagement of AMPKγ2 in TMZ-treated cells (Figure 7C). Using a curated structural model of the AMPKγ subunit, TMZ was blindly docked into predicted binding pockets of both γ1 and γ2 isoforms. Docking scores and interaction profiles were compared to evaluate isoform-specific binding preferences. In silico analysis revealed that TMZ binds to AMPKγ2 with a more favorable binding energy (ΔG = -7.0 kcal/mol) compared to AMPKγ1 (ΔG = -6.4 kcal/mol), suggesting enhanced affinity for the γ2 isoform. Closer inspection of the docking pose for AMPKγ2 revealed that TMZ is stabilized within a hydrophobic cleft through multiple non-covalent interactions. Key residues involved included van der Waals contacts with ALA:204, ILE:224, VAL:226, THR:227, LEU:228, ALA:229, PRO:311, and SER:315. Additionally, a carbon-hydrogen bond was observed with SER:225, further stabilizing the ligand within the binding pocket. These interactions collectively support a model in which TMZ binds directly to AMPKγ2, potentially modulating its conformation or stabilizing its association with the AMPKα catalytic subunit. In contrast, docking of TMZ to AMPKγ1 yielded fewer favourable contacts and a less complementary binding interface, consistent with its lower binding affinity and the reduced functional engagement observed in co-IP experiments. Together, these in silico findings provide a structural rationale for the TMZ-induced subunit switch observed in Figure 7A. The preferential docking of TMZ to AMPKγ2 may facilitate the recruitment and stabilization of this regulatory subunit within the AMPK heterotrimer, thereby promoting sustained kinase activation under conditions of chemotherapeutic stress.
To further explore the structural basis underlying isoform-specific interactions within the AMPK heterotrimer, we performed molecular docking simulations to compare the binding of ATP to the AMPKγ1 and AMPKγ2 subunits (Supp. Figure 7). Given that AMPK functions as a cellular energy sensor primarily regulated by adenine nucleotide binding to its γ subunit, we reasoned that differential ATP affinity between γ isoforms could contribute to the functional divergence observed in TMZ-resistant cells. Docking analyses revealed marked differences in ATP binding parameters between the two isoforms. The AMPKγ1 subunit exhibited a Vina score of -9.1 kcal/mol, indicating robust ATP binding within a predicted cavity. In contrast, ATP docking to AMPKγ2 yielded a less favorable binding energy of -7.6 kcal/mol, despite a substantially larger cavity volume. These findings suggest that while AMPKγ2 possesses a more expansive potential binding pocket, its structural configuration confers reduced ATP affinity relative to AMPKγ1 under basal conditions. The differential ATP binding affinities observed here align with the established role of AMPKγ1 as a high-affinity ATP-binding module under energy-replete conditions. Conversely, the lower ATP affinity of AMPKγ2 may render this isoform more responsive to fluctuations in cellular energy status, particularly under conditions of metabolic stress such as TMZ exposure. This structural distinction provides a plausible mechanism for the preferential engagement of AMPKγ2 during TMZ-induced AMPK activation, as the reduced ATP occupancy in γ2 may facilitate allosteric activation by AMP or ADP when ATP levels decline.
To gain insight into the transcriptional landscape associated with AMPKγ subunit expression in glioblastoma, we analysed publicly available tumor datasets to identify genes whose expression correlates with PRKAG1 and PRKAG2, the genes encoding the AMPKγ1 and AMPKγ2 regulatory subunits, respectively (Supp.Figure 8 and Supp. Figure 9). This approach was undertaken to infer potential co-regulated pathways and biological processes linked to each isoform. Analysis of PRKAG1-correlated genes in glioblastoma specimens revealed a distinct set of positively associated transcripts enriched for components of cellular housekeeping and metabolic complexes (Supp. Figure 8). Among the top positive correlates were VPS29 (ρ = 0.8), SNAPIN (ρ = 0.8), and LAMTOR5 (ρ = 0.77), all of which participate in endosomal trafficking and mTOR signalling. Additional positively correlated genes included multiple subunits of the oxidative phosphorylation machinery (NDUFA4, NDUFC2, NDUFA12), components of the COP9 signalosome (COPS4), and assembly factors for mitochondrial complexes (COX14, NFU1). This profile suggests that PRKAG1 expression aligns with genes governing fundamental metabolic infrastructure, consistent with the canonical role of AMPKγ1 in energy homeostasis under basal conditions. Conversely, negatively correlated genes with PRKAG1 included transcriptional regulators such as SRRM2 (ρ = -0.71), ZNF646 (ρ = -0.71), and PRRC2B (ρ = -0.69), as well as chromatin modifiers including KDM6B (ρ = -0.66) and KMT2B (ρ = -0.65), indicating an inverse relationship between PRKAG1 expression and certain transcriptional regulatory networks.
In contrast, PRKAG2-correlated genes exhibited a markedly different expression signature (Supp. Figure 9). The top positive correlates included ETNPPL (ρ = 0.58), SLC14A1 (ρ = 0.57), and PPP1R1B (ρ = 0.55), genes involved in metabolic adaptation and stress response. Several additional positively associated transcripts such as GCLC (ρ = 0.52), a rate-limiting enzyme in glutathione synthesis, and PEBP4 (ρ = 0.51), implicated in cell survival signalling point toward a coordinated program linked to oxidative stress management and therapeutic resistance. Notably, genes negatively correlated with PRKAG2 included those encoding endoplasmic reticulum chaperones (PDIA3, PDIA6, HSP90B1) and components of the extracellular matrix (LAMC1, COL9A3), as well as immune modulatory molecules such as CD276 (ρ = -0.47). This inverse correlation suggests that high PRKAG2 expression may be associated with repression of ER stress and matrix remodelling pathways. Collectively, these correlation analyses reveal that PRKAG1 and PRKAG2 are embedded within distinct transcriptional networks in glioblastoma. While PRKAG1 correlates with genes maintaining core metabolic and proteostatic functions, PRKAG2 expression aligns with a stress-adaptive transcriptional program. This divergence provides a transcriptomic rationale for the functional switch toward γ2-dominant AMPK signalling observed under TMZ-induced metabolic stress.
Discussion
Clinical Implications: Beyond General AMPK Activation
Historically, researchers have attempted to treat cancer using global AMPK activators (such as Metformin)[30]. However, our data suggests a more nuanced approach is required. If GBM cells survive by switching to a γ2 specific complex, a general activator might inadvertently help the resistant cells [31]. Instead, our study points toward isoform-specific inhibition or the prevention of the “switch” itself as a superior therapeutic strategy to resensitize GBM to TMZ. Glioblastoma (GBM) is a highly aggressive brain tumor with rapid progression and strong resistance to conventional chemotherapy[32]. AMP-activated protein kinase (AMPK) is a heterotrimeric αβγ complex that regulates cellular energy balance, with isoform diversity contributing to its activity and localization[33]. In this study, we analyzed the expression of AMPK subunits in GBM cell lines and evaluated their response to the chemotherapeutic drug, TMZ. Using publicly available transcriptomic datasets and validation in GBM and LGG patient samples, we observed a fundamental variation in the γ1 and γ2 subunits expression. The in-silico analysis of γ2 subunit expression was validated using the q-PCR, which showed a markedly downregulation in the GBM compared to the NB. Previous studies have shown differences in AMPK subunit expression affecting AMPK activation [34,35,36]. We observed that although GBM samples showed a lower expression of AMPKγ2, treatment with TMZ led to significantly increased expression of AMPKγ2, accompanied with elevated p-AMPK levels, indicating enhanced pathway activation under chemotherapy stress. Previous studies have already confirmed that TMZ induces AMPK activation in the primary cultured GBM cell lines[27].
To further evaluate the importance of AMPK subunits in modulating TMZ response, U87MG and LN229 cells were transfected with different AMPK subunits. Transfection with AMPKα and AMPKβ and treatment with different concentrations of TMZ led to an increased sensitivity, to TMZ, but cells transfected with AMPKγ2 showed decreased sensitivity to TMZ. Further, to confirm switching between γ1 and γ2 subunits, we treated GBM cells with TMZ for 24 hours and then replaced the culture media with fresh media to analyse expression patterns during recovery. A significant increase and decrease in the γ2 and γ1 subunit respectively upon TMZ treatment was reversed during removal of TMZ, thus demonstrating a distinct AMPKγ expression profile during TMZ treatment. A significant low expression in the AMPKγ2 subunit in the recovery period justified the switching of γ2 to γ1 subunit under recovery. These findings were also observed with GEO dataset (GSE158772), although γ1 and γ2 both showed an increase in expression upon TMZ treatment but γ2 showed a 3-fold higher increase demonstrating its cytoprotective role during chemotherapy. In corroboration, there are previous studies describing the cytoprotective role of the γ2 subunit in myocardial Ischemia/reperfusion injury and breast cancer[37,38]. To confirm the cytoprotective role of γ2 subunit during TMZ treatment, we silenced and over-expressed AMPKγ2 in GBM cell lines. We observed a significantly reduced and enhanced survival of TMZ treated GBM cells upon AMPKγ2 silencing and overexpression respectively. Furthermore, a significant change in the TMZ IC50 was observed, suggesting that silencing the AMPKγ2 subunit sensitized GBM cells, whereas overexpression made them resistant to TMZ, leading to increased cell viability
Moreover, TMZ treatment in AMPKγ2 overexpressing cells caused a significant increase in pAMPK levels as compared to TMZ treatment alone. On contrary, knockdown of AMPKγ2 abolished TMZ induced AMPK activation, highlighting the crucial role of AMPKγ2 in mediating AMPK activation under chemotherapeutic stress. A previous study has reported. that depletion of γ1, but not γ2, drastically reduced metformin activation of AMPK[39]. Thus, γ1 and γ2 subunits might play a context dependent role in fine-tuning AMPK activation under different conditions. The unique role of AMPKγ2 was further validated by Co-IP experiment confirming the preferential binding of γ2 subunit with the AMPKαβ complex under TMZ treatment. Thus, the isoform-specific function of AMPKγ subunit plays an important role in AMPK activation. These findings suggest that AMPKγ2 might play a key role in GBM chemoresistance, and targeted modulation of AMPKγ2 may provide a promising strategy to sensitize tumor cells to TMZ and improve therapeutic outcomes.
The “Energy Sensor” Sensitivity Hypothesis
The most significant finding of this study is that the AMPK heterotrimer is not a static entity but a dynamic sensor that adapts to chemotherapy. The γ subunits contain four cystathionine beta-synthase (CBS) domains, known as Bateman domains, which serve as the regulatory heart of the complex by binding AMP, ADP, or ATP[40]. Our results suggest that the transition from γ1 to γ2 in Glioblastoma (GBM) cells essentially recalibrates the cellular fuel gauge. Literature indicates that γ2-containing complexes often exhibit different affinities for AMP and are less sensitive to inhibition by ATP compared to γ1[34]. In the context of TMZ treatment, which induces DNA damage and subsequent ATP depletion, this switch likely allows AMPK to remain active (phosphorylated) even when the energy crisis is severe, ensuring that survival-promoting pathways like fatty acid oxidation and autophagy are maintained.
Bypassing the “Death Threshold”
In parental γ1-dominant cells, the rapid drop in ATP following TMZ exposure leads to a failure of AMPK to sustain metabolic homeostasis, resulting in a metabolic collapse and apoptosis. By remodelling the complex to include the γ2 isoform, resistant cells effectively lower their “death threshold.” This isoform diversity provides a selective advantage, allowing the tumor to navigate the energetic stress of alkylating agents that would otherwise be lethal.
The Biochemical Basis of the γ2 Subunit Switch
| Feature | γ1-AMPK (Sensitive) | γ2-AMPK (Resistant) |
| ATP Sensitivity | High (Inhibited easily by ATP) | Low (Maintains activity during stress) |
| Metabolic State | Dependent on Glucose | High Mitochondrial Plasticity |
| Response to TMZ | Energy Collapse / Apoptosis | Metabolic Adaptation / Survival |
| Clinical Outcome | Chemosensitivity | Chemoresistance |
Supplementary Materials
The following supporting information can be downloaded at the website of this paper posted on Preprints.org.
Author Contributions
Shweta Dongre: Experiment work, Figure preparation, writing; Arpit Sharma: Figure preparation, writing, editing; Naveen Soni: Writing, editing, and experimental work; Bhawana Bissa: Conceptualization, writing, supervision, funding acquisition, proofreading.
Funding
This study was supported by SERB-Power Grant (SPG/2021/002833).
Acknowledgments
We thank Dr. Kunzang Chosdol, AIIMS Delhi for providing GBM and LGG patient samples. We thank Dr. Jingyue Jia, UNM, USA for providing AMPK-Flag plasmid. We thank the Department of Biochemistry, Central University of Rajasthan, for providing research facilities, DBT-BUILDER and Central Instrumentation Facility (Central University of Rajasthan) for providing instrumental support.
Conflicts of Interest
The authors declare no conflict of interest.
Abbreviations
| GBM | Glioblastoma Multiforme |
| LGG | Low Grade Glioma |
| TMZ | Temozolomide |
| AMPK | AMP-activated protein kinase |
| TCGA | The Cancer Genome Atlas |
| HPA | Human Protein Atlas |
| DMSO | Dimethyl Sulfoxide |
| FBS | Fetal Bovine Serum |
| DMEM | Dulbecco’s Modified Eagle Medium |
| GEO | Gene Expression Omnibus |
References
- Zhan, W.; et al. Energy stress promotes P-bodies formation via lysine-63-linked polyubiquitination of HAX1. EMBO J. 2024, vol. 43(no. 13), 2759–2788. [Google Scholar] [CrossRef] [PubMed]
- Trefts, E.; Shaw, R. J. AMPK: restoring metabolic homeostasis over space and time. Mol. Cell 2021, vol. 81(no. 18), 3677–3690. [Google Scholar] [CrossRef]
- Sharma, A.; Anand, S. K.; Singh, N.; Dwivedi, U. N.; Kakkar, P. AMP-activated protein kinase: An energy sensor and survival mechanism in the reinstatement of metabolic homeostasis. Exp. Cell Res. 2023, vol. 428(no. 1), 113614. [Google Scholar] [CrossRef]
- Chen, W. Nutrient-sensing AgRP neurons relay control of liver autophagy during energy deprivation. Cell Metab. 2023, vol. 35(no. 5), 786–806.e13. [Google Scholar] [CrossRef] [PubMed]
- Crunkhorn, S. A new route to regulating AMPK activity. Nat. Rev. Drug Discov. 2021, vol. 20(no. 3), 175–175. [Google Scholar] [CrossRef]
- Ross, F. A.; MacKintosh, C.; Hardie, D. G. AMP-activated protein kinase: a cellular energy sensor that comes in 12 flavours. FEBS J. 2016, vol. 283(no. 16), 2987–3001. [Google Scholar] [CrossRef] [PubMed]
- Rakoubian, A.; Khinchin, J.; Yarbro, J.; Kobayashi, S.; Liang, Q. Isoform-specific roles of AMP-activated protein kinase in cardiac physiology and pathophysiology. Front Cardiovasc Med. 2025, vol. 12, 1638515. [Google Scholar] [CrossRef]
- Wang, S.; Li, H.; Yuan, M.; Fan, H.; Cai, Z. Role of AMPK in autophagy. Front. Physiol. 2022, vol. 13. [Google Scholar] [CrossRef]
- Penugurti, V.; Manne, R. K.; Bai, L.; Kant, R.; Lin, H.-K. AMPK: The energy sensor at the crossroads of aging and cancer. Semin. Cancer Biol. 2024, vol. 106–107, 15–27. [Google Scholar] [CrossRef]
- Willows, R. Phosphorylation of AMPK by upstream kinases is required for activity in mammalian cells. Biochem J. 2017, vol. 474(no. 17), 3059–3073. [Google Scholar] [CrossRef]
- Taylor, O.G.; Brzozowski, J. S.; Skelding, K. A. Glioblastoma Multiforme: An Overview of Emerging Therapeutic Targets. Front. Oncol. 2019, vol. 9. [Google Scholar] [CrossRef] [PubMed]
- Wu, W. Glioblastoma multiforme (GBM): An overview of current therapies and mechanisms of resistance. Pharmacol. Res. 2021, vol. 171, 105780. [Google Scholar] [CrossRef]
- Królikowska, K.; Błaszczak, K.; Ławicki, S.; Zajkowska, M.; Gudowska-Sawczuk, M. Glioblastoma—A Contemporary Overview of Epidemiology, Classification, Pathogenesis, Diagnosis, and Treatment: A Review Article. Int. J. Mol. Sci. 2025, vol. 26(no. 24), 12162. [Google Scholar] [CrossRef] [PubMed]
- Kordyukova, M. Y.; et al. Overcoming Chemoresistance in Glioblastoma: Mechanisms, Therapeutic Strategies, and Functional Precision Medicine. Int. J. Mol. Sci. 2026, vol. 27(no. 5). [Google Scholar] [CrossRef]
- Carretero-Fernández, M. Autophagy and oxidative stress in solid tumors: Mechanisms and therapeutic opportunities. Crit. Rev. Oncol. 2025, vol. 212, 104820. [Google Scholar] [CrossRef]
- Mihaylova, M. M.; Shaw, R. J. The AMP-activated protein kinase (AMPK) signaling pathway coordinates cell growth, autophagy, & metabolism. Nat. Cell Biol. 2011, vol. 13(no. 9), 1016–1023. [Google Scholar] [CrossRef]
- Wang, N.; et al. AMPK-a key factor in crosstalk between tumor cell energy metabolism and immune microenvironment? Cell Death Discov. 2024, vol. 10(no. 1), 237. [Google Scholar] [CrossRef]
- Keerthana, C. K.; et al. The role of AMPK in cancer metabolism and its impact on the immunomodulation of the tumor microenvironment. Front Immunol. 2023, vol. 14, 1114582. [Google Scholar] [CrossRef]
- Penugurti, V.; Mishra, Y. G.; Manavathi, B. AMPK: An odyssey of a metabolic regulator, a tumor suppressor, and now a contextual oncogene. Biochim. Et. Biophys. Acta (BBA) -Rev. Cancer 2022, vol. 1877(no. 5), 188785. [Google Scholar] [CrossRef]
- Garcia, D.; Shaw, R. J. AMPK: mechanisms of cellular energy sensing and restoration of metabolic balance. Mol. Cell 2017, vol. 66(no. 6), 789–800. [Google Scholar] [CrossRef] [PubMed]
- Willows, R.; Navaratnam, N.; Lima, A.; Read, J.; Carling, D. Effect of different γ-subunit isoforms on the regulation of AMPK. Biochem J. 2017, vol. 474(no. 10), 1741–1754. [Google Scholar] [CrossRef]
- Schmitt, D. L. Spatial regulation of AMPK signaling revealed by a sensitive kinase activity reporter. Nat. Commun. 2022, vol. 13(no. 1), 3856. [Google Scholar] [CrossRef]
- Bowman, R. L.; Wang, Q.; Carro, A.; Verhaak, R. G. W.; Squatrito, M. GlioVis data portal for visualization and analysis of brain tumor expression datasets. Neuro Oncol. 2017, vol. 19(no. 1), 139–141. [Google Scholar] [CrossRef]
- Liang, M. Epithelial–Mesenchymal Transition Suppresses AMPK and Sensitizes Cancer Cells to Pyroptosis under Energy Stress. Cells 2022, vol. 11(no. 14), 2208. [Google Scholar] [CrossRef] [PubMed]
- Mihaylova, M. M.; Shaw, R. J. The AMP-activated protein kinase (AMPK) signaling pathway coordinates cell growth, autophagy, & metabolism. Nat. Cell Biol. 2011, vol. 13(no. 9), 1016–1023. [Google Scholar] [CrossRef]
- Zou, Y.; Wang, Q.; Li, B.; Xie, B.; Wang, W. Temozolomide induces autophagy via ATM-AMPK-ULK1 pathways in glioma. Mol. Med. Rep. 2014, vol. 10(no. 1), 411–416. [Google Scholar] [CrossRef] [PubMed]
- Zhang, W.; et al. Activation of AMP-activated Protein Kinase by Temozolomide Contributes to Apoptosis in Glioblastoma Cells via p53 Activation and mTORC1 Inhibition *. J. Biol. Chem. 2010, vol. 285(no. 52), 40461–40471. [Google Scholar] [CrossRef]
- Bonam, S. R.; Bayry, J.; Tschan, M. P.; Muller, S. Progress and Challenges in the Use of MAP1LC3 as a Legitimate Marker for Measuring Dynamic Autophagy In Vivo. Cells 2020, vol. 9(no. 5), 1321. [Google Scholar] [CrossRef]
- Li, W.; et al. Phospholipid peroxidation inhibits autophagy via stimulating the delipidation of oxidized LC3-PE. Redox Biol. 2022, vol. 55, 102421. [Google Scholar] [CrossRef]
- Zhang, Y.; Zhao, L.; Zhang, K.; Gao, Y. Metformin and oncogenic pathways: Crosstalk between energy sensing and tumor progression. Mol. Cell. Probes 2026, vol. 86, 102068. [Google Scholar] [CrossRef]
- Yalamarty, S. S. K.; et al. Mechanisms of Resistance and Current Treatment Options for Glioblastoma Multiforme (GBM). Cancers 2023, vol. 15(no. 7), 2116. [Google Scholar] [CrossRef]
- Esparza-Salazar, F. Glioblastoma: A Multidisciplinary Approach to Its Pathophysiology, Treatment, and Innovative Therapeutic Strategies. Biomedicines 2025, vol. 13(no. 8), 1882. [Google Scholar] [CrossRef]
- Hardie, D. Grahame. AMP-activated protein kinase: a key regulator of energy balance with many roles in human disease. J. Intern Med. 2014, vol. 276(no. 6), 543–559. [Google Scholar] [CrossRef] [PubMed]
- Braverman, E. L.; et al. Overexpression of AMPKγ2 increases AMPK signaling to augment human T cell metabolism and function. J. Biol. Chem. 2023, vol. 300(no. 1), 105488. [Google Scholar] [CrossRef]
- Afinanisa, Q.; Cho, M. K.; Seong, H.-A. AMPK Localization: A Key to Differential Energy Regulation. Int. J. Mol. Sci. 2021, vol. 22(no. 20), 10921. [Google Scholar] [CrossRef]
- Chauhan, A.S.; Zhuang, L.; Gan, B. Spatial control of AMPK signaling at subcellular compartments. Crit. Rev. Biochem Mol. Biol. 2020, vol. 55(no. 1), 17–32. [Google Scholar] [CrossRef] [PubMed]
- Zhao, H.; Orhan, Y. C.; Zha, X.; Esencan, E.; Chatterton, R. T.; Bulun, S. E. AMP-activated protein kinase and energy balance in breast cancer. Am. J. Transl. Res. 2017, vol. 9(no. 2), 197–213. [Google Scholar]
- Cao, Y. Activation of γ2-AMPK Suppresses Ribosome Biogenesis and Protects Against Myocardial Ischemia/Reperfusion Injury. Circ. Res. 2017, vol. 121(no. 10), 1182–1191. [Google Scholar] [CrossRef] [PubMed]
- An, H.; Wang, Y.; Qin, C.; Li, M.; Maheshwari, A.; He, L. The importance of the AMPK gamma 1 subunit in metformin suppression of liver glucose production. Sci. Rep. 2020, vol. 10, 10482. [Google Scholar] [CrossRef]
- Xu, Y. A novel, de novo mutation in the PRKAG2 gene: infantile-onset phenotype and the signaling pathway involved. Am. J. Physiol. Heart Circ. Physiol. 2017, vol. 313(no. 2), H283–H292. [Google Scholar] [CrossRef]
- T. Z, L. C, K. B, G. G, L. C, and Z. Z, GEPIA: a web server for cancer and normal gene expression profiling and interactive analyses. Nucleic Acids Res. 2017, vol. 45(no. W1). [CrossRef]
- Thul, P. J.; Lindskog, C. The human protein atlas: A spatial map of the human proteome. Protein Sci. 2018, vol. 27(no. 1), 233–244. [Google Scholar] [CrossRef]
- Kim, S. PubChem Substance and Compound databases. Nucleic Acids Res. 2016, vol. 44(no. D1), D1202–1213. [Google Scholar] [CrossRef]
- O’Boyle, N. M.; Banck, M.; James, C. A.; Morley, C.; Vandermeersch, T.; Hutchison, G. R. Open Babel: An open chemical toolbox. J. Cheminform 2011, vol. 3, 33. [Google Scholar] [CrossRef] [PubMed]
- Berman, H. M. The Protein Data Bank. Nucleic Acids Res. 2000, vol. 28(no. 1), 235–242. [Google Scholar] [CrossRef]
- Kemmish, H.; Fasnacht, M.; Yan, L. Fully automated antibody structure prediction using BIOVIA tools: Validation study. PLoS ONE 2017, vol. 12(no. 5), e0177923. [Google Scholar] [CrossRef] [PubMed]
- Rigsby, R. E.; Parker, A. B. Using the PyMOL application to reinforce visual understanding of protein structure. Biochem Mol. Biol. Educ. 2016, vol. 44(no. 5), 433–437. [Google Scholar] [CrossRef]
- Kaplan, W.; Littlejohn, T. G. Swiss-PDB Viewer (Deep View). Brief. Bioinform. 2001, vol. 2(no. 2), 195–197. [Google Scholar] [CrossRef] [PubMed]
- El-Hachem, N.; Haibe-Kains, B.; Khalil, A.; Kobeissy, F. H.; Nemer, G. AutoDock and AutoDockTools for Protein-Ligand Docking: Beta-Site Amyloid Precursor Protein Cleaving Enzyme 1(BACE1) as a Case Study. Methods Mol. Biol. 2017, vol. 1598, 391–403. [Google Scholar] [CrossRef]
- Liu, Y.; Grimm, M.; Dai, W.-T.; Hou, M.-C.; Xiao, Z.-X.; Cao, Y. CB-Dock: a web server for cavity detection-guided protein-ligand blind docking. Acta Pharmacol. Sin. 2020, vol. 41(no. 1), 138–144. [Google Scholar] [CrossRef]
- Trott, O.; Olson, A. J. AutoDock Vina: improving the speed and accuracy of docking with a new scoring function, efficient optimization, and multithreading. J. Comput Chem. 2010, vol. 31(no. 2), 455–461. [Google Scholar] [CrossRef] [PubMed]
- Gao, Y.-D.; Huang, J.-F. [An extension strategy of Discovery Studio 2.0 for non-bonded interaction energy automatic calculation at the residue level]. Dongwuxue Yanjiu 2011, vol. 32(no. 3), 262–266. [Google Scholar] [CrossRef]
Figure 1.
Differential expression of AMPK subunits in GBM. (A) Expression analysis of AMPK subunit genes PRKAA1, PRKAA2, PRKAB1, PRKAB2, PRKAG1, and PRKAG2 in Glioblastoma (GBM). (B, C) mRNA expression analysis of PRKAG2 across different Glioma tumor grades and histological subtypes. (D) Immunohistochemistry (IHC) images showing AMPKγ2 expression in normal brain tissue and GBM using HPA004246 antibody. (E) RT-PCR validation of AMPKγ1 and AMPKγ2 expression.

Figure 2.
AMPKγ subunits show differential expression in response to TMZ treatment. (A) Semiquantitative and Real Time PCR analysis of AMPK subunit transcripts in U87MG cells following temozolomide (TMZ) treatment. Representative gel images with expected amplicon sizes are shown. The bar graph represents fold change in mRNA expression level relative to untreated control, normalized with 18S rRNA. (B) Western blot analysis of AMPK subunits in U87MG cells treated with TMZ for 8 hours. Protein levels of pAMPK, AMPKα1, AMPKα2, AMPKβ1, AMPKβ2, AMPKγ1, and AMPKγ2 were examined, with β-actin used as the loading control. (C) Densitometric quantification of western blot bands showing fold changes in protein expression relative to control. The pAMPK/AMPK ratio indicated increased AMPK activation upon TMZ treatment. Notably, AMPKγ1 expression decreases, whereas AMPKγ2 expression increases. Data are presented as mean ± SD. Statistical significance was determined relative to control (*p<0.05, **p<0.01, ***p<0.001, ****p<0.0001; ns-not significant).

Figure 3.
Overexpression of AMPK gamma2 reduces TMZ sensitivity in GBM cell lines. (A)Representing phase-contrast images of U87MG cells treated with temozolomide (TMZ) following overexpression of AMPK subunits. Images illustrate morphological changes and cell density differences under control and TMZ–treated conditions. (B) IC50 analysis of TMZ in U87MG cells following overexpression of individual AMPK subunits. The bar graph represents the calculated IC50 values (μM) showing altered TMZ sensitivity upon modulation of AMPK subunits. (C) Dose- dependent curves showing the effect of increasing TMZ concentrations on the cell viability in U87MG cells expressing different AMPK subunits. Overexpression of AMPKγ2 results in increased TMZ resistance compared with other subunits. Data are presented as mean ± SD. Statistical significance was determined relative to control (*p<0.05, **p<0.01; ns, not significant).

Figure 4.
TMZ treatment in GBM cells exhibits a distinct AMPK γ- subunit profile. (A) Semi-quantitative RT-PCR analysis of AMPKγ1 and AMPKγ2 expression in U87MG cells treated with increasing concentrations of TMZ (0,100,200, and 400 μM). Representative gel images and densitometric quantification, normalized to 18s rRNA, are shown. (B) RT-PCR analysis of γ subunit expression in U87MG cells under control, TMZ treatment, and TMZ recovery conditions (drug removal). Quantification demonstrates reversible modulation of γ-subunit expression following TMZ exposure. (C) Ratio of AMPKγ2/γ1 expression calculated from densitometric analysis, highlighting a TMZ-induced shift in the γ-subunit profile. (D) Western blot analysis of gamma subunit protein level under control, TMZ, and recovery conditions in U87MG cells. Β-actin was used as the control. Bar graph shows densitometric quantification of protein normalized to β-actin. Data are presented as mean ± SD. Statistical significance was determined relative to control (*p<0.05, **p<0.01, ***p<0.001, ****p<0.0001.

Figure 5.
Silencing AMPKγ2 sensitizes GBM cells, while overexpression induces resistance to TMZ. (A) RT-PCR validation of AMPKγ2 knockdown (shAMPKγ2) and AMPKγ2 overexpression in U87MG cells. Expression levels were normalized to 18s rRNA. (B) Quantification of AMPKγ2 expression under control, TMZ treatment, knockdown, overexpression, knockdown and overexpression with TMZ treatment conditions, demonstrating efficient modulation of γ2 expression in U87MG cells. (C) A crystal violet image of U87MG cells is shown in three groups: control, shAMPKγ2, and AMPKγ2 treated with different concentrations of TMZ. Quantification of calculated IC50 values indicates AMPKγ2 knockdown sensitizes GBM cells to TMZ, whereas AMPKγ2 overexpression promotes resistance.

Figure 6.
AMPKγ2 knockdown diminishes while overexpression enhances AMPK activation under TMZ treatment. (A) The western blot analysis showing the expression of pAMPK, total AMPKα, AMPKγ2, LC3A/B, and β-actin in U87MG cells under six experimental conditions: control, TMZ treatment, AMPKγ2 knockdown (shAMPKγ2), and AMPKγ2 overexpression (AMPKγ2), alone or in combination with TMZ. The treatment matrix indicating presence (+) or absence (-) of AMPKγ2, shAMPKγ2, and TMZ is shown above the blots. β-actin serves as a loading control. (B) Densitometric quantification of protein levels normalized to β-actin. pAMPK/AMPK ratio indicating AMPK activation status. LC3II/β-actin ratio as a marker of autophagy. Statistical significance was determined using ANOVA. (C) AMPK kinase activity assay showing percentage kinase activity under control and TMZ-treated conditions in shAMPKγ2 and AMPKγ2-overexperssing cells.

Figure 7.
Co-Immunoprecipitation confirms structural remodeling of AMPK heterotrimer. (A) Immunoblot of co-IP performed in U87MG cells under control and TMZ-treated conditions. AMPKα was immunoprecipitated, and the association of regulatory subunits AMPKγ1 and AMPKγ2 within the complex was analyzed by immunoblotting. Input lysates are shown to confirm equal protein expression across conditions. (B) The γ2/γ1 ratio represents the relative enrichment of AMPKγ2 over AMPKγ1 within the AMPKα immunoprecipitated complex, serving as an indicator of subunit preference. Upon TMZ treatment, the ratio increases significantly, indicating a shift in binding occupancy within the AMPK heterotrimer. (C) Molecular docking analysis of TMZ with AMPKγ isoforms. Predicted binding poses of TMZ within the AMPKγ2 structure reveal a stable interaction within a hydrophobic pocket involving residues ALA204, ILE224, VAL226, THR227, LEU228, ALA229, PRO311, and SER315, along with a carbon-hydrogen bond with SER225. Comparative docking shows stronger binding affinity of TMZ to AMPKγ2 (ΔG = -7.0 kcal/mol) relative to AMPKγ1 (ΔG = -6.4 kcal/mol).


Table 1.
List of GBM and LGG tissue samples.
| S. No | Sample Code | Code number | Gender | Age | Diagnosis |
|---|---|---|---|---|---|
| 1 | AIIMS-D/GBM/F/28 | 28 | F | 58 | GBM |
| 2 | AIIMS-D/GBM/46 | 46 | F | 51 | GBM |
| 3 | AIIMS-D/GBM/M/78 | 78 | M | 52 | GBM |
| 4 | AIIMS-D/GBM/M/95 | 95 | M | 59 | GBM |
| 5 | AIIMS-D/GBM/56 | 56 | M | 58 | GBM |
| 6 | AIIMS-D/LGG/M/6 | 6 | M | 27 | LGG |
| 7 | AIIMS-D/LGG/M/7 | 7 | M | 26 | LGG |
| 8 | AIIMS-D/LGG/M/8 | 8 | M | 35 | LGG |
| 9 | AIIMS-D/LGG/M/11 | 11 | M | 20 | LGG |
| 10 | AIIMS-D/LGG/M/12 | 12 | M | 26 | LGG |
Table 2.
List of primer sequences.
| Gene ID | Forward Primer seq (5’-3’) | Reverse seq. (3’-5’) | Annealing Temp. (°C) |
|---|---|---|---|
| PRKAA1 | TTGAAACCTGAAAATGTCCTGCT | GGTGAGCCACAACTTGTTCTT | 58 |
| PRKAA2 | CTGCTGGCTTACACAGACCA | GGCGAGGTGAAACTGAAGAC | 59 |
| PRKAB1 | CCCTTGCTCAGGGTCCCTTT | CCCTCCGGGGCGTCTTAT | 60 |
| PRKAB2 | CCACTGTTATCCGCTGGTCT | GAACTTGTATTGGTGCTCTC | 60 |
| PRKAG1 | CAAGAGACCCCAGAATCCAA | CCTGCAGGGACGTATCAAAT | 58 |
| PRKAG2 | CGTACCACAACATTGCCTTC | CTGGGTCACCGTGATATCTAG | 58 |
| 18S | GAATCGAACCCTGATTCCCCGTC | CGGCGACGACCCATTCGAAC | 99 |
Disclaimer/Publisher’s Note: The statements, opinions and data contained in all publications are solely those of the individual author(s) and contributor(s) and not of MDPI and/or the editor(s). MDPI and/or the editor(s) disclaim responsibility for any injury to people or property resulting from any ideas, methods, instructions or products referred to in the content. |
© 2026 by the authors. Licensee MDPI, Basel, Switzerland. This article is an open access article distributed under the terms and conditions of the Creative Commons Attribution (CC BY) license (http://creativecommons.org/licenses/by/4.0/).
Copyright: This open access article is published under a Creative Commons CC BY 4.0 license, which permit the free download, distribution, and reuse, provided that the author and preprint are cited in any reuse.


