

Submitted:
17 May 2026
Posted:
19 May 2026
You are already at the latest version
Abstract
Electric vehicle (EV) transport by ship is expanding beyond industrial logistics centered on automobile production, trade, and pure car and truck carriers (PCTCs) into daily transportation for island tourism, commuting, and essential mobility. According to Korea Maritime Transportation Safety Authority (KOMSA) vessel status data as of March 2026, 104 of 146 domestic passenger ships were car-ferry passenger ships, accounting for 71.2% of the fleet and operating on 75 of 99 designated routes nationwide. Korea Shipping Association (KSA) operational records show that the EV transport rate on these routes increased from 0.76% in 2024 to 1.21% in 2025, with some routes exceeding 2.0–4.7%. Unlike enclosed multi-deck PCTC vehicle spaces, Korean coastal car-ferry passenger ships generally have single-tier open vehicle decks and bow ramp gates. Crosswinds on open decks may reduce smoke detector activation probability by 60–75%. Although Article 97 of the Standard for Ship Fire-Fighting Appliance newly requires dedicated EV fire-fighting equipment for car-ferry ships, it remains primarily equipment-prescriptive and does not yet provide open-deck-specific performance requirements for wind-resistant detection, fixed EV-zone cooling, EV-designated stowage arrangements, or passenger-operator safety management obligations. This study applies the five-step International Maritime Organization (IMO) Formal Safety Assessment (FSA) procedure to support improvements to EV fire-fighting equipment standards for coastal car-ferry passenger ships. Hazard Identification (HAZID) was conducted with a 15-member advisory panel, and probability elicitation was performed through a Delphi survey with 10 core experts, showing strong consensus (Kendall’s W = 0.74, p < 0.01). Fault Tree Analysis (FTA) and Event Tree Analysis (ETA) probabilities were derived from the Delphi results and international literature. H-07, representing wind-induced smoke dilution, was identified as the only first-order minimal cut set. Monte Carlo-based FTA–ETA analysis (n = 10,000) estimated annual fire frequencies of 5.9 × 10⁻², 1.8 × 10⁻¹, and 2.9 × 10⁻¹ yr⁻¹ at EV loading ratios of 10%, 30%, and 50%, respectively, with 2.47 expected fatalities per fire. Risk entered the IMO ALARP band above a 30% EV loading ratio and exceeded the maximum tolerable crew risk above 50%. The combined application of Risk Control Option (RCO) 2, 3, and 4 reduced annual expected fatalities by 85.6%. Based on these results, six RCOs and institutional recommendations are proposed, including strengthened safety management obligations for passenger ship operators.
Keywords:
formal safety assessment
; electric vehicle fire
; lithium-ion battery
; coastal car ferry
; open vehicle deck
; ALARP
; fault tree analysis
; regulatory reform
; Delphi expert panel
; cost-benefit analysis
1. Introduction
Global EV stock exceeded 40 million in 2023 and is projected to surpass 250 million by 2030 [1]. In the Republic of Korea, cumulative EV registrations exceeded 1.5 million in early 2026 under the 5th Basic Plan for Eco-Friendly Vehicles [2]. Car-ferry passenger ships are a key means of transportation for residents of island areas. According to vessel status data managed by the Korea Maritime Transportation Safety Authority (KOMSA) as of March 2026, 104 of the 146 domestic passenger ships were car-ferry passenger ships, accounting for 71.2% of the fleet, and they operated on 75 of the 99 designated routes nationwide [3]. According to nationwide domestic passenger ship vehicle transport records compiled by the Korea Shipping Association (KSA), the EV transport rate on these 75 car-ferry passenger ship routes increased from 0.76% in 2024, with 18,424 EVs out of 2,417,310 total vehicles, to 1.21% in 2025, with 14,596 EVs out of 1,209,159 total vehicles [4,5]. Several routes exceeded 2%, including Singi–Yeocheon (2.60%), Incheon–Deokjeok (2.59%), and Gaochi–Saryang (2.43%), while some routes, such as Gunsan–Gaeya (4.70%), exceeded 4%.
EV fire prevention has historically been researched and designed around the supply-chain—manufacturing quality control, cargo logistics protocols, and pre-delivery inspection—but is now expanding into user-operation contexts: island tourism and daily commuting via coastal car ferries [6,7,8,9,10]. This paradigm shift has three regulatory implications: (i) pre-boarding EV inspections must be redesigned as passenger safety procedures, (ii) ferry operators must bear direct responsibility for passenger–EV interactions on board, and (iii) safety management obligations must be strengthened.
The Formal Safety Assessment (FSA) of the International Maritime Organization (IMO; MSC-MEPC.2/Circ.12/Rev.2 [11]) is an international standard methodology for developing maritime regulatory improvements. It converts hazard identification and quantitative risk estimation into cost-adjusted recommendations and produces outputs that can be directly submitted as information documents to the Maritime Safety Committee (MSC) in the IMO rule-making process. However, in FSA studies based on expert judgment without accident data, methodological integrity requires that the resulting numerical values be clearly identified as expert-based estimates. In accordance with this principle, this study applies the FSA methodology to achieve two objectives: (i) to provide baseline evidence for revising Article 97 of the Standard for Ship Fire-Fighting Appliance [12]; and (ii) to generate international reference material for improving fire-fighting equipment standards in countries with coastal car-ferry passenger ships of similar structural characteristics, such as Japan, Greece, Norway, Indonesia, and the Philippines.
Previous FSA studies have focused on Ro-Ro ships [13], fishing vessels [14], general cargo [15], LNG carriers [16] and passenger ships [17,18]. Jiang et al. [19] applied an FTA–fuzzy Bayesian network approach to enclosed Ro-Pax routes; however, their study produced only relative risk indices and therefore did not satisfy the regulatory submission format involving As Low As Reasonably Practicable (ALARP) boundaries, F–N curves, and Gross Cost of Averting a Fatality (GCAF)/Net Cost of Averting a Fatality (NCAF). Moreover, the enclosed deck environment differs fundamentally from that of open-deck car-ferry passenger ships, as discussed in Section 5.4. This study systematically applies the five steps of IMO FSA to EV fire risks on domestic coastal car-ferry passenger ships.
2. Background
2.1. LIB Fire Characteristics: The Criticality of Early Detection
EV fires have five characteristics that distinguish them from fires involving conventional internal combustion engine (ICE) vehicles, and these characteristics are directly relevant to risk assessment for open-deck car-ferry passenger ships. First, lithium-ion battery (LIB) thermal runaway begins through internal electrochemical decomposition without visible smoke or flame. By the time visible smoke appears, the cell temperature may already exceed 400 °C and propagation to adjacent cells may be underway [20]. Because of this symptom-free latent phase, early detection within 1–3 min after the initial gas release becomes the critical intervention point, which explains why early smoke detection is essential in EV fire response. Second, once thermal runaway is established, gas release and smoke generation increase rapidly within seconds, and the 1–3 min interval from the first detectable smoke to full cell involvement is the only practicable response window [21]. Third, full-scale fire tests of BEVs have shown peak HRRs in the range of 4–8 MW, comparable to those of ICE vehicle fires of similar size; however, BEV fires present additional hazards including re-ignition risk for up to 24 h after initial suppression and elevated emissions of toxic gases, particularly hydrogen fluoride (HF) [21],22,23]. Fourth, hydrogen fluoride (HF) concentrations of up to 5,000 ppm, equivalent to 167 times the immediately dangerous to life and health (IDLH) concentration, can be released together with CO and HCN [24]. Since passenger areas are located only 3–6 m from deck openings, IDLH conditions may be reached within 1–2 min under crosswind conditions. Fifth, CO₂ and aqueous film-forming foam (AFFF) cannot suppress internal oxidation within battery cells, and reignition has been reported up to 24 h after initial extinguishment [25,26]. Continuous water cooling is the only verified method for controlling such fires.
The key implication for open-deck car-ferry passenger ships has been experimentally verified by the European Maritime Safety Agency (EMSA) FIRESAFE II project [27]: on open Ro-Ro (Roll-on/Roll-off) decks, wind speeds of ≥5 m/s reduce the activation probability of photoelectric smoke detectors by 60–75% compared with enclosed spaces. Because the narrow detection window of LIB thermal runaway is further compressed by the open-deck structure, only an integrated detection system combining infrared cameras (IR cameras), linear heat detectors, and HF gas sensors can secure a practicable response window. This conclusion justifies the identification of H-07 in Section 4.1 and the prioritization of Risk Control Option (RCO)-2 in Section 4.4.
2.2. Regulatory Context
Article 97 of the Republic of Korea’s Standard for Ship Fire-Fighting Appliance, concerning fire-fighting equipment for ships carrying electric vehicles, prescribes fire-fighting equipment requirements for “ships equipped with decks on which vehicles can be loaded and transported in the same condition as they are used for land transportation, etc., including pure car and truck carriers (PCTCs)” [12]. Although Article 97 of the Standard for Ship Fire-Fighting Appliance newly requires dedicated EV fire-fighting equipment for car-ferry ships, it remains primarily equipment-prescriptive and does not yet provide open-deck-specific performance requirements for wind-resistant detection, fixed EV-zone cooling, EV-designated stowage arrangements, or passenger-operator safety management obligations. Meanwhile, the IMO Sub-Committee on Ship Systems and Equipment (SSE) 10 in 2024 is aiming to amend the SOLAS Convention and the Fire Safety Systems (FSS) Code by 2027, mainly focusing on enclosed decks of PCTCs [28]. The Maritime & Coastguard Agency (MCA) Marine Guidance Note (MGN) 653 Amendment 1 of the United Kingdom [29] and the European Maritime Safety Agency (EMSA) 2025 guidelines on alternative-fuelled vehicles (AFVs) on Ro-Ro ships [13] provide best-practice guidance for EV transport on Ro-Ro passenger ships. However, they do not sufficiently reflect the unique operating conditions of coastal open-deck car-ferry passenger ships, including short route durations, open vehicle decks, mixed passenger–vehicle operations, and the statutory 25-year age limit. In addition, no ship-type-specific fire-fighting equipment standards for EV fires have been identified in countries operating similar vessels, such as Japan, Greece, Norway, Indonesia, and the Philippines.
The findings of this study can therefore serve as baseline evidence for revising Article 97 of the Republic of Korea’s Standard for Ship Fire-Fighting Appliance [12] and as international reference material for improving regulatory frameworks in countries operating open-deck coastal car-ferry passenger ships.
3. Methodology
3.1. Data Sources
Table 1 summarises principal data sources. EV transport statistics are unpublished data from the Korea Shipping Association (KSA), collected on an inbound one-way basis. Probability values for FTA/ETA basic events are expert-elicited (Delphi panel) and literature-based, not empirically observed.
3.2. Fleet Composition and EV Transport Statistics
3.2.1. Fleet Composition
According to an analysis of the status of domestic passenger ships managed by KOMSA as of 8 March 2026 [3], open-deck car-ferry passenger ships accounted for 71.2% of the domestic passenger ship fleet in the Republic of Korea, comprising 104 of 146 vessels, and operated on 75 of the 99 designated routes, equivalent to 77.8% of all routes (Table 2). These vessels ranged from 69 to 997 GT in gross tonnage and had vehicle loading capacities of 2 to 86 vehicles.
3.2.2. EV Transport Statistics
3.2.3. Route Cluster Analysis
K-means cluster analysis was applied to 75 route observations using standardized route distance, estimated operation time, vehicle loading capacity, passenger capacity, and gross tonnage. The analysis identified three operationally interpretable clusters: short-distance medium-capacity routes (Cluster 1, n = 34), short-distance high-capacity commuter routes (Cluster 2, n = 25), and long-distance island routes (Cluster 3, n = 16). The silhouette coefficient was 0.425, indicating moderate but acceptable cluster separation.
Figure 1.
Route-cluster distribution of Korean open-deck coastal car ferries.
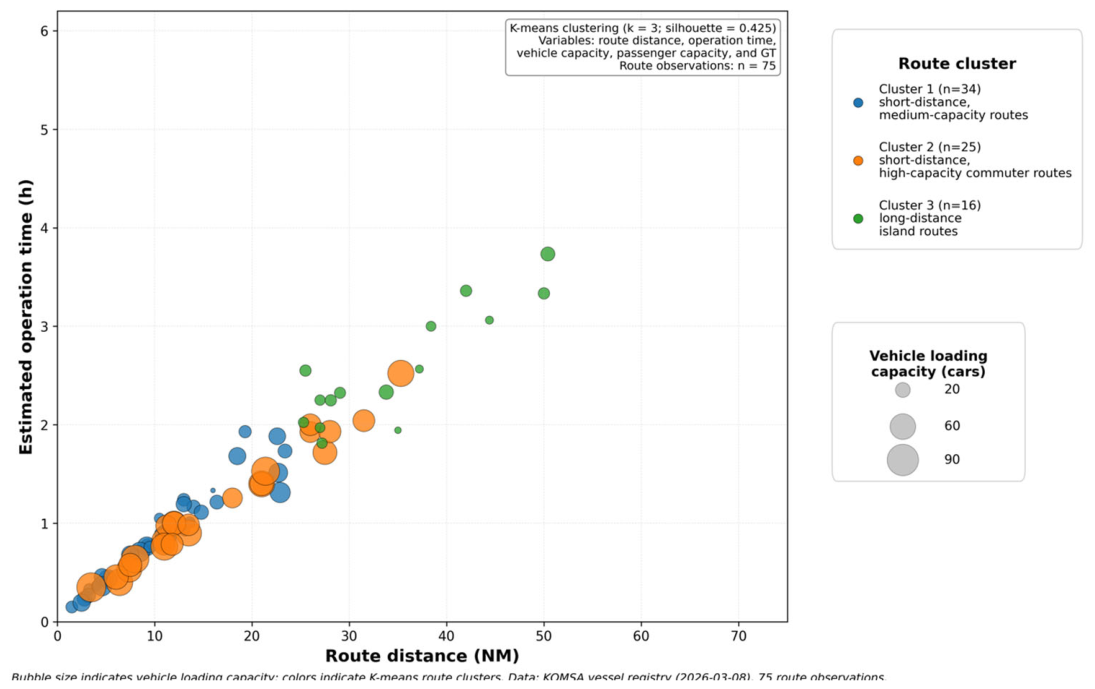

Table 5.
K-means route cluster analysis of Korean open-deck coastal car ferry routes (k = 3; silhouette coefficient = 0.425; 75 route observations; KOMSA passenger ship registry, 2026-03-08).
Table 5.
K-means route cluster analysis of Korean open-deck coastal car ferry routes (k = 3; silhouette coefficient = 0.425; 75 route observations; KOMSA passenger ship registry, 2026-03-08).
|
Cluster |
Routes (n) | Mean distance (NM) | Mean operation time (h) | Mean speed (kts) | Mean vehicle capacity | Mean GT | Representative routes |
| Cluster 1: short-distance, medium-capacity routes | 34 | 11.09 | 0.90 | 12.3 | 19.5 | 187.1 | Haui–Docho; Songgong–Byeongpung; Wando–Modo |
| Cluster 2: short-distance, high-capacity commuter routes | 25 | 16.06 | 1.15 | 14.0 | 53.2 | 535.4 | Daecheon–Janggo; Daebu–Ijak; Yulmok–Jindo |
| Cluster 3: long-distance island routes | 16 | 36.96 | 2.78 | 13.3 | 10.8 | 183.3 | Tongyeong–Samcheonpo; Ungok–Sindo; Gyema–Anma |
Note:K-means clustering was performed for 75 route observations using standardized route distance, estimated operation time, vehicle capacity, passenger capacity, and gross tonnage. The silhouette coefficient was 0.425, indicating moderate but acceptable cluster separation.
The regulatory implications of the route clusters are as follows. Cluster 1 comprises 34 routes with a mean route distance of 11.09 NM, mean estimated operation time of 0.90 h (approximately 54 min), and mean vehicle loading capacity of 19.5 vehicles. At a 30% EV loading fraction, this corresponds to approximately six EVs per voyage on average. Therefore, Cluster 1 is characterised less by large-scale EV accumulation than by repeated short-haul operation, making early onboard detection, passenger control, and pre-departure inspection by voyage supervisors the primary control measures. Cluster 2 comprises 25 routes and has the highest mean vehicle loading capacity among the three clusters, at 53.2 vehicles. At a 30% EV loading fraction, approximately 16 EVs may be carried per voyage on average, with a maximum of approximately 23 EVs. Accordingly, Cluster 2 should be prioritised for hardware and operational RCOs, including designated EV stowage zones, multi-sensor detection, and strengthened ferry-operator safety management obligations. Cluster 3 comprises 16 routes with the longest mean route distance of 36.96 NM and mean estimated operation time of 2.78 h (approximately 167 min), but its mean vehicle loading capacity is relatively small at 10.8 vehicles. Therefore, Cluster 3 requires emphasis on re-ignition monitoring during longer voyages, autonomous onboard response capability, and coordinated port–fire department emergency planning rather than large-volume EV stowage control.
3.3. Structural Characteristics
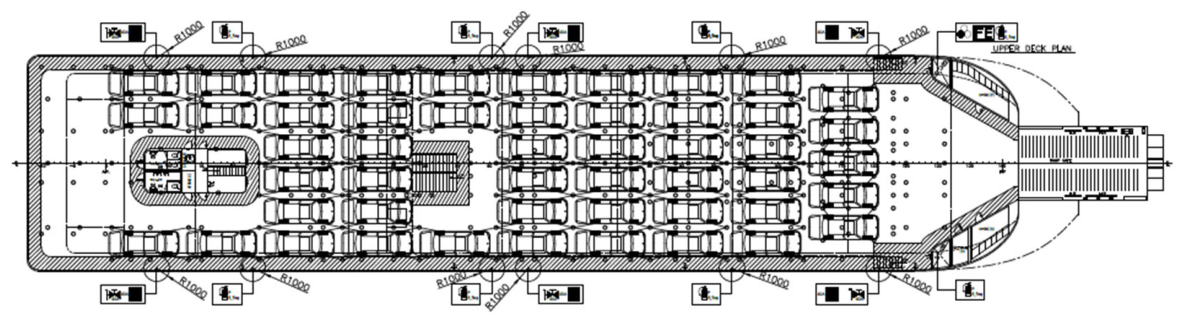
An analysis of the General Arrangement drawings (GAs) and Vehicle Loading Plans (VLPs) of 15 representative vessels, ranging from 217 to 811 GT and 49.9 to 81.9 m in length overall, identified six structural characteristics common to all vessels (Table 6). These characteristics provide the physical basis for identifying open-deck-specific hazards and assigning probabilities in the FTA.
Figure 2.
Example of a coastal car ferry GA. GT 713t/LBP 70m class, Capacity: passenger 485 persons.
Figure 2.
Example of a coastal car ferry GA. GT 713t/LBP 70m class, Capacity: passenger 485 persons.
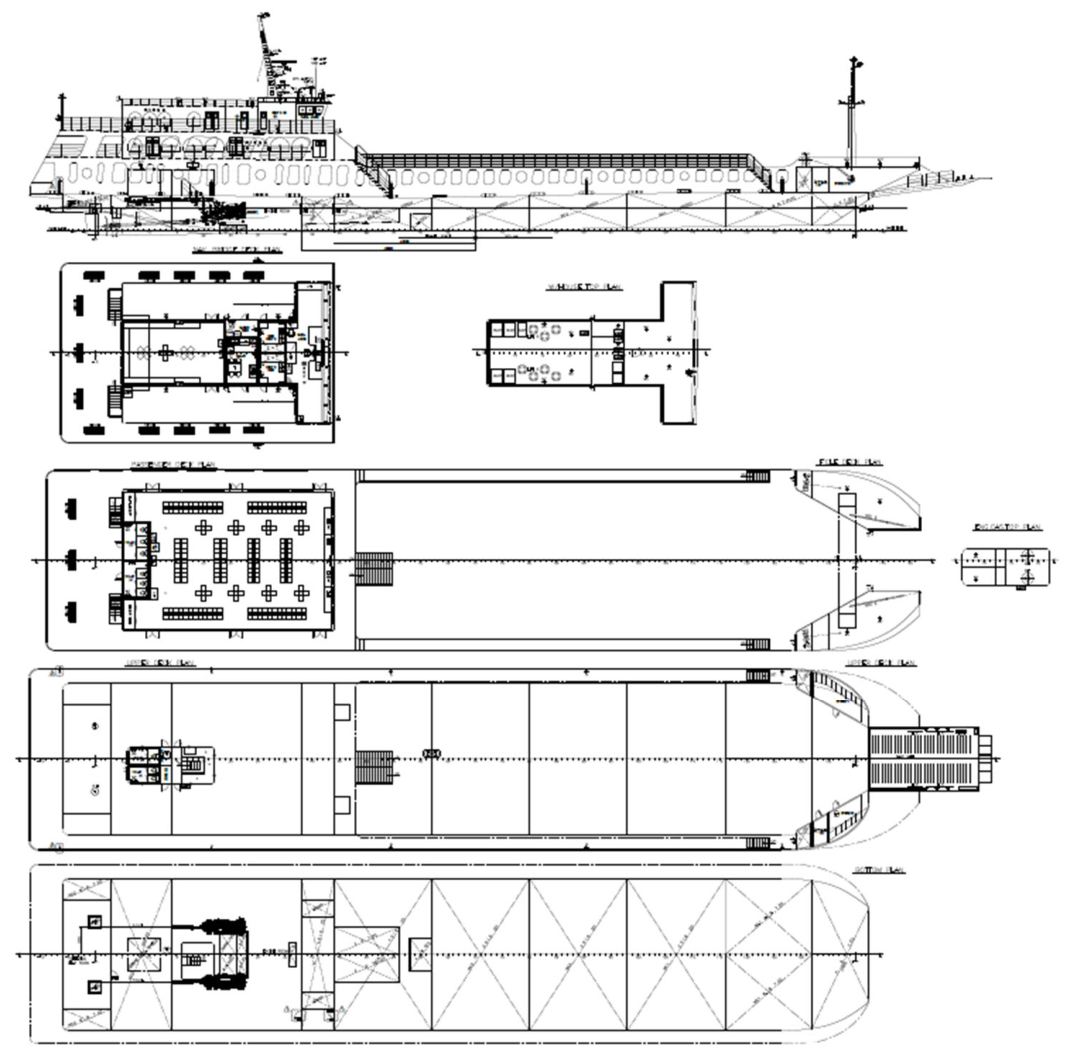
Figure 3.
Example of coastal car ferry Vehicle Loading Layout, Capacity: Premium passenger car 50 units, Duration: 30 minutes.
Figure 3.
Example of coastal car ferry Vehicle Loading Layout, Capacity: Premium passenger car 50 units, Duration: 30 minutes.
3.4. FSA Methodology and Expert Panel
3.4.1. FSA Application
The five-step IMO FSA procedure was applied as shown in Table 7. The outputs of each step were structured so that they could be directly used as technical evidence for regulatory submissions to the Minister of Oceans and Fisheries (MOF), Korean Register (KR), and IMO SSE 11. All quantitative FTA–ETA values are explicitly indicated in each result item as expert panel-based scenario probabilities.
3.4.2. Expert Panel
Expert involvement was divided into a broad HAZID advisory panel of 15 members and a core Delphi panel of 10 members (Table 8). The broad advisory panel was responsible for ensuring diversity in hazard identification, whereas the core panel focused on achieving consensus in probability elicitation.
3.4.3. Accident Database
Domestic marine accident cases and international literature, including EMSA FIRESAFE II [27] and RISE reports [23], were reviewed to analyze the structural fire characteristics of vehicle decks on car-ferry passenger ships. The probabilities of EV-specific FTA basic events were derived from the expert Delphi panel (W = 0.74) and international literature, including EMSA FIRESAFE II [27] and RISE reports [23]. The invariance of the ALARP classification under the 5th–95th percentile confidence intervals of basic event probabilities and simultaneous ±50% variation conditions was confirmed through sensitivity analysis, and the detailed results are provided in Table 10.
4. Results
4.1. Step 1—HAZID: 23 EV Fire Hazards
Hazard Identification (HAZID) conducted by the 15-member broad advisory panel identified 23 hazards across four operational phases: loading, navigation, fire suppression, and evacuation (Table 9). Among them, 12 hazards are amplified by the open-deck structure (*). H-07, representing smoke detection failure due to wind-induced smoke dilution, was identified as the only first-order minimal cut set in the fault tree (Section 4.2.1). This demonstrates that the open-deck structure can structurally undermine the critical early detection window for LIB thermal runaway identified in Section 2.1.
Table 9.
HAZID results: 23 EV fire hazards on car-ferry passenger ships identified by the 15-member broad advisory panel. (*): amplified by the open-deck structure. MCS: minimal cut set. SOC: state of charge. IR: infrared camera for open-deck monitoring.
Table 9.
HAZID results: 23 EV fire hazards on car-ferry passenger ships identified by the 15-member broad advisory panel. (*): amplified by the open-deck structure. MCS: minimal cut set. SOC: state of charge. IR: infrared camera for open-deck monitoring.
| ID | Phase | Hazard | Open-Deck Amplification / Regulatory Note |
| H-01 | Loading | Undetected damaged LIB EV loaded | Voyage supervisor inspection time limited by ramp-gate bottleneck |
| H-02 * | Loading | Mechanical shock to LIB during ramp passage | Ramp geometry increases battery pack impact risk; no mandatory EV-only lane |
| H-03 | Loading | Undisclosed high-SOC (>80%) EV loaded | No SOC (State of Charge) declaration obligation; remote verification not possible |
| H-04 * | Loading | Insufficient EV–ICE vehicle separation | Single-layer lane layout limits zoning flexibility |
| H-05 | Loading | No pre-boarding IR thermal screening | No IR equipment issued to voyage supervisors |
| H-06 | Voyage | LIB internal short circuit (manufacturing defect) | Equal probability in open/enclosed environments |
| H-07 * [1st MCS] | Voyage | Detection failure—smoke dispersed by open-deck wind [Sole 1st-order MCS] | EMSA: P(activation) reduced 60–75% at wind ≥5 m/s; single barrier collapse without co-failure |
| H-08 * | Voyage | No fixed thermal imaging surveillance | Article 97 (MOF Notification) does not require IR cameras on open decks |
| H-09 | Voyage | Crew unfamiliar with LIB suppression procedures | No domestic EV-specific crew competency standard |
| H-10 * | Voyage | Wind-driven lateral fire spread to adjacent EVs | No transverse fire barriers; open deck provides sustained O₂ supply |
| H-11 * | Voyage | Toxic gas migration to passenger spaces | HF up to 5,000 ppm; IDLH may be reached in 1–2 min in crosswind |
| H-12 | Voyage | Insufficient cooling water supply | Fire mains sized for ICE fires; no dedicated EV cooling circuit |
| H-13 | Voyage | Degraded passive fire resistance due to corrosion | High-frequency short-haul operation with cumulative salt exposure |
| H-14 * | Suppression | CO₂/AFFF ineffective on open deck | CO₂ requires enclosed space; AFFF dispersed at wind ≥5 m/s |
| H-15 * | Suppression | Water mist effectiveness reduced in crosswind | Mist cloud cannot be sustained at wind >5–8 m/s |
| H-16 * | Suppression | No fixed automatic cooling system | Article 97 (MOF Notification) does not require fixed cooling on open decks |
| H-17 | Suppression | Re-ignition risk 12–24 h after initial suppression | No post-incident LIB monitoring protocol on short-haul routes |
| H-18 * | Evacuation | Passenger evacuation route passes through vehicle deck | Single stairway structure: conflict between suppression and evacuation |
| H-19 | Evacuation | Toxic gas infiltration into passenger spaces | Open deck shortens gas propagation path to upper decks |
| H-20 * | Evacuation | Limited evacuation time on selected very-short Cluster 1 routes | Shore fire dept cannot dock before IDLH exposure on short routes |
| H-21 | Evacuation | Insufficient crew for simultaneous suppression and evacuation | Minimum crew sized for normal operations; SMS obligations not explicit |
| H-22 * | Evacuation | Stability loss from cooling water accumulation | ~15–20 t may cause dangerous heel on smaller vessels |
| H-23 | Evacuation | Restricted vehicle deck visibility at night | Reduced patrol effectiveness on long-haul night routes (Clusters 2/3) |
4.2. Step 2—Risk Estimation
4.2.1. Fault Tree Analysis
The top event is defined as a “sustained and spreading EV fire on the vehicle deck of a car-ferry passenger ship.” The top event occurs only when three intermediate branches occur simultaneously through the upper AND gate. Branch B1, ignition, consists of LIB internal short circuit, λ = 8.5 × 10⁻⁵ EV⁻¹ voyage⁻¹; ramp impact, λ = 2.4 × 10⁻⁴ voyage⁻¹; and pre-existing damage, λ = 1.1 × 10⁻⁴ EV⁻¹ voyage⁻¹. Branch B2, detection failure, consists of H-07 unreliability, q = 0.72, with open-deck correction based on EMSA FIRESAFE II [27]; absence of thermal imaging, q = 0.91; and limited night-time visibility, q = 0.45, conditional. Branch B3, suppression failure, consists of lack of cooling capability, q = 0.89; ineffectiveness of CO₂/foam, q = 0.78; and insufficient crew familiarity, q = 0.31. The probability distributions of the basic events, including the 5th–95th percentile confidence intervals, are provided in Table 10.
Table 10.
Summary of FTA basic event probability values, based on the expert Delphi panel (W = 0.74), EMSA FIRESAFE II [27], and RISE Report [23]. q: unreliability, defined as the probability of failure on demand. λ: occurrence rate per voyage. Right-hand column: invariance of the ALARP classification under simultaneous ±50% variation of all basic events.
Table 10.
Summary of FTA basic event probability values, based on the expert Delphi panel (W = 0.74), EMSA FIRESAFE II [27], and RISE Report [23]. q: unreliability, defined as the probability of failure on demand. λ: occurrence rate per voyage. Right-hand column: invariance of the ALARP classification under simultaneous ±50% variation of all basic events.
| Basic Event | ID | Point Estimate | 5th pctile | 95th pctile | Primary Source | ALARP ±50% Invariant |
| LIB internal short circuit (per EV per voyage) | H-06 | λ = 8.5 × 10⁻⁵ | 5.2 × 10⁻⁵ | 1.4 × 10⁻⁴ | Literature [20,24] + Delphi | ✓ |
| Pre-damaged EV loaded (per EV per voyage) | H-01 | λ = 1.1 × 10⁻⁴ | 6.8 × 10⁻⁵ | 1.8 × 10⁻⁴ | Delphi (W=0.74) | ✓ |
| Ramp mechanical impact (per voyage) | H-02 | λ = 2.4 × 10⁻⁴ | 1.5 × 10⁻⁴ | 3.9 × 10⁻⁴ | Domestic incidents + Delphi | ✓ |
| Open-deck smoke dispersion [1st MCS] | H-07 | q = 0.72 | 0.58 | 0.83 | EMSA FIRESAFE II [27] | ✓ |
| No fixed thermal imaging | H-08 | q = 0.91 | 0.85 | 0.96 | Current status of domestic passenger ships [3] | ✓ |
| Night visibility limitation (conditional) | H-23 | q = 0.45 | 0.31 | 0.59 | Delphi | ✓ |
| No fixed cooling system | H-16 | q = 0.89 | 0.82 | 0.95 | Article 97 (MOF) status | ✓ |
| CO₂/AFFF ineffective (open deck) | H-14 | q = 0.78 | 0.65 | 0.88 | EMSA FIRESAFE II + Delphi | ✓ |
| Crew unfamiliar with LIB procedures | H-09 | q = 0.31 | 0.18 | 0.45 | Delphi | ✓ |
Note: ALARP classification (crew IR enters ALARP band at 30% EV loading) is invariant under ±50% simultaneous variation of all basic event probabilities.
Figure 4.
Fault tree analysis of an EV fire on the vehicle deck of a car-ferry passenger ship. Top event: sustained and spreading EV fire. Three branches: B1, ignition, AND B2, detection failure, AND B3, suppression failure. H-07 (q = 0.72): the only first-order minimal cut set (MCS), indicating the collapse of the detection barrier by a single event. Probability values: B1, λ = 8.5 × 10⁻⁵–2.4 × 10⁻⁴ voyage⁻¹; B2, q = 0.72–0.91; B3, q = 0.89–0.31. AND: logical conjunction gate; OR: logical disjunction gate; q: unreliability. Basis: expert Delphi survey (W = 0.74) and EMSA [27].
Figure 4.
Fault tree analysis of an EV fire on the vehicle deck of a car-ferry passenger ship. Top event: sustained and spreading EV fire. Three branches: B1, ignition, AND B2, detection failure, AND B3, suppression failure. H-07 (q = 0.72): the only first-order minimal cut set (MCS), indicating the collapse of the detection barrier by a single event. Probability values: B1, λ = 8.5 × 10⁻⁵–2.4 × 10⁻⁴ voyage⁻¹; B2, q = 0.72–0.91; B3, q = 0.89–0.31. AND: logical conjunction gate; OR: logical disjunction gate; q: unreliability. Basis: expert Delphi survey (W = 0.74) and EMSA [27].
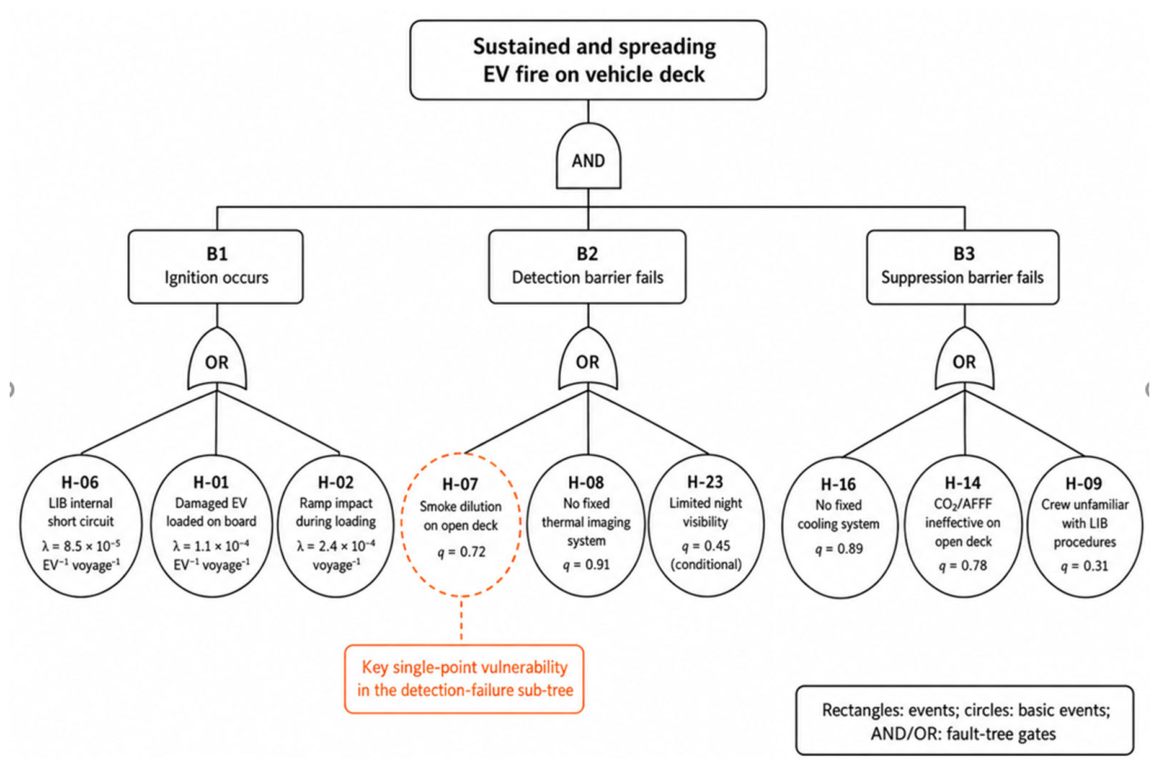
Table 11.
Annual fire frequency by EV loading ratio, based on a reference vessel with a vehicle loading capacity of 63 vehicles and approximately 1,500 voyages yr⁻¹.
Table 11.
Annual fire frequency by EV loading ratio, based on a reference vessel with a vehicle loading capacity of 63 vehicles and approximately 1,500 voyages yr⁻¹.
| EV shipment ratio | EV per voyage (Reference: 63 units) | Annual fire frequency f (yr⁻¹) | Cluster 1 Context (Average 19.5 units) | Cluster 2 Context (Average 53.2 units) | Cluster 3 Context (Average 10.8 units) |
| 10% | ~6 | 5.9 × 10⁻² | ~2 | ~5 | ~1 |
| 30% | ~19 | 1.8 × 10⁻¹ | ~6 | ~16 | ~3 |
| 50% | ~32 | 2.9 × 10⁻¹ | ~10 | ~27 | ~5 |
4.2.2. Event Tree Analysis
Four binary decision nodes follow the fault tree initiating event. N1: effective detection within 5 min, P(N1) = 0.30 on open deck (61% reduction from 0.78 in enclosed space; EMSA [27]). N2: effective cooling, P(N2|N1+) = 0.55, P(N2|N1−) = 0.28. N3: vehicle isolation, P = 0.58. N4: passenger evacuation complete before IDLH, P = 0.92 under a longer-voyage reference condition; shorter routes may have lower effective response margins.
Table 12.
ETA outcome grades, outcome probabilities, and expected fatalities. E[N]: expected fatalities per fire incident. Outcome probabilities sum to 1.00.
Table 12.
ETA outcome grades, outcome probabilities, and expected fatalities. E[N]: expected fatalities per fire incident. Outcome probabilities sum to 1.00.
| Grade | Description | Outcome probability | E[Fatalities] | Representative path |
| A | Fire suppressed; no fatalities | 0.22 | 0 | N1+ → N2+ |
| B | Localized fire; crew-controlled | 0.29 | ~0.8 | N1+ → N2− and/or N3− |
| C | Large multi-vehicle fire | 0.44 | ~3.5 | N1− → N2+ and/or N3± |
| D | Major incident—abandon ship | 0.05 | ~14.0 | N1− → N2− |
| Sum | E[N] = 0×0.22+0.8×0.29+3.5×0.44+14.0×0.05 | 1.00 | 2.47 | — |
4.2.3. Individual Risk and Societal Risk
Table 13.
Calculated individual risk values by EV loading ratio. IMO maximum tolerable crew individual risk criterion: 10⁻³ yr⁻¹ [11].
Table 13.
Calculated individual risk values by EV loading ratio. IMO maximum tolerable crew individual risk criterion: 10⁻³ yr⁻¹ [11].
| EV loading fraction | f (yr⁻¹) | AEF (yr⁻¹) | IR_crew (yr⁻¹) | IR_pax (yr⁻¹) |
| 10% (~6 vehicles) | 5.9 × 10⁻² | 0.146 | 2.90 × 10⁻⁴ | 3.87 × 10⁻⁷ |
| 30% (~19 vehicles) | 1.8 × 10⁻¹ | 0.445 | 8.87 × 10⁻⁴ | 1.18 × 10⁻⁶ |
| 50% (~32 vehicles) | 2.9 × 10⁻¹ | 0.716 | 1.43 × 10⁻³ † | 1.91 × 10⁻⁶ |
4.3. Step 3—ALARP Evaluation
Figure 5 presents F–N curves for the three EV loading ratio scenarios together with the IMO ALARP limit lines defined in MSC-MEPC.2/Circ.12/Rev.2 [11]. Because the ALARP determination is based on expert panel probability values, it should be interpreted not as evidence of actual exceedance of ship-specific risk levels, but as a tool for identifying priorities for institutional improvement (Table 14).
4.4. Step 4—RCO Evaluation
4.4.1. Capital Recovery Factor and VSL Benchmarks
Capital costs are annualized using the Capital Recovery Factor (CRF) in Equation (1), and the Gross Cost of Averting a Fatality (GCAF) is calculated using Equation (2). Since GCAF is a relative cost indicator derived from expert panel probability values, it is more meaningful for comparing priorities among Risk Control Options (RCOs) than for interpreting absolute values.
where i = 0.04 is the real discount rate and n is the remaining service life of the vessel in years. Two value of statistical life (VSL) benchmarks are applied: VSLKorea= KRW 4.43 billion, approximately USD 3.16 million [31], and VSLIMO = USD 3.00 million [11]. Table 15 presents the CRF values by remaining service life, based on the Enforcement Rules of the Marine Transportation Act and the Age-extension survey system [30].
4.4.2. Six Risk Control Options
Based on the HAZID results and structural analysis, six Risk Control Options (RCOs) tailored to the characteristics of car-ferry passenger ships were developed (Table 16). RCO-6, a joint port–firefighting response plan, can be implemented immediately without additional equipment investment and is recommended for priority application on routes with high EV transport ratios, as shown in Table 4.
4.5. Step 5—Regulatory Recommendations
Based on the FSA outputs, the following regulatory recommendations are proposed. For the Ministry of Oceans and Fisheries (MOF), revision of Article 97 of the Standard for Ship Fire-Fighting Appliance is recommended, specifically: (a) mandatory installation of EV-designated safety zones (EV-DSZs) on all car-ferry passenger ships permitted to carry EVs; (b) installation of open-deck integrated detection systems on EV-permitted vessels, with an operating probability of P(operation) ≥ 0.80 under wind speeds of ≤15 m/s; (c) installation of fixed EV-DSZ cooling systems on vessels with more than 10 years of remaining service life, with a capacity of ≥10 L min⁻¹ m⁻² for 10 min; (d) codification of pre-loading EV inspection as a statutory condition for carriage approval, with explicit authority assigned to passenger ship operation managers; and (e) strengthening of passenger ship operators’ safety management obligations. Specifically, passenger ship operators running car-ferry services should establish and implement internal EV handling procedures, crew EV training records, and passenger–EV interaction protocols as mandatory elements of their safety management system (SMS), subject to periodic operational audits by the MOF. The proposed implementation schedule is 2026 for RCO-4, RCO-5, and RCO-6, and 2027–2028 for RCO-1, RCO-2, and RCO-3.
For the Korean Register (KR), the issuance of a technical circular is recommended. This circular should include the P(operation) ≥ 0.80 performance criterion, design criteria for water-spray cooling, EV-DSZ arrangement criteria by cluster type, and SMS documentation requirements for passenger ship operators.
For IMO SSE 11, the ALARP threshold, indicating that crew individual risk enters the ALARP band when the EV loading ratio exceeds 30%, the EV-DSZ design framework, and the results related to strengthened passenger ship operators’ safety management obligations should be structured as quantitative evidence for the amendment of SOLAS Chapter II-2 and the FSS Code, following the work initiated at SSE 10.
5. Discussion
5.1. Open-Deck MCS and Probability Robustness
The FTA–ETA results based on expert panel-derived probability values can have regulatory implications for two reasons. First, H-07 functions as a single basic event in the B2 branch of the fault tree and, at the assigned unreliability value of q=0.72, can collapse the detection barrier without the simultaneous occurrence of other basic events. However, because this status depends on the probability value, the sensitivity analysis in Table 10 confirmed that the conclusion remains valid even under a ±50% variation range. Second, the ALARP classification was also confirmed to be invariant within the same sensitivity range, indicating that the conclusion regarding institutional improvement priorities has a considerable level of robustness against uncertainty in probability estimation
5.2. Connection between the Open-Deck Minimal Cut Set and the LIB Fire Characteristics Discussed in Section 2.1
The identification of H-07 as the only first-order MCS structurally validates the central proposition in Section 2.1: early smoke detection during LIB thermal runaway is the critical point of intervention. This dual challenge, in which the 1–3 min detection window is further compressed on open decks, reveals a regulatory gap, as detector certification under the ISO 7240 series is conducted in semi-enclosed environments and may therefore overestimate reliability on open decks. It is therefore urgent to establish EV detection performance standards specifically for open decks, including a minimum operating probability under actual wind-speed conditions. In addition, EV-DSZ Layout B is a novel design concept that enables direct hose access by land-based fire brigades during berthing, and this concept has not yet been reflected in any existing classification society guidelines.
5.3. EV Transport Growth Trend and Route-Level ALARP Threshold
The EV transport rate on car-ferry passenger ship routes reached 1.21% in 2025, with high concentrations on specific routes such as Gunsan–Gaeya (4.70%) and Singi–Yeocheon (2.60%). If the annual increase of +0.45 percentage points in the EV transport rate continues, high-concentration routes are expected to reach the ALARP threshold of 30% within 5–10 years. For top-ranking routes where the EV ratio has already reached 4.70%, such as Gunsan–Gaeya, the immediate implementation of RCO-4 and RCO-5 in 2026 represents an urgent response measure, while the RCO-6 joint response plan should be applied to these routes as the highest priority.
5.4. Institutional Basis for Passenger Ship Operators’ Safety Management Obligations
The paradigm shift from supply chain-centered transport to user-operated transport positions passenger ship operators as the final line of defense between EV-using passengers and shipboard safety. Strengthening the SMS obligations of passenger ship operators is an institutional response corresponding to this shift. The proposed mandatory elements—including internal EV handling procedures, records of crew training for EV-specific emergency response, EV boarding guidance for passengers, and reporting obligations for abnormal signs during navigation—would form a dual-authority framework when combined with the statutory pre-loading authority of passenger ship operation managers under RCO-4. This dual framework, consisting of pre-loading authority and onboard SMS obligations of passenger ship operators, represents a structurally improved safety management model compared with the current single-authority framework.
5.5. Comparison with Jiang et al. [19]
Table 17 presents a structural comparison with the most relevant previous study. The two studies are complementary: Jiang et al. [19] demonstrate that prevention of ignition triggers is the primary priority for PCTCs and enclosed Ro-Pax ships, whereas in the open-deck car-ferry passenger ship environment, detection failure becomes the dominant risk factor, making integrated detection (RCO-2) the highest-priority intervention.
5.6. Limitations
First, the FTA basic event probabilities were based on the expert Delphi panel (W = 0.74) and international literature; therefore, they were not validated against empirical accident frequency data. The robustness of the conclusions was confirmed through sensitivity analysis (Table 10). The ALARP classification remained unchanged even under simultaneous ±50% variation of all basic event probabilities (Table 10). Second, fire spread validation on open decks using Computational Fluid Dynamics (CFD) or Fire Dynamics Simulator (FDS) was not conducted and should be treated as a priority for future research. Third, the 2025 EV transport data, extracted on 5 January 2026, should be interpreted with caution because they were collected before the completion of the final annual audit. Fourth, although the cluster analysis result, with a silhouette value of 0.425, indicates acceptable separation, further validation could be strengthened using AIS-based actual voyage trajectory data.
6. Conclusions
This study systematically applied the five-step IMO Formal Safety Assessment (FSA) procedure to EV fire risk on domestic coastal car-ferry passenger ships and derived the following eight key conclusions.
(1) H-07, representing smoke dilution caused by wind on open decks, was identified as the only first-order minimal cut set. The critical detection window for LIB thermal runaway, namely 1–3 min, can be structurally neutralized by the open-deck configuration without the need for simultaneous failures. This conclusion is robust to uncertainty in probability estimates, and integrated detection (RCO-2) is identified as the single highest-priority intervention.
(2) Car-ferry passenger ships account for 104 of the 146 domestic passenger ships in the Republic of Korea, representing 71.2% of the fleet, and operate on 75 routes. The EV transport rate on car-ferry passenger ship routes increased from 0.76% in 2024 to 1.21% in 2025. Routes with high EV ratios, such as Gunsan–Gaeya (4.70%) and Singi–Yeocheon (2.60%), are priority candidates for early RCO implementation.
(3) K-means clustering analysis (k = 3, silhouette coefficient = 0.425) of 75 route observations identified three operational clusters: Cluster 1, short-distance medium-capacity routes (n = 34; mean operation time = 0.90 h); Cluster 2, short-distance high-capacity commuter routes (n = 25; mean operation time = 1.15 h); and Cluster 3, long-distance island routes (n = 16; mean operation time = 2.78 h). Cluster 2 should be prioritized for hardware-based RCOs because it has the highest mean vehicle capacity, whereas Cluster 3 requires emphasis on re-ignition monitoring and coordinated port–fire department response planning.
(4) Hazard Identification (HAZID), conducted by a 15-member broad advisory panel, identified 23 hazards, of which 12 were amplified by the open-deck structure. The level of expert consensus satisfied the statistical agreement criterion, with Kendall’s W = 0.74 and p < 0.01. The FTA–ETA probability values were derived from the expert panel and international literature, and sensitivity analysis confirmed that the ALARP classification remained unchanged under simultaneous ±50% variation.
(5) When the EV loading ratio exceeds 30%, the risk enters the IMO ALARP band; when it exceeds 50%, the maximum tolerable crew individual risk is exceeded. The ALARP classification remained invariant under simultaneous ±50% variation, as shown in Table 10.
(6) RCO-4, pre-loading inspection by passenger ship operation managers; RCO-5, crew training by passenger ship operators; and RCO-6, joint port–firefighting response planning, all showed GCAF values below VSLIMO for all remaining service life categories and can be implemented immediately. The combined application of RCO-2, RCO-3, and RCO-4 reduced the calculated annual expected fatalities (AEF) by 85.6%.
(7) The regulatory recommendations include revision of Article 97 of the MOF Standard for Ship Fire-Fighting Appliance, including strengthened safety management obligations for passenger ship operators; issuance of a KR technical circular; and submission of an MSC information document to IMO SSE 11. The findings can also serve as international reference material for improving fire-fighting equipment standards for coastal car-ferry passenger ships in other countries.
(8) Future research should include CFD/FDS-based validation of fire spread on open decks, re-estimation of the FTA model using accumulated EV accident data, validation of the clustering results using AIS-based voyage trajectory data, and cross-validation with countries operating similar vessels, such as Japan, Greece, and Norway.
Author Contributions
Author Contributions: Conceptualization, B.-H.S.; Methodology, B.-H.S.; Formal analysis, B.-H.S.; Investigation, B.-H.S.; Data curation, B.-H.S.; Writing—original draft preparation, B.-H.S.; Writing—review and editing, B.-H.S.; Visualization, B.-H.S. The author has read and agreed to the published version of the manuscript.
Funding
This research received no external funding.
Institutional Review Board Statement
Ethical review and approval were waived because this study involved anonymized expert elicitation for maritime safety risk assessment and did not collect personal, sensitive, or medical information.
Informed Consent Statement
Informed consent was obtained from all experts participating in the HAZID advisory panel and Delphi survey.
Data Availability Statement
Vessel status data managed by the Korea Maritime Transportation Safety Authority (KOMSA) may be provided upon a reasonable request to KOMSA; however, KSA EV transport status data is non-public and can only be viewed with the permission of the data provider. General Arrangement (GA) drawings and Vessel Layout Plans (VLPs) are held by KOMSA and the respective shipowners and are not disclosed due to confidentiality obligations. The anonymized composition of expert panels, Delphi analysis results, and cost-benefit calculation worksheets may be provided to editors or reviewers upon a reasonable request, provided that confidentiality obligations are observed.
Acknowledgments
The author gratefully acknowledges the 15-member HAZID advisory group and 10-member Delphi core panel for their expert contributions.
Conflicts of Interest
The author declares no conflict of interest.
References
- IEA. Global EV Outlook 2024; International Energy Agency: Paris, France, 2024. [Google Scholar]
- MOLIT. EV Registration Statistics Q1 2026; Ministry of Land, Infrastructure and Transport: Sejong, Republic of Korea, 2026. [Google Scholar]
- KOMSA. Domestic Coastal Passenger Vessel Registry (2026-03-08); Korea Maritime Transportation Safety Authority: Sejong, Republic of Korea, 2026. [Google Scholar]
- KSA. EV Transport Statistics for Domestic Coastal Passenger Vessels; (Unpublished); Korea Shipping Association: Seoul, Republic of Korea, 2024. [Google Scholar]
- KSA. EV Transport Statistics for Domestic Coastal Passenger Vessels, 2025; (Unpublished); Korea Shipping Association: Seoul, Republic of Korea, 2026. [Google Scholar]
- KR. Safe Maritime Transport of Electric Vehicles on PCTCs; Korea Register: Busan, Republic of Korea, 2024. [Google Scholar]
- NK. Safety Measures for Maritime Transportation of Electric Vehicles; Nippon Kaiji Kyokai(Class NK): Tokyo, Japan, 2023. [Google Scholar]
- ABS. Best Practices for the Transport of electric vehicles on board vessels; American Bureau of Shipping: Spring, United States, 2022. [Google Scholar]
- IUMI. Best practice & recommendations for the safe carriage of electric vehicles (EVs); International Union of Marine Insurance: Hamburg, Germany, 2024. [Google Scholar]
- SSM. Risk Management for the Carriage of Electric Vehicles (EVs); Steamship Mutual: London, UK, 2026. [Google Scholar]
- IMO. Revised Guidelines for Formal Safety Assessment (FSA) for Use in the IMO Rule-Making Process; MSC-MEPC.2/Circ.12/Rev.2; IMO: London, UK, 2013. [Google Scholar]
- Republic of Korea. Ministry of Oceans and Fisheries. Standard for Ship Fire-Fighting Appliances. Ministry of Oceans and Fisheries Notification No. 2025-228, 2025. [Google Scholar]
- EMSA. Technical Guidance on Alternative Fuelled Vehicles (AFVs) in Ro-Ro Spaces, Version 1.2; European Maritime Safety Agency: Lisbon, Portugal, 2025. [Google Scholar]
- Kim, S.-H.; Lee, S.-H.; Ryu, K.-J.; Lee, Y.-W. Applying Formal Safety Assessment (FSA) to Fishing Vessels: An Analysis of Occupational Injuries on Korean Trap Boats. Fishes 2025, 10, 30. [Google Scholar] [CrossRef]
- Lee, J.-G.; Na, S.; Kim, H.-T.; Kim, K.-M. A Study on High-level FSA for Korean-flagged General Cargo Ships. J. Korean Nav. Port. Res. 2010, 34, 97–102. [Google Scholar]
- IMO. FSA—Liquefied Natural Gas (LNG) Carriers (MSC 83/21/1); IMO: London, UK, 2007. [Google Scholar]
- Čapalija, E.; Vidmar, P.; Perkovič, M. LNG-Fuelled Cruise Ships in Comparative Risk Assessment. J. Mar. Sci. Eng. 2025, 13, 1896. [Google Scholar] [CrossRef]
- Wang, H.; Boulougouris, E.; Theotokatos, G.; Priftis, A.; Shi, G.; Dahle, M.; Tolo, E. Risk Assessment of a Battery-Powered High-Speed Ferry Using Formal Safety Assessment. Safety 2020, 6, 39. [Google Scholar] [CrossRef]
- Jiang, X.; Ren, W.; Xu, H.; Zheng, S.; Wu, S. Mechanism-Based Fire Hazard Chain Risk Assessment for Roll-On/Roll-Off Passenger Vessels Transporting Electric Vehicles: A Fault Tree–Fuzzy Bayesian Network Approach. J. Mar. Sci. Eng. 2025, 13, 227. [Google Scholar] [CrossRef]
- Tran, M.-K.; Mevawalla, A.; Aziz, A.; Panchal, S.; Xie, Y.; Fowler, M. A Review of Lithium-Ion Battery Thermal Runaway Modeling and Diagnosis Approaches. Processes 2022, 10, 1192. [Google Scholar] [CrossRef]
- Sun, P.; Bisschop, R.; Niu, H.; Huang, X. A Review of Battery Fires in electric vehicles. Fire Technol. 2020, 56, 1361–1410. [Google Scholar] [CrossRef]
- Kwon, B.; Schraiber, A.; Jeevarajan, Judith A. Evaluating Fire and Smoke Risks with Lithium-Ion Cells, Modules, and Batteries. ACS Energy Lett. 2024, 9, 11. [Google Scholar]
- Willstrand, O.; Bisschop, R.; Blomqvist, P.; Temple, A. Toxic Gases from Fire in Electric Vehicles. RISE Rep. 2020 2020, 90 240. [Google Scholar]
- Hynynen, J.; Willstrand, O.; Blomqvist, P.; Andersson, P. Analysis of combustion gases from large-scale electric vehicle fire tests. Fire Saf. J. 2023, 139, 103829. [Google Scholar] [CrossRef]
- Lecocq, A.; Bertana, M.; Truchot, B.; Marlair, G. Comparison of the fire consequences of an electric vehicle and an internal combustion engine vehicle. HAL-Ineris 2012. EN-2012-333. 2012.
- Wang, Q.; Mao, B.; Stoliarov, Stanislav I.; Sun, J. A review of lithium-ion battery failure mechanisms and fire prevention strategies. Prog. Energy Combust. Sci. 2019, 73, 95–131. [Google Scholar] [CrossRef]
- EMSA. FIRESAFE II—Ro-Ro and Ro-Pax; EMSA: Lisbon, Portugal, 2018. [Google Scholar]
- IMO. SSE 10/19. IMO: London, UK, 2024.
- UK Maritime and Coastguard Agency (MCA). MGN 653 (M) Amendment 1: Fire Safety—Carriage of Battery Electric Vehicles on Ro-Ro Passenger Ships; MCA: Southampton, UK, 2023. [Google Scholar]
- Republic of Korea. Ministry of Oceans and Fisheries. Enforcement Rule of the Marine Transport Act, Ordinance of the Ministry of Oceans and Fisheries No. 652. 2024. [Google Scholar]
- Kim, Y.-J. Estimating the Value of a Statistical Life Lost Due to COVID-19 and Social Costs. J. Soc. Converg. Stud. 2023, 7(1), 115–130. [Google Scholar]
Figure 5.
F–N (frequency–number of fatalities) societal risk curves for EV fires on car-ferry passenger ships. Reference vessel: 63-vehicle loading capacity, approximately 1,500 voyages yr⁻¹, and 505 persons exposed to risk. Three curves represent EV loading ratios of 10%, 30%, and 50%. When the EV loading ratio exceeds 30%, the crew individual risk (IR) enters the ALARP band. ALARP limit lines: IMO MSC-MEPC.2/Circ.12/Rev.2 [11]; probability values: expert Delphi survey (W = 0.74).
Figure 5.
F–N (frequency–number of fatalities) societal risk curves for EV fires on car-ferry passenger ships. Reference vessel: 63-vehicle loading capacity, approximately 1,500 voyages yr⁻¹, and 505 persons exposed to risk. Three curves represent EV loading ratios of 10%, 30%, and 50%. When the EV loading ratio exceeds 30%, the crew individual risk (IR) enters the ALARP band. ALARP limit lines: IMO MSC-MEPC.2/Circ.12/Rev.2 [11]; probability values: expert Delphi survey (W = 0.74).
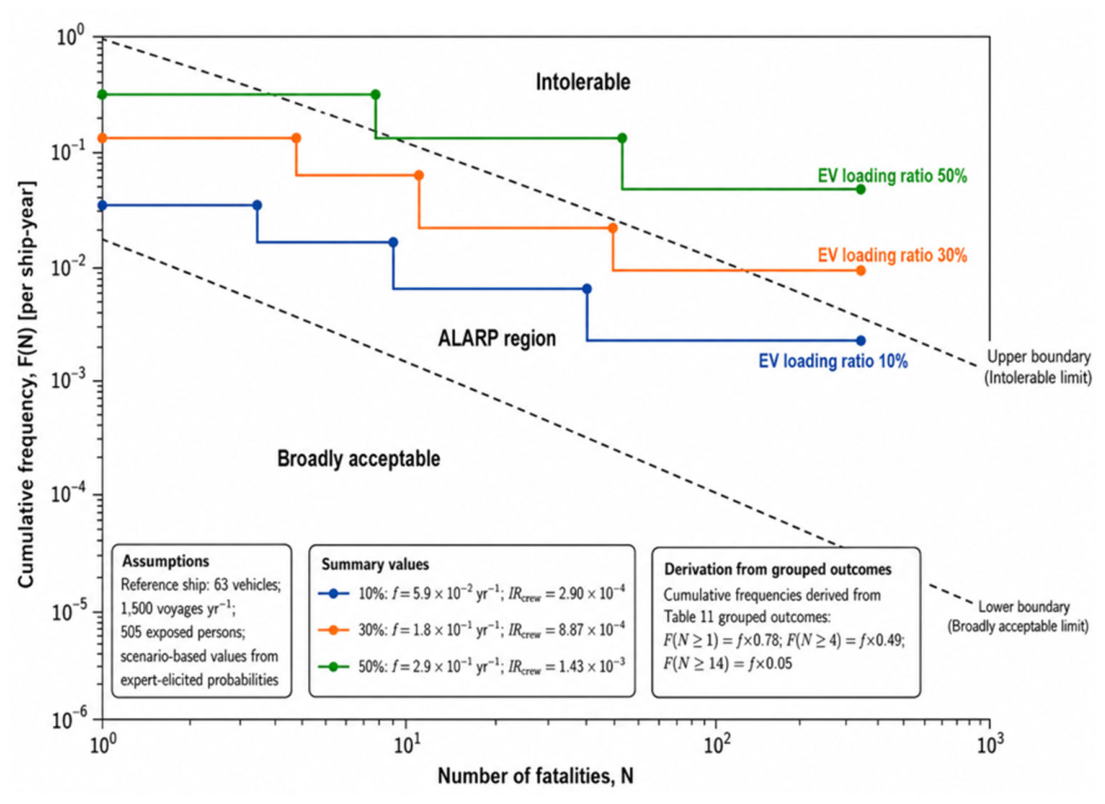
Table 1.
Principal data sources and nature of data.
| Data Source | Key Variables | Use | Nature |
| 2024 EV transport data [4] | Route/month: total vehicles, EVs | Annual exposure baseline | Empirical (unpublished) |
| 2025 EV transport data [5] | Route/month: total vehicles, EVs | EV rate, route concentration | Empirical (unpublished) |
| Current status of domestic passenger ships [3] | Vessel type, route, distance, speed, GT, cargo capacity | Fleet composition, cluster analysis | Empirical |
| Expert Delphi panel (core 10, W=0.74) | FTA/ETA probability values | FTA-ETA probability assignment | Expert-elicited |
| EMSA FIRESAFE II [27] RISE Report [23] |
Open-deck detector reliability, HRR, re-ignition | FTA probability calibration | Literature-based |
Table 2.
Status of domestic passenger ships by vessel type in the Republic of Korea based on KOMSA-managed vessel data as of 8 March 2026. Study target: 104 open-deck car-ferry passenger ships, accounting for 71.2% of the fleet. Ten enclosed-deck car-ferry passenger ships operating on the Jeju and Ulleungdo routes were excluded from the scope of this study.
Table 2.
Status of domestic passenger ships by vessel type in the Republic of Korea based on KOMSA-managed vessel data as of 8 March 2026. Study target: 104 open-deck car-ferry passenger ships, accounting for 71.2% of the fleet. Ten enclosed-deck car-ferry passenger ships operating on the Jeju and Ulleungdo routes were excluded from the scope of this study.
| Vessel Type | Vessels (n) | Share (%) | Vehicle Capacity | Passenger Capacity | Study Scope |
| Car ferry (open deck) | 104 | 71.2 | 2–86 | ~50–700 | ☑ Included |
| Car ferry (closed deck) | 10 | 6.9 | 45–487 | ~150–700 | ✕ Excluded * |
| Passenger-only ferry | 32 | 21.9 | None | — | — |
| Total | 146 | 100.0 | — | — | — |
Note: * Car ferry excluded: large long-distance vessels (GT 2,103–27,391; 45–487 vehicles) operating on distant routes (e.g., Jeju, Wando). Structural and operational characteristics differ fundamentally from open-deck car ferries.
Table 3.
EV transport statistics on car ferry routes. Δpp: change in percentage points.
| Year | Total Vehicles | EV Transported | EV Rate (%) | Year-on-Year Change |
| 2024 | 2,417,310 | 18,424 | 0.76 | — |
| 2025 | 1,209,159 | 14,596 | 1.21 | +0.45 pp (+58%) |
Table 4.
Top-10 car ferry routes by EV proportion in 2025. Priority routes for early RCO deployment.
Table 4.
Top-10 car ferry routes by EV proportion in 2025. Priority routes for early RCO deployment.
| Route | Total Vehicles | EVs | EV Rate (%) |
| Gunsan–Gaeya | 2,298 | 108 | 4.70 |
| Singi–Yeocheon | 62,527 | 1,623 | 2.60 |
| Incheon–Deokjeok | 7,253 | 188 | 2.59 |
| Gaochi–Saryang | 39,358 | 956 | 2.43 |
| Hari–Seogeom | 4,704 | 114 | 2.42 |
| Seonsu–Jumun | 22,686 | 510 | 2.25 |
| Junghwa–Yokji | 27,019 | 591 | 2.19 |
| Dobi–Sonanji | 7,984 | 173 | 2.17 |
| Sammok–Jangbong | 73,089 | 1,503 | 2.06 |
| Mokpo–Sangdaeseri | 19,136 | 392 | 2.05 |
Table 6.
Structural characteristics of car ferries (GA/VLP analysis). Individual vessel data withheld for confidentiality.
Table 6.
Structural characteristics of car ferries (GA/VLP analysis). Individual vessel data withheld for confidentiality.
| Feature | Description | Primary Hazard Link | FSA Reference |
| Vehicle deck | Single layer; open sides (all vessels) | H-07 [1st-order MCS], H-10, H-14 | FTA top event; ETA node N1 |
| Deck head clearance | 2.5–3.8 m (mean 3.1 m) | H-14 (CO₂ ineffective) | FTA q = 0.78 |
| Ramp gate | Width 8–12 m; incline 6–10° | H-02, H-14 | FTA λ = 2.4 × 10⁻⁴ voyage⁻¹ |
| Mixed passenger-vehicle | Passenger spaces 3–6 m from deck openings | H-11, H-18–H-21 | ETA node N4 |
| Vehicle spacing | ~500–600 mm (below 1.0 m propagation threshold) | H-10 fire spread | ETA grade C, P = 0.44 |
| Statutory hull life | 25 yr (Enforcement Rules of the Marine Transportation Act + Age-extension survey) [30] | CBA amortisation period | CRF(n=5) = 0.2246 vs CRF(n=20) = 0.0736 |
Table 7.
IMO FSA five-step procedure application (MSC-MEPC.2/Circ.12/Rev.2 [11]). Expert-elicited values: based on Delphi panel and literature. Empirical values: derived directly from KOMSA/KSA source data.
Table 7.
IMO FSA five-step procedure application (MSC-MEPC.2/Circ.12/Rev.2 [11]). Expert-elicited values: based on Delphi panel and literature. Empirical values: derived directly from KOMSA/KSA source data.
| Step | Category | Method | Car-Ferry-Specific Application |
| 1 | HAZID | Literature review + 15-member broad advisory panel dedicated to HAZID | Additional identification of open-deck and ramp-related hazards based on GA drawing analysis; review of structural fire characteristics studies and domestic and international accident cases. |
| 2 | Risk estimation | FTA–ETA; Monte Carlo n = 10,000; F-N curve | H-07 unreliability q = 0.72 (EMSA FIRESAFE II calibration); EV loading 10/30/50% scenarios; All FTA/ETA values are expert-elicited, not observed frequencies |
| 3 | Risk evaluation | IMO ALARP thresholds; crew/passenger IR; F-N comparison | Derivation of the ALARP threshold at a 30% EV loading ratio; the ALARP boundary was used to identify priorities for institutional improvement. |
| 4 | RCO evaluation | 6 RCOs; GCAF/NCAF; CRF(i=4%; n=5/10/20 yr, Ship Safety Act basis); dual VSL | CRF(n=5)=0.2246 vs CRF(n=20)=0.0736 (3.05× penalty); GCAF is a relative cost metric based on expert-elicited probabilities |
| 5 | Decision | MOF/KR recommendations; IMO SSE 11 information document | Article 97 revision items (a)–(e); ferry operator SMS obligation; Timeline: 2026/2027–2028 |
Table 8.
Expert panel composition: 15-member broad HAZID advisory panel and 10-member core Delphi panel. Proportion of user-oriented expertise, including passenger ship operators and ship design experts: 11/15 in the broad panel (73.3%) and 6/10 in the core panel (60.0%). Kendall’s W = 0.74 for the core panel, p < 0.01, χ² test, df = 22.
Table 8.
Expert panel composition: 15-member broad HAZID advisory panel and 10-member core Delphi panel. Proportion of user-oriented expertise, including passenger ship operators and ship design experts: 11/15 in the broad panel (73.3%) and 6/10 in the core panel (60.0%). Kendall’s W = 0.74 for the core panel, p < 0.01, χ² test, df = 22.
| Category | Role | HAZID Advisory (n=15) | Delphi Core (n=10) | Selection Basis |
| Ship surveyors | HAZID identification | 2 | 2 | 10+ yr; car ferry/fire equipment survey |
| Passenger ship voyage supervisors | HAZID + Probability | 2 | 1 | 10+ yr; Safety inspection and control of passenger ship arrivals and departures |
| Ferry masters | HAZID + Probability | 4(including 1 person per cluster) | 3 | 10+ yr; active command on car ferries |
| Ferry safety managers | HAZID + Probability | 4 | 3 | 10+ yr; ISM (International Safety Management) SMS, emergency response |
| Naval architects | HAZID dedicated | 2 | — | Vehicle deck, ramp gate, fire-prevention layout |
| Fire specialists | HAZID + Probability | 1 | 1 | Marine/battery fire suppression experience |
| Total | 15 | 10 | User perspective (ferry operator): 60% of core panel |
Table 14.
ALARP evaluation summary. IR: individual risk (yr⁻¹). †: exceeds the IMO maximum tolerable crew IR criterion of 10⁻³ yr⁻¹ [11].
Table 14.
ALARP evaluation summary. IR: individual risk (yr⁻¹). †: exceeds the IMO maximum tolerable crew IR criterion of 10⁻³ yr⁻¹ [11].
| EV loading fraction | IR_crew (yr⁻¹) | IR_pax (yr⁻¹) | F-N position | ALARP determination |
| 10% | 2.90 × 10⁻⁴ | 3.87 × 10⁻⁷ | Below lower limit | ALARP (crew); broadly acceptable (pax)→ RCO-4,5 preventive |
| 30% | 8.87 × 10⁻⁴ | 1.18 × 10⁻⁶ | ALARP band | ALARP—risk reduction required→ RCO-1–4 |
| 50% | 1.43 × 10⁻³ † | 1.91 × 10⁻⁶ | Exceeds upper limit | Intolerable (crew) †; ALARP (pax)→ RCO-2+3+4 priority |
Table 15.
Capital Recovery Factor (CRF) by remaining service life based on the Marine Transportation Act. Legal basis: Marine Transportation Act, which sets the maximum service life at 20 years, and the age-extension survey system, which allows an additional extension of up to 5 years [30], resulting in a total maximum service life of 25 years. i: real discount rate (4%); n: remaining service life in years.
Table 15.
Capital Recovery Factor (CRF) by remaining service life based on the Marine Transportation Act. Legal basis: Marine Transportation Act, which sets the maximum service life at 20 years, and the age-extension survey system, which allows an additional extension of up to 5 years [30], resulting in a total maximum service life of 25 years. i: real discount rate (4%); n: remaining service life in years.
| Remaining hull life n (yr) | CRF (i=4%) | Penalty vs n=20 | Legal Basis / Policy Interpretation |
| 20 | 0.0736 | 1.00× (baseline) | Newbuild— Maximum remaining service life within the statutory service age under the Marine Transportation Act; RCOs can be incorporated into the design at the newbuilding stage. |
| 10 | 0.1233 | 1.68× | Mid-life vessels, approximately 10 years of age: vessels that have reached about half of the statutory service age and are within a technically and economically feasible period for retrofit implementation. |
| 5 | 0.2246 | 3.05× | Age-extension survey regime (hull age 20–25 yr); Prioritized application of non-equipment-based RCOs is recommended. |
Note:Article 5 of the Enforcement Rule of the Marine Transportation Act sets the maximum service age of domestic passenger ships at 20 years [30]. Under the age-extension survey system, when a vessel exceeds the statutory service age of 20 years, its operation may be extended in one-year increments within a maximum additional period of 5 years, subject to enhanced inspection standards, allowing operation for up to 25 years in total. For vessels in the n = 5 remaining service life category, prioritizing RCO-4, RCO-5, and RCO-6, which are low-cost and non-equipment-based measures, is economically and practically more appropriate than applying RCO-3, a high-cost water-spray cooling measure.
Table 16.
Risk control options (RCOs). GCAF: USD million. CAPEX/OPEX: KRW million (M). Cost-effective: GCAF < VSLIMO (USD 3.0M). All RCOs cost-effective across all hull-life stages. 1 USD = 1,400 KRW.
Table 16.
Risk control options (RCOs). GCAF: USD million. CAPEX/OPEX: KRW million (M). Cost-effective: GCAF < VSLIMO (USD 3.0M). All RCOs cost-effective across all hull-life stages. 1 USD = 1,400 KRW.
| RCO | Description | Target hazards | CAPEX (KRW M) | OPEX (M yr⁻¹) | GCAF n=20 | GCAF n=5 | Cost- effective? |
| RCO-1 EV-DSZ | EV Designated Stowage Zone (EV Designated Stowage Zone, EV-DSZ): Layout A (mid-ship, routes >3h); Layout B (sentinel band at ramp gate, routes ≤3h). Layout B enables direct hose access by shore fire dept. | H-04,10,18 | 80–150 | 3–5 | 0.09–0.17 | 0.22–0.40 | ○ all |
| RCO-2 Detection | Multi-sensor open-deck detection: IR camera + linear heat detector + HF gas sensor per EV bay. Target: H-07 (sole 1st-order MCS). Design criterion: P(activation) ≥0.80 at wind ≤15 m/s. | H-07,08 | 40–80 | 2–4 | 0.02–0.05 | 0.05–0.11 | ○ all |
| RCO-3 Cooling | Fixed automatic water-spray cooling in EV-DSZ: application rate ≥10 L min⁻¹ m⁻²; sustained capacity ≥10 min. | H-12,14–17 | 120–200 | 4–7 | 0.19–0.33 | 0.47–0.79 | ○ all |
| RCO-4 Inspection | Mandatory EV pre-boarding inspection (Voyage supervisor statutory duty): SOC ≤80% declaration; IR thermal camera at ramp gate; checklist as permit-to-carry condition. | H-01–03,05 | 3–8 | 8–15 | 0.11–0.21 | 0.11–0.22 | ○ all |
| RCO-5 Training | EV crew competency programme (ferry operator SMS (Safety Management System, SMS) obligation): 4 h annual drill; LIB recognition, open-deck cooling, passenger evacuation. Subject to MOF/KR audit. | H-09,21 | 1–3 | 2–5 | 0.03–0.08 | 0.04–0.09 | ○ all |
| RCO-6 Joint response | Port authority–fire dept joint EV fire plan for routes with EV fraction >2% (Table 4): annual joint drill; EV-specific response procedures. No capital outlay required. | H-11,09,22 | 0–5 | 0–2 | 0.00–0.05 | 0.00–0.06 | ○ all |
Note:1. At a 30% EV loading fraction, RCO-2+3+4 reduces AEF from 0.445 to 0.064 yr⁻¹ (−85.6%). The combined GCAF is USD 0.05–0.16 million across n = 20, 10, and 5 years, remaining below both Korean and IMO VSL benchmarks. RCO-6 can be implemented immediately on high-EV-ratio routes (>2%; Table 4) because it requires no fixed hardware investment and provides additional emergency-response capacity at negligible capital cost. 2. The ΔAEF values used for the GCAF calculations were 0.069, 0.143, 0.047, 0.054, 0.044, and 0.037 yr⁻¹ for RCO-1 to RCO-6, respectively. For the combined implementation of RCO-2, RCO-3, and RCO-4, ΔAEF was 0.400 yr⁻¹.
Table 17.
Structural comparison with Jiang et al. [19].
Table 17.
Structural comparison with Jiang et al. [19].
| Item | Jiang et al. [19]—FTA-FBN | This Study—IMO FSA |
| Vessel type | Enclosed Ro-Pax (single route) | Open-deck car ferries (104 vessels, 3 clusters) |
| Data basis | Route operating knowledge | KOMSA registry + KSA EV data + GA/VLP drawings |
| Accident data | Undisclosed | Review of domestic marine accident cases and international literature; EV-specific probabilities are based on expert panel estimates. |
| Expert panel | 5 members; supply-chain perspective | HAZID 15 + Delphi core 10 (W=0.74); 60% ferry-operator perspective |
| Primary risk driver | Ignition triggers | Detection failure H-07 (sole 1st-order MCS) |
| Suppression context | CO₂/foam partially effective (enclosed) | CO₂/foam ineffective (open deck, wind ≥5 m/s) |
| Regulatory output | General prevention recommendations | ALARP/F-N/GCAF + MOF/KR/IMO actionable recommendations |
Disclaimer/Publisher’s Note: The statements, opinions and data contained in all publications are solely those of the individual author(s) and contributor(s) and not of MDPI and/or the editor(s). MDPI and/or the editor(s) disclaim responsibility for any injury to people or property resulting from any ideas, methods, instructions or products referred to in the content. |
© 2026 by the author. Licensee MDPI, Basel, Switzerland. This article is an open access article distributed under the terms and conditions of the Creative Commons Attribution (CC BY) license.
Copyright: This open access article is published under a Creative Commons CC BY 4.0 license, which permit the free download, distribution, and reuse, provided that the author and preprint are cited in any reuse.


