

Submitted:
16 May 2026
Posted:
18 May 2026
You are already at the latest version
Abstract
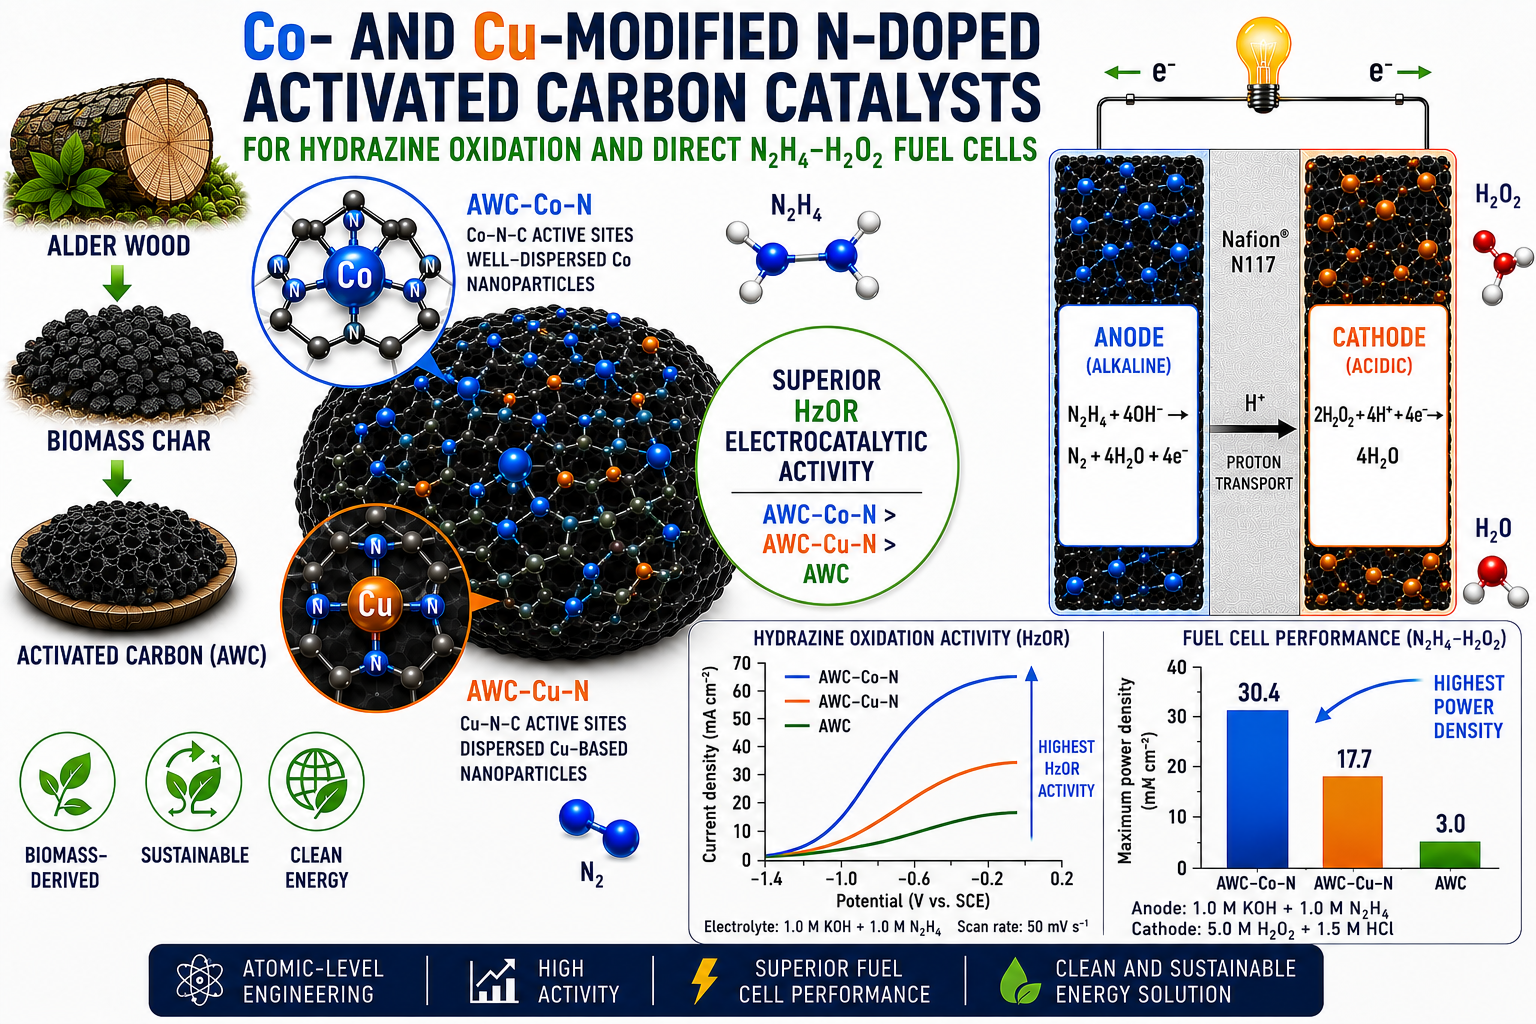
In this study the development of sustainable electrocatalysts for clean energy by modifying biomass-derived activated carbon with nitrogen and transition metals is presented. Activated carbon (AWC) was synthesized using alder wood char as a precursor, while nitrogen and cobalt or copper nanoparticles were incorporated with the aim to create efficient materials for hydrazine oxidation (HzOR) and direct hydrazine-hydrogen peroxide fuel cells (DHHPFC, N2H4–H2O2). The composition, structure, and surface morphology of the created catalysts were examined using inductively coupled plasma optical emission spectroscopy (ICP-OES), X-ray photoelectron spectroscopy (XPS), X-ray diffraction (XRD), and scanning electron microscopy and energy dispersive X-ray analysis (SEM/EDX). The activity of the AWC, AWC–Co–N, and AWC–Cu–N catalysts for HzOR was evaluated by cyclic voltammetry (CV) and linear sweep voltammetry (LSV). N2H4–H2O2 fuel cell tests were carried out by employing the catalysts both as the anode and cathode. It was found that all materials retained a hierarchical porous carbon framework, while metal incorporation altered surface compactness Cobalt doping produced well-dispersed Co nanoparticles and abundant Co–N–C coordination sites, whereas Cu introduction resulted in moderately compact structures with uniformly distributed Cu-based nanoparticles. Electrochemical measurements demonstrated that both metal dopants enhanced HzOR activity, with the catalytic performance following the order AWC–Co–N > AWC–Cu–N > AWC. Fuel-cell testing further confirmed this trend: AWC–Co–N achieved the highest maximum power density (30.4 mW cm–2), outperforming AWC–Cu–N (17.7 mW cm–2). These results identify AWC–Co–N as a highly effective bifunctional electrocatalyst for DHHPFCs.
Keywords:
biomass
; alder wood char
; activated carbon material nitrogen
; cobalt
; copper
; hydrazine oxidation
; fuel cell
1. Introduction
The introduction should briefly place the study in a broad context and highlight why it is important. It should define the purpose of the work and its significance. The current state of the research field should be carefully reviewed and key publications cited. Please highlight controversial and diverging hypotheses when necessary. Finally, briefly mention the main aim of the work and highlight the principal conclusions. As far as possible, please keep the introduction comprehensible to scientists outside your particular field of research. References should be numbered in order of appearance and indicated by a numeral or numerals in square brackets—e.g., [1] or [2,3], or [4,5,6]. See the end of the document for further details on references.
The growing global demand for clean, efficient, and sustainable energy technologies has intensified the search for alternative fuel systems to reduce dependence on fossil fuels and mitigate environmental impact. Direct hydrazine fuel cells (DHFCs) are among the most promising emerging energy conversion devices. They have a relatively high theoretical electromotive force of 1.56 V, resulting in high power density and zero production of carbon species, such as CO and products of incomplete C2-molecules oxidation, which can poison electrocatalysts [1,2,3]. Another advantage of using toxic liquid hydrazine is that it can be converted into safer solid hydrazine derivatives, such as a solid hydrazone form (>C=N–NH2) or hydrazide (–CO–NH–NH2), in the event of tank damage [1,3]. Furthermore, these solid derivatives can be converted back to hydrazine upon contact with an electrolyte solution [1,4,5]. DHFCs, unlike hydrogen fuel cells, do not require high-pressure storage systems or complex fuel reforming infrastructure [1,2,5], offering a simplified and safer fuel delivery pathway. Despite these advantages, the commercialization of DHFCs is largely constrained by sluggish hydrazine oxidation reaction (HzOR) kinetics at the anode, limiting cell efficiency and output power. In alkaline media, DHFCs operate via the anodic oxidation of N2H4 at the anode (Equation 1) and cathodic reduction of O2 at the cathode (Equation 2):
Anode: N2H4 + 4OH– → N2 + 4H2O + 4e–, E0 = −1.16 V vs. SHE
Cathode: O2 + 2H2O + 4e– → 4OH–, E0 = 0.40 V vs. SHE
At the anode, N2H4 reacts with hydroxide ions (OH–) from the alkaline electrolyte. This reaction releases four electrons (4e–) and produces nitrogen gas (N2) and water (H2O). The N2 gas is released as a clean, non-toxic by-product. Mechanistically, N2H4 first adsorbs onto the catalyst surface, which is often a transition metal, such as nickel (Ni) or platinum (Pt) [4]. During dehydrogenation steps, hydrogen atoms are removed from N2H4 and react with OH– to form H2O, while electrons are released to the external circuit [4]. The reaction ends with the formation of molecular nitrogen. At the cathode, oxygen molecules from the air dissolve in the electrolyte. They gain four electrons (supplied from the anode through an external circuit) and react with water to form hydroxide ions (OH–) [1,4]. This regenerates the OH– consumed at the anode. Combining these two half-reactions gives the overall reaction (Equation 3), in which hydrazine and oxygen react to produce N2 gas and water, without emitting carbon dioxide (CO2), making this a clean energy process.
Overall Cell Reaction: N2H4 + O2 → N2 + 2H2O, E = 1.56 V
Notably, N2H4 has a rather high hydrogen content of 12.5 wt.%. Depending on the catalytic materials, a spontaneous N2H4 hydrolysis can be proceeded by the following reaction (Equation 4) [1,6]:
O2 is typically used as the oxidant in fuel cells. However, fuel cells that use hydrogen peroxide (H2O2) as the oxidant have also been proposed and have various potential applications [7,8,9,10,11,12]. The reduction of H2O2 at the cathode in an acidic medium is given by equation 5:
4H2O2 + 8e– + 8H+ → 8H2O, E0 = 1.77 V vs. SHE
The theoretical cell voltage of 2.93 V of the direct hydrazine–hydrogen peroxide fuel cell (DHHPFC, N2H4–H2O2) (equation 6) is significantly higher than that of the DHFC (1.56 V), which uses O2 as the oxidant:
N2H4 + 2H2O2 → N2 + 4H2O, E = 2.93 V
The fact that H2O2 is a liquid oxidant at ambient temperature and pressure makes it easier to transport, store, and handle than O2. It also has the additional advantage of being suitable for use in a small-volume single-stack fuel cell. Additionally, hydrogen production is also known to proceed through the decomposition of N2H4 by two different pathways, forming different products, as noted below [13]:
N2H4 → N2 + 2H2
3N2H4 → N2 + 4NH3
Reaction (8) is undesirable because it leads to the release of the by-product NH3. Even a small amount of ammonia causes deactivation of the catalyst and is a poison for fuel cells. In this case, the aforementioned hydrolysis reaction of N2H4 (4) and its chemical decomposition (7) and (8) are strongly unfavorable in DHFCs operation since they lead to incomplete fuel oxidation, decreased faradaic efficiency, and reduced power density. Despite the dual relevance of hydrazine to act as a hydrogen source and an anodic fuel for DHFCs, there is a need for a proper catalyst that can accelerate the basic reaction and to suppress the simultaneously proceeding detrimental by-reactions emerges. The development of perfect catalysts that can selectively and efficiently promote the desired reactions, with the ultimate goal of identifying the best conditions for their optimal performance, remains a focus of much recent research. Platinum group metals (PGMs), especially platinum (Pt) and palladium (Pd)-based materials, have traditionally been used as electrocatalysts due to their superior activity [3,4,5,9,10,14,15,16,17,18,19,20]. However, their high cost, scarcity, and vulnerability to poisoning by reaction intermediates pose significant barriers to their widespread adoption. Consequently, there is an urgent need to develop alternative catalysts that are cost-effective, durable, and environmentally sustainable, including transition metals (Co, Ni, Fe, and Cu) [15,20,21,22,23,24], coinage metals (Ag, Au) [20,21], NiFe-based catalysts [25,26], NiCo-based catalysts [12,15,27,28,29], and CoZn [11,30]. Moreover, Ni-, Co-, and Cu-based metals exhibit some of the lowest onset potentials reported in the literature. They often rival or even surpass the performance of platinum-group metals in specific reactions such as the hydrazine oxidation reaction (HzOR) or the oxygen reduction reaction (ORR) [20]. Their cost-effectiveness and earth abundance make them attractive for sustainable catalysis. Recently, biomass-derived activated carbon has emerged as a promising catalyst support material for creating more sustainable and efficient catalytic materials for the HzOR [31,32,33,34]. Biomass sources, such as agricultural waste, forestry residues, and food by-products, are abundant, renewable, and low-cost, aligning well with green chemistry principles. These materials yield activated carbons with a high surface area, well-developed porosity, and conductive frameworks when thermochemically converted via pyrolysis and chemical activation. These properties are essential for efficient electrocatalysis. Beyond acting as passive supports, nitrogen doping of the carbon matrix introduces heteroatom-induced defect sites, enhances electronic conductivity, and creates chemically active functional groups (e.g., pyridinic and graphitic nitrogen). These groups which serve as catalytically active centers for redox reactions. To further boost catalytic performance, incorporating earth-abundant transition metals or their oxides/alloys, particularly Ni [35], NiO [36], Co [37], CoO/Co3O4 [38], Fe [39], Cu [40], and MnFe [41], into the nitrogen-doped carbon framework has shown promising results. These metals exhibit intrinsic electrocatalytic activity for HzOR due to the synergistic interaction between transition metals and nitrogen-doped carbon, which is a critical advantage of these composite materials. This interaction often leads to the formation of metal–nitrogen–carbon (M–N–C) coordination structures, which are recognized as highly active and stable sites for various electrocatalytic reactions. These structures promote uniform dispersion of metal nanoparticles, minimize aggregation, and maximize the active surface area. Strong electronic interactions between the metal centers and the nitrogen-doped carbon matrix enhance charge transport and improve electrochemical stability, as M–N–C configurations resist leaching and degradation in alkaline media. While research on carbon-based electrocatalysts and transition metal-based systems is growing, integrated approaches combining nitrogen-doped, biomass-derived carbon and transition metals are scarce for developing multifunctional, sustainable catalysts for DHFCs.
This study aims to synthesize novel, biomass-derived activated carbon catalysts embedded with nitrogen and Co or Cu nanoparticles, and to evaluate their structural, physicochemical, and electrocatalytic properties for HzOR. The overarching goal is to develop a low-cost, efficient, and environmentally friendly anode catalyst for DHHPFCs, capable of replacing noble metal systems without sacrificing performance. By leveraging the complementary strengths of biomass-derived carbon, nitrogen doping, and the incorporation of transition metals, this research contributes to the advancement of sustainable fuel cell technologies and supports the broader transition toward clean energy systems.
2. Materials and Methods
2.1. Chemicals
Alder wood char was supplied by Ltd. “Fille” (Valmiera, Latvia). Sodium hydroxide (NaOH, 98%), hydrochloric acid (HCl, 35–38%), cobalt(II) acetate tetrahydrate (Co(CH3COO)2·4H2O, 98%), and hydrogen peroxide (H2O2, 35%) were purchased from Chempur (Piekary Śląskie, Poland), while dicyandiamide (DCDA), anhydrous copper acetate (Cu(CH3COO)2, 98%) were obtained from Sigma–Aldrich (St. Louis, USA). Dimethylformamide (DMF, >98.8%, ACS reagent grade) and ethanol (C2H5OH, 99.8%) were supplied by Honeywell Fluka (Loughborough Leicestershire, UK). Nafion solution (5 wt%) was supplied by Ion Power Inc. (Washington, USA). All chemicals were analytical grade and used as received without any further purification.
2.2. Preparation of Cobalt– and Copper–Nitrogen-Doped Activated Carbon Materials
Activated carbon material (AWC) material was synthesized using alder wood char as a carbon precursor as described in Ref. [35]. Briefly, 50 g of char was mixed with 150 g of NaOH and followed an activation procedure at a temperature of 800 oC for 2 h in an argon (Ar) atmosphere using a muffle furnace. After cooling, the obtained AWC material was demineralized by treatment with a 10% HCl solution for 2 h. The material was washed with demineralized water until the pH stabilized at 5–6, and then dried in an oven at 105 ± 2 oC for 12 h. Then, the obtained AWC was used as a substrate for co-doping it with nitrogen and cobalt or copper nanoparticles in a single step using rotary evaporation technique. 2 g of AWC was mixed with 40 g of DCDA and either 0.84 g of Co(CH3COO)2·4H2O or 0.56 g of Cu(CH3COO)2 in 250 mL of DMF. Mixtures were treated in a rotary evaporator (Hei-VAP Industrial, Heidolph, Schwabach, Germany) at 150 mbar for 3 h, then soaked for additional 16 hours. Then, DMF was evaporated and the resulting solid mixtures were tempered at 800 °C for 1 hour in Ar atmosphere. The resulting materials were designated as AWC–Co–N and AWC–Cu–N.
2.3. Characterization of Catalysts
The morphology and composition of materials were investigated by scanning electron microscopy (SEM) using a SEM/FIB workstation Helios NanoLab 650 with an energy dispersive X-ray (EDX) spectrometer INCA Energy 350 X-Max 20 (Oxford Instruments, Abingdon, UK).
The porous structure, including specific surface area (BET and DFT methods), pore size distribution (DFT) and total volumes of micro (Dubinin-Radushkevich theoty – DR) and mesopores, were determined from adsorption-desorption isotherms of nitrogen at 77 K using Nova 4200e device (Quantachrome, Boynton Beach, FL, USA).
XPS characterization of samples was carried out using a Kratos AXIS Supra+ spectrometer (Kratos Analytical, Manchester, UK) with monochromatic Al Kα (1486.6 eV) X-ray radiation, powered at 225W. The base pressure in the analysis chamber was less than 1x10⁻⁸ mbar, and a low-electron-flood gun was used as a charge neutralizer. Survey spectra for each sample were recorded with a pass energy of 80eV and an energy step of 1eV. High-resolution spectra were recorded with a pass energy of 10 eV and an energy step of 0.1eV over individual element peaks. The binding energy scale was calibrated by setting the adventitious carbon peak at 284.8eV. The XPS data were converted to VAMAS format and processed using Avantage software 5.9931.0.6755 (Thermo Scientific, East Grinstead, UK).
A D2 PHASER X-ray diffractometer (Bruker, Karlsruhe, Germany) equipped with a LYNXEYE XE-T detector and Cu Kα radiation (λ = 1.54060 Å) was used to measure the XRD patterns of the samples under study. The diffractometer operated at 30 kV and 10 mA. Measurements were conducted in step scan mode with a step size of 0.041° (on the 2θ scale) and a counting time of 2 seconds per step within the 2θ range of 5–90°. Phase identification was performed using DIFFRAC.EVA V5.0 software (Bruker, Karlsruhe, Germany) and Crystallography Open Database (COD) data cards.
2.4. Electrochemical Measurements
All electrochemical measurements were carried out in a conventional three-electrode setup of 100 mL combined with a potentiostat PGSTAT302 (Metrohm Autolab B.V., Utrecht, The Netherlands) and operated with the Nova 2.1.4 software.
During the investigations, the fabricated AWC, AWC–Co–N, and AWC–Cu–N catalysts were employed as working electrodes. A Pt sheet was used as the counter electrode, and a saturated calomel electrode (SCE) served as the reference electrode. The catalyst’s ink was prepared by mixing 21.5 mg of each material (AWC, AWC–Co–N, or AWC–Cu–N) with 1 mL of a C2H5OH : H2O (vol 1:1) and 85 μl of a 5wt.% Nafion solution. Then, 8 μl of the prepared catalyst’s ink were dipped on the glassy carbon electrode (GC) with a geometric area of 0.2 cm2.
The N2H4 oxidation studies were performed by recording cyclic voltammograms (CVs) in an Ar-deaerated solution of 0.05 M N2H4 and 1 M KOH, as well as in the background solution of 1 M KOH, at room temperature. The potential was cycled in a range of –1.2 to 0.6 V (vs. SCE) at various scan rates from 10 to 50 mV s−1. Additionally, CVs were recorded for different N2H4 concentrations (25–100 mM) at a fixed scan rate of 50 mV s−1.
2.5. Fuel Cell Test Experiments
N2H4–H2O2 fuel cell tests were carried out by employing the optimum AWC, AWC–Co–N and AWC–Cu–N catalysts with a geometric area of 0.2 cm2 as the anode and as the cathode. The anolyte was composed of an alkaline mixture of 1 M N2H4 and 1 M KOH, while the catholyte contained 5 M H2O2 and 1.5 M HCl. Each compartment of the cell was filled with 100 mL of the corresponding aqueous electrolyte. The test solutions were prepared immediately before the measurements. A Nafion N117 membrane was used to separate the anodic and cathodic compartments of the single direct N2H4–H2O2 fuel cell. The presented current densities are normalized with respect to the geometric area of catalysts. All electrochemical measurements were performed with a Zennium electrochemical workstation (ZAHNER-Elektrik GmbH & Co. KG, Kronach, Germany). The performance of the fuel cell was evaluated through the recording of cell polarization and obtaining the corresponding power density curves. Cell polarization curves were recorded at temperatures between 25 and 55 ℃.
3. Results
3.1. Physical Characterization
SEM images (Figure 1a–c) illustrate the morphological evolution of activated carbon (a) and its nitrogen-doped derivatives modified with cobalt (b) and copper (c) particles.
Figure 2 presents the corresponding EDX spectra of AWC–Co–N and AWC–Cu–N catalysts, which confirm the successful incorporation of Co and Cu species within or anchored onto the carbon matrix.
The AWC sample reveals agglomerated particles with irregular shapes and a rough, layered surface morphology. At lower magnification, the material appears as loosely packed clusters with a porous structure. Higher magnification images show plate-like and fragmented features with sharp edges and textured surfaces, indicating a highly irregular and heterogeneous microstructure which favors high surface area (Figure 1a).
The AWC–Co–N catalyst exhibits a more compact and smoother surface morphology while maintaining a porous framework (Figure 1b–b′′). Fine, bright particles are clearly visible and evenly distributed over the carbon sheets, which are attributed to Co-based species anchored on the surface. The distribution suggests reasonably good dispersion of Co species, although some localized agglomeration is evident.
The AWC–Cu–N sample displays more distinct, plate-like and crystalline particles distributed over the carbon surface (Figure 1c–c′′). Compared to the AWC–Co–N sample, Cu particles appear larger and more faceted, with sharper edges. These particles are embedded within or anchored onto the carbon matrix, and some degree of aggregation is observed. The surface remains porous, but similar to the AWC–Co–N case, partial pore blockage or coverage by Cu particles is noticeable.
Overall, all samples preserve the hierarchical porous architecture derived from the activated carbon precursor – alder wood char, but metal incorporation distinctly introduces additional surface features: Co tends to form finer, more uniformly dispersed particles, while Cu forms relatively larger, more crystalline aggregates. These changes increase surface heterogeneity and may influence catalytic activity by providing active metal sites while slightly reducing accessible porosity due to partial pore coverage.
Nitrogen adsorption-desorption measurements at 77 K were used to evaluate the porous structure of the samples. The resulting isotherms (Figure 3) indicate predominantly microporous characteristics with an additional contribution from mesoporosity, suggesting a hierarchical pore system.
The textural parameters summarized in Table 1 show that pristine AWC exhibits the highest BET surface area (2722 m2 g–1) and total pore volume (1.5 cm3 g–1), confirming its highly developed porous framework.
Upon incorporation of transition metals, both surface area and pore volume decrease, suggesting partial pore blockage and structural densification. Among the modified samples, AWC–Co–N shows a more pronounced reduction (1991 m2 g–1, 1.1 cm3 g–1), whereas AWC–Cu–N retains a relatively higher pore volume (1.3 cm3 g–1) despite a lower surface area (1811 m2 g–1), which may be associated with differences in metal dispersion and pore restructuring during synthesis. The average pore width remained within the mesoporous range (2.2–2.8 nm). Notably, the mesopore fraction increases from 40.2 % in AWC to 44.7 % and 56.5 % for AWC–Co–N and AWC–Cu–N, respectively, suggesting that metal incorporation may promote the development or preservation of mesoporous domains despite the overall decrease in surface area. Overall, the textural properties follow the order AWC > AWC–Cu–N > AWC–Co–N in terms of surface area and porosity. These results suggest that cobalt incorporation may exert a stronger densifying effect on the carbon matrix, whereas copper modification appears to better preserve a more open and accessible pore structure. Although metal incorporation reduces the overall surface area, it may simultaneously contribute to the formation of additional metal-nitrogen coordination sites, which are often beneficial for catalytic activity.
X-ray diffraction (XRD) was used for the investigation of the crystalline structure of the synthesized carbon materials (Figure 4). XRD pattern for AWC exhibits a peak at around 43o assignable to the (100) diffraction of carbon (COD 2101499) (Figure 4a), whereas XRD pattern for AWC–Cu–N showed diffraction peaks at 43.1o, 50.2o, and 73.8o corresponding to the (111), (200), and (220) planes of metallic Cu (COD 9013015) (Figure 4b).
XRD pattern for AWC–Co–N showed diffraction peaks at 44.1o, 51.3o, and 75.8o corresponding to the (111), (200), and (220) planes of metallic Co (COD 9008466) (Figure 4c).
The elemental composition and bonding configurations were analyzed by XPS. Figure 5a shows the XPS survey spectra of AWC, AWC–Cu–N, and AWC–Co–N. The XPS spectrum has two peaks centered at 284.8 eV and 532.4eV for AWC, four peaks at 284.4 eV, 399.0 eV, 531.9 eV, and 932.9 eV for AWC–Cu–N, and four peaks located at 284.8, 398.9, 532.1, and 778.6 eV for AWC–Co–N, corresponding to C 1s, N 1s, O 1s, and Cu 2p or Co 2p, respectively (Figure 5a, Table S1, Supplementary Material).
The details of the peak assignment and the percentage of the chemical composition are summarized in Table S2 (Supplementary Material). The high-resolution XPS spectra of C 1s for all carbon materials were divided into the main peaks located at 284.4±0.4eV corresponding to the C=C (C sp3, 62–41%) and others located at 284.2±0.2 eV attributing to the C–C (C sp2, 14–10%), 285.2±0.2 eV – C–N/N–sp2–C (16–28%)), 286.2±0.4 eV – C–O/N–sp3–C/C–N=O (7–16%) (Figure 5b, Table S2, Supplementary Material) [42,43,44]. The O 1s XPS spectrum for AWC shows five types of fitted peaks at 530.2 eV, 531.7 eV, 532.5, 533.4, and 534.7 eV corresponding to the C–O–C, C=O, O–C–O, O vacancies, and adsorbed H2O, whereas for the AWC–Cu–N and AWC–Co–N catalysts, oxygen was deconvoluted into three peaks centered at 530.7 and 531.1 eV, 531.7 and 532.1 eV, and 533.2 and 533.7 eV, and attributed to the appearance of the different oxygen functionalities such as, C–O–C and C=O, O–C–O, and O vacancies, respectively (Figure 5c).
Figure 5d shows the N 1s XPS spectrum for AWC–Cu–N, which was deconvoluted into four peaks centered at 398.2, 399.4, 400.6, and 402.6 eV, which were corresponding to its pyridinic-N, pyrrolic-N, graphitic-N, and pyridinic-N–O. In the case of AWC–Co–N, three peaks at 398.8 eV, 400.1 eV, and 401.4 eV were also observed, corresponding to pyridinic-N, pyrrolic-N, and graphitic-N. Most of N in both carbon materials was in pyridinic-N (33–55%) (Table S2, Supplementary Material).
The high-resolution Cu 2p spectrum for AWC–Cu–N is shown in Figure 5e. The Cu 2p region demonstrates the appearance of two overlapping peaks at 932.8 and 935.4 eV and 952.6 and 955.2 eV, which corresponded to Cu2p3/2 and Cu2p1/2, respectively. Peaks at 932.8 eV for 2p2/3 and 952.6 eV for 2p1/2 show the presence of Cuo and the ones at 935.4 eV for 2p2/3 and 955.2 eV for 2p1/2 eV can be attributed to Cu2+ [45].
Finally, Figure 5f shows the high-resolution Co 2p spectrum, where two dominant peaks led by spin-orbit effects located at approximately 778.4 eV and 793.4 eV attributing to Co 2p3/2 and Co 2p1/2, respectively. The difference in binding energy was 14.93 eV indicating that cobalt is in the metallic state, Meanwhile, the deconvolution of the XPS spectrum of Co 2p3/2 and Co 2p1/2 confirms the presence of different oxidation states of Co atoms as Co3O4 and Co2+ oxides/hydroxides, including CoO, CoOOH, Co(OH)2 (779.0 eV, 780.4 eV, 782.1 eV), with overlapping binding energies of different oxide and hydroxide forms [46]. Additionally, the intensity at 531.0 eV region in the O 1s spectrum for AWC–Co–N corresponding to Co–O–Co [46]. Notably, the presence of metallic Cu and Co in the AWC–Cu–N and AWC–Co–N catalysts was also confirmed by XRD (Figure 4c,d).
3.2. Investigation of N2H4 Oxidation
CVs of AWC (a), AWC–Co–N (b), and AWC–Cu–N (c) catalysts, recorded in 1 M KOH and 0.05 M N2H4 + 1 M KOH at a scan rate of 50 mV s–1 at 25 °C, are presented in Figure 6 and were used to evaluate the electrocatalytic performance of the catalysts toward the HzOR.
In 1 M KOH (black curves), all samples exhibit relatively low current densities without pronounced faradaic features, indicating minimal activity in the absence of hydrazine. Upon the addition of 0.05 M N2H4 (colored curves), a significant increase in anodic current density is observed for all catalysts, confirming the occurrence of HzOR. For AWC (Figure 6a), only a moderate current rise appeared at positive potentials, suggesting limited intrinsic catalytic activity. In contrast, AWC–Co–N (Figure 6b) displayed a pronounced and sharp oxidation peak, demonstrating significantly enhanced catalytic behavior attributed to Co–N–C active sites that promote hydrazine adsorption and electron transfer. AWC–Cu–N (Figure 6c) also exhibited a clear oxidation response, with current densities higher than those of AWC but lower than those of AWC–Co–N, implying intermediate activity. To further compare the performance, the data presented in Figure 6d summarize the polarization behavior of all catalysts together with a reference AWC–N catalyst reported in the literature [35]. AWC–Co–N exhibits the highest current density across the studied potential range, reaching ~65 mA cm-2, followed by AWC–Cu–N (~30 mA cm–2), while AWC shows significantly lower activity. Notably, the AWC–N reference displays inferior performance compared to the metal-doped catalysts, highlighting the beneficial role of transition metal-nitrogen active sites. The apparent onset potentials (estimated from the CV curves) shift toward more negative values upon metal incorporation, suggesting improved reaction kinetics (Figure 7). The catalytic activity follows the order: AWC–Co–N (–0.65 V) > AWC–Cu–N (–0.60 V) > AWC–N (–0.56 V) AWC (–0.40 V), confirming that cobalt doping most effectively enhances HzOR under alkaline conditions.
To gain deeper insight into the HzOR mechanism, additional linear sweep voltammetry (LSV) measurements were carried out in 0.05 M N2H4 + 1 M NaOH at scan rates ranging from 10 to 50 mV s–1 at 25 °C. The corresponding LSVs of AWC, AWC–Co–N, and AWC–Cu–N catalysts are presented in Figure 8.
The anodic current density increases progressively with increasing scan rate for all catalysts, indicating the involvement of mass transport processes, with diffusion playing a significant role in the HzOR. The quasi-linear dependence of current density on the square root of scan rate (R2 = 0.92–0.95) suggests a significant contribution of diffusion to the overall reaction process. However, slight deviations from ideal linearity suggest that the reaction is governed by a mixed mechanism involving both mass transport and surface-controlled kinetics. Among the studied materials, pristine AWC (Figure 8a) exhibits the lowest current densities, indicating limited intrinsic catalytic activity toward HzOR. In contrast, both metal-nitrogen modified catalysts show significantly enhanced performance. Notably, AWC–Co–N (Figure 8b) delivers the highest current densities, demonstrating superior catalytic activity relative to AWC–Cu–N (Figure 8c). The enhanced performance of AWC–Co–N can be attributed to the formation of abundant Co–N–C coordination sites, which promote efficient hydrazine adsorption and facilitate faster electron transfer kinetics. Meanwhile, AWC–Cu–N shows moderate improvement over AWC, indicating that Cu–N sites are active but less effective than Co–N sites for HzOR.
Additional measurements were also performed at varying N2H4 concentrations following the scan rate analysis (Figure 9).
This approach allows evaluation of the influence of reactant concentration on the catalytic response of the AWC–Co–N, and AWC–Cu–N catalysts under identical electrochemical conditions. Figure 9 shows the LSV curves of the three catalysts recorded in 1 M KOH containing different concentrations of N2H4 (0.025–0.10 M) at a scan rate of 50 mV s–1 and 25 °C. For all catalysts, the anodic current density increases progressively with increasing N2H4 concentration, indicating that the HzOR rate is strongly dependent on the reactant concentration. To ensure consistent comparison between the samples, current density values were extracted at fixed potentials, namely at –0.3 V vs. SCE for AWC, and at –0.4 V vs. SCE for AWC–Co–N and AWC–Cu–N. Within this potential range, the current density increased nearly linearly with N2H4 concentration. Specifically, increasing the N2H4 concentration from 25 to 100 mM results in an approximately 2.5-fold increase in current density for AWC–Cu–N, and about a threefold increase for AWC–Co–N, demonstrating the higher electrocatalytic sensitivity of the Co-doped catalyst. Furthermore, the log(j) vs log(C) plots exhibit good linearity, with reaction orders of 0.47, 0.57, and 0.70 for AWC, AWC–Cu–N, and AWC–Co–N, respectively. The fractional reaction orders indicate that the HzOR does not follow ideal first-order kinetics, suggesting that both mass transport and surface kinetics influence the overall reaction rate. This interpretation is consistent with the scan rate analysis, where a quasi-linear dependence of current density on the square root of scan rate (R2 ≈ 0.92–0.95) was observed. Together, these results confirm that the hydrazine oxidation reaction proceeds under a mixed control regime, with a significant contribution from diffusion, particularly for the less active AWC catalyst, while enhanced surface kinetics are observed for AWC–Co–N.
Overall, the combined analysis of scan rate and concentration effects indicates that the HzOR follows a mixed control mechanism, where diffusion plays a significant role, however, the catalytic activity follows the order AWC–Co–N > AWC–Cu–N > AWC, highlighting that cobalt incorporation most effectively enhances the electron-transfer rate and active-site density toward N2H4 oxidation in alkaline medium.
3.3. Fuel Cell Test
After evaluating the electrocatalytic activity of the synthesized materials toward N2H4 oxidation under half-cell conditions, the catalysts were further tested in a full direct N2H4–H2O2 fuel cell to assess their practical performance. These experiments allowed correlation between the intrinsic HzOR activity and the overall fuel-cell efficiency. Figure 10 shows the polarization and corresponding power-density curves of the direct N2H4–H2O2 fuel cell operating at 25–55 °C, in which AWC (a), AWC–Co–N (b), and AWC–Cu–N (c) catalysts were employed as both anode and cathode materials.
The anolyte consisted of 1 M N2H4 + 1 M KOH, while the catholyte comprised 5 M H2O2 + 1.5 M HCl. Clear differences in electrochemical performance were observed among the three catalysts. The undoped AWC electrode exhibited the lowest activity, showing a gradual voltage drop with increasing current density and a modest maximum power density of about 3.0 mW cm–2 (Figure 10a). The best performance was obtained with AWC–Co–N, which delivered substantially higher current densities and reached a maximum power density of 30.4 mW cm–2 at 25 °C (Figure 10b). The superior behavior of the AWC–Co–N catalyst can be attributed to the presence of highly active Co–N–C sites, which enhance both N2H4 oxidation at the anode and H2O2 reduction at the cathode. Moreover, cobalt incorporation improves electrical conductivity and increases the density of electrochemically accessible active sites, leading to more efficient charge transfer and reaction kinetics throughout the fuel cell. Overall, the polarization and power-density results clearly demonstrate that the electrocatalytic activity follows the order AWC–Co–N > AWC–Cu–N > AWC, confirming that cobalt doping substantially enhances the performance of the direct N2H4–H2O2 fuel cell under ambient conditions.
The provided Table 2 compares various catalyst systems and their performance in direct hydrazine-based fuel cells, with a specific emphasis on their maximum power densities (Pmax), operating temperatures, and electrolyte conditions.
Notably, the performance increase at 55 °C suggests favorable temperature-dependent catalytic activity, positioning AWC–Co–N as a competitive non-noble metal catalyst for low-temperature applications. Overall, this comparison confirms that both developed catalysts demonstrate performance consistent with literature trends, with AWC–Co–N showing particularly promising results for further development in direct hydrazine fuel cell applications.
4. Conclusions
This study demonstrates the development of sustainable electrocatalysts for clean energy by modifying biomass-derived activated carbon with nitrogen and transition metals. Doping of activated carbon with Co and Cu simultaneously with nitrogen strongly influences both structural characteristics and electrocatalytic performance of resulted catalysts toward HzOR. Although the pristine AWC possesses the highest BET surface area of 2722 m2 g–1, its catalytic activity is limited due to the absence of metal-based active sites. Cobalt doping results in the formation of finer, more uniformly dispersed nanoparticles on the AWC, generating abundant Co–N–C coordination sites that enhance hydrazine adsorption and electron transfer. In contrast, copper forms larger, more crystalline aggregates with a higher degree of aggregation, exhibiting an improved catalytic behaviour for HzOR, though to a lesser extent than cobalt. Electrochemical studies consistently showed that AWC–Co–N exhibits the highest HzOR activity, followed by AWC–Cu–N, and AWC. The dependence of current density on scan rate and hydrazine concentration confirmed predominantly diffusion-controlled kinetics for all materials, with cobalt-doped carbon displaying the strongest catalytic response. Full fuel-cell tests further validated the superior performance of AWC–Co–N, which delivered the highest maximum power density and the most efficient charge-transport behavior.
Overall, the results indicate that cobalt is the most effective dopant for enhancing the intrinsic activity and practical fuel-cell performance of nitrogen-doped activated carbon, making AWC–Co–N a promising, low-cost candidate for replacing noble metal systems in direct hydrazine-hydrogen peroxide fuel cells and other sustainable, carbon-free energy conversion technologies.
Supplementary Materials
The following supporting information can be downloaded at: https://www.mdpi.com/article/doi/s1, Table S1: Surface elemental composition of AWC-based carbon samples under study using XPS; Table S2: Peak assignment of C 1s, N 1s, O 1s, and Co 2p of AWC, AWC–N [35], AWC–Cu–N, and AWC–Co–N.
Author Contributions
Conceptualization, L.T.-T., A.V. and A.B.; methodology, V.U., A.P. and G.S.; validation, V.U., G.S., D.U. and A.P.; formal analysis, A.B. and A.V.; investigation, V.U., G.S., D.U. and A.P.; resources, L.T.-T.; data curation, E.N., A.B. and A.P.; writing—original draft preparation, L.T.-T., A.B., D.U. and A.V.; writing—review and editing, E.N.; visualization, V.U., G.S., D.U. and A.P.; supervision, L.T.-T.; project administration, L.T.-T. and A.B.; funding acquisition, L.T.-T. and A.B. All authors have read and agreed to the published version of the manuscript.
Funding
This research was funded by a grant (No. P-MIP-23-467) from the Research Council of Lithuania.
Institutional Review Board Statement
Not applicable.
Informed Consent Statement
Not applicable.
Data Availability Statement
Data are contained within the article.
Acknowledgments
During the preparation of this manuscript, the authors used DI for the purposes of creating graphical abstract.
Conflicts of Interest
The authors declare no conflicts of interest.
References
- Serov, A.; Kwak, C. Direct hydrazine fuel cells: A review. Appl. Catal. B Environ. 2010, 98, 1–9. [Google Scholar] [CrossRef]
- Ong, B.C.; Kamarudin, S.K.; Basri, S. Direct liquid fuel cells: a review. Int. J. Hydrog. Energy 2017, 42, 142–157. [Google Scholar] [CrossRef]
- Tamašauskaitė-Tamašiūnaitė, L.; Šimkūnaitė, D.; Nacys, A.; Balčiūnaitė, A.; Zabielaitė, A.; Norkus, E. Direct hydrazine fuel cells (DHFCs) in Direct Liquid Fuel Cells. Akay, Ramiz Gültekin, Yurtcan, Ayşe Bayrakçeken, Eds.; ACADEMIC PRESS: London, UK, 2021; pp. 233–248. [Google Scholar] [CrossRef]
- Burshtein, T.Y.; Yasman, Y.; Muñoz-Moene, L.; Zagal, J.H.; Eisenberg, D. Hydrazine oxidation electrocatalysis. ACS Catal. 2024, 14, 2264–2283. [Google Scholar] [CrossRef]
- Asazawa, K.; Yamada, K.; Tanaka, H.; Oka, A.; Taniguchi; M. Kobayashi, T. A platinum-free zero-carbon-emission easy fuelling direct hydrazine fuel cell for vehicles. Angew. Chem. Int. Ed. 2007, 46, 8024–8027. [Google Scholar] [CrossRef]
- Soloveichik, G.L. Liquid fuel cells. Beilstein J. Nanotechnol. 2014, 5, 1399–1418. [Google Scholar] [CrossRef] [PubMed]
- Lao, S.J.; Qin, H.Y.; Ye, L.Q.; Liu, B.H.; Li, Z.P. A development of direct hydrazine/hydrogen peroxide fuel cell. J. Power Sources 2010, 195(13), 4135–4138. [Google Scholar] [CrossRef]
- Abdolmaleki, M.; Ahadzadeh, I.; Goudarziafshar, H. Direct hydrazine-hydrogen peroxide fuel cell using carbon supported Co@Au core-shell nanocatalyst. Int. J. Hydrog. Energy 2017, 42, 15623–15631. [Google Scholar] [CrossRef]
- Hosseini, M.G.; Mahmoodi, R.; Abdolmaleki, M. High performance direct hydrazine–hydrogen peroxide fuel cell using reduced graphene oxide supported Ni@M (M = Pt, Pd, Ru) nanoparticles as novel anodic electrocatalysts. New J. Chem. 2018, 42, 12222–12233. [Google Scholar] [CrossRef]
- Hosseini, M.G.; Daneshvari-Esfahlan, V.; Aghajani, H.; Wolf, S.; Hacker, V. Palladium-nickel electrocatalysts on nitrogen-doped reduced graphene oxide nanosheets for direct hydrazine/hydrogen peroxide fuel cells. Catalysts 2021, 11, 1372. [Google Scholar] [CrossRef]
- Liu, Q.; Han, J.; Yang, Y.; Chen, Z.; Wu, H. Optimizing hydrazine activation on dual-site Co-Zn catalysts for direct hydrazine-hydrogen peroxide fuel cells. Interdiscip. Mater. 2025, 4, 300–308. [Google Scholar] [CrossRef]
- Mohammadi, T.; Asadpour-Zeynali, K.; Majidi, M.R.; Hosseini, M.G. Improvement of the performance of hydrazine fuel cells without immobilization of ink catalysts on the membrane: a new electrocatalyst of mixed metal oxides as cathode and nickel foam-based Ni–Co nanoparticles as anode. J. Appl. Electrochem. 2024, 54, 1239–1252. [Google Scholar] [CrossRef]
- Pakdehi, S.G.; Salimi, M.; Rasoolzadeh, M. A Review on decomposition of hydrazine and its kinetics as a novel approach for CO-free H2 production. Researches Appl. Mech. Eng. (RAME) 2014, 3, 21. [Google Scholar]
- Rosca, V.; Koper, M.T.M. Electrocatalytic oxidation of hydrazine on platinum electrodes in alkaline solutions. Electrochim. Acta 2008, 53, 5199–5205. [Google Scholar] [CrossRef]
- Finkelstein, D.A.; Imbeault, R.; Garbarino, S.; Roue, L.; Guay, D. Trends in catalysis and catalyst cost effectiveness for N2H4 fuel cells and sensors: a rotating disk electrode (RDE) study. J. Phys. Chem. C 2016, 120, 4717–4738. [Google Scholar] [CrossRef]
- Palaniyandy, N.; Govindarajan, D.; Devaraj, L.; Khezri, R.; Chinnakutti, K.; Kempahanumakkagari, S.; Thippeswamy, R.; Amer, M.S.; Arunachalam, P.; Al-Mayouf, A.M.; Kheawhom, S. An overview of recent advances in Pt and Pd-based materials: From design strategies to reaction mechanisms. J. Ind. Eng. Chem. 2025, 146, 213–237. [Google Scholar] [CrossRef]
- Crisafulli, R.; Silva de Barros, V.V.; Rodrigues de Oliveira, F.E.; de Araújo Rocha, T.; Zignani, S.; Spadaro, L.; Palella, A.; Dias, J.A.; Linares, J.J. On the promotional effect of Cu on Pt for hydrazine electrooxidation in alkaline medium. Appl. Catal. B Environ. 2018, 236, 36–44. [Google Scholar] [CrossRef]
- Zhang, X.; Shi, S.; Yin, H.-M. CuPd alloy oxide nanobelts as a promising electrocatalyst towards hydrazine oxidation reaction. ChemElectroChem 2019, 6, 1514. [Google Scholar] [CrossRef]
- Hosseini, M.; Daneshvari-Esfahlan, V.; Wolf, S.; Hacker, V. Cobalt-modified palladium nanocatalyst on nitrogen-doped reduced graphene oxide for direct hydrazine fuel cell. RSC Adv. 2021, 11, 39223–39232. [Google Scholar] [CrossRef]
- Asazawa, K.; Yamada, K.; Tanaka, H.; Taniguchi, M.; Oguro, K. Electrochemical oxidation of hydrazine and its derivatives on the surface of metal electrodes in alkaline media. J. Power Sources 2009, 191, 362–365. [Google Scholar] [CrossRef]
- Karim-Nezhad, G.; Jafarloo, R.; Dorraji, P.S. Copper (hydr)oxide modified copper electrode for electrocatalytic oxidation of hydrazine in alkaline media. Electrochim. Acta 2009, 54, 5721–5726. [Google Scholar] [CrossRef]
- Chen, S.; Wang, C.; Liu, S.; Huang, M.; Lu, J.; Xu, P.; Tong, H.; Hu, L.; Chen, Q. Boosting hydrazine oxidation reaction on CoP/Co Mott-Schottky electrocatalyst through engineering active sites. J. Phys. Chem. Lett. 2021, 12(20), 4769–5044. [Google Scholar] [CrossRef]
- Zhao, Y.; Sun, Y.; Li, H.; Zeng, S.; Li, R.; Yao, Q.; Chen, H.; Zheng, Y.; Qu, K. Highly enhanced hydrazine oxidation on bifunctional Ni tailored by alloying for energy-efficient hydrogen production. J. Colloid Interf. Sci. 2023, 652(Part B), 1848–1856. [Google Scholar] [CrossRef] [PubMed]
- Vorms, E.A.; Papaefthymiou, V.; Faverge, T.; Bonnefont, A.; Chatenet, M.; Savinova, E.R.; Oshchepkov, A.G. Mechanism of the hydrazine hydrate electrooxidation reaction on metallic Ni electrodes in alkaline media as revealed by electrochemical methods, online DEMS and ex situ XPS. Electrochim. Acta 2024, 507, 145056. [Google Scholar] [CrossRef]
- Tang, P.A.P.; Wen, H.; Wang, P. Hierarchically nanostructured Ni2Fe2N as an efficient electrocatalyst for hydrazine oxidation reaction. Chem. Eng. J. 2022, 431, 134123. [Google Scholar] [CrossRef]
- Askari, M.B.; Salarizadeh, P.; Beitollahi, H.; Tajik, S.; Eshghi, A.; Azizi, S. Electro-oxidation of hydrazine on NiFe2O4-rGO as a high-performance nano-electrocatalyst in alkaline media. Mater. Chem. Phys. 2022, 275, 125313. [Google Scholar] [CrossRef]
- Feng, G.; Kuang, Y.; Li, P.; Han, N.; Sun, M.; Zhang, G.; Sun, X. Single crystalline ultrathin nickel–cobalt alloy nanosheets array for direct hydrazine fuel cells. Adv. Sci. 2017, 4, 1600179. [Google Scholar] [CrossRef]
- Wang, G.; Chen, J.; Cai, P.; Jia, J.; Wen, Z. A self-supported Ni–Co perselenide nanorod array as a high-activity bifunctional electrode for a hydrogen-producing hydrazine fuel cell. J. Mater. Chem. A 2018, 6, 17763–17770. [Google Scholar] [CrossRef]
- Park, J.; Bae, S.; Park, J.-S.; Bong, S.; Lee, J. Crusty-structured Cu@NiCo nanoparticles as anode catalysts in alkaline fuel cells. ACS Appl. Nano Mater. 2021, 4, 8145−8153. [Google Scholar] [CrossRef]
- Zabielaitė, A.; Balčiūnaitė, A.; Šimkūnaitė, D.; Vaičiūnienė, J.; Selskis, A.; Naruškevičius, L.; Tamašauskaitė-Tamašiūnaitė, L.; Norkus, E. Investigation of borohydride and hydrazine oxidation on gold nanoparticles modified zinc-cobalt coating. Chemija 2019, 30(3), 136–145. [Google Scholar] [CrossRef]
- Mayoral, E.P.; Ojer, M.G.; Ventura, M.; Matos, I. New Insights into N-doped porous carbons as both heterogeneous catalysts and catalyst supports: Opportunities for the catalytic synthesis of valuable compounds. Nanomaterials 2023, 13(13), 2013. [Google Scholar] [CrossRef]
- Wu, H.; Zhao, Q.; Jiang, S.; Liu, W.; Xiao, H.; Wu, W. Research advances in doped carbon electrocatalysts derived from biomass. Chem. Eng. J. 2025, 505, 159694. [Google Scholar] [CrossRef]
- Pereira, G.M.; Cellet, T.S.P.; Winkler, M.E.G.; Rubira, A.F.; Silva, R. Printing specific active sites for ORR and hydrazine oxidation on N-doped carbon. Mat. Chem. Phys. 2023, 307, 128102. [Google Scholar] [CrossRef]
- Bedin, K.C.; Cazetta, A.L.; Souza, I.P.A.F.; Spessato, L.; Zhang, T.; Araújo, R.A.; Silva, R.; Asefa, T.; Almeida, V.C. N-doped spherical activated carbon from dye adsorption: Bifunctional electrocatalyst for hydrazine oxidation and oxygen reduction. J. Environ. Chem. Eng. 2022, 10, 107458. [Google Scholar] [CrossRef]
- Ulevičienė, V.; Balčiūnaitė, A.; Upskuvienė, D.; Plavniece, A.; Volperts, A.; Dobele, G.; Zhurinsh, A.; Niaura, G.; Tamašauskaitė-Tamašiūnaitė, L.; Norkus, E. Synthesis of nitrogen-doped biomass-based activated carbon supported nickel nanoparticles for hydrazine oxidation. Catalysts 2025, 15(4), 400. [Google Scholar] [CrossRef]
- Taghaddosi, S.; Rezaee, S.; Shahrokhian, S. Facile synthesis of N-doped hollow carbon nanospheres wrapped with transition metal oxides nanostructures as non-precious catalysts for the electro-oxidation of hydrazine. J. Electroanal. Chem. 2020, 873, 114437. [Google Scholar] [CrossRef]
- Wang, H.; Dong, Q.; Lei, L.; Ji, S.; Kannan, P.; Subramanian, P.; Yadav, A.P. Co nanoparticle-encapsulated nitrogen-doped carbon nanotubes as an efficient and robust catalyst for electro-oxidation of hydrazine. Nanomaterials 2021, 11(11), 2857. [Google Scholar] [CrossRef]
- Guo, R.; Zhang, Y.; Zhang, X.; Ma, M.; Hu, T. Enhanced catalytic oxidation of hydrazine of CoO/Co3O4 heterojunction on N-doped carbon. Electrochim. Acta 2023, 458, 142537. [Google Scholar] [CrossRef]
- Dong, Q.; Wang, H.; Liu, Q.; Ji, S.; Zhang, Y.; Tang, C.; Wang, X.; Wang, R. Simplifying the creation of iron compound inserted, nitrogen-doped carbon nanotubes and its catalytic application. J. Alloys Compd. 2021, 857, 157543. [Google Scholar] [CrossRef]
- Dong, Q.; Li, Y.; Ji, S.; Wang, H.; Kan, Z.; Linkov, V.; Wang, R. Directional manipulation of electron transfer in copper/nitrogen doped carbon by Schottky barrier for efficient anodic hydrazine oxidation and cathodic oxygen reduction. J. Colloid Interf. Sci. 2023, 652(Part A), 57–68. [Google Scholar] [CrossRef]
- Vjūnova, K.; Amber, H.; Šimkūnaitė, D.; Mockus, Z.; Volperts, A.; Plavniece, A.; Dobele, G.; Zhurinsh, A.; Tamašauskaitė-Tamašiūnaitė, L.; Norkus, E. Manganese–iron-supported biomass-derived carbon catalyst for efficient hydrazine oxidation. Molecules 2026, 31, 354. [Google Scholar] [CrossRef] [PubMed]
- Baccile, N.; Laurent, G.; Babonneau, F.; Fayon, F.; Titirici, M.M.; Antonietti, M. Structural characterization of hydrothermal carbon spheres by advanced solid-state MAS 13C NMR investigations. J. Phys. Chem. C 2009, 113, 9644–9654. [Google Scholar] [CrossRef]
- Xue, Y.; Gao, B.; Yao, Y.; Inyang, M.; Zhang, M.; Zimmerman, A.R.; Ro, K.S. Hydrogen peroxide modification enhances the ability of biochar (hydrochar) produced from hydrothermal carbonization of peanut hull to remove aqueous heavy metals: Batch and column tests. Chem. Eng. J. 2012, 200–202, 673–680. [Google Scholar] [CrossRef]
- Zeng, L.; Cui, X.; Shi, J. Engineering crystalline CoOOH anchored on an N-doped carbon support as a durable electrocatalyst for the oxygen reduction reaction. Dalt. Trans. 2018, 47, 6069–6074. [Google Scholar] [CrossRef]
- Biesinger, M.C. Advanced analysis of copper X-ray photoelectron spectra. Surf. Interface Anal. 2017, 49, 1325–1334. [Google Scholar] [CrossRef]
- Biesinger, M.C.; Payne, B.P.; Grosvenor, A.P.; Lau, L.W.M.; Gerson, A.R.; Smart, R.S.C. Resolving surface chemical states in XPS analysis of first row transition metals, oxides and hydroxides: Cr, Mn, Fe, Co and Ni. Appl. Surf. Sci. 2011, 257, 2717–2730. [Google Scholar] [CrossRef]
Figure 1.
SEM images of AWC (a–a′′), AWC–Co–N (b–b′′), and AWC–Cu–N (c–c′′) catalysts at different magnifications.
Figure 1.
SEM images of AWC (a–a′′), AWC–Co–N (b–b′′), and AWC–Cu–N (c–c′′) catalysts at different magnifications.
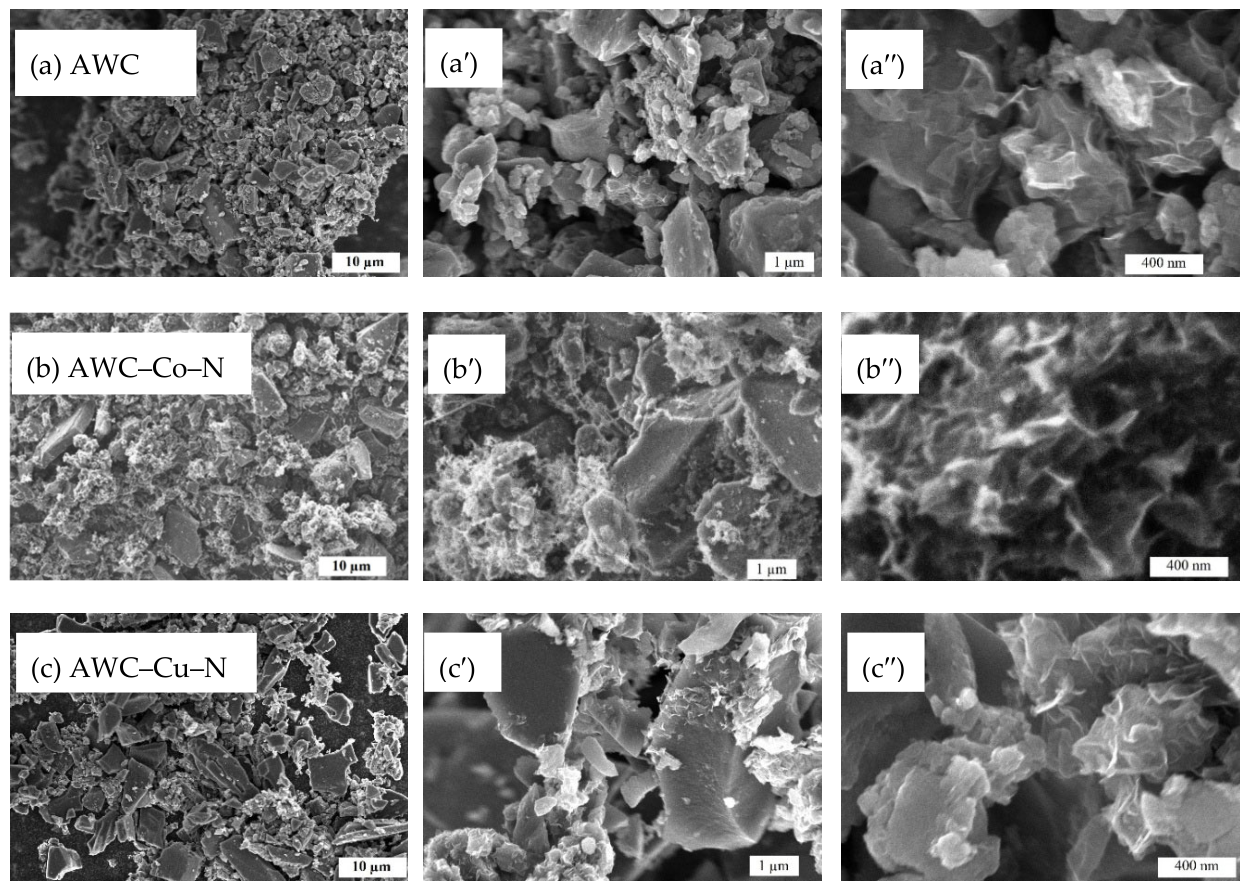
Figure 2.
The EDX spectra of AWC–Co–N (a) and AWC–Cu–N (b) catalysts.
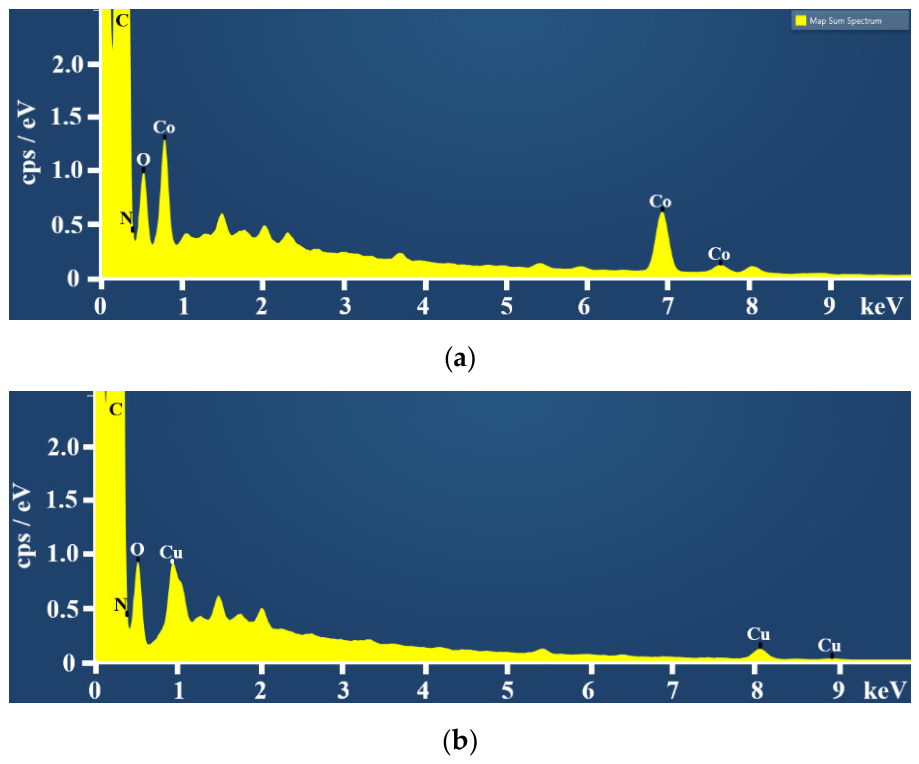
Figure 3.
Adsorption-desorption isotherms of nitrogen recorded at 77 K (a) and the corresponding pore size distributions obtained via density functional theory (DFT) analysis (b) for the investigated AWC-based samples.
Figure 3.
Adsorption-desorption isotherms of nitrogen recorded at 77 K (a) and the corresponding pore size distributions obtained via density functional theory (DFT) analysis (b) for the investigated AWC-based samples.
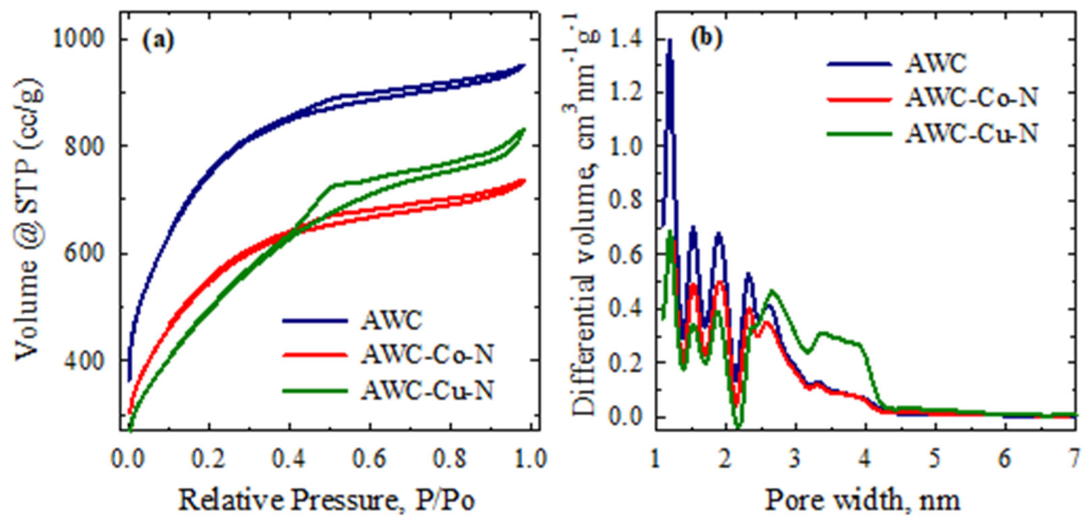
Figure 4.
XRD patterns of AWC (a), AWC–Cu–N (b), and AWC–Co–N (c). Peak positions are indicated according to Crystallography Open Database (COD) data cards: C—2101499 (a); Cu—9013015 (b); Co—9008466 (c).
Figure 4.
XRD patterns of AWC (a), AWC–Cu–N (b), and AWC–Co–N (c). Peak positions are indicated according to Crystallography Open Database (COD) data cards: C—2101499 (a); Cu—9013015 (b); Co—9008466 (c).
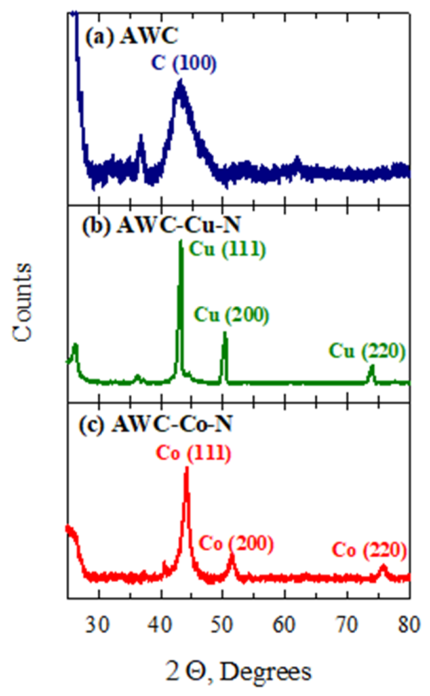
Figure 5.
The XPS survey spectra (a) and high-resolution XPS spectra of C 1s (b) and O 1s (c) for AWC, AWC–Cu–N, and AWC–Co–N, N 1s (d) for AWC–Cu–N and AWC–Co–N, Cu 2p (e) for AWC–Cu–N, and Co 2p (f) for AWC–Co–N.
Figure 5.
The XPS survey spectra (a) and high-resolution XPS spectra of C 1s (b) and O 1s (c) for AWC, AWC–Cu–N, and AWC–Co–N, N 1s (d) for AWC–Cu–N and AWC–Co–N, Cu 2p (e) for AWC–Cu–N, and Co 2p (f) for AWC–Co–N.
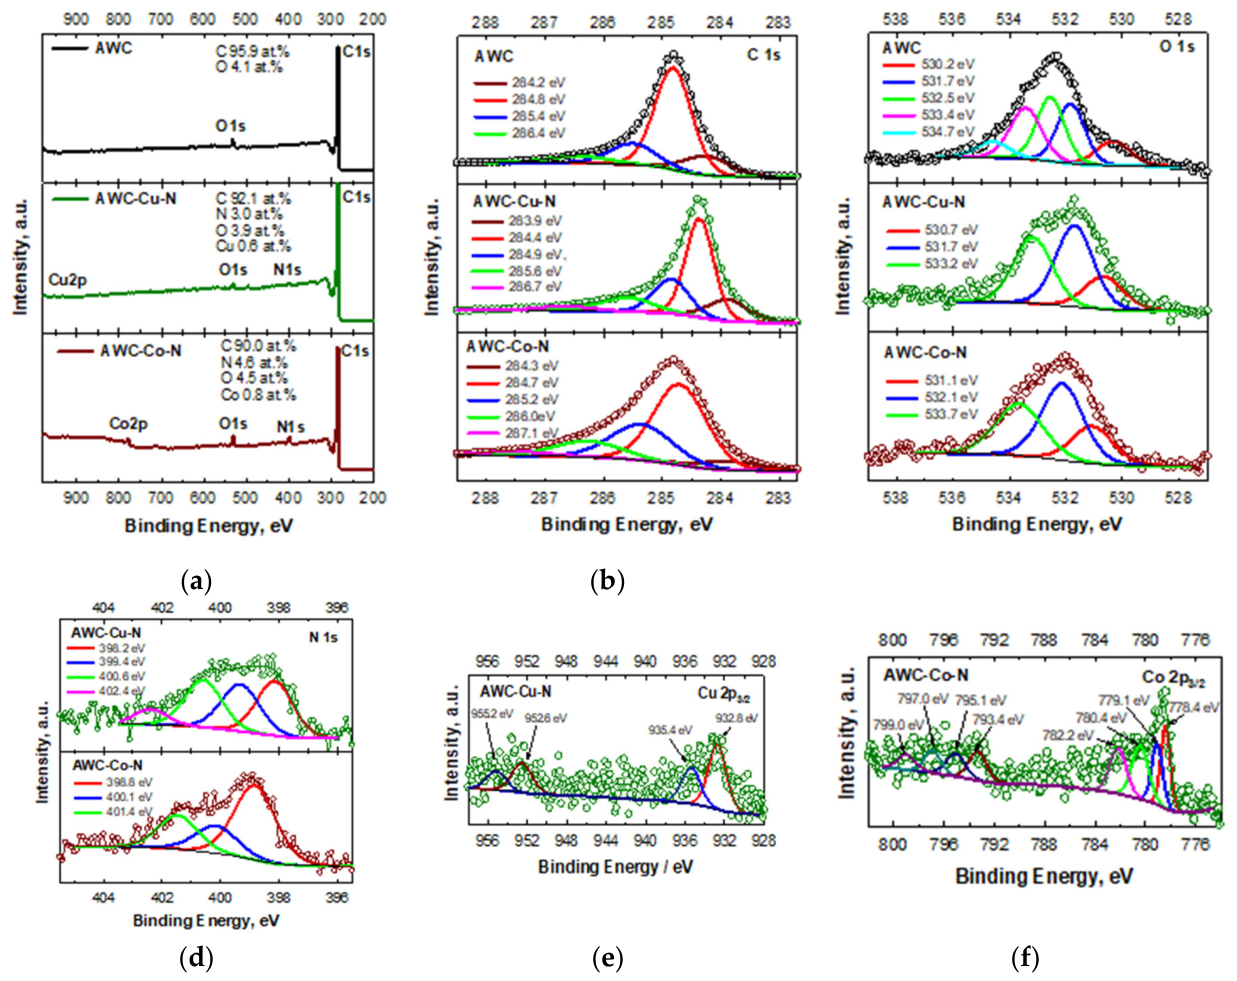
Figure 6.
CVs of AWC (a), AWC–Co–N (b), and AWC–Cu–N (c) catalysts recorded in 1 M KOH and 0.05 M N2H4 + 1 M KOH at 50 mV s–1, T = 25 °C. (d) represents the corresponding LSVs and LSV for AWC–N [35].
Figure 6.
CVs of AWC (a), AWC–Co–N (b), and AWC–Cu–N (c) catalysts recorded in 1 M KOH and 0.05 M N2H4 + 1 M KOH at 50 mV s–1, T = 25 °C. (d) represents the corresponding LSVs and LSV for AWC–N [35].
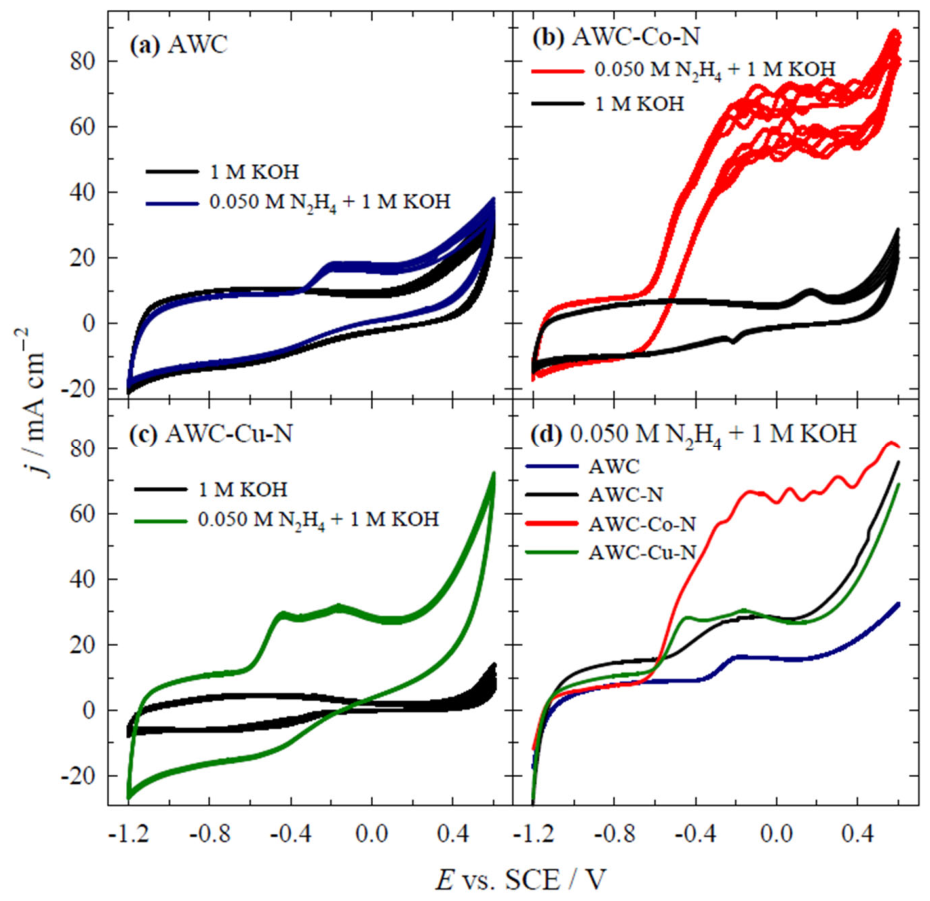
Figure 7.
LSVs of AWC, AWC–N [35], AWC–Co–N, and AWC–Cu–N catalysts recorded in 0.05 M N2H4 + 1 M KOH at 50 mV s–1, T = 25 °C.
Figure 7.
LSVs of AWC, AWC–N [35], AWC–Co–N, and AWC–Cu–N catalysts recorded in 0.05 M N2H4 + 1 M KOH at 50 mV s–1, T = 25 °C.
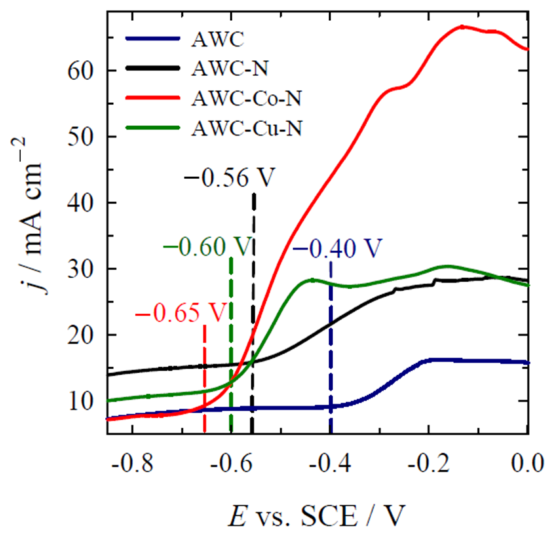
Figure 8.
CVs of AWC (a), AWC–Co–N (b) and AWC–Cu–N (c) catalysts recorded in 0.05 M N2H4 + 1 M KOH at different scan rates 10–50 mV s–1, T = 25 °C.
Figure 8.
CVs of AWC (a), AWC–Co–N (b) and AWC–Cu–N (c) catalysts recorded in 0.05 M N2H4 + 1 M KOH at different scan rates 10–50 mV s–1, T = 25 °C.
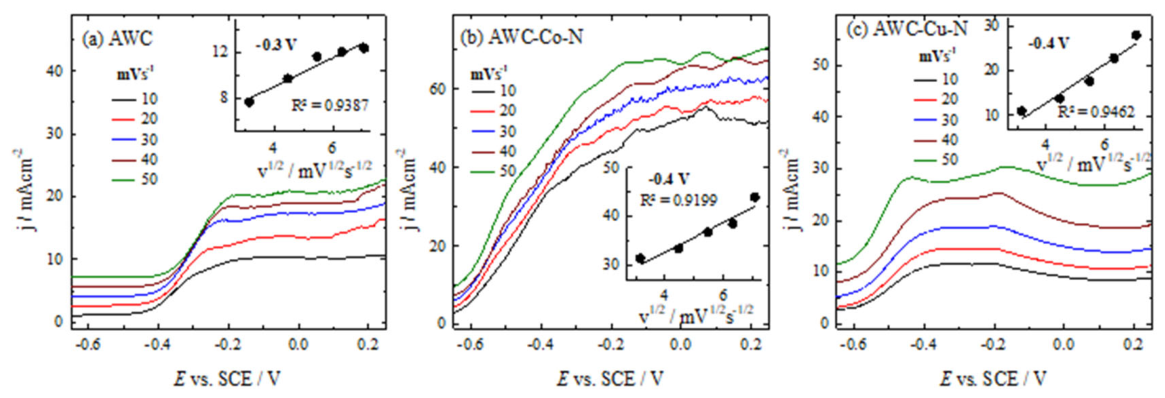
Figure 9.
LSVs of AWC (a), AWC–Co–N (b) and AWC–Cu–N (c) catalysts recorded in 0.025–0.10 M N2H4 + 1 M KOH at 50 mV s-1, T = 25 °C.
Figure 9.
LSVs of AWC (a), AWC–Co–N (b) and AWC–Cu–N (c) catalysts recorded in 0.025–0.10 M N2H4 + 1 M KOH at 50 mV s-1, T = 25 °C.
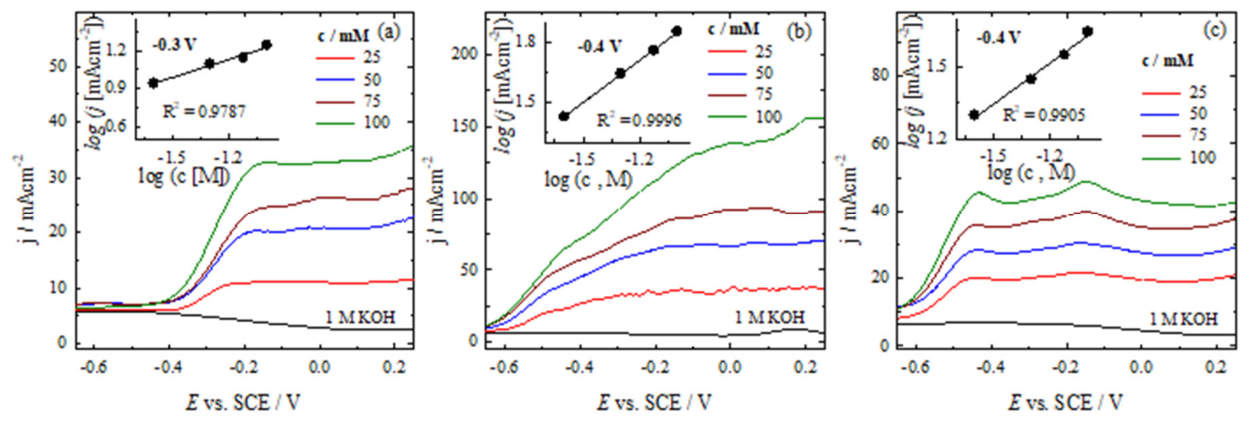
Figure 10.
Cell polarization and power density curves for the direct N2H4–H2O2 fuel cell using AWC–N, AWC–Co–N and AWC–Cu–N catalysts as the anodes/cathodes with anolyte consisting of 1 M N2H4 and 1 M KOH and 5 M H2O2 and 1.5 M HCl catholyte at 25 °C.
Figure 10.
Cell polarization and power density curves for the direct N2H4–H2O2 fuel cell using AWC–N, AWC–Co–N and AWC–Cu–N catalysts as the anodes/cathodes with anolyte consisting of 1 M N2H4 and 1 M KOH and 5 M H2O2 and 1.5 M HCl catholyte at 25 °C.
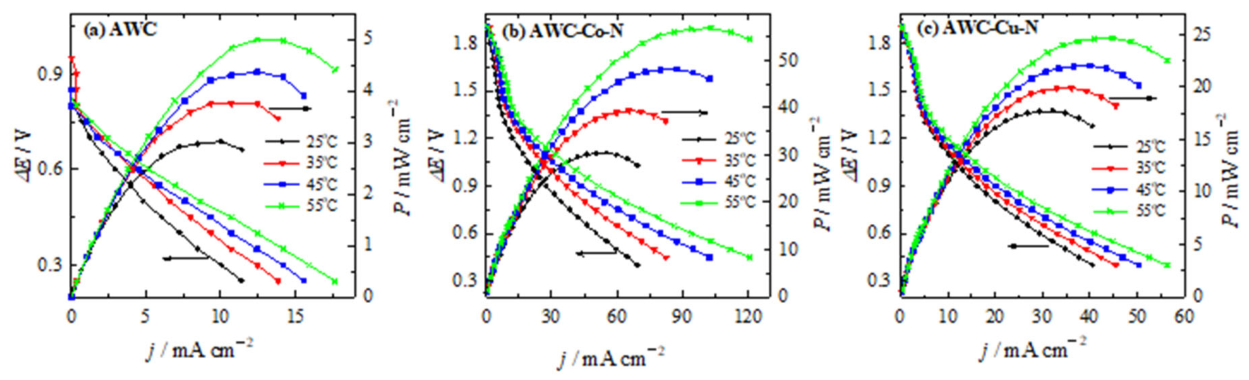

Table 1.
Porous structure parameters of AWC, AWC–Co–N, and AWC–Cu–N catalysts.
| Sample | Specific surface area, m2 g–1 | Pore volume, cm3 g–1 |
Average pore width, nm | Mesopores from Vt, % | ||||
| BET | DR | DFT | Vt (total) | micro | meso | |||
| AWC | 2722 | 2474 | 1799 | 1.5 | 0.9 | 0.6 | 2.2 | 40.2 |
| AWC–Co–N | 1991 | 1771 | 1374 | 1.1 | 0.6 | 0.5 | 2.3 | 44.7 |
| AWC–Cu–N | 1811 | 1570 | 1222 | 1.3 | 0.6 | 0.7 | 2.8 | 56.5 |
Table 2.
The comparison of N2H4–H2O2 performance using different electrocatalysts and anolytes-catholytes composition.
Table 2.
The comparison of N2H4–H2O2 performance using different electrocatalysts and anolytes-catholytes composition.
| Anode | Cathode | Anolyte | Catholyte | Pmax, mW cm–2 | T, (℃) | Ref. |
| AWC–Co–N | AWC–Co–N | 1 M N2H4 + 1 M KOH | 5 M H2O2 + 1.5 M HCl | 30.4 56.7 |
25 55 |
[This study] |
| AWC–Cu–N | AWC–Cu–N | 1 M N2H4 + 1 M KOH | 5 M H2O2 + 1.5 M HCl | 17.7 24.7 |
25 55 |
[This study] |
| AWC | AWC | 1 M N2H4 + 1 M KOH | 5 M H2O2 + 1.5 M HCl | 3.0 5.0 |
25 55 |
[This study] |
| AWC–N | AWC–N | 1 M N2H4 + 1 M KOH | 5 M H2O2 + 1.5 M HCl | 4.4 7.0 |
25 55 |
[35] |
| AWC–Ni–N | AWC–Ni–N | 1 M N2H4 + 1 M KOH | 5 M H2O2 + 1.5 M HCl | 10.8 31.1 |
25 55 |
[35] |
| Ni0.5Co0.5Se2 | Ni0.5Co0.5Se2 | 4.0 M KOH | 0.5 H2SO4 | 13.3 | 25 | [28] |
| Pt53Cu47/C (0.5 mg cm−2) |
Pt/C (20 wt.%) (1.0 mg cm−2) |
1.0 M N2H4 + 1.0 M KOH | O2 flow rate: 30 SCCM | 56.1 | 80 | [17] |
| Ni0.6Co0.4 nanosheets (1.4 mg cm−2) |
Pt/C (40.0 wt.%) |
20wt% M N2H4 + 4.0 M KOH | 20.0% H2O2 + 0.5 M H2SO4 | 107.1 | 80 | [27] |
| Cu@NiCo/C | Act-Fe-N-CN | 1 M N2H4 + 1 M KOH (40 mL min−1) | O2 flow rate: 1000 SCCM | 601 | 60 | [29] |
| (Cu0.9Pd0.1)O | JM-Pt/C with Pt loading of 0.5 mg cm–2 | 10% N2H4 +4 M KOH | 20wt% H2O2 + 0.5 M H2SO4 (9 mL min–1) | 330.5 | 80 | [18] |
| p-Co9Zn1/NF | Pt/C | 1 M N2H4 + 2 M KOH | 2 M H2O2 + 0.5 M H2SO4 | 195 | 80 | [11] |
| PdCo NPs/NrGO NSs (1.0 mg cm–2) | Pt/C (0.5 mg cm–2) | 1 M N2H4 + 2 M NaOH | 2 M H2O2 + 0.5 M H2SO4 | 148.58 | 60 | [19] |
| Ni–Pd/rGO (1.0 mg cm–2) |
Pt/C (0.5 mg cm–2) | 1 M N2H4 + 2 M NaOH | 2 M H2O2 + 0.5 M H2SO4 | 204.8 | 60 | [9] |
| Ni–Pd/NrGO (1.0 mg cm–2) |
Pt/C (0.5 mg cm–2) | 1 M N2H4 + 2 M NaOH | 2 M H2O2 + 0.5 M H2SO4 | 187.87 216.71 |
25 60 |
[10] |
Disclaimer/Publisher’s Note: The statements, opinions and data contained in all publications are solely those of the individual author(s) and contributor(s) and not of MDPI and/or the editor(s). MDPI and/or the editor(s) disclaim responsibility for any injury to people or property resulting from any ideas, methods, instructions or products referred to in the content. |
© 2026 by the authors. Licensee MDPI, Basel, Switzerland. This article is an open access article distributed under the terms and conditions of the Creative Commons Attribution (CC BY) license (http://creativecommons.org/licenses/by/4.0/).
Copyright: This open access article is published under a Creative Commons CC BY 4.0 license, which permit the free download, distribution, and reuse, provided that the author and preprint are cited in any reuse.