Preprint
Article

This version is not peer-reviewed.

Growth Years Drive Divergent Evolution of Volatile Compounds in Wild Ginseng: Marked by Concurrent Terpene Accumulation and Pyrazine Decline as Revealed by HS-GC-IMS

Submitted:

14 May 2026

Posted:

15 May 2026

You are already at the latest version

Abstract
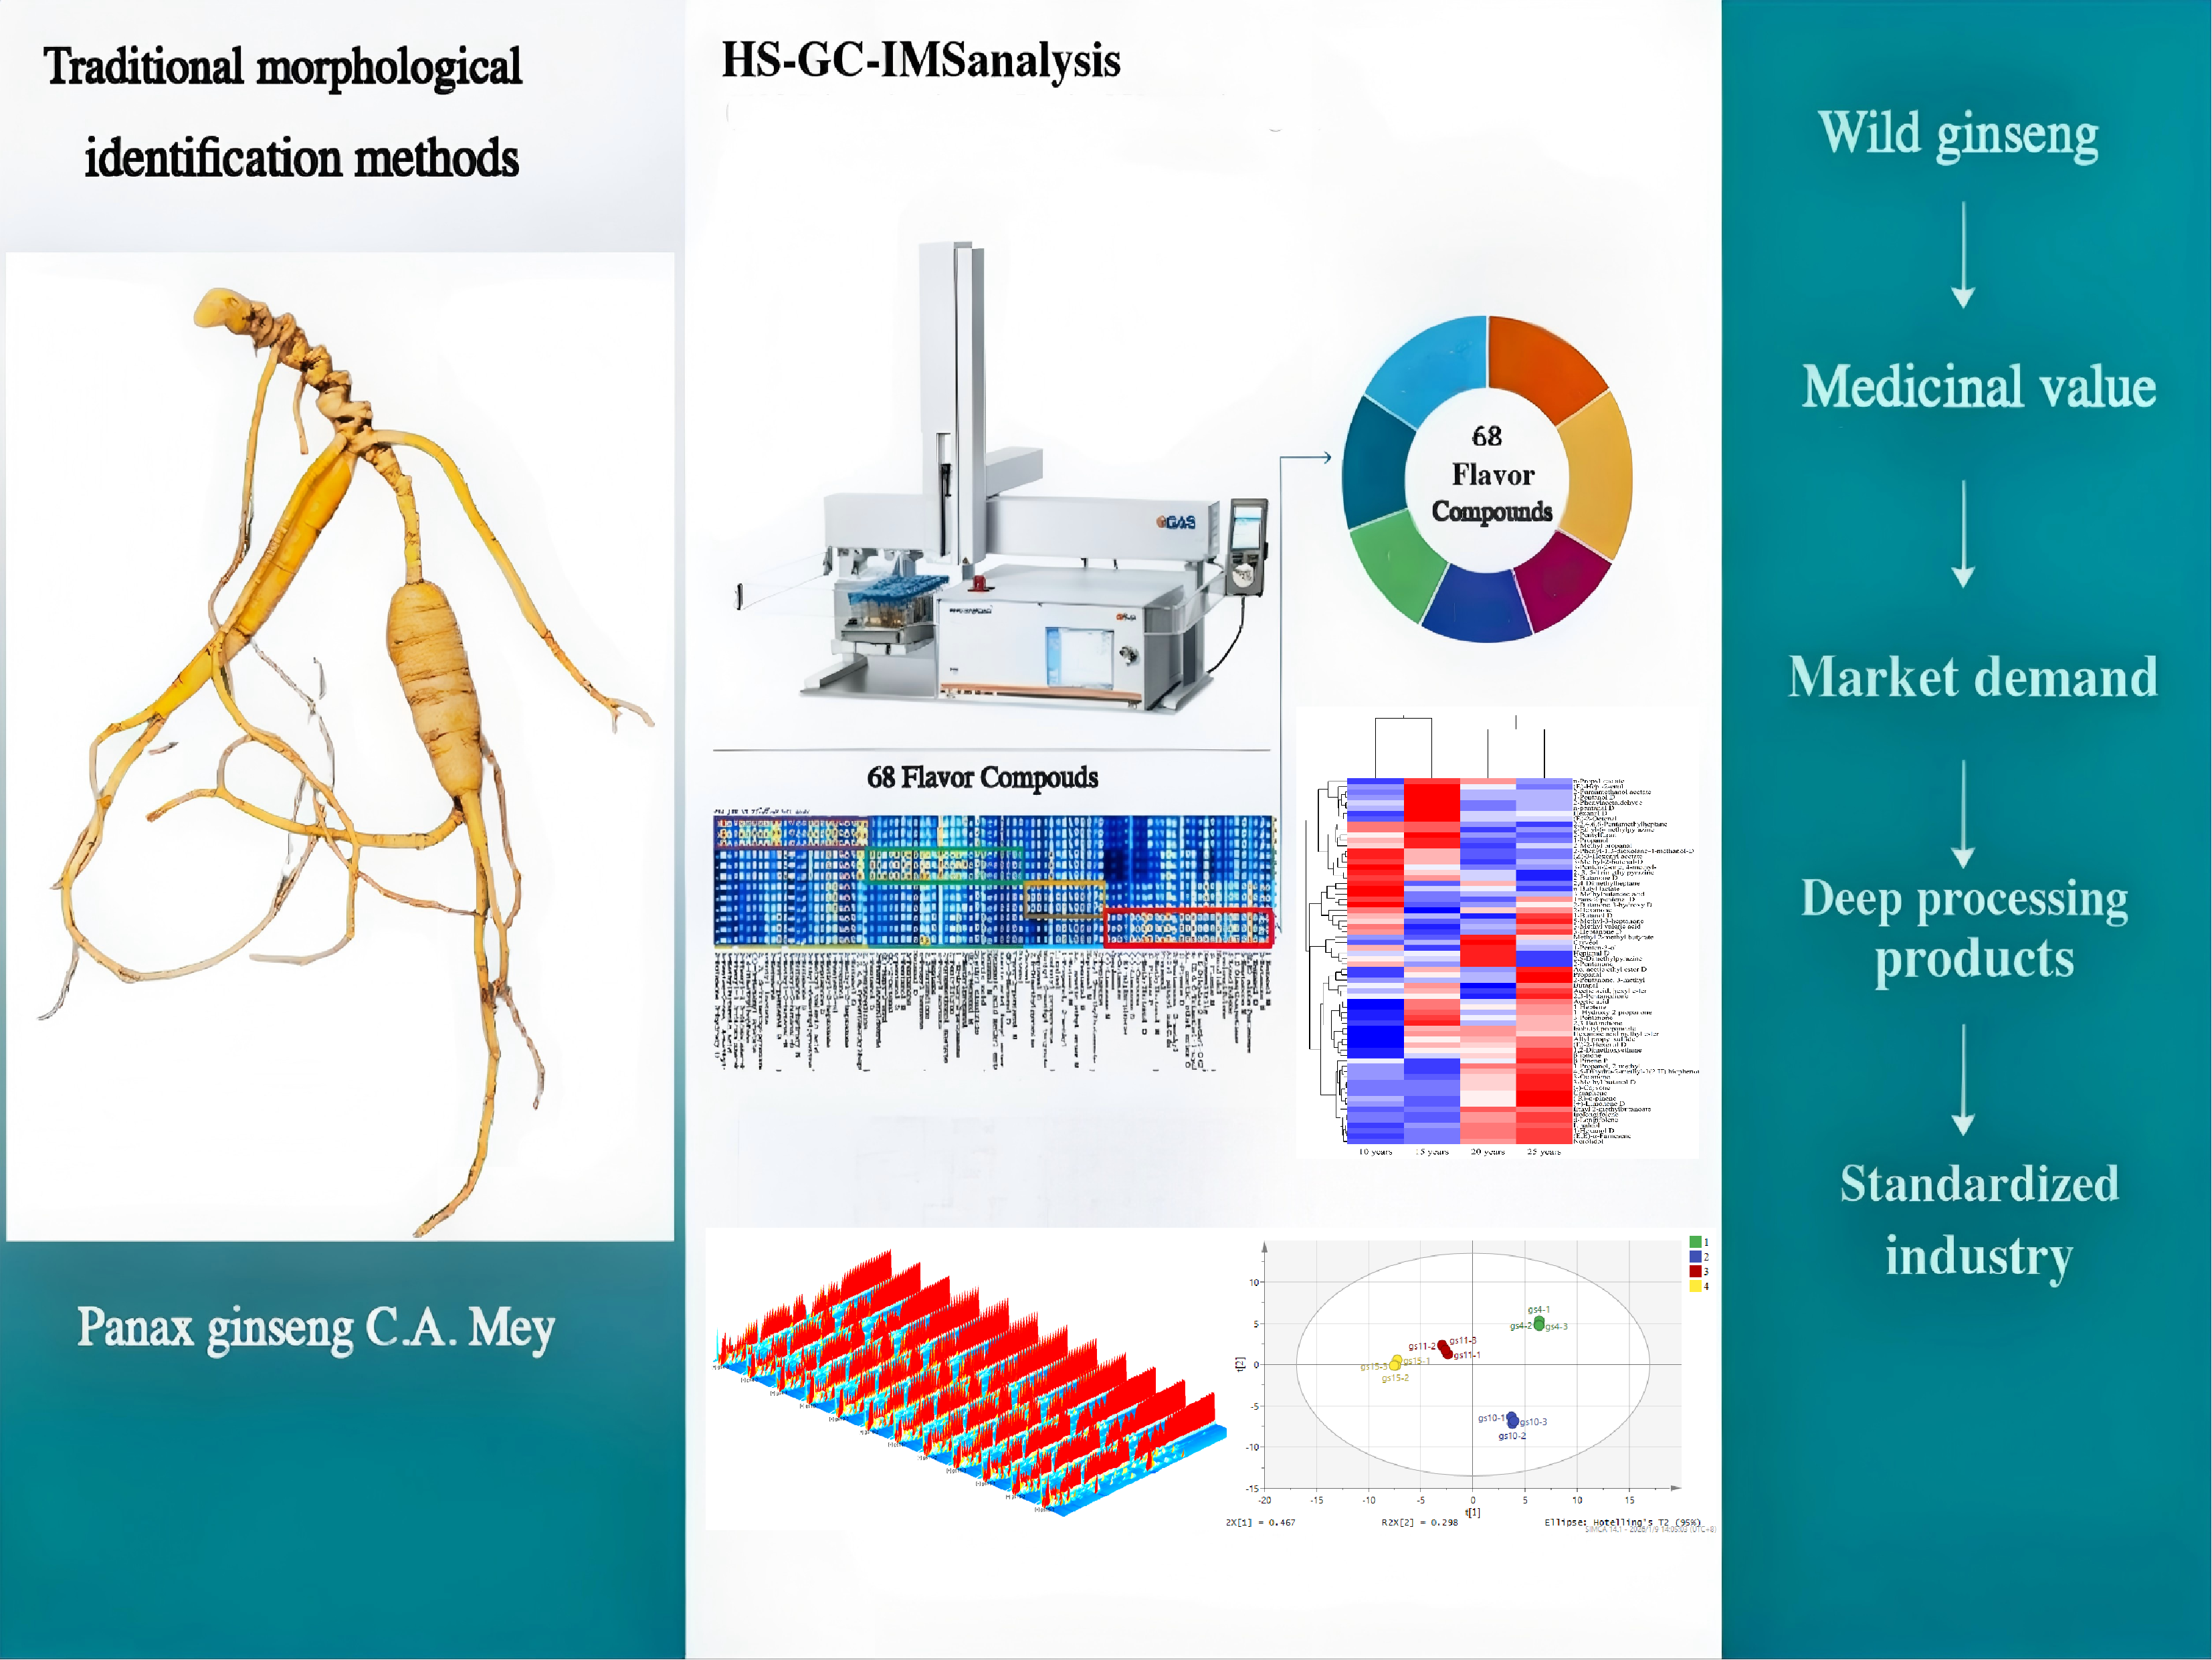
The volatile compounds(VOCs) evolution of wild ginseng (WG) across growth years is not a unidirectional process but a divergent remodeling of the chemical fingerprint. In this study, HS-GC-IMS combined with chemometrics was employed to characterize the dynamic changes of VOCs in WG at four growth stages(10, 15, 20, and 25 years; n≥15 per group). A total of 68 VOCs were tentatively identified and semi-quantified, encompassing terpenes, aldehydes, ketones, alcohols, esters, pyrazines, and other classes. Among them, terpenes and pyrazines exhibited the most pronounced directional trends, marking the divergent evolution: terpenes such as camphene, (E,E)-α-farnesene, and β-ionone accumulated progressively (increases of 242%, 74.6%, and 93.4% from 10 to 25 years, respectively), whereas pyrazines including 2,3,5-trimethylpyrazine and 2,5-dimethylpyrazine declined continuously (decreases of 58.2% and 53.3%, respectively). In contrast, the majority of compounds(66%) displayed non-monotonic patterns, including stage-specific metabolic peaks and environmentally driven fluctuations, underscoring the complexity of this divergent evolution. Partial least squares-discriminant analysis (PLS-DA) effectively distinguished samples across growth years (R²Y=0.997, Q²=0.993), with a 200-times permutation test confirming no overfitting(R²=0.136,Q² intercept=−0.505). Twenty-nine differential compounds with variable importance in projection (VIP)>1 were identified as potential chemical markers, and a multi-marker combinatorial system was tentatively established for discriminating three growth stages (10–15, 15–20, and 20–25 years). These findings provide chemical evidence that WG flavor quality evolves divergently over time, suggesting that VOCs fingerprint could serve as a supplementary tool for growth-year assessment, particularly for "high-quality but poor-shape" specimens that are undervalued by traditional morphology-based methods.
Keywords: 
;  ;  ;  ;  ;  ;  

1. Introduction

Ginseng (Panax ginseng C. A. Mey.), a perennial herb of the Araliaceae family, is renowned for its medicinal properties and derives its name from the human-like shape of its root [1]. As a traditional medicinal and edible homologous plant, it has a history of use spanning over four thousand years and holds a significant position in both traditional Chinese medicine and East Asian dietary culture. With the advancement of the modern food industry and the increasing demand for health-conscious consumption, ginseng has been classified as a new resource food, significantly expanding its application scope. It is not only directly processed into primary food products such as ginseng tea, ginseng slices, and ginseng powder but is also widely incorporated into composite foods like beverages, pastries, and condiments, thereby emerging as a distinctive ingredient that combines both nutritional value and flavor. Based on the growth environment and cultivation method, ginseng is categorized into wild-simulated ginseng, wild ginseng (WG), forest-cultivated ginseng, and garden-cultivated ginseng [2,3]. Its flavor and nutritional qualities are particularly outstanding. WG specifically refers to ginseng grown in a natural mountain forest environment for over 15 years following artificial seeding, exhibiting distinct wild-type characteristics[4]. It typically thrives in forests at altitudes ranging from 400 to 1000 meters. Due to its prolonged exposure to environmental stresses such as cold, shade, and competition for soil nutrients[5], WG has developed distinctive morphological traits. These include: a long rhizome with dense stem scars resembling bowls, left by the shedding of above-ground stems; adventitious roots shaped like jujube pits on the rhizome; compact, fine grains at the shoulder of the taproot; and long fibrous roots bearing pear-shaped nodules.
Internally, WG accumulates a range of active substances, including ginsenosides, volatile oils, polysaccharides, and inorganic elements[6,7]. For food applications, flavor is a core factor determining product acceptability. The unique blended aroma of wild mountain ginseng arises from volatile flavor compounds such as terpenes, alcohols, and aldehydes. The composition and content of these components directly influence the aromatic profile and sensory experience of the food. Studies have shown that the core active components ofWG exhibit regular changes throughout the growth cycle: the ginsenoside content in older WG is significantly higher than in younger cultivated ginseng [8,9]. The total volatile oil content in samples aged 3-7 years increases with age [10].
Additionally, the phytosterol content in forest-cultivated ginseng is higher than that in garden-cultivated ginseng and is positively correlated with growth years. The accumulation of these components directly enhances the efficacy of WG, leading to higher medicinal value[11,12]. Modern pharmacological studies have confirmed that ginseng exhibits a wide range of biological activities, including antioxidant, immunomodulatory, and cardiovascular protective effects[13].These changes are not only related to nutritional quality but also directly drive the dynamic evolution of flavor characteristics, providing a basis for differentiating the food applications of wild mountain ginseng across different ages.
Currently, he commercial circulation and quality assessment of WG primarily rely on morphological identification, with growth years as the core criterion and morphological characteristics as the primary basis. This approach involves comprehensive judgment based on the “five shapes”: rhizome, adventitious roots, main root, surface texture, and fibrous roots[14,15]. Historically, the market value of WG has been closely linked to its growth years and external morphology, with ginseng of longer growth years and more typical morphology commanding higher prices[16]. While this method is non-destructive, intuitive, and preserves the original state of the ginseng, it has notable limitations. On one hand, it fails to objectively reflect differences in flavor compounds, which are key quality indicators for food; on the other hand, it leads to an overemphasis on the market value of ginseng with ideal morphology. The rich flavor compounds and nutrients of such ginseng are not effectively utilized, resulting in the waste of valuable food resources. Notably, most WG grown under natural conditions exhibits imperfect external morphology, such as incomplete taproots, scarring, or the presence of three or more lateral roots. This “high quality but poor shape” WG can account for approximately 80% of actual harvests. Despite having sufficient growth years and a rich accumulation of secondary metabolites, its market price is considerably lower than that of ginseng with a perfect appearance of the same age, due to non-compliance with traditional aesthetic standards, resulting in a significant value gap and resource waste. Furthermore, the lack of objective and reliable quality evaluation methods has long hindered market acceptance of deep-processed WG products (e.g., WG powder), impeding the high-quality development of the industry.
Therefore, establishing an objective identification technology that transcends morphology and directly reflects the intrinsic quality and growth years ofWG is of substantial practical significance for the industry. Systematic analysis of variation patterns of flavor compounds across different growth years and establishment of age identification and quality evaluation methods based on flavor characteristics are of great practical significance for the food industry. Flavor compounds, as key products of plant secondary metabolism, contribute to the characteristic medicinal aroma of ginseng and primarily originate from terpenes, alcohols, aldehydes, and other volatile constituents. Their composition and abundance are directly influenced by growth years and environmental stresses, thereby serving as a “chemical fingerprint” that reflects the physiological state and metabolic history. Compared with traditional gas chromatography-mass spectrometry (GC-MS), gas chromatography-ion mobility spectrometry (GC-IMS) integrates the high separation capability of gas chromatography with the high sensitivity of ion mobility spectrometry. This technique enables rapid and direct analysis of volatile and semi-volatile components without complex pretreatment, demonstrating notable advantages in food products and traditional Chinese medicine analysis[17,18,19]. WG samples from four representative growth years (10, 15, 20, and 25 years) were investigated. GC-IMS, combined with retention index identification and internal standard quantification was applied to systematically characterize the dynamic changes in flavor compound profiles across growth years. Furthermore, partial least squares-discriminant analysis was employed to identify key differential markers, with the aim of constructing a WG age and quality discrimination model based on flavor compound chemical fingerprints.
This study not only elucidates the chemical mechanisms of flavor compound accumulation in WG over years, verifying the scientific nature of traditional experience, but also provides a methodological foundation for establishing an objective quality evaluation system that is independent of external morphology. Consequently, it offers critical technical support for the scientific assessment of the intrinsic value of “high quality but poor shape” WG, enhances market confidence in deep-processed products, and promotes the standardized and high-quality development of the industry.

2. Results

2.1. Flavor Compounds Identification and Spectral Features

A total of 68 VOCs were tentatively identified in the samples. According to the classification systems described in food flavor chemistry, these compounds were categorized into 7 major classes based on their functional group structures and odor characteristics (Table 2). Specifically, the tentatively identified compounds comprised seven alcohols, twelve aldehydes, thirteen ketones, ten esters, twelve terpenes, three pyrazines, and eleven other compounds. The three-dimensional, two-dimensional and differential GC-IMS spectra (Figure 1) visually demonstrated enhanced signal intensities with increasing growth years. Notably, the characteristic peaks of the 10-year sample group appeared lighter in color, whereas those of the 25-year sample group were the darkest, indicating a cumulative increase in the content of flavor compounds. Fingerprint maps (Figure 2) demonstrated good reproducibility within the same age group, while clear differences were observed among samples from different age groups.
Among the 68 compounds, terpenes (12 compounds, accounting for 17.6% of total identifications) and pyrazines (3 compounds, 4.4%) constituted relatively minor fractions in terms of compound numbers. However, these two classes exhibited the most pronounced and contrasting temporal trends across growth years, making them sensitive chemical indicators of WG aging. The remaining 53 compounds(77.9%) displayed more complex, often non-monotonic variation patterns, reflecting the multifaceted regulation of secondary metabolism during WG growth.

2.2. Dynamic Changes of Flavor Compounds with Growth Years

Heatmap visualization combined with quantitative data (Table 1) demonstrated the differences in content and the temporal evolution patterns of the 68 key VOCs among the 10-, 15-, 20-, and 25-year groups. The heatmap employed color gradients to clearly distinguish variations in compound abundance. Horizontal clustering indicated a high similarity in VOCs composition among samples within the same growth year, reflecting good intra-group repeatability. Vertical clustering categorized flavor compounds according to their change trends across growth years, thereby revealing the dynamic regulation of secondary metabolism in WG throughout the growth cycle. By integrating the color variations observed in the heatmap with the quantitative statistical data (Table 3), four distinct evolution patterns were identified. Among these, two contrasting directional trends—the monotonic accumulation of terpenes and the progressive decline of pyrazines—emerged as the most prominent chemical signatures of WG aging, while compounds exhibiting increase-then-decrease or fluctuating patterns reflected the complexity and environmental sensitivity of secondary metabolism. Together, these patterns constitute a divergent evolutionary trajectory of WG’s flavor quality:
Table 1. Results of the qualitative analysis of different growth years of wild ginseng.
Category Compound CAS# Formula MW RI Rt/s Dt/ms Odor Description
Terpenes Nerolidol C7212444 C15H26O 222.4 1541.1 2337.605 1.49178 flower, green, waxy, citrus aroma, woody flavor
(E, E)-α-Farnesene C502614 C15H24 204.4 1518.8 2217.096 1.43251 citrus herbal lavender bergamot myrrh neroli green
d-Longifolene C475207 C15H24 204.4 1407.4 1702.666 1.44243 sweet woody rose medical fir needle
Iso-Longifolene C1135666 C15H24 204.4 1371.9 1565.467 1.44243 woody
(+)-Limonene M C138863 C10H16 136.2 1033.9 702.724 1.21679 lemon, sweet, orange, pine oil
(+)-Limonene D C138863 C10H16 136.2 1034.1 703.113 1.29548 lemon, sweet, orange, pine oil
Camphene C79925 C10H16 136.2 954.5 550.744 1.209 woody, camphor
(R)-α-pinene C7785708 C10H16 136.2 937.1 516.454 1.21259 Terpenic, Mint, Pine
β-Pinene M C127913 C10H16 136.2 983.7 613.341 1.21737 resin, green
β-Pinene D C127913 C10H16 136.2 984.5 615.313 1.29282 resin, green
β-Pinene P C127913 C10H16 136.2 983.8 613.67 1.72327 resin, green
β-ionone C14901076 C13H20O 192.3 1499 2115.677 1.47531 rose, floral, iris, fruity, woody
(-)-Carvone C99490 C10H14O 150.2 1246.6 1163.382 1.31536 spearmint
Carveol C99489 C10H16O 152.2 1217.7 1086.292 1.29358 fresh, spearmint, caraway
Linalool C78706 C10H18O 154.3 1100.2 822.177 1.25066 citrus, rose, woody, blueberry
Ketones 3-Octanone C106683 C8H16O 128.2 998.1 645.59 1.70914 mouldy, ketone, green, waxy, vegetable, mushroom, fruity
3-Heptanone M C106354 C7H14O 114.2 890.2 434.486 1.23525 Fruity, Grass, Oil
3-Heptanone D C106354 C7H14O 114.2 889 432.685 1.58984 Fruity, Grass, Oil
2-Hexanone C591786 C6H12O 100.2 804.6 323.427 1.19587 fruity, fungal, meaty, buttery
2-butanone 3-hydroxy M C513860 C4H8O2 88.1 727.6 246.218 1.06235 butter, cream
2-butanone 3-hydroxy D C513860 C4H8O2 88.1 719.2 238.956 1.33411 butter, cream
2-Pentanone C107879 C5H10O 86.1 689.2 214.626 1.11425 acetone, fresh, sweet fruity, wine
2,3-Pentanedione C600146 C5H8O2 100.1 714.5 235.015 1.22865 sweet, cream, caramel, nuts, cheese
2,3-butanedione C431038 C4H6O2 86.1 589.3 166.606 1.17706 butter, popcorn, sweet taste, sour rice
2-Butanone D C78933 C4H8O 72.1 596.9 169.852 1.24222 fruity, camphor
2-Butanone M C78933 C4H8O 72.1 596.9 169.852 1.05683 fruity, camphor
3-Pentanone C96220 C5H10O 86.1 694.2 218.547 1.35976 ethereal
2-pentanone, 3-methyl C565617 C6H12O 100.2 747.8 264.748 1.46842 mint, honey
4-methyl-3-Penten-2-one C141797 C6H10O 98.1 797.3 315.419 1.43959 spice, earth, green
1 -Hydroxy-2-propanone C116096 C3H6O2 74.1 685.5 212.523 1.04191 pungent, caramel, fresh
Aldehydes (E)-2-Octenal C2548870 C8H14O 126.2 1064.1 754.849 1.33015 fresh cucumber, fatty, green herbal, banana, green leaf
(E)-Hept-2-enal C18829555 C7H12O 112.2 964.5 571.404 1.65754 spicy, green vegetables, fresh, fatty
(E)-2-Hexenal M C6728263 C6H10O 98.1 854.2 383.795 1.17996 green, banana, fat
(E)-2-Hexenal D C6728263 C6H10O 98.1 852.8 381.993 1.51532 green, banana, fat
3-Methyl-2-butenal D C107868 C5H8O 84.1 784.8 302.125 1.35719 fruity
3-Methyl-2-butenal M C107868 C5H8O 84.1 783.9 301.197 1.09391 fruity
Trans-2-pentenal M C1576870 C5H8O 84.1 754.6 271.19 1.1033 potato, peas
Trans-2-pentenal D C1576870 C5H8O 84.1 753 269.656 1.36007 potato, peas
Heptanal M C111717 C7H14O 114.2 906.1 460.475 1.33381 fresh, aldehyde, fatty, green herbs, wine, fruity
Heptanal D C111717 C7H14O 114.2 905 458.674 1.68961 fresh, aldehyde, fatty, green herbs, wine, fruity
Hexanal M C66251 C6H12O 100.2 802.9 321.554 1.26234 fresh, green, fat, fruity
Hexanal D C66251 C6H12O 100.2 797.3 315.419 1.56223 fresh, green, fat, fruity
Butanal C123728 C4H8O 72.1 606.5 174.038 1.28922 pungent, fruity, green leaf
Propanal C123386 C3H6O 58.1 493.6 130.788 1.05642 pungent, green grassy
n-Pentanal M C110623 C5H10O 86.1 699.2 222.482 1.19633 green grassy, faint banana, pungent
n-Pentanal D C110623 C5H10O 86.1 698.9 222.224 1.4229 green grassy, faint banana, pungent
2-Methylpropanal C78842 C4H8O 72.1 571.4 159.218 1.28734 banana, melon , slightly nutty
2-Phenylacetaldehyde C122781 C4H8O 120.2 1048.5 727.397 1.25277 hyacinth, sweet fruity, almond, cherry, clover honey, cocoa
Alcohols 1-Hexanol M C111273 C6H14O 102.2 874.3 411.328 1.3242 fresh, fruity, wine, sweet, green
1-Hexanol D C111273 C6H14O 102.2 873.4 410.041 1.64033 fresh, fruity, wine, sweet, green
1-Pentanol M C71410 C5H12O 88.1 765.7 282.183 1.25372 balsamic
1-Pentanol D C71410 C5H12O 88.1 766.2 282.695 1.51337 balsamic
1-Butanol M C71363 C4H10O 74.1 664.8 201.668 1.18155 wine
1-Butanol D C71363 C4H10O 74.1 661.8 200.144 1.37446 wine
1-Propanol C71238 C3H8O 60.1 533.1 144.55 1.11957 alcohol, pungent
3-Methyl butanol M C123513 C5H12O 88.1 734.9 252.73 1.23831 whiskey, banana, fruity
3-Methyl butanol D C123513 C5H12O 88.1 735.1 252.98 1.49052 whiskey, banana, fruity
1-Propanol, 2-methyl C78831 C4H10O 74.1 630.3 184.825 1.17479 fresh, alcoholic, leather
1-Penten-3-ol C616251 C5H10O 86.1 686.7 213.184 0.93418 ethereal, green, tropical fruity
Esters Acetic acid, hexyl ester C142927 C8H16O2 144.2 1012.4 667.852 1.40698 fruity, green, apple, banana, sweet
Esters Hexanoic acid methyl ester C106707 C7H14O2 130.2 937.2 516.526 1.27887 pineapple, apricot, fruity
Isobutyl propanoate C540421 C7H14O2 130.2 863.6 396.403 1.2641 rum, pineapple
Ethyl 2-methylbutanoate C7452791 C7H14O2 130.2 857.5 388.169 1.23645 apple
Methyl 2-methyl butyrate C868575 C6H12O2 116.2 777.6 294.455 1.18953 apple
Ac. acetic ethyl ester M C141786 C4H8O2 88.1 619.7 179.945 1.09967 fresh, fruity, sweet, grassy
Ac. acetic ethyl ester D C141786 C4H8O2 88.1 618.5 179.373 1.33521 fresh, fruity, sweet, grassy
n-Propyl acetate C109604 C5H10O2 102.1 713.7 234.268 1.16076 fruity, pear
(Z)-3-Hexenyl acetate C3681718 C8H14O2 142.2 1012 667.231 1.82102 fresh green grassy, sweet, fruity, banana
n-Butyl lactate C34451199 C7H14O3 146.2 1019.8 679.633 1.26842 sweet, fruity
2-Furanmethanol acetate C623176 C7H8O3 140.1 992.9 634.545 1.42368 sweet, banana
Pyrazines 2,3,5-Trimethylpyrazine C14667551 C7H10O2 122.2 1003.7 654.171 1.16189 roasted potato, peanut, cocoa, chocolate
2-Ethyl-6-methylpyrazine C13925036 C7H10N2 122.2 994.8 639.097 1.17084 nutty, roast, sweet
2,5-Dimethylpyrazine C123320 C6H8N2 108.1 896.5 444.522 1.10784 nutty, peanut, mouldy, earthy, potato, fatty, cocoa powder
Others 1,2-Dimethoxyethane C110714 C4H10O2 90.1 655.2 196.816 1.30428 ether
Allyl propyl sulfide C27817670 C6H12S 116.2 873.8 410.567 1.39721 garlic, onion
2-Pentylfuran C3777693 C9H14O 138.2 999.1 647.111 1.25551 bean, fruity, earthy, green, vegetable
4,5-Dihydro-2-methyl-3(2 H)thiophenone C13679851 C5H8OS 116.2 998.4 646.054 1.21561 cabbage, onion, must
2-Phenyl-1,3-dioxolane-4-methanol M C1708390 C10H12O3 180.2 967.8 578.487 1.14923 sweet berries, bitter almonds
2-Phenyl-1.3-dioxolane-4-methanol D C1708390 C10H12O3 180.2 967.3 577.271 1.46389 sweet berries, bitter almonds
2,2,4,6,6-Pentamethylheptane C13475826 C12H26 170.3 990.3 628.653 1.15566 tasteless
2,4-Dimethylheptane C2213232 C9H20 128.3 824.5 346.427 1.20149 gasoline
1-Heptene C592767 C7H14 98.2 687.3 213.482 1.07836 gasoline
3-Methyl valeric acid C105431 C6H12O2 116.2 945.5 532.616 1.59647 sour, herbal, slight green
Acetic acid C64197 C2H4O2 60.1 633.7 186.424 1.04583 spicy
3-Methylbutanoic acid C503742 C5H10O2 102.1 875.2 412.65 1.48565 sour, foot sweat, cheese
Note: The suffixes M, D, or P denote the monomer, dimer, and polymer forms of the same compound. Odor descriptions were primarily obtained from the database of https://www.flavornet.org(accessed on 15 December 2025).
Table 2. Semi-quantitative concentrations of flavor compounds in WG from different growth years.
Compounds Semi-quantitative concentrations (mean±standard error [SE], mg/kg)
10- year group 15- year group 20-year group 25- year group
Nerolidol 1.551±0.016d 1.763±0.002c 2.695±0.019b 3.196±0.017a
(E,E)-α-Farnesene 1.538±0.011d 1.735±0.02c 2.495±0.033b 2.686±0.019a
d-Longifolene 2.923±0.024d 2.806±0.024c 4.642±0.006b 5.27±0.013a
Isolongifolene 1.605±0.019c 1.566±0.014c 2.871±0.05b 3.254±0.037a
(+)-Limonene D 0.134±0.001d 0.108±0.002c 0.172±0.001b 0.258±0.003a
Camphene 0.61±0.014c 0.54±0.002c 1.214±0.012b 2.068±0.05a
(R)-α-pinene 0.841±0.009d 0.578±0.002c 1.056±0.028b 1.66±0.042a
β-Pinene P 1.027±0.007b 0.619±0.005c 1.075±0.032b 1.586±0.011a
β-ionone 1.508±0.008d 2.081±0.021c 2.416±0.004b 2.923±0.037a
(-)-Carvone 0.699±0.01d 0.767±0.008c 1.614±0.021b 2.548±0.006a
3-Octanone 0.258±0.006d 0.123±0.004c 0.547±0.027b 0.849±0.009a
3-Heptanone D 0.761±0.021a 0.647±0.012b 0.676±0.024b 0.785±0.008a
2-Hexanone 0.126±0.002a 0.06±0.001c 0.112±0.003b 0.12±0.003ab
2-Butanone 3-hydroxy D 5.214±0.063d 1.721±0.009c 2.196±0.023b 3.234±0.033a
2-Pentanone 0.239±0.002a 0.224±0.004b 0.253±0.006a 0.216±0.002b
2,3-Pentanedione 0.344±0.003b 0.353±0.004b 0.304±0.003c 0.396±0.002a
2,3-Butandione 0.424±0.006d 0.584±0.004a 0.475±0.005c 0.525±0.012b
2-Butanone D 2.25±0.049a 2.121±0.044a 1.931±0.032b 1.697±0.065c
3-Pentanone 0.082±0.006c 0.129±0.001a 0.106±0.002b 0.116±0.001b
2-Pentanone, 3-methyl 0.014±0.001b 0.015±0b 0.015±0.001b 0.023±0a
3-Penten-2-one, 4-methyl 1.042±0.013a 0.805±0.006b 0.711±0.011c 0.731±0.007c
5-Methyl-3-heptanone 2.846±0.033ab 2.695±0.023c 2.74±0.027bc 2.951±0.027a
1-Hydroxy-2-propanone 0.405±0.007a 0.638±0.004c 0.491±0.006b 0.602±0.005d
(E)-2-Octenal 0.197±0.003c 0.331±0.007a 0.227±0.004b 0.229±0.002b
(E)-Hept-2-enal 0.319±0.008c 0.462±0.006a 0.351±0.007b 0.309±0.004c
(E)-2-Hexenal D 1.113±0.009c 1.337±0.013b 1.321±0.009b 1.393±0.016a
3-Methyl-2-butenal D 1.598±0.022a 1.471±0.007b 1.191±0.023d 1.306±0.016c
Trans-2-pentenal D 0.181±0.003a 0.157±0.002b 0.156±0.001b 0.173±0.003a
Heptanal D 3.984±0.025b 4.127±0.138b 5.473±0.102a 3.058±0.049c
Hexanal D 7.341±0.045d 9.312±0.045b 7.947±0.025c 8.099±0.014a
Butanal 0.859±0.006b 0.92±0.007ab 0.735±0.033c 0.94±0.008a
Propanal 1.726±0.03d 2.703±0.035b 2.307±0.026c 3.87±0.034a
n-Pentanal D 1.723±0.01b 2.557±0.014a 1.571±0.011c 1.752±0.01b
2-Methylpropanal 0.118±0.006ab 0.129±0.004a 0.103±0.006b 0.112±0.006ab
2-Phenylacetaldehyde 0.128±0.003b 0.205±0.002a 0.11±0.003c 0.125±0.003b
Carveol 0.228±0.006c 0.283±0.006b 0.466±0.01a 0.296±0.002b
Linalool 0.373±0.006c 0.415±0.002b 0.542±0.01a 0.561±0.005a
1-Hexanol D 0.875±0.004d 0.936±0.007c 1.235±0.022b 1.308±0.011a
1-Pentanol D 0.179±0.003b 0.346±0.003a 0.187±0.002b 0.19±0.004b
1-Butanol D 5.624±0.06b 5.025±0.021c 4.488±0.055d 6.065±0.02a
1-Propanol 13.511±0.152b 14.136±0.104a 12.621±0.086c 12.743±0.021c
3-Methyl butanol D 0.032±0c 0.031±0.001c 0.095±0.004b 0.158±0.003a
1-Propanol, 2-methyl 0.144±0.002c 0.129±0.001d 0.181±0.003b 0.19±0.002a
1-Penten-3-ol 0.394±0.003b 0.358±0.002d 0.415±0.003a 0.373±0.001c
Acetic acid, hexyl ester 2.785±0.033c 2.905±0.006b 2.682±0.024d 3.004±0.019a
Ac. acetic ethyl ester D 1.121±0.029d 2.214±0.062b 1.49±0.068c 2.872±0.034a
Hexanoic acid methyl ester 1.067±0.014b 1.271±0.008a 1.267±0.01a 1.231±0.008a
Isobutyl propanoate 0.114±0.002b 0.15±0.002a 0.151±0.002a 0.15±0.002a
Ethyl 2-methylbutanoate 0.168±0.002d 0.188±0.001b 0.31±0.003a 0.294±0.005c
Methyl 2-methyl butyrate 1.078±0.006c 0.994±0.014d 1.434±0.005a 1.214±0.012b
n-Propyl acetate 0.078±0.005d 0.172±0.002a 0.154±0.003b 0.105±0.004c
(Z)-3-Hexenyl acetate 3.144±0.039a 2.543±0.031b 1.692±0.02d 1.835±0.038c
n-Butyl lactate 0.173±0.004a 0.158±0.004b 0.16±0.002ab 0.151±0.004b
2-Furanmethanol acetate 0.042±0.002a 0.05±0.002a 0.043±0.001a 0.043±0.001a
2,3,5-Trimethylpyrazine 0.735±0.004a 0.577±0.007b 0.467±0.005c 0.314±0.003d
2-Ethyl-6-methylpyrazine 0.408±0.005a 0.419±0.006a 0.263±0.007c 0.295±0.007b
2,5-Dimethylpyrazine 0.449±0.003b 0.372±0.007c 0.648±0.015a 0.214±0.006d
1,2-Dimethoxyethane 1.199±0.016c 1.466±0.022b 1.451±0.011b 1.669±0.038a
Allyl propyl sulfide 0.052±0.002c 0.066±0.001b 0.069±0.002b 0.102±0.001a
2-Pentylfuran 0.214±0.005b 0.238±0.007a 0.202±0.001b 0.196±0.001b
4,5-Dihydro-2-methyl-3(2H) thiophenone 0.653±0.003c 0.347±0.002d 1.201±0.008b 1.544±0.009a
2-Phenyl-1,3-dioxolane-4-methanol D 0.037±0a 0.032±0.001b 0.023±0.001c 0.024±0.001c
2,2,4,6,6-Pentamethylheptane 0.179±0.003a 0.186±0.005a 0.145±0.008b 0.13±0.002b
2,4-Dimethylheptane 0.138±0.002a 0.098±0.001c 0.122±0.002b 0.099±0.002c
1-Heptene 0.127±0d 0.258±0.003a 0.213±0.001c 0.246±0.003b
3-Methyl valeric acid 0.249±0.002a 0.244±0.001a 0.246±0.004a 0.249±0.006a
Acetic acid 0.895±0.01c 1.417±0.009a 1.179±0.034b 1.426±0.007a
3-Methylbutanoic acid 0.174±0.002a 0.129±0.001b 0.135±0.001b 0.135±0.005b
Note: a-d: Mean±SE (n = 3). Different superscript letters indicate significant differences (p <0.05).
Table 3. Proposed marker combinations for discriminating WG growth stages.
Target stage Category Markers Standard values
(Wx, mg/kg)
10-15 years Key markers 2,5-Dimethyl pyrazine ≥0.44
2-Butanone ≥2.12
Auxiliary markers 3-Methyl-2-butenal ≥1.50
3-Methylbutanoic acid ≥0.17
15-20 years Key markers Hexanoic acid methyl ester ≥1.24
Heptanal ≥4.13
Auxiliary markers n-Propyl acetate ≥0.16
Carveol ≥0.42
20-25 years Key markers (-)-Carvone ≥1.61
( R)-α-pinene ≥1.06
β-Pinene P ≥1.07
β-ionone ≥2.42
Auxiliary markers Nerolidol ≥2.70
(E,E)-α-Farnesene ≥2.50
d-Longifolene ≥4.64
Isolongifolene ≥2.87
Camphene ≥1.21

2.2.1. Terpene Accumulation as a Hallmark of Aging

In the heatmap, compounds exhibiting this pattern displayed progressively darker colors with increasing growth years, and their contents showed a continuous and stable upward trend from 10 to 25 years. These compounds are the primary contributors to the characteristic flavor profile of older WG. Among them, terpenes and their derivatives demonstrated the most pronounced increasing trends, emerging as the dominant drivers of flavor compounds evolution. The sesquiterpenes (E,E)-α-Farnesene and Nerolidol increased steadily from 1.538 mg/kg and 1.551 mg/kg in the 10-year group to 2.686 mg/kg and 3.196 mg/kg in the 25-year group, corresponding to growth rates of 106.1% and 74.6%, respectively. The monoterpene d-Longifolene exhibited a gradual increase from 2.923 mg/kg to 5.27 mg/kg, representing a 80.3% increase, whereas Camphene showed a more pronounced increase, rising from 0.610mg/kg to 2.068 mg/kg, corresponding to a 239.0% increase. In addition, β-ionone(1.508→2.923 mg/kg) and (-)-Carvone (0.699→2.548 mg/kg) followed the same monotonic increasing pattern,with increases of 93.8% and 264.5%, respectively. Terpene alcohols, including Linalool and 1-Hexanol, also exhibited increases of approximately 50%. This monotonic accumulation pattern directly indicates sustained activity of the mevalonic acid (MVA) and methylerythritol phosphate (MEP) pathways throughout the WG growth cycle, particularly during the later stages, resulting in continuous biosynthesis and accumulation of terpenoid skeleton compounds.
In addition, several aldehydes exhibited progressively darker color intensities in the heatmap. For example, (E)-2-hexenal increased from 1.113 mg/kg to 1.393 mg/kg, while propanal rose from 1.726 mg/kg to 3.87 mg/kg, both displaying clear upward trends with increasing growth years. These aldehydes contribute prominently to the fruity and green aroma characteristics of WG.

2.2.2. Pyrazine Decline as the Opposing Trajectory

In striking contrast to the terpene accumulation described above, this pattern was mainly observed in alkylpyrazines (e.g., 2,3,5-Trimethylpyrazine, 2,5-Dimethylpyrazine), constituting the opposite pole of the divergent flavor comounds evolution. Their progressive decline suggests a gradual attenuation of nitrogen metabolism.
In the heatmap, compounds following this pattern exhibited gradually lightening colors with increasing growth years, accompanied by a continuous decline in content. These compounds served as key chemical drivers underlying the transition of the WG flavor profile from “young” to “aged”. Alkylpyrazines were typical representatives of this category. For example, the content of 2,3,5-Trimethylpyrazine peaked at 10 years (0.735 mg/kg) and subsequently declined sharply to 0.314 mg/kg in the 25 years group, representing a 57.3% decrease from the peak level. Similarly, 2,5-Dimethylpyrazine showed a continuous decrease across growth years, declining from 0.449 mg/kg to 0.214 mg/kg from the 10- to 25-year groups, with the corresponding heatmap signals progressively fading. These compounds are commonly associated with roasted and nutty aromas.
Their decline indicates that biosynthetic pathways related to pyrazine formation—particularly those linked to the Maillard reaction or amino acid metabolism are significantly downregulated during the middle and late stages of WG growth. In addition, several ketones and organic acids, including 2-Butanone (2.25→ 1.697 mg/kg), 4-Methyl-3-penten-2-one (1.042→0.731 mg/kg), and 3-Methyl butanoic acid (0.174→0.135 mg/kg), also exhibited gradually lightening colors in the heatmap, further enriching the chemical landscape underlying the evolution of WG flavor.

2.2.3. Stage-Specific Metabolic Peaks

Compounds following this pattern exhibited peak contents at 15- 20 years, likely corresponding to a period of maximal metabolic activity. This was followed by progressively lighter colors in the heatmap and a decline in content with further aging, reflecting the phase-dependent activation of specific metabolic pathways. For example, the saturated aldehyde Hexanal and the alcohol Carveol reached their highest levels in the 20-year group(5.473 mg/kg and 0.466 mg/kg, respectively). The corresponding regions in the heatmap were darkest at 20 years and gradually lightened with increasing age. The esters Hexanoic acid methyl ester, Ethyl 2-methylbutanoate, and n-Propyl acetate also displayed metabolic peaks during the 15–20-year period. These compounds are likely metabolic intermediates or characteristic products of specific growth stages. Their transient accumulation is indicative of a phase of vigorous physiological metabolism, followed by a reduction in content due to metabolic pathway modulation and the reallocation of metabolic resources. This transient metabolic surge adds a temporal dimension to the divergent evolution model, indicating that certain flavor characteristics are stage-specific rather than linearly age-dependent.

2.2.4. Environmentally Driven Fluctuations

Compounds following this pattern exhibited no clear or consistent color gradient in the heatmap, with their contents fluctuating irregularly across different growth years. Among the 68 tentatively identified volatile components, approximately 66% showed such non-monotonic variation patterns, spanning multiple chemical classes, including alcohols, aldehydes, ketones, esters, etc. The observed fluctuations are likely influenced by annual climatic variability, micro-environmental conditions, or individual genetic differences, rendering these compounds less reliable as independent markers of growth age.The results indicate that the flavor evolution of WG is driven by the integrated effects of multiple compounds rather than by the linear accumulation of all constituents. It reflects the dynamic interplay of distinct metabolic pathways that undergo coordinated activation and attenuation throughout the growth cycle, ultimately shaping the structural evolution of the volatile chemical fingerprint. The predominance of fluctuating changes among the 68 compounds underscores that the divergent evolution of WG flavor is not a simple binary process but a complex, multi-layered phenomenon shaped by both intrinsic developmental programs and extrinsic environmental inputs.

2.3. PLS-DA Analysis and Key Biomarker Screening

The PCA-X preprocessing results showed that R²X[1]=0.467 and R²X[2]=0.298. The first two principal components together explained 76.5% of the total variance in the original data, indicating a satisfactory representation of the dataset. The PLS-DA model (Figure 6)was able to clearly discriminate samples from different growth years, with distinct separation among groups, suggesting pronounced differences in flavor profiles across growth stages. A 200-times permutation test demonstrated the robustness and reliability of the model (Figure 7, R²=0.136, Q²=-0.505).
VIP analysis identified 29 differential compounds with VIP > 1.0 (Figure 7), spanning multiple chemical classes including terpenes, aldehydes, ketones, alcohols, esters, pyrazines, and organic acids. The compounds with the highest VIP scores included Heptanal (1.32), 1-Butanol (1.32), 2,5-Dimethylpyrazine (1.29), 2,3-Pentanedione (1.28), Carveol (1.24), and Butanal (1.24). The complete list of 29 VIP-ranked compounds is provided in Table S5. These compounds can be considered potential chemical biomarkers for discriminating WG samples of different growth years.
Figure 3. Changes in material composition of WG across different growth years.
Preprints 213654 g003
Figure 4. Heatmap of volatile flavor compounds in WG across different growth years.
Preprints 213654 g004
Figure 5. PLS−DA analysis of flavor compounds in WG across different growth years.
Preprints 213654 g005
Figure 6. Permutation test results of flavor compounds in WG across different growth years.
Preprints 213654 g006
Figure 7. VIP values of the characteristic variables.
Preprints 213654 g007

2.4. Derivation of Stage-Specific Marker Thresholds Based on Confidence Interval Limits

Building upon the dynamic variation patterns and PLS-DA results, stage-specific marker thresholds were derived to describe the enrichment or depletion of key flavor compounds. Since GC-IMS analysis was performed on pooled samples (n ≥15 individual roots homogenized per group, three analytical replicates per pool), biological variability among individual specimens was not captured, precluding classical ROC analysis. Thresholds were therefore derived as the lower bound of the 95% confidence interval (CI)of the mean content in the target growth stage:
The threshold for each marker was derived as the lower bound of the 95% confidence interval (CI) of the mean content in the target growth stage, calculated as:
T h r e s h o l d = X t ( α / 2 , n 1 ) × S E
where X is the group mean, SE is the standard error, n=3 represents the analytical replicates, and t(0.025,2)=4.303. This conservative estimate ensures that at least 97.5% of measurements from the target group exceed this bound.
Compounds were categorized into three types based on their abundance trajectories:
a) Markers enriched in younger WG (positive markers, 10–15 year stage):These compounds, including pyrazines and certain ketones, exhibit a monotonic decrease with increasing growth years and thus serve as positive indicators of shorter growth duration. The threshold was logically set at the 95% CI lower bound of the target group’s mean, a value that should exclude the older age groups whose content falls consistently below this level. For example, 2,5-Dimethylpyrazine reached its highest concentration in the 10-year group (0.449±0.003 mg/kg), corresponding to a 95% CI lower bound of 0.436 mg/kg. The threshold was rounded to ≥0.44 mg/kg, effectively distinguishing the 10-year peak from the substantially lower levels observed in the 15-year (0.372 mg/kg), 20-year (0.648 mg/kg), and 25-year groups (0.214 mg/kg). Similarly, 2-Butanone, which declined from 2.25±0.049 mg/kg (10-year) to 1.70 mg/kg (25-year), yielded a 95% CI lower bound of 2.04 mg/kg; a conservative threshold of ≥2.12 mg/kg was adopted to ensure specificity for the youngest growth stage.
b) Markers peaking at intermediate stages (transition markers, 15–20 year stage): Compounds showing an increase-then-decrease pattern were considered characteristic of the metabolic peak phase at 15–20 years. The threshold was derived from the 95% CI lower bound of the group in which the compound reached its maximum mean content. Heptanal, for instance, exhibited a pronounced peak in the 20-year group (5.473±0.102 mg/kg; 95% CI lower bound = 5.034 mg/kg) but its peak was also observed in the 15-year group (4.127 mg/kg). A threshold of ≥4.13 mg/kg (anchored to the 15-year group mean) was adopted as a conservative reference that captures the transition phase while avoiding overlap with the 10-year (3.984 mg/kg) and 25-year groups (3.058 mg/kg). Hexanoic acid methyl ester reached comparable levels in the 15-year (1.271±0.008 mg/kg) and 20-year groups; its 95% CI lower bound in the 15-year group was 1.237 mg/kg, and the threshold was set at ≥1.24 mg/kg.
c) Markers enriched in older WG (negative markers, 20–25 year stage): These terpenes accumulate progressively with advancing growth years, with their contents in the 20- and 25-year groups substantially exceeding those in the 10- and 15-year groups. The threshold was anchored to the 95% CI lower bound of the 20-year group mean—the earliest age within this stage—representing the most conservative boundary for age-associated enrichment. The four key markers satisfied this criterion: (−)-Carvone (20-year mean =1.614±0.021 mg/kg; threshold ≥1.61 mg/kg), (R)-α-pinene (1.056±0.028 mg/kg; threshold ≥1.06 mg/kg), β-Pinene P (1.075±0.032 mg/kg; threshold ≥1.07 mg/kg), and β-ionone (2.416±0.004 mg/kg; threshold≥2.42 mg/kg). The auxiliary terpene markers—Nerolidol (2.695±0.019 mg/kg; threshold ≥2.70 mg/kg), (E,E)-α-Farnesene (2.495±0.033 mg/kg; threshold ≥2.50 mg/kg), d-Longifolene (4.642±0.006 mg/kg; threshold ≥4.64 mg/kg), Isolongifolene (2.871±0.050 mg/kg; threshold ≥2.87 mg/kg), and Camphene (1.214±0.012 mg/kg; threshold≥1.21 mg/kg)—followed the same derivation principle.
d) Auxiliary markers were selected to complement the key markers by providing additional chemical evidence for stage assignment. Their thresholds were derived using the same 95% CI lower bound method based on their stage-specific abundance profiles. For the 10–15 year stage, 3-Methyl-2-butenal (10-year 95% CI lower bound = 1.503 mg/kg; threshold ≥1.50 mg/kg) and 3-Methylbutanoic acid (10-year 95% CI lower bound = 0.165 mg/kg; threshold ≥0.17 mg/kg) served as auxiliary indicators. For the 15–20 year stage, n-Propyl acetate (15-year 95% CI lower bound=0.163 mg/kg; threshold ≥0.16 mg/kg) and Carveol (20-year 95% CI lower bound=0.423 mg/kg; threshold ≥0.42 mg/kg) provided additional stage-specific evidence, with the latter showing a pronounced peak exclusively in the 20-year group.
Based on these derivation principles, a multi-marker combinatorial system was established for the three growth stages (Table 3). For ginseng aged 10–15 years, the core markers were 2,5-Dimethylpyrazine and 2-Butanone; the 15–20 year stage was characterized by Hexanoic acid methyl ester and Heptanal; and the 20–25 year stage was marked by (−)-Carvone, (R)-α-pinene, β-Pinene P, and β-ionone, supported by the five auxiliary terpenes.
It must be emphasized that these thresholds are derived exclusively from pooled group-level data with three analytical replicates per group. The inherent biological variability among individual WG roots within each age group was not captured in this experimental design. Consequently, the proposed marker combinations and their threshold values are intended as preliminary reference ranges that illustrate the stage-specific chemical features of WG. They represent statistically testable hypotheses rather than validated diagnostic criteria. Future studies employing individual-sample analysis with sufficient biological replicates are necessary to validate these markers, optimize their cutoff values through ROC analysis, and establish their practical reliability for growth-year discrimination.

3. Discussion

A central finding of this study is that the volatile flavor evolution of WG does not follow a uniform trajectory. Instead, it exhibits a divergent pattern: terpenes progressively accumulate while pyrazines progressively decline, with other compounds showing transient peaks or irregular fluctuations. This chemical divergence reflects the differential regulation of metabolic pathways during WG growth, as discussed below.
As a traditional Chinese medicine herb, WG exhibits significantly higher medicinal value than cultivated ginseng[5], and its market value is closely correlated with growth years[20]. However, traditional identification methods based on external morphological features, particularly the “five shapes” criteria[21], although intuitive and practical, fail to objectively reflect the intrinsic quality. At the same time, it constrains the standardized development of deep-processed products. In this study, GC-IMS combined with chemometric methods was employed to systematically elucidate,the internal standard method, using 2-methyl-3-heptanone as the reference compound, was employed to minimize instrumental variation. the variation patterns of flavor compounds in WG across different growth years at the level of secondary metabolite, thereby providing a scientific basis for establishing an objective quality evaluation system for this valuable resource.

3.1. Biological Mechanisms Underlying Flavor Compound Evolution in WG

WG grows over long periods in coniferous and broad-leaved mixed forests at altitudes of 400–1000 m, continuously exposed to environmental stresses such as cold, shade, and nutrient competition. The accumulation of secondary metabolites is co-regulated by growth stage and environmental conditions[22,23,24]. The four change patterns observed among the 68 flavor compounds in this study provide evidence for the metabolic response of WG to long-term adaptation to adverse environments.Future work should include GC-MS confirmation or authentic standard verification for key marker compounds.
As defensive metabolites, terpene contents increased continuously with age, which is closely associated with stress-induced activation of the mevalonic acid (MVA) and methylerythritol phosphate (MEP) pathways[25,26]. This finding is consistent with transcriptomic evidence from wild-simulated ginseng, where key genes involved in terpene backbone biosynthesis were progressively upregulated with age[27].These compounds are not only the primary contributors to the characteristic medicinal aroma of WG but are also consistent with the enhancement of its medicinal activities, such as antioxidant and anti-inflammatory effects. For example, the growth rates of (E,E)-α-farnesene and nerolidol from 10 to 25 years reached 106.5% and 74.6%, respectively, paralleling the reported increases in ginsenoside content in high-age WG [14,27,28]. This provides chemical evidence supporting the traditional experience that “the longer the age, the better the quality.”Compared with other aged plant-based food systems, the monotonic terpene increase in WG shows partial similarity to Pu-er tea during aging, where certain terpenes (e.g., β-caryophyllene, α-copaene) progressively accumulate and contribute to the characteristic “aged aroma”[29]. However, unlike WG, Pu-er tea does not exhibit a concurrent monotonic decline in pyrazines, reflecting differences in microbial involvement and nitrogen metabolism between the two systems. This chemically verifies the traditional experience that “the longer the age, the better the quality.”
In contrast, pyrazine compounds (e.g., 2,3,5-trimethylpyrazine and 2,5-dimethylpyrazine), which are associated with nutty and roasted aromas, showed a gradual decline with increasing age. This trend reflects the reallocation of nitrogen metabolism resources towards core functional components, such as ginsenosides and polysaccharides, during the middle and late growth stages[30], which constitutes the fundamental metabolic basis for the observed decrease in pyrazines. Yang et al. showed that in perennial plants, the phenylpropanoid and nitrogen metabolic pathways are often competitively regulated, with resource allocation shifting toward stress-related terpenoids during prolonged growth[31].
Meanwhile, the “increase-then-decrease” pattern observed for certain aldehydes and esters (e.g., hexanal and hexyl acetate) marks a period of vigorous metabolism in 15–25 year-old WG. During this stage, physiological activity is at its peak, and the synthesis and transformation rates of secondary metabolites reach their highest levels. Studies on Citri Reticulatae Pericarpium (CRP) have demonstrated that volatile organic compounds evolve from lemon, sweet, and musk aromas to apple, pineapple, and coffee odors during aging, indicating active transformation of flavor-related metabolites throughout the storage process[32]. These parallels suggest that the “increase-then-decrease” pattern may represent a general metabolic feature in aging plant tissues, corresponding to a phase of maximal metabolic activity followed by resource reallocation.
Notably, 66.18% of the flavor compounds exhibited fluctuating changes, closely related to the complexity of the WG growth environment. Non-periodic factors, including annual climate fluctuations, soil microbial community structure, harvest time and precipitation distribution, influence the activity of metabolic pathways involving esters and certain aldehydes and ketones, preventing the formation of stable, time-dependent accumulation patterns [33,34,35]. This finding suggests that a single compound cannot serve as a reliable indicator for age discrimination and underscores the necessity of constructing a multi-marker combination model to improve discrimination accuracy.

3.2. Innovation and Reliability of the Technical Methodology

TThe application of GC-IMS technology in this study fully demonstrates its unique advantages for the analysis of volatile components in complex matrices. Compared with traditional GC-MS, GC-IMS requires no complex sample pretreatment, exhibits higher sensitivity for detecting short-chain and low-concentration volatile components, and generates fingerprints with good repeatability. The characteristic peak distributions of samples from the same growth year were highly consistent, providing solid technical support for the establishment of WG chemical fingerprints[34]. The integrated technical framework of “retention index qualification + internal standard semi-quantification + PLS-DA discrimination” adopted in this study further enhanced the reliability of the analytical results. In the PLS-DA model, the first two principal components cumulatively explained 76.5% of the variation. The PLS-DA model exhibited strong explanatory and predictive capacity, with R²X = 0.948, R²Y = 0.997, Q² = 0.993. The high Q² value (close to 1) indicates excellent model predictive ability. To rigorously exclude the possibility of overfitting, a 200-times permutation test was conducted. In this test, the Q² intercept was-0.505 (below zero), and the R² intercept was 0.136. These results satisfy the generally accepted criterion that a Q² intercept ≤ 0.05 (or negative) indicates no overfitting, confirming that the model could effectively distinguish samples from different growth years. Furthermore, the 29 differential compounds (VIP >1) tentatively identified through VIP analysis covered key metabolic pathway products of WG, and their combined discriminative performance was markedly superior to that of any single indicator.

4. Materials and Methods

4.1. Samples and Reagents

Samples were gathered from three pre-designated sites (S1, S2, and S3) within Hengdaohezi Village, Huanren County, Liaoning Province, China (Table 1).For each of the four growth-year cohorts(10, 15, 20, and 25 years), a minimum of five independent and intact WG specimens were collected from each of the three sampling sites, which were labeled as gs4, gs10, gs11, gs15. After being washed, the samples were dried at 50 °C, pulverized, sieved through an 80 - mesh sieve, homogenized, and stored at - 20 °C.
GC-IMS calibration standards (C4-C9 n-ketone) were purchased from Aladdin Co., Ltd. (Shanghai, China). The internal standard, 2-Methyl-3-heptanone (CAS No. 13019-20-0, Lot No. 25070276, purity 99.5%), was obtained from Tan-Mo Technology Co., Ltd. High-purity nitrogen (≥99.999%) was used as the carrier gas, and all other reagents were of analytical grade.
Figure 8. Partial wild ginseng samples collected from Huanren county Liaoning Province in the study.
Preprints 213654 g008
Table 4. WG Samples information.
Sampling site code Sampling site name Geographic location Altitude
(m)
Vegetation type Slope aspect Sampling date
S1 Hengdaohezi Village, Huanren County, Liaoning Province 41º15’24” N,
125º19’32” E
485 Coniferous and broad-leaved mixed forest Northeast slope Aug 26, 2025
S2 Hengdaohezi Village, Huanren County, Liaoning Province 41º23’23” N,
125º25’44” E
443 Coniferous and broad-leaved mixed forest Northeast slope Aug 26, 2025
S3 Hengdaohezi Village, Huanren County, Liaoning Province 41º30’11” N,
124º57’19” E
475 Coniferous and broad-leaved mixed forest Northeast slope Aug 26, 2025

4.2. Instruments

FlavourSpec® gas chromatography-ion mobility spectrometer (G.A.S. GmbH, Dortmund, Germany) was used, equipped with a CTC PAL3 automatic headspace sampler (CTC Analytics AG, Zwingen, Switzerland), an MXT-5 capillary column (15 m × 0.53 mm, 1.0 µm, Restek Corporation, Bellefonte, PA, USA), and VOCal data processing software (version 0.4.03, G.A.S. GmbH, Dortmund, Germany).

4.3. HS-GC-IMS Analysis

VOCs were analyzed by HS-GC-IMS following the method of Zou et al. (2025) and Xiang et al. (2024)[36,37] with minor modifications. Powdered sample (0.5000 g) was placed in a 20 mL headspace vial with 5 µL of internal standard (2500 µg/mL), then incubated at 70 °C for 20 min under agitation at 500 rpm. Headspace gas (500 µL) was injected using an 85 °C syringe. GC separation employed an MXT-5 column at 60 °C with high-purity N₂ as carrier gas. The flow program: 2.0 mL/min (2 min)→10.0 mL/min (8 min)→100.0 mL/min (10 min)→150.0 mL/min (10 min), held 30 min; injector, 80 °C. IMS detection used N₂ drift gas (75 mL/min) through a 53 mm drift tube (45 °C, 500 V/cm), with a ³H ionization source in positive ion mode.

4.4. Qualitative and Semi-Quantitative Estimates

Compounds were tentatively identified by matching retention index(RI) calculated from n-ketone standards and drift time with databases the NIST 2020 library and the IMS databases[38]. Semi-quantification was carried out using an internal standard method, with 2-methyl-3-heptanone as the internal standard. The content of each target compound (mg/kg) was calculated according to the following formula:
W x = C is × V is 1000 × m × A x A is
where Wx represents the content of the target compound, Cᵢₛ is the concentration of the internal standard (µg/mL), Vis is the volume of internal standard added (µL), m is the sample weight (g), and Ax and Ais are the peak areas of the target compound and the internal standard, respectively.

4.5. Data Processing and Statistical Analysis

GC-IMS data were processed using the Reporter and Gallery Plot plugins in VOCal software (version 0.4.03). Statistical analysis was performed using one-way analysis of variance (ANOVA) with SPSS software (version 26.0), and differences were considered statistically significant at p < 0.05. PLS-DA and VIP analysis were conducted using SIMCA software (version 14.1). PLS-DA model validation was performed using a 200-times permutation test. Heatmaps were generated using Origin software (version 2025b).

5. Conclusions

This study reveals that the volatile flavor evolution of WG across 10–25 growth years follows a divergent trajectory: terpenes progressively accumulate while pyrazines continuously decline, accompanied by stage-specific metabolic peaks and environmentally driven fluctuations in the majority of compounds. HS-GC-IMS combined with PLS-DA identified 68 VOCs and 29 VIP > 1 differential markers, enabling effective growth-year discrimination (R²Y = 0.997, Q² = 0.993). Preliminary reference thresholds derived from 95% confidence interval limits were proposed for three growth phases (10–15, 15–20, and 20–25 years), providing a chemical basis for flavor-based growth-year assessment that complements traditional morphology-based identification.
The proposed marker system is intended as a research framework requiring individual-sample validation rather than an immediately deployable quality control tool. Future studies should:(1) validate these markers using independent, individually analyzed WG samples and optimize cutoffs through ROC analysis; (2) incorporate multi-region sampling and continuous age gradients; (3) integrate GC-O and sensory evaluation to bridge the gap between chemical fingerprints and human aroma perception. This framework lays a foundation for objective quality evaluation of WG, particularly for “high-quality but poor-shape”specimens undervalued by conventional morphological criteria.

Supplementary Materials

The following supporting information can be downloaded at: Preprints.org, Table S1 Results of qualitative analysis of WG across different growth years; Table S2:Semi-quantitative concentrations of flavor compounds in WG from different growth years;Table S3:Proposed marker combinations for discriminating WG growth stages;Table S4:WG Samples information; Figure S1:Two-dimensional (a), three-dimensional (b), and comparative fingerprint map (c) of flavor compounds in ginseng powder from different years.;Figure S2:Fingerprint profiles of WG powder from different growth years;Figure S3: Changes in material composition of WG across different growth years;Figure S4: Heatmap of volatile flavor compounds in WG across different growth years;Figure S5: PLS−DA analysis of flavor compounds in WG across different growth years;Figure S6:Permutation test results of flavor compounds in WG across different growth years;Figure S7:VIP values of the characteristic variables;Figure S8:Partial wild ginseng samples collected from Huanren county Liaoning Province in the study.

Author Contributions

: Conceptualization, L. C., and H.Z.; methodology, L. C., and H.Z.; validation, H.G., T.Z.,and Z.Z.;formal analysis, Y.R., and X. L; investigation, M. J., and T.Z.; data curation, R. W., and H.G.; writing—original draft preparation, L.C. and Z.Z.; writing—review and editing, H.Z;.

Funding

This research was funded by The CAAS Agricultural Science and Technology Innovation Program, grant number CAAS-ASTIP-2021-ISAPS.

Data Availability Statement

Data will be made availabile on request.

Acknowledgments

The authors thank the experts from Inspection and Testing Centerfor Special Economic Animal and Plant Products Quality of MARA P.R. China for their assistance with sample authentication.

Conflicts of Interest

The authors declare that they have no competing interests. Compliance with.
Ethics Requirements: This article does not contain any studies with human or animal subjects.

References

  1. Unlu, A.; Nayir, E.; Kirca, O.; Ay, H.; Ozdogan, M. Ginseng and cancer. J. Buon 2016, 21, 1383–1387. [Google Scholar] [PubMed]
  2. Zhang, Y. Y.; Sun, H.; Li, M. J. Ginseng classification based on the ecological environment. Ginseng Res. 2021, 33, 53–54. [Google Scholar]
  3. Zhao, N.; Cheng, M.; Lv, W.; Wu, Y.; Zhang, X. Peptides as potential biomarkers for authentication of mountain-cultivated ginseng and cultivated ginseng of different ages using UPLC-HRMS. J. Agric. Food Chem. 2020, 68, 2263–2275. [Google Scholar] [CrossRef]
  4. Zhang, Y.Y.; Sun, H.; Li, M.J. Ginseng classification based on the ecological environment. Ginseng Res. 2021, 33, 53–54. [Google Scholar]
  5. Choi, Y. E.; Kim, Y. S.; Yi, M. J.; Park, W. G.; Yi, J. S. Physiological and chemical characteristics of field- and mountain-cultivated ginseng roots. J. Plant Biol. (J. Plant Biol.) 2007, 50, 198–205. [Google Scholar] [CrossRef]
  6. Shi, L.; Fu, W.; Xu, H.; Li, S.; Yang, X.; Yang, W.; Sui, D.; Wang, Q. Ginsenoside Rc attenuates myocardial ischaemic injury through antioxidative and anti-inflammatory effects. Pharm. Biol. 2022, 60, 1038–1046. [Google Scholar] [CrossRef]
  7. Yin, Q.; Chen, H.; Ma, R. H.; Zhang, Y. Y.; Liu, M. M.; Thakur, K. Ginsenoside CK induces apoptosis of human cervical cancer HeLa cells by regulating autophagy and endoplasmic reticulum stress. Food Funct. 2021, 12, 5301–5316. [Google Scholar] [CrossRef]
  8. He, S. Y.; Li, W.; Zheng, Y. N.; Wang, Q. J. Comparatively analyze the content of adenosine and ginsenosides in semi-wild ginseng and cultivated ginseng. Chin. J. Pharm. Anal. (Chin J Pharm Anal) 2010, 30, 1701–1706. [Google Scholar]
  9. Yan, X. R.; Liu, Y. X.; Xiong, B. J.; Zhang, A.; Huang, Y. G.; He, S.; He, X. H.; Shi, R. Comparative study on terpenoids of Panax ginseng under different cultivation modes. J. Yunnan Agric. Univ. (Natural Science) 2023, 38, 129–135. [Google Scholar]
  10. Ding, Z. W.; Zhang, L. X. Study on the change law of volatile oil content in ginseng roots. Master’s thesis, Jilin Agricultural University, Changchun, 2008. [Google Scholar]
  11. Qu, Y.; Qiao, T.; Zhou, Z. X.; Dou, D. Q. Determination of appearances and seven major ginsenosides in Shizhu Linxia Shanshen with different ages. Chin. Arch. Tradit. Chin. Med. 2014, 32, 2198–2200. [Google Scholar]
  12. Yang, W. Z.; Lou, Z. H.; Wang, M. Z.; Du, Y. Z.; Pan, X. P.; Zhang, Y.; Zhang, I. C.; Gao, Y. Comparative research on physicochemical property of forest mountain ginseng and garden ginseng. Ginseng Res. 2018, 30, 17–21. [Google Scholar]
  13. Wu, H.; Chen, G.; Zhang, G.; Huang, Q.; Qin, J.; Zheng, C.; Xu, H. The immunomodulatory effects of ginsenoside derivative Rh2-O on splenic lymphocytes in H22 tumor-bearing mice is partially mediated by TLR4. Int. Immunopharmacol. 2021, 101, 108316. [Google Scholar] [CrossRef] [PubMed]
  14. Dai, Q. K.; Li, L. Y.; Xu, G. B.; Tang, D.; Ma, H. Y. Study on the correlation between morphological characteristics and chemical constituents of garden ginseng, mountain transplanted ginseng and mountain-grown ginseng based on “evaluating quality from morphological characteristics”. China Pharm. 2020, 31, 650–655. [Google Scholar]
  15. Wang, M. Y.; Jin, W. Q.; Guo, H. Y.; Wang, H. X.; Sun, L. W. Study on the relevance between ginseng root tissue morphology and biologically active ingredients. J. Cent. China Norm. Univ. (Natural Science Edition) 2015, 49, 428–433. [Google Scholar]
  16. Wu, H.; Chen, G.; Zhang, G.; Huang, Q.; Qin, J.; Zheng, C.; Xu, H. Methods for determining the ginseng age: A review. Microchem. J. (Microchem. J.) 2024, 111036. [Google Scholar] [CrossRef]
  17. Xiang, Y.; Zou, M. S.; Ou, F. L.; Zhu, L. J.; Xu, Y. Y.; Zhou, Q. Q.; Lei, C. A comparison of the impacts of different drying methods on the volatile organic compounds in ginseng. Molecules 2024, 29, 5235. [Google Scholar] [CrossRef]
  18. Zou, M. S.; Yu, X. M.; Liu, Y. H.; Zhu, L. J.; Ou, F. L.; Lei, C. Comparative analysis of volatile organic compounds in different parts of ginseng powder using gas chromatography–ion mobility spectrometry. Molecules 2025, 30, 1965. [Google Scholar] [CrossRef] [PubMed]
  19. Wang, L.; Huang, Y. J.; Li, Y. L.; Chen, Y. X.; Chen, G. J.; Fang, H. G.; Ge, Y. H. Analysis of key volatile components and their influencing factors in the production of indigenous Gastrodia elata in Guizhou. LWT-Food Sci. Technol. 2025, 220, 117513. [Google Scholar] [CrossRef]
  20. Zhu, L.; Xu, J.; Dou, P.; Dou, D.Q.; Huang, L.Q. The rhizosphere soil factors on the quality of wild-cultivated herb and its origin traceability as well as distinguishing from garden-cultivated herb: Mountainous forest cultivated ginseng for example. Ind. Crops Prod. 2021, 172, 114078. [Google Scholar] [CrossRef]
  21. Wu, H. M.; Chen, G.; Zhang, G. M.; Huang, Q.; Qin, J. Q.; Zheng, C. W.; Xu, H. X. Methods for determining the ginseng age: A review. Microchem. J. 2024, 204, 111036. [Google Scholar] [CrossRef]
  22. Zhang, T.; Han, M.; Yang, L.; Han, Z.; Cheng, L.; Sun, Z. The effects of environmental factors on ginsenoside biosynthetic enzyme gene expression and saponin abundance. Molecules 2018, 24, 14. [Google Scholar] [CrossRef]
  23. Wang, C. Q.; Yi, L. W.; Zhao, L.; Zhou, Y. Z.; Guo, F.; Huo, Y. S.; Zhao, D. Q.; Xu, F.; Wang, X.; Cai, S. Q. 177 saponins, including 11 new compounds in wild ginseng tentatively identified via HPLC-IT-TOF-MSn, and differences among wild ginseng, ginseng under forest, and cultivated ginseng. Molecules 2021, 26, 3371. [Google Scholar] [CrossRef]
  24. Ma, R.; Yang, P. D.; Jing, C. X.; Fu, B. Y.; Teng, X. Y.; Zhao, D. Q.; Sun, L. W. Comparison of the metabolomic and proteomic profiles associated with triterpene and phytosterol accumulation between wild and cultivated ginseng. Plant Physiol. Biochem. (Plant Physiol. Biochem.) 2023, 195, 288–299. [Google Scholar] [CrossRef]
  25. Meng, W. L.; Ling, Z.; Wang, Y. Z. Floral volatile benzenoids/phenylpropanoids: biosynthetic pathway, regulation and ecological value. Hortic. Res. 2024, 11, uhae220. [Google Scholar] [CrossRef]
  26. Yang, G.; Qin, Y.; Jia, Y. Transcriptomic and metabolomic data reveal key genes that are involved in the phenylpropanoid pathway and regulate the floral fragrance of Rhododendron fortunei. BMC Plant Biol. 2023, 23, 1–23. [Google Scholar] [CrossRef] [PubMed]
  27. Kim, J.; Yun, Y.; Huh, J.; Um, Y.; Shim, D. Comparative transcriptome analysis on wild-simulated ginseng of different age revealed possible mechanism of ginsenoside accumulation. Plant Physiol. Biochem. (Plant Physiol. Biochem.) 2023, 201, 107870. [Google Scholar] [CrossRef] [PubMed]
  28. Yuan, W.; Wang, Q. F.; Pei, W. H.; Li, S. Y.; Wang, T. M.; Song, H. P.; Teng, D.; Kang, T. G.; Zhang, H. Age-induced changes in ginsenoside accumulation and primary metabolic characteristics of Panax ginseng in transplantation mode. J. Ginseng Res. (J. Ginseng Res.) 2024, 48, 103–111. [Google Scholar] [CrossRef]
  29. Rong, Y.; Xie, J.; Yuan, H.; Wang, L.; Liu, F.; Deng, Y.; Jiang, Y.; Yang, Y. Characterization of volatile metabolites in Pu-erh teas with different storage years by combining GC-E-Nose, GC-MS, and GC-IMS. Food Chem. X 2023, 18, 100693. [Google Scholar] [CrossRef] [PubMed]
  30. Andersson, A.; Johansson, E.; Oscarson, P. Nitrogen redistribution from roots in post-anthesis plants of spring wheat. Plant Soil. 2005, 269, 321–332. [Google Scholar] [CrossRef]
  31. Yang, G.; Qin, Y.; Jia, Y.; Xie, X.; Jiang, B.; Wang, Q.; Feng, S.; Wu, Y. Transcriptomic and metabolomic data reveal key genes that are involved in the phenylpropanoid pathway and regulate the floral fragrance of Rhododendron fortunei. BMC Plant Biol. 2023, 23(1), 1–23. [Google Scholar] [CrossRef]
  32. Zhang, Y.; Tong, X.; Chen, B.; Wu, S.; Wang, X.; Zheng, Q.; Jiang, F.; Qiao, Y. Novel application of HS-GC-IMS for characteristic fingerprints and flavor compound variations in citrus reticulatae pericarpium during storage with different Aspergillus niger fermentation. Food Chem. X 2023, 18, 100653. [Google Scholar] [CrossRef]
  33. Souther, S.; McGraw, J. B. Evidence of local adaptation in the demographic response of American ginseng to interannual temperature variation. Conserv. Biol. 2011, 25, 922–931. [Google Scholar] [CrossRef]
  34. Duan, H.; Zhou, Y.; Wang, D.; Yan, W. Differences in volatile organic compounds in rhizoma gastrodiae (tian Ma) of different origins determined by HS-GC-IMS. Molecules 2023, 28, 4883. [Google Scholar] [CrossRef]
  35. Li, M.; Zhang, J. L.; Li, L.; Wang, S. J.; Liu, Y. B.; Gao, M. X. Effect of enzymatic hydrolysis on volatile flavor compounds of Monascus-fermented tartary buckwheat based on headspace gas chromatography-ion mobility spectrometry. Food Res. Int. 2023, 163, 112180. [Google Scholar] [CrossRef] [PubMed]
  36. Zou, M. S.; Yu, X. M.; Liu, Y. H.; Zhu, L. J.; Ou, F. L.; Lei, C. Comparative analysis of volatile organic compounds in different parts of ginseng powder using gas chromatography–ion mobility spectrometry. Molecules 2025, 30(9), 1965. [Google Scholar] [CrossRef] [PubMed]
  37. Xiang, Y.; Zou, M. S.; Ou, F. L.; Zhu, L. J.; Xu, Y. Y.; Zhou, Q. Q.; Lei, C. A comparison of the impacts of different drying methods on the volatile organic compounds in ginseng. Molecules 2024, 29(22), 5235. [Google Scholar] [CrossRef]
  38. Feng, H.; Timira, V.; Zhao, J. L.; Lin, H.; Wang, H.; Li, Z. X. Insight into the Characterization of Volatile Compounds in Smoke-Flavored Sea Bass during Processing via HS-SPME-GC-MS and HS-GC-IMS. Foods 2022, 11(17). [Google Scholar] [CrossRef] [PubMed]
Figure 1. Two-dimensional (a), three-dimensional (b), and comparative fingerprint map (c) of flavor compounds in ginseng powder from different years. Note:gs4-1,gs4-2,gs4-3 are 10 year samples group,gs10-1,gs10-2,gs10-3 are 15 year samples group,gs11-1,gs11-2,gs11-3 are 20 year samples group,gs15-1,gs15-2,gs15-3 are 25 year samples group.
Preprints 213654 g001
Figure 2. Fingerprint profiles of WG powder from different growth years.
Preprints 213654 g002
Disclaimer/Publisher’s Note: The statements, opinions and data contained in all publications are solely those of the individual author(s) and contributor(s) and not of MDPI and/or the editor(s). MDPI and/or the editor(s) disclaim responsibility for any injury to people or property resulting from any ideas, methods, instructions or products referred to in the content.
Copyright: This open access article is published under a Creative Commons CC BY 4.0 license, which permit the free download, distribution, and reuse, provided that the author and preprint are cited in any reuse.
Prerpints.org logo

Preprints.org is a free preprint server supported by MDPI in Basel, Switzerland.

Subscribe

Disclaimer

Terms of Use

Privacy Policy

Privacy Settings

© 2026 MDPI (Basel, Switzerland) unless otherwise stated