

Submitted:
11 May 2026
Posted:
12 May 2026
You are already at the latest version
Abstract
Critical ventilation velocity is crucial for smoke control in tunnel fires, yet its behavior in tunnels with unconventional cross-sections remains inadequately quantified. This study numerically investigates the critical velocity in a full-scale, 1000-m-long semi-circular tunnel using Fire Dynamics Simulator (FDS). A systematic parametric analysis was conducted to evaluate the effects of fire heat release rate (HRR, 4-10 MW), cross-sectional geometry (semi-circular vs. three arched sections of equal area), and longitudinal slope (-1% to +2%). The critical velocity was determined using a successive approximation method, validated against multi-criteria safety thresholds including smoke back-layering length, upstream temperature, and visibility height. Results demonstrate that HRR is the dominant factor, with critical velocity increasing from 2.2 to 2.7 m/s. More importantly, cross-sectional shape exhibits a significant, non-monotonic influence; the streamlined semi-circular arch requires a lower critical velocity (2.2 m/s) compared to arched sections (2.4-2.6 m/s) of the same area, attributed to reduced flow resistance and a more coherent ceiling jet. Within the studied range, the effect of slope is minor compared to HRR and geometry, showing only a slight decrease in critical velocity for uphill gradients. These findings provide quantitative insights into optimizing ventilation design for semi-circular tunnels, highlighting that an aerodynamically favorable shape can reduce the required longitudinal airflow, thus balancing safety and energy efficiency.
Keywords:
tunnel fire
; critical wind speed
; cross-sectional shape
; fire source power
; longitudinal slope
1. Introduction
Tunnel fires, as catastrophic events within enclosed underground transportation infrastructures, pose severe threats to structural integrity, operational safety, and human life. The confined geometry of tunnels leads to rapid heat accumulation, extreme temperatures capable of causing structural spalling or even collapse [1,2] and the swift spread of high-temperature, toxic smoke [3,4], which critically hinders safe evacuation by degrading visibility and air quality. High-profile fire incidents in tunnels worldwide have underscored these risks, driving continuous advancements in fire safety standards and engineering design codes. Consequently, a profound understanding of fire dynamics, particularly the mechanisms governing smoke control, is paramount for ensuring tunnel resilience and public safety.
Longitudinal ventilation, utilizing a critical wind speed to prevent upstream smoke backflow, is a fundamental smoke management strategy. Research on critical wind speed has evolved over decades, establishing its core dependence on fire source heat release rate (HRR) and tunnel geometry [5,6]. Subsequent studies have refined this understanding by incorporating factors such as tunnel aspect ratio [7], height-to-width ratio [8], and slope. Concurrently, extensive numerical and experimental investigations have detailed smoke spread characteristics under various conditions, including the influence of mechanical ventilation [9,10], vehicle blockages [11], fire source movement [12], and tunnel curvature [13]. These works collectively affirm the reliability of tools like Fire Dynamics Simulator (FDS) for simulating tunnel fire environments [14,15].
Despite significant progress, notable research gaps persist. Existing studies often rely on reduced-scale experiments or idealized numerical models. There is a pronounced scarcity of full-scale investigations that systematically examine the coupled effects of variable tunnel cross-sectional geometry (a key design parameter) and varying fire source power on critical wind speed. This coupling is crucial for modern tunnel designs featuring non-rectangular cross-sections, such as semi-circular arches, where heat and smoke interaction with the curved boundary may significantly alter flow dynamics and critical wind speed requirements. Furthermore, the interaction between longitudinal ventilation and the tunnel’s longitudinal slope in such geometries remains inadequately quantified.
To address these gaps, this study employs a full-scale modeling approach centered on a semi-circular tunnel arch. The primary objectives are: (1) to investigate the variation patterns of critical wind speed under different fire source HRRs; (2) to analyze the influence of the semi-circular cross-sectional geometry on smoke layer stability and critical wind speed; and (3) to evaluate the impact of tunnel slope on the required ventilation control velocity. The findings aim to provide a theoretical foundation and practical data for the optimized design of ventilation and smoke control systems in semi-circular tunnels.
2. Methodology
2.1. Numerical Simulation Platform and Fundamental Theory
This study employs PyroSim 2024, a graphical user interface for the Fire Dynamics Simulator, to conduct computational fluid dynamics simulations of tunnel fire scenarios. FDS is an open-source CFD code developed by the National Institute of Standards and Technology, specifically designed for modeling fire-driven fluid flow and heat transfer [16,17]. It solves a form of the Navier-Stokes equations appropriate for low-speed, thermally-driven flow, making it widely adopted in fire safety engineering and tunnel ventilation studies [17,18].
The core solver in FDS version 6.7 (the engine behind PyroSim 2024) utilizes a Large Eddy Simulation (LES) approach for turbulence modeling. In LES, large-scale eddies are resolved directly by the computational grid, while the effects of sub-grid scale motions are modeled, typically using a Smagorinsky closure model. Combustion is modeled using a mixture fraction-based approach, and radiative heat transfer is calculated using a finite volume method for the radiative transport equation (RTE). These modeling choices are considered suitable for simulating buoyancy-dominated smoke movement in tunnel fires [2,17].
To focus on the fundamental interactions between fire plume, ventilation, and tunnel geometry, the following assumptions were applied:
(1) The ventilation flow is treated as an incompressible ideal gas, valid for low Mach number flows characteristic of tunnel ventilation velocities.
(2) The fluid is a continuous medium.
(3) The tunnel walls are assumed to be inert and rigid, with material properties defined as concrete.
2.2. Physical Model and Geometry
A full-scale model of a semi-circular arch tunnel was constructed. The tunnel has a total length (L) of 1000 m. The cross-section is defined by a semi-circle with a radius (R) of 5 m, resulting in a maximum height (H) of 5 m and a width (W) of 10 m (the diameter of the semi-circle). The longitudinal direction is aligned with the x-axis. A schematic of the tunnel geometry is presented in Figure 1.
2.3. Boundary Conditions, Fire Source, and Material Properties
Both ends of the tunnel were set as open boundaries to the ambient atmosphere, simulating a naturally ventilated scenario prior to the activation of mechanical systems. The ambient temperature and pressure were set to 20 °C and 101.325 kPa, respectively. To simulate longitudinal ventilation, a constant velocity inlet boundary condition was prescribed at the upstream portal, while the downstream portal remained as an open pressure outlet. The ventilation velocity was systematically varied across simulation cases to determine the critical value.
The fire source was modeled as a rectangular burner with dimensions of 4 m 1.8 m 1.6 m, representing a burning passenger vehicle. It was positioned at the longitudinal midpoint of the tunnel and centered laterally. A constant Heat Release Rate Per Unit Area was specified to achieve a prescribed total fire power. Based on common vehicle fire classifications in guidelines such as China’s “Design Specifications for Road Tunnels” (DG-TJ08-2033-2008), the primary fire scenario was set to a total HRR of 4 MW. The corresponding HRRPUA was calculated as approximately 155 kW/m², considering the exposed surface area of the burner.
Carbon monoxide (CO) was selected as a tracer species to visualize and quantify smoke movement, as its concentration is a key parameter for assessing tenability and ventilation effectiveness [19]. A constant yield of 0.2 kg of CO per kg of fuel was specified. All tunnel surfaces were assigned the properties of concrete, using the built-in material library definition in PyroSim which includes typical density, thermal conductivity, and specific heat capacity values [20,21].
2.4. Computational Grid and Independence Verification
The computational domain was discretized using a structured, rectilinear grid. A uniform grid cell size of 0.5 m was initially applied in all three directions, resulting in a total of approximately 400,000 cells.
A grid sensitivity analysis was performed to ensure that key results were independent of spatial resolution. Two additional grids were tested for a representative 4 MW fire case: a coarse grid with a cell size of 0.8 m (~98,000 cells) and a fine grid with a cell size of 0.33 m (~1.1 million cells). The primary metrics for comparison were the longitudinal temperature decay profile along the tunnel ceiling and the calculated critical wind speed. The results from the 0.5 m and 0.33 m grids showed differences of less than 5% in ceiling temperature and less than 3% in the predicted critical velocity, whereas the 0.8 m grid showed deviations exceeding 10%. Therefore, the 0.5 m grid was deemed to offer an optimal balance between computational accuracy and cost for this study.
2.5. Simulation Scenarios and Data Acquisition
The core objective was to investigate the critical wind speed (), defined as the minimum longitudinal ventilation velocity required to prevent the upstream back-layering of smoke. A series of simulations were conducted by systematically varying two key parameters: (1) the fire source HRR (4 MW, 6 MW, 8 MW, 10 MW), and (2) the longitudinal tunnel slope (-1%, 0%, +1%, +2%). For each scenario, the longitudinal ventilation velocity at the upstream inlet was incrementally adjusted in successive simulations until the condition of no sustained smoke backflow beyond 20 m upstream of the fire source was achieved. This velocity was recorded as for that scenario.
Data were extracted from the simulations at key locations. Thermocouple trees were virtually placed at intervals of 50 m along the tunnel centerline to record gas temperature versus height. Video smoke detection and slice files were used to visualize smoke layer height and CO concentration fields.
3. Analysis and Results
3.1. Study on Characteristics of Tunnel Fires
The smoke flow and temperature distribution within the tunnel were fundamentally governed by the interaction between the fire plume and the longitudinal ventilation. In the absence of mechanical ventilation, smoke spread symmetrically upstream and downstream from the fire source, forming a stratified layer. The introduction of longitudinal ventilation created an asymmetric flow field, directing the smoke plume downstream. The critical ventilation velocity () was identified as the minimum longitudinal wind speed required to completely suppress the upstream smoke back-layering, establishing a unidirectional smoke flow towards the downstream exit.
3.1.1. Study on Characteristics of Fires in Tunnels Without Longitudinal Ventilation
Under natural ventilation (zero longitudinal velocity), the fire plume and resulting smoke layer evolved through distinct phases. The temporal development of the smoke layer is shown in Figure 2. Initially, a vertical plume formed above the 4 MW fire source. Driven by buoyancy, the smoke impinged on the tunnel ceiling and subsequently spread radially, leading to symmetric bidirectional propagation along the tunnel length. By 300 seconds, a stable, stratified smoke layer filled the tunnel cross-section.
The corresponding evolution of the longitudinal ceiling temperature distribution is presented in Figure 3. At 50 seconds, the temperature profile exhibited a sharp, single peak directly above the fire. As the ceiling jet developed and the layer stabilized, the temperature distribution broadened and flattened, with the peak temperature decreasing due to enhanced heat transfer to the tunnel walls and ambient air entrainment. A quasi-steady temperature field was established between 200 and 300 seconds.
3.1.2. Study on Characteristics of Fires in Tunnels with Different Longitudinal Ventilation
The introduction of longitudinal ventilation fundamentally altered the fire-driven flow. With a sub-critical velocity of 1.5 m/s, the smoke spread became highly asymmetric. As shown in Figure 4, smoke was primarily transported downstream, though a limited upstream back-layering of approximately 50 m persisted. When the longitudinal velocity was incrementally increased, this back-layering length decreased. It measured 5 m at 2.1 m/s and was completely suppressed at 2.2 m/s, which was thereby identified as the critical velocity for the 4 MW fire in the baseline semi-circular tunnel.
The temperature distribution under longitudinal ventilation correlated with the smoke flow. Figure 5 presents the longitudinal ceiling temperature profiles for different wind speeds. At Vc = 1.5 m/s, a localized high-temperature zone corresponding to the 50 m back-layering was observed upstream of the fire. At the near-critical velocity of 2.1 m/s, this upstream high-temperature region was significantly reduced, with only a 5 m smoke back-layering exhibiting slightly elevated temperatures. Downstream of the fire, elevated temperatures were concentrated within a 100 m zone, with peak values remaining below 60 °C. As the wind speed approached and reached the critical value (2.2 m/s), the upstream high-temperature zone disappeared, and the downstream high-temperature region contracted, confirming complete suppression of smoke backflow.
The critical velocity (), defined as the minimum longitudinal wind speed that prevents upstream smoke back-layering, served as the key performance metric for the subsequent parametric analysis. The transition from a back-layering to a non-back-layering state is illustrated in Figure 6 for the 4 MW baseline case.
3.2. Influence of Fire Source Power
The critical wind speed and associated temperature fields were determined for fire source powers () of 4, 6, 8, and 10 MW in the baseline semi-circular tunnel.
A clear positive correlation was observed between and . As increased from 4 MW to 10 MW, increased from 2.2 m/s to 2.7 m/s. The corresponding smoke spread patterns at these critical conditions are shown in Figure 7. At each respective , upstream smoke backflow was eliminated, and smoke was entirely transported downstream. The increase in fire power also significantly affected the temperature field.
Figure 8 shows that the maximum ceiling temperature increased from approximately 80 °C at 4 MW to 115 °C at 10 MW. Furthermore, the longitudinal extent of the high-temperature zone (T > 60 °C) expanded downstream with increasing . At the critical velocity for each power level, this high-temperature region was confined downstream of the fire source.
Observation of Figure 9 reveals that as the heat source power increases from 4 MW to 10 MW, the peak flue gas temperature gradually rises, the range of counterflow diffusion expands, and the visible height for personnel evacuation continuously decreases. Under 4 MW operating conditions, when the wind speed is 2.1 m/s, although the upstream temperature does not exceed 60 °C, the visibility height for personnel far exceeds 2 m, indicating excessive ventilation and energy waste. However, when the wind speed reaches 2.2 m/s, all indicators meet safety requirements while avoiding unnecessary energy consumption, thereby establishing the critical wind speed. As the power of the fire source increases, the buoyancy of the smoke increases, and the critical wind speed required to maintain the stability of the smoke layer rises. Once the critical wind speed is reached, the high-temperature smoke can be stably contained downstream of the fire source.
3.3. Influence of Cross-Section Shape
Different tunnel cross-sectional shapes affect the resistance to airflow, thereby influencing the critical wind speed [22]. To isolate the effect of geometry, four tunnel cross-sections with an equal cross-sectional area of approximately 40 m² were compared under a fixed 4 MW fire. The geometries comprised three arched tunnels with varying crown heights (2 m, 3 m, 4 m) and a semi-circular tunnel with a 5 m crown height, as illustrated in Figure 10.
The measured critical velocities () for these four shapes were 2.4 m/s, 2.6 m/s, 2.6 m/s, and 2.2 m/s, respectively. The semi-circular section (5 m height) required the lowest . The smoke spread patterns at these critical conditions are presented in Figure 11, showing unidirectional downstream smoke flow in all cases. The corresponding longitudinal temperature distributions (Figure 12) indicate that the maximum ceiling temperature was highest in the semi-circular tunnel, while the arched tunnel with the lowest height (2 m) exhibited the most attenuated downstream temperature profile.
The corresponding longitudinal temperature distributions under critical ventilation conditions are shown in Figure 12. The semi-circular tunnel (5 m height) exhibited the highest maximum ceiling temperature, approximately 80 °C. In contrast, the arched tunnel with the lowest crown height (2 m) showed the most rapid longitudinal temperature decay downstream of the fire, resulting in the lowest average temperature within 150 m downstream. For all four cross-sectional shapes, temperatures upstream of the fire source remained near ambient levels when ventilated at their respective critical velocities.
Figure 13 presents that the tunnel arch height has a non-monotonic effect on the critical wind speed. As the arch height increases from 2 m to 5 m, the critical wind speed first rises and then falls. Under conditions where the arch height is 2 m, when the wind speed is below 2.4 m/s, smoke settlement upstream of the fire source is significant; when the wind speed reaches 2.4 m/s, smoke backflow is effectively suppressed, meeting safety requirements. Overall, the buoyancy effect of smoke is stronger in tunnels with medium arch heights (3-4 m), requiring higher wind speeds to control backflow; where as in 5-meter-high semi-circular tunnels, due to their geometric symmetry, smoke diffusion at the top is more uniform, and the critical wind speed drops to 2.2 m/s, thereby lowering the critical wind speed required to maintain personnel safety.
3.4. Influence of Gradient
The Highway Tunnel Design Specifications in China (JTG D70-2004) stipulate that the longitudinal gradient of highway tunnels should not exceed 3%. This is because harmful substance discharge rates increase rapidly when the gradient surpasses 2%. Therefore, this study designs a tunnel model with a gradient variation range of -1% to +2% to investigate changes in critical wind speed.
The measured critical velocities for slopes of -1%, 0%, +1%, and +2% were 2.15 m/s, 2.15 m/s, 2.10 m/s, and 2.10 m/s, respectively, as summarized in Figure 14. A modest decreasing trend in was observed when transitioning from level or negative slopes to positive (uphill) gradients.
The variation in slope had a limited effect on the critical velocity, with decreasing slightly from 2.15 m/s to 2.10 m/s as the slope increased from -1% to +2%. The temperature distributions under these critical ventilation conditions are shown in Figure 15. The maximum ceiling temperature remained around 80 °C across all slopes. Upstream of the fire source, temperatures were consistently at ambient levels. Within 100 m downstream, temperatures ranged between 60 °C and 80 °C, decreasing to below 60 °C beyond this distance.
Figure 16 illustrates that the tunnel gradient has a slight effect on the critical wind speed. Under a 2% gradient, when the wind speed is 2.05 m/s, the smoke layer upstream of the fire source becomes unstable, and the smoke tends to flow backward; when the wind speed increases to 2.10 m/s, the reverse flow of smoke is effectively controlled, the curve becomes stable and regular, and all indicators meet safety standards. As the gradient increases from -1% and 0% to 1% and 2%, the stack effect gradually intensifies, enhancing the natural suppression of flue gas backflow, and the critical wind speed decreases slightly from 2.15 m/s to 2.10 m/s.
3.5. Sensitivity Analysis
A sensitivity analysis was conducted to compare the relative influence of fire source power, cross-sectional shape, and longitudinal slope on the absolute variation of critical wind speed. The results are summarized in Table 1.
The analysis indicates that fire source power has the most significant impact on the critical wind speed, causing the greatest variation. When the fire source power increases from 4 MW to 10 MW, the critical wind speed increases by 0.5 m/s. The influence of cross-sectional shape is also significant, but it does not exhibit a monotonic relationship with the critical wind speed. Under various operating conditions, the semi-circular geometric configuration yields the lowest critical wind speed value of 2.2 m/s. When considering only the cross-sectional shape factor, the absolute change in critical wind speed is 0.2 m/s. In contrast, the absolute change in critical wind speed under different tunnel gradients is only 0.05 m/s, indicating a negligible impact on the critical wind speed.
In summary, the results demonstrate that fire source power had the dominant influence on the required critical ventilation velocity. The effect of tunnel cross-sectional shape was also significant, showing a non-monotonic relationship with the key outcome variables. In contrast, the influence of longitudinal slope on these parameters was comparatively limited.
4. Discussion
The primary finding of this study is the quantified influence and relative importance of three key factors—fire source power, cross-sectional shape, and longitudinal slope—on the critical ventilation velocity and temperature field in tunnel fires. The study found that a semi-circular cross-section alters smoke flow, causing the critical ventilation velocity to deviate from classical models based on rectangular cross-sections (such as the Kennedy formula). A comparison with current design codes, such as PIARC and NFPA 502, reveals that existing empirical formulas have limitations when applied to non-rectangular cross-sections and slopes. Therefore, this study aims to advance tunnel fire protection design from generic models toward scenario-specific, precise assessments that balance safety and economic considerations.
Fire source power emerged as the dominant parameter, consistent with its fundamental role in defining the fire plume’s buoyancy and momentum [23,24]. The non-monotonic influence of cross-sectional shape can be attributed to altered flow interactions. The smooth, continuous curvature of the semi-circular roof likely facilitates a more coherent ceiling jet with reduced flow separation and friction losses [25], allowing the ventilation flow to control the smoke layer more efficiently at a lower velocity. This finding aligns with observations that geometry affects local airflow structure and resistance [26], but highlights that a shape minimizing flow disturbance may paradoxically reduce the critical flow requirement despite potentially higher peak temperatures due to heat accumulation under the curved ceiling. Regarding slope, the observed minor decrease in with increasing uphill gradient aligns with the established principle that slope assists buoyancy in directing smoke downstream [27,28]. The limited magnitude of this effect within the studied slope range (±2%) and at the moderate fire power (4 MW) suggests that for many practical design scenarios, the influence of slope may be secondary compared to and shape, as also noted in some prior studies [29,30].
This study used a steady fire source and simplified boundary conditions to eliminate transient fire spread and real-world obstacles. Although the parameter ranges are representative, they are not exhaustive. To address these limitations, future research should examine transient fires, incorporate more realistic boundary conditions (such as rough walls and the presence of other vehicles or obstacles), and investigate the combined effects of multiple interacting factors. Furthermore, these numerical results should be validated against large-scale experimental data to enhance the model’s predictive reliability in complex real-world scenarios.
5. Conclusion
This paper presents a numerical study analyzing the combined influence of fire power, cross-sectional geometry, and slope on the critical ventilation velocity in a full-scale semi-circular tunnel. The main findings are as follows:
(1) Fire heat release rate has the most significant impact on the critical velocity, showing a strong positive correlation. An increase from 4 MW to 10 MW resulted in a 22.7% rise in required critical velocity to fully suppress smoke back-layering.
(2) For a constant cross-sectional area, the critical velocity does not vary linearly with tunnel height. The semi-circular section exhibited a 15% lower critical velocity compared to a flat-arch tunnel. This aerodynamic advantage is likely due to its streamlined ceiling contour that fosters a stable ceiling jet with minimized flow separation, thereby enhancing smoke control efficiency.
(3) Within the typical operational range of longitudinal slopes (±2%), the gradient has a comparatively minor and nuanced effect on critical velocity for the tested 4 MW fire. An uphill slope assists the buoyancy-driven flow, slightly reducing the required velocity, whereas the effect of a downhill slope was less pronounced and requires further investigation at higher resolutions or steeper gradients to decouple it from numerical uncertainties.
(4) The study demonstrates that solely using smoke back-layering length to determine the critical velocity can lead to an underestimation of energy waste or incomplete safety assurance. Integrating visibility height and temperature criteria ensures that the determined critical velocity comprehensively meets personnel evacuation safety requirements.
This research provides a theoretical basis and practical data for the precise and energy-efficient design of longitudinal ventilation systems in tunnels with semi-circular and other non-rectangular cross-sections. Future work will focus on transient fire growth models, the effect of vehicle obstructions, and experimental validation to further generalize these findings.
References
- KANG Xiaolong, WANG Wei, ZHAO Yaohua, and HUA Gaoying, “Investigation of Road Tunnel Fire and Study on Countermeasures,” China Saf. Sci. J., vol. 17, no. 5, pp. 110–116, 2007.
- Y. Xie, G. Yao, and Z. Yuan, “Study on Maximum Temperature Under Multi-Factor Influence of Tunnel Fire Based on Machine Learning,” Buildings, vol. 15, no. 18, p. 3401, Sep. 2025. [CrossRef]
- F. Tang, Z. Cao, A. Palacios, and Q. Wang, “A study on the maximum temperature of ceiling jet induced by rectangular-source fires in a tunnel using ceiling smoke extraction,” Int. J. Therm. Sci., vol. 127, pp. 329–334, May 2018. [CrossRef]
- Y. Alarie, “Toxicity of Fire Smoke,” Crit. Rev. Toxicol., vol. 32, no. 4, pp. 259–289, Jan. 2002. [CrossRef]
- J. Glasa, L. Valasek, P. Weisenpacher, and L. Halada, “Cinema Fire Modelling by FDS,” IC-MSQUARE 2012: INTERNATIONAL CONFERENCE ON MATHEMATICAL MODELLING IN PHYSICAL SCIENCES, vol. 410. in Journal of Physics Conference Series, vol. 410. 2013. [CrossRef]
- K. Yang, J. Sun, F. Xiang, S. Yang, and W. Ling, “Research on Fire Smoke Characteristics and Key Factor Evaluation in High-Altitude Traffic Tunnels,” FIRE Mater., vol. 49, no. 2, pp. 233–246, Mar. 2025. [CrossRef]
- T. Zhang, G. Wang, J. Li, Y. Huang, K. Zhu, and K. Wu, “Experimental study of back-layering length and critical velocity in longitudinally ventilated tunnel fire with various rectangular cross-sections,” FIRE Saf. J., vol. 126, Dec. 2021. [CrossRef]
- Z. Li, X. Liu, Y. Cheng, G. Li, D. Xu, R. Zheng, P. Shen, and B. Li, “Comparative Study of Longitudinal Temperature Decay of Weak and Strong Plumes with Different Tunnel Aspect Ratios,” 2024, SSRN. [CrossRef]
- W. Chen, Y. Liu, Z. Cao, P. Zhou, C. Chen, Z. Wu, Z. Fang, L. Yang, and X. Liu, “A Study on the Influence of Mobile Fans on the Smoke Spreading Characteristics of Tunnel Fires,” FIRE-Switz., vol. 7, no. 11, Nov. 2024. [CrossRef]
- J. Zhao, Z. Wang, Z. Hu, X. Cui, X. Peng, and J. Zhang, “Effects of Fire Location and Forced Air Volume on Fire Development for Single-Ended Tunnel Fire with Forced Ventilation,” Fire, vol. 6, no. 3, p. 111, Mar. 2023. [CrossRef]
- J. Luo, Z. Xu, F. Li, and J. Zhao, “Effect of vehicular blocking scene on smoke spread in the longitudinal ventilated tunnel fire,” CASE Stud. Therm. Eng., vol. 14, Sep. 2019. [CrossRef]
- Y. Qin, Z. Yang, Z. Zhang, X. Zhu, S. Dai, and W. Jiang, “Experimental Study on Smoke Spreading Laws for Tunnel Fires with Moving Fire Source,” FIRE-Switz., vol. 7, no. 11, Nov. 2024. [CrossRef]
- Y. Tang and L. Yin, “Numerical studies on the critical velocity in bending tunnel,” Case Stud. Therm. Eng., vol. 19, p. 100579, Jun. 2020. [CrossRef]
- Zhao Zhongjie, Wang Tiantian, and Chen Liye, “Trace and examination of the ventilation environment of the highway tunnel fire based on the software known as FDS,” J. Saf. Environ., vol. 20, no. 2, pp. 495–503, 2020.
- X. Zhao, M. Ni, W. Wang, H. Wang, and J. Wang, “Study on the Fire Characteristics of Dual Fire Sources and the Difference in Power Temperature of Different Fire Sources in Tunnel,” FIRE-Switz., vol. 7, no. 8, Aug. 2024. [CrossRef]
- K. B. McGrattan and G. P. Forney, “Fire dynamics simulator (version 6) : user’s guide,” National Institute of Standards and Technology, Gaithersburg, MD, 2020. [CrossRef]
- S. Bari and J. Naser, “Simulation of smoke from a burning vehicle and pollution levels caused by traffic jam in a road tunnel,” Tunn. Undergr. Space Technol., vol. 20, no. 3, pp. 281–290, May 2005. [CrossRef]
- S. Zhao, H. Yang, T. Xu, F. Wang, C. Li, and L. Xu, “Effects of ambient pressure on fire-induced buoyancy driven plume dispersion and re-entrainment behavior in a street canyon,” ATMOSPHERIC Pollut. Res., vol. 14, no. 4, Apr. 2023. [CrossRef]
- L. H. Hu, F. Tang, D. Yang, S. Liu, and R. Huo, “Longitudinal distributions of CO concentration and difference with temperature field in a tunnel fire smoke flow,” Int. J. Heat Mass Transf., vol. 53, no. 13–14, pp. 2844–2855, Jun. 2010. [CrossRef]
- E. O. L. Lantsoght, R. A. Sanabria Diaz, and M. A. N. Hendriks, “Progress over the last decade on how fire affects the structural behavior of tunnel linings,” Eng. Struct., vol. 347, p. 121713, Jan. 2026. [CrossRef]
- E. Blanchard, P. Boulet, S. Desanghere, E. Cesmat, R. Meyrand, J. P. Garo, and J. P. Vantelon, “Experimental and numerical study of fire in a midscale test tunnel,” Fire Saf. J., vol. 47, pp. 18–31, Jan. 2012. [CrossRef]
- H. J. Tao, G. Zhu, Y. Xia, and Y. Zhao, “Influence of mechanical smoke exhaust on smoke spread in underground tunnel,” Case Stud. Therm. Eng., vol. 12, pp. 47–54, Sep. 2018. [CrossRef]
- N. Johansson, E. Ronchi, R. Scozzari, and M. Fronterrè, “The use of multi-zone modelling for tunnel fires,” Tunn. Undergr. Space Technol., vol. 134, p. 104996, Apr. 2023. [CrossRef]
- Y. Oka and G. T. Atkinson, “Control of smoke flow in tunnel fires,” Fire Saf. J., vol. 25, no. 4, pp. 305–322, Nov. 1995. [CrossRef]
- H. Mohammadi, R. Shobayry, and J. Habimana, “A comprehensive novel approach for fire analysis of tunnels structural design,” Tunn. Undergr. Space Technol., vol. 136, p. 105100, Jun. 2023. [CrossRef]
- X. Liu, G. Zhu, R. Pan, G. Xu, and L. He, “Experimental study on wall fire behavior produced by n-heptane pools with different aspect ratios and orientations in arched tunnel,” Case Stud. Therm. Eng., vol. 28, p. 101438, Dec. 2021. [CrossRef]
- S. Liu, “STUDY ON THE EFFECT OF WIDTH AND SLOPE OF LARGE CROSS-SECTION TUNNEL ON CRITICAL VELOCITY OF FIRE,” Therm. Sci., vol. 28, no. 2C, pp. 1635–1649, 2024. [CrossRef]
- P.-W. Tung, H.-C. Chung, N. Kawabata, M. Seike, M. Hasegawa, S.-W. Chien, and T.-S. Shen, “Numerical Study of Smoke Distribution in Inclined Tunnel Fire Ventilation Modes Considering Traffic Conditions,” Buildings, vol. 13, no. 3, p. 714, Mar. 2023. [CrossRef]
- H.-R. Hsieh, H.-C. Chung, N. Kawabata, M. Seike, M. Hasegawa, S.-W. Chien, and T.-S. Shen, “Assessment Method Integrating Visibility and Toxic Gas for Road Tunnel Fires Using 2D Maps for Identifying Risks in the Smoke Environment,” Fire, vol. 6, no. 4, p. 173, Apr. 2023. [CrossRef]
- Z. Su, Y. Li, H. Zhong, J. Li, B. Li, S. Kang, and Y. Huang, “Evaluating the impact of tunnel slope on critical velocity and confinement velocity in metro tunnel carriage fires,” Tunn. Undergr. Space Technol., vol. 154, p. 106141, Dec. 2024. [CrossRef]
Figure 1.
Semicircular highway tunnel model diagram.
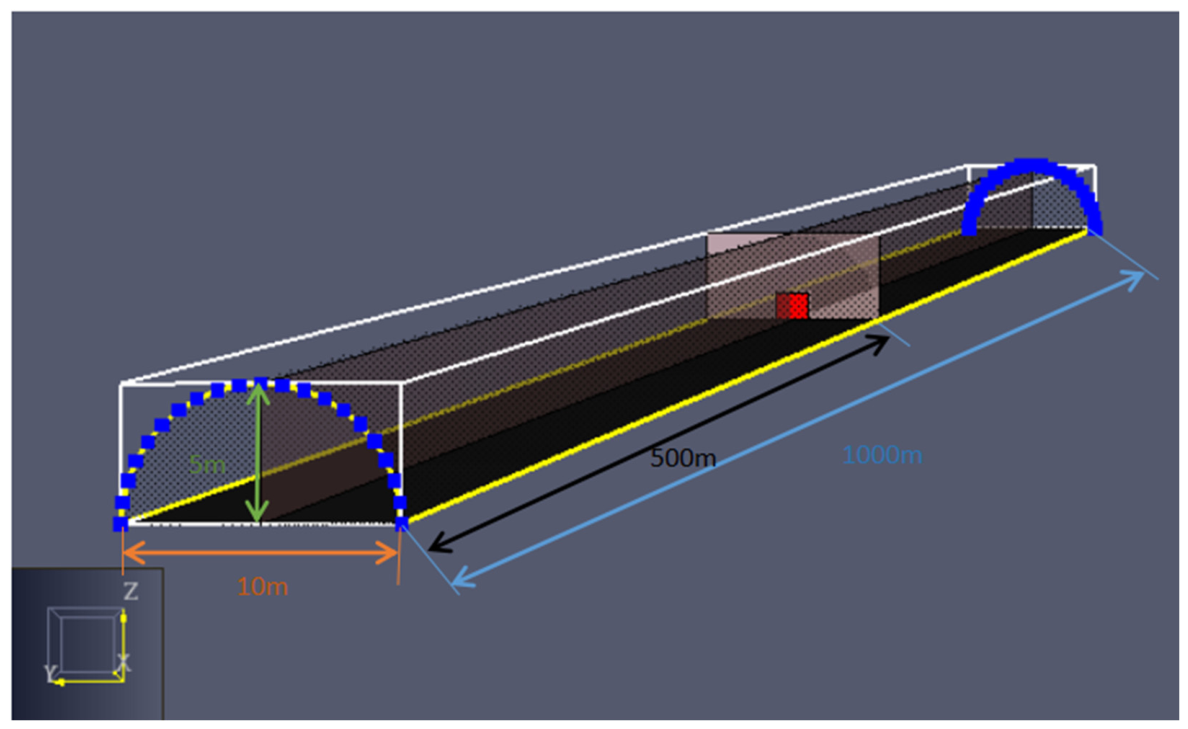
Figure 2.
Longitudinal smoke spread diagram in tunnels with zero longitudinal wind speed.
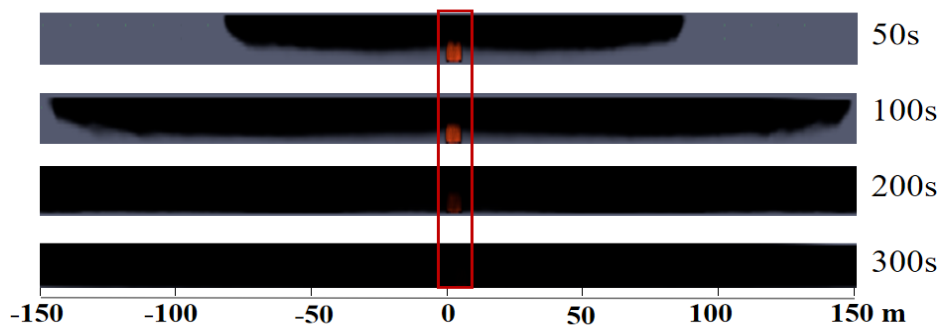
Figure 3.
Longitudinal temperature distribution diagram in tunnels with zero longitudinal wind speed.
Figure 3.
Longitudinal temperature distribution diagram in tunnels with zero longitudinal wind speed.
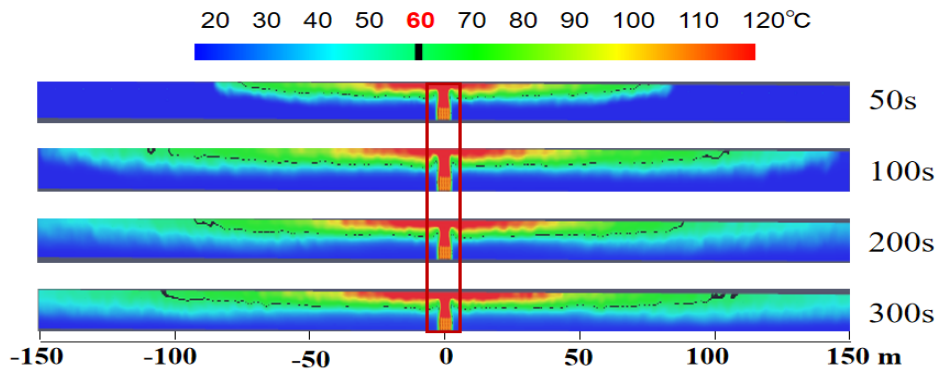
Figure 4.
Longitudinal smoke spread diagram in tunnels under different longitudinal wind speeds.
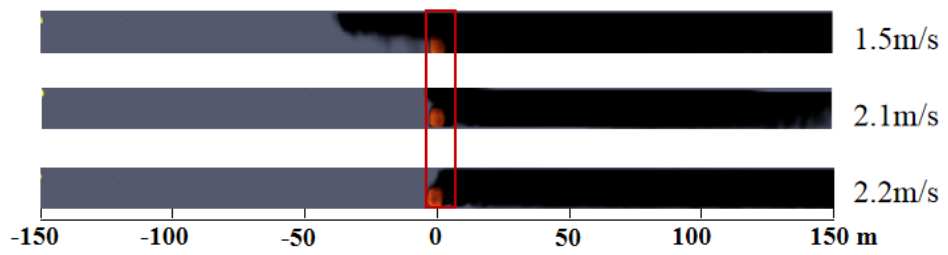
Figure 5.
Longitudinal temperature distribution diagram in tunnels under different longitudinal wind speeds.
Figure 5.
Longitudinal temperature distribution diagram in tunnels under different longitudinal wind speeds.
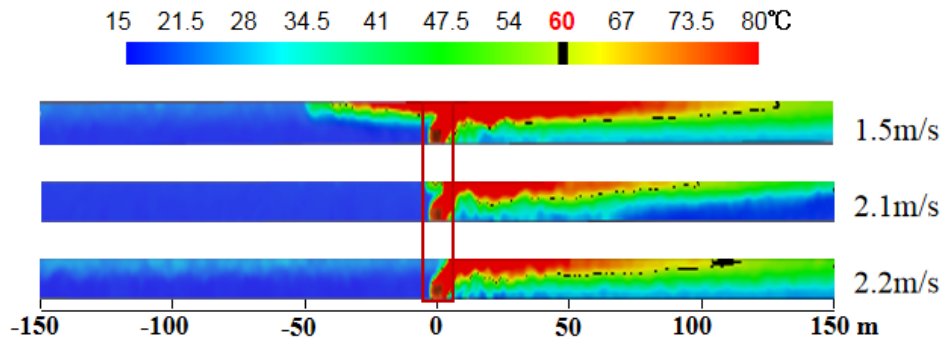
Figure 6.
Non-critical and critical wind speed diagram.

Figure 7.
Longitudinal smoke spread diagram in tunnels at different fire source powers: (a) 4 MW, (b) 6 MW, (c) 8 MW, (d) 10 MW.
Figure 7.
Longitudinal smoke spread diagram in tunnels at different fire source powers: (a) 4 MW, (b) 6 MW, (c) 8 MW, (d) 10 MW.
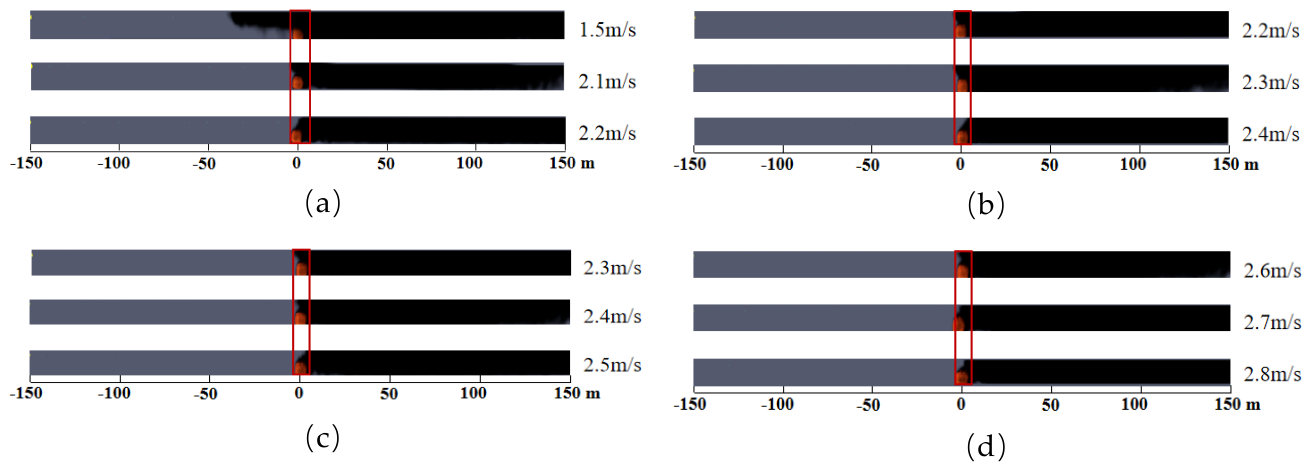
Figure 8.
Longitudinal temperature distribution diagram in tunnels at different fire source powers: (a) 4 MW, (b) 6 MW, (c) 8 MW, (d) 10 MW.
Figure 8.
Longitudinal temperature distribution diagram in tunnels at different fire source powers: (a) 4 MW, (b) 6 MW, (c) 8 MW, (d) 10 MW.
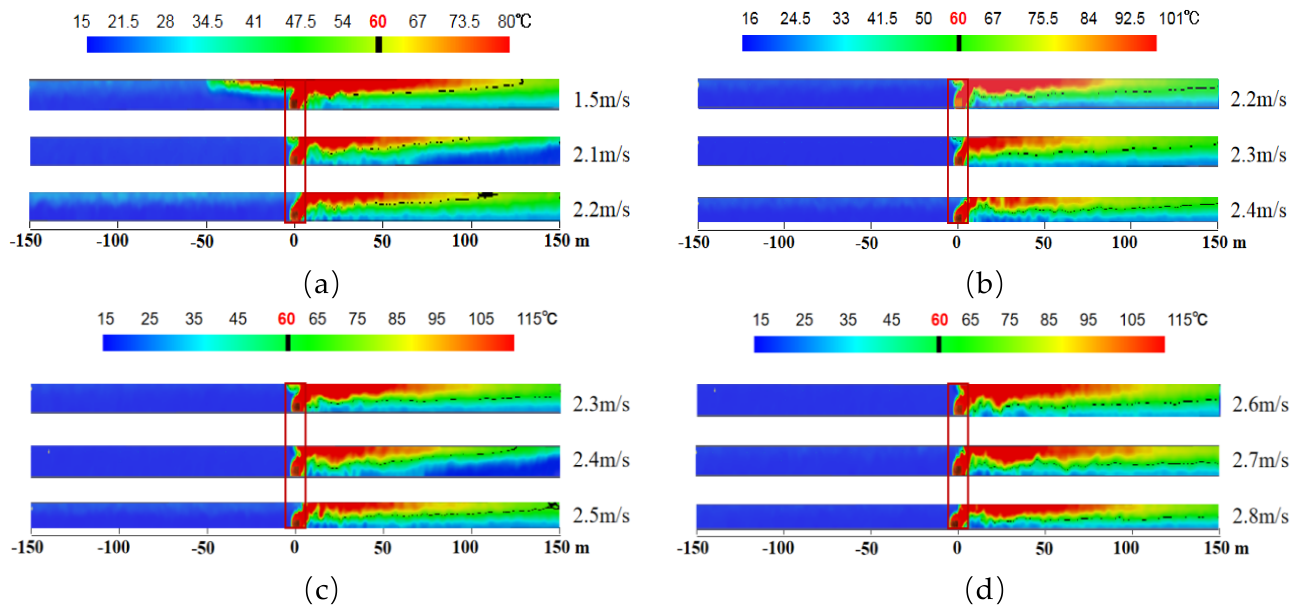
Figure 9.
Back-layering smoke flow discrimination chart at different fire source powers: (a) 4 MW, (b) 6 MW, (c) 8 MW, (d) 10 MW.
Figure 9.
Back-layering smoke flow discrimination chart at different fire source powers: (a) 4 MW, (b) 6 MW, (c) 8 MW, (d) 10 MW.
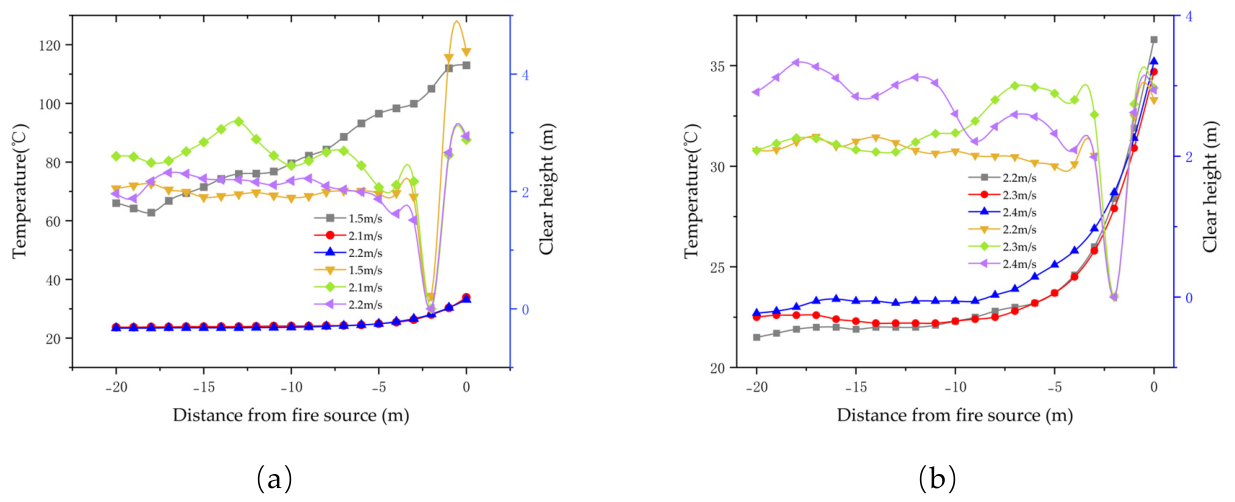
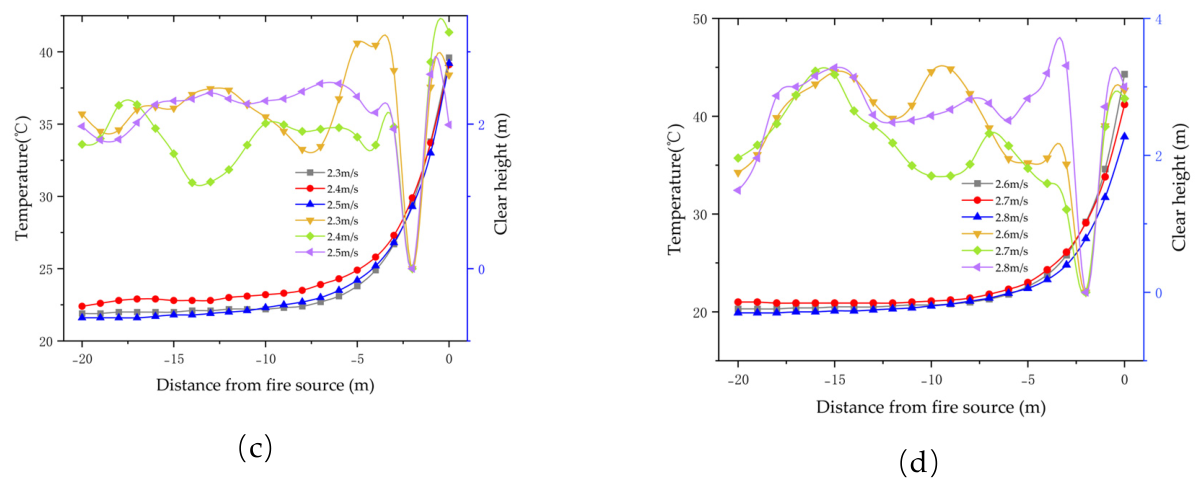
Figure 10.
Schematic diagrams of four tunnel cross-sections: (a) an arched tunnel with a height of 2 meters, (b) an arched tunnel with a height of 3 meters, (c) an arched tunnel with a height of 4 meters, (d) a semi-circular tunnel with a crown height of 5 meters.
Figure 10.
Schematic diagrams of four tunnel cross-sections: (a) an arched tunnel with a height of 2 meters, (b) an arched tunnel with a height of 3 meters, (c) an arched tunnel with a height of 4 meters, (d) a semi-circular tunnel with a crown height of 5 meters.
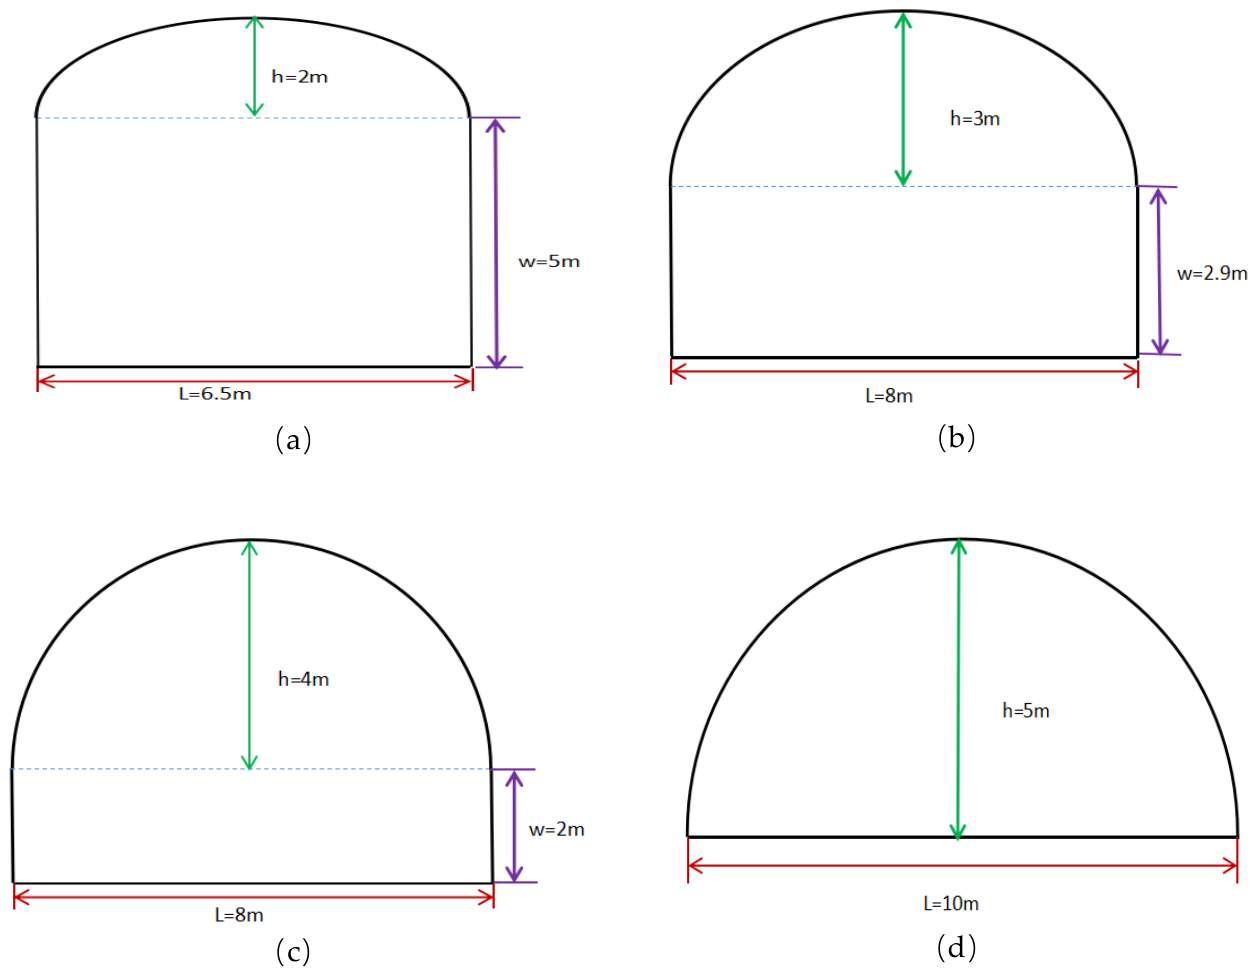
Figure 11.
Longitudinal smoke spread diagram in tunnels with different cross-sections: (a) an arched tunnel with a height of 2 meters, (b) an arched tunnel with a height of 3 meters, (c) an arched tunnel with a height of 4 meters, (d) a semi-circular tunnel with a crown height of 5 meters.
Figure 11.
Longitudinal smoke spread diagram in tunnels with different cross-sections: (a) an arched tunnel with a height of 2 meters, (b) an arched tunnel with a height of 3 meters, (c) an arched tunnel with a height of 4 meters, (d) a semi-circular tunnel with a crown height of 5 meters.
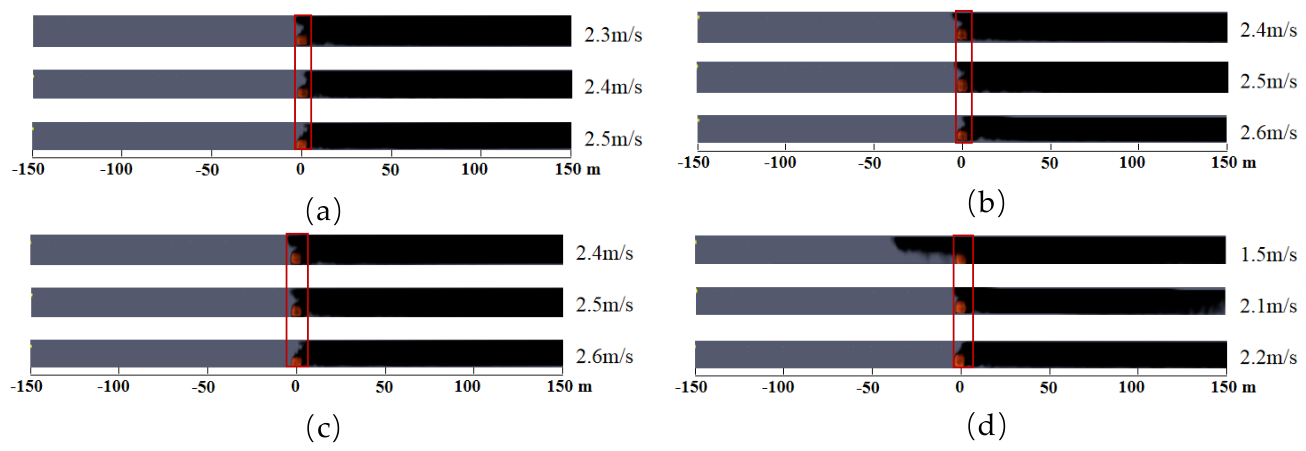
Figure 12.
Longitudinal temperature distribution diagram in tunnels with different cross-sections: (a) an arched tunnel with a height of 2 meters, (b) an arched tunnel with a height of 3 meters, (c) an arched tunnel with a height of 4 meters, (d) a semi-circular tunnel with a crown height of 5 meters.
Figure 12.
Longitudinal temperature distribution diagram in tunnels with different cross-sections: (a) an arched tunnel with a height of 2 meters, (b) an arched tunnel with a height of 3 meters, (c) an arched tunnel with a height of 4 meters, (d) a semi-circular tunnel with a crown height of 5 meters.
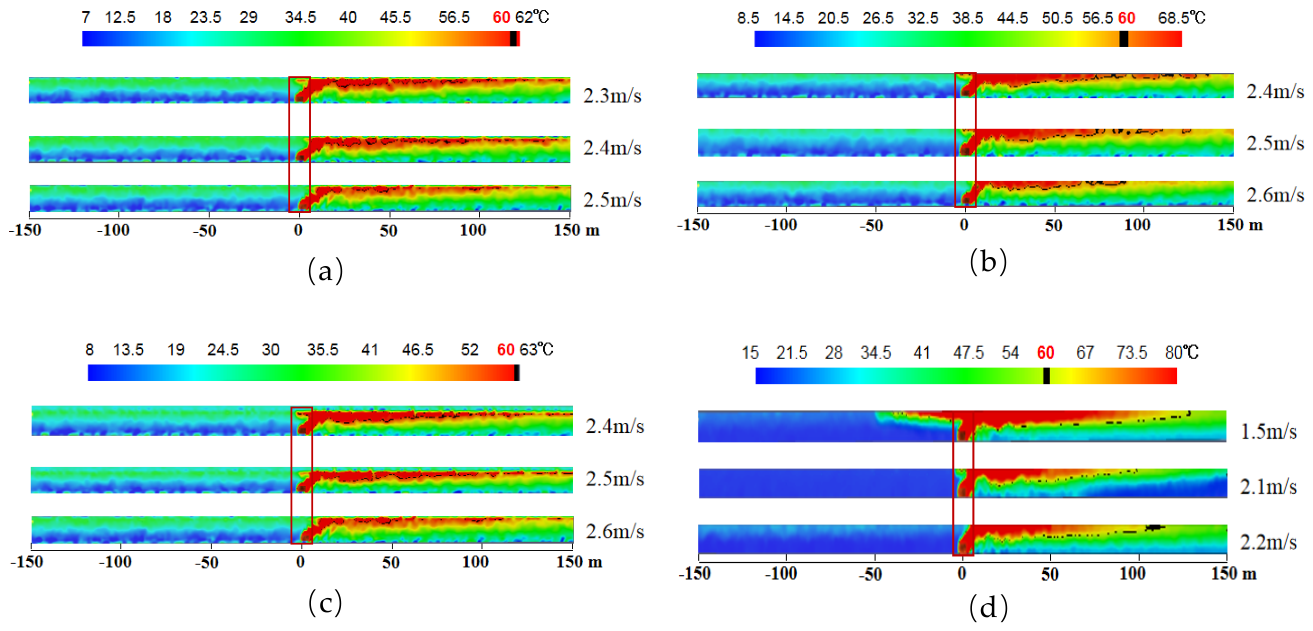
Figure 13.
Back-layering smoke flow discrimination chart with different cross-sections: (a) an arched tunnel with a height of 2 meters, (b) an arched tunnel with a height of 3 meters, (c) an arched tunnel with a height of 4 meters, (d) a semi-circular tunnel with a crown height of 5 meters.
Figure 13.
Back-layering smoke flow discrimination chart with different cross-sections: (a) an arched tunnel with a height of 2 meters, (b) an arched tunnel with a height of 3 meters, (c) an arched tunnel with a height of 4 meters, (d) a semi-circular tunnel with a crown height of 5 meters.
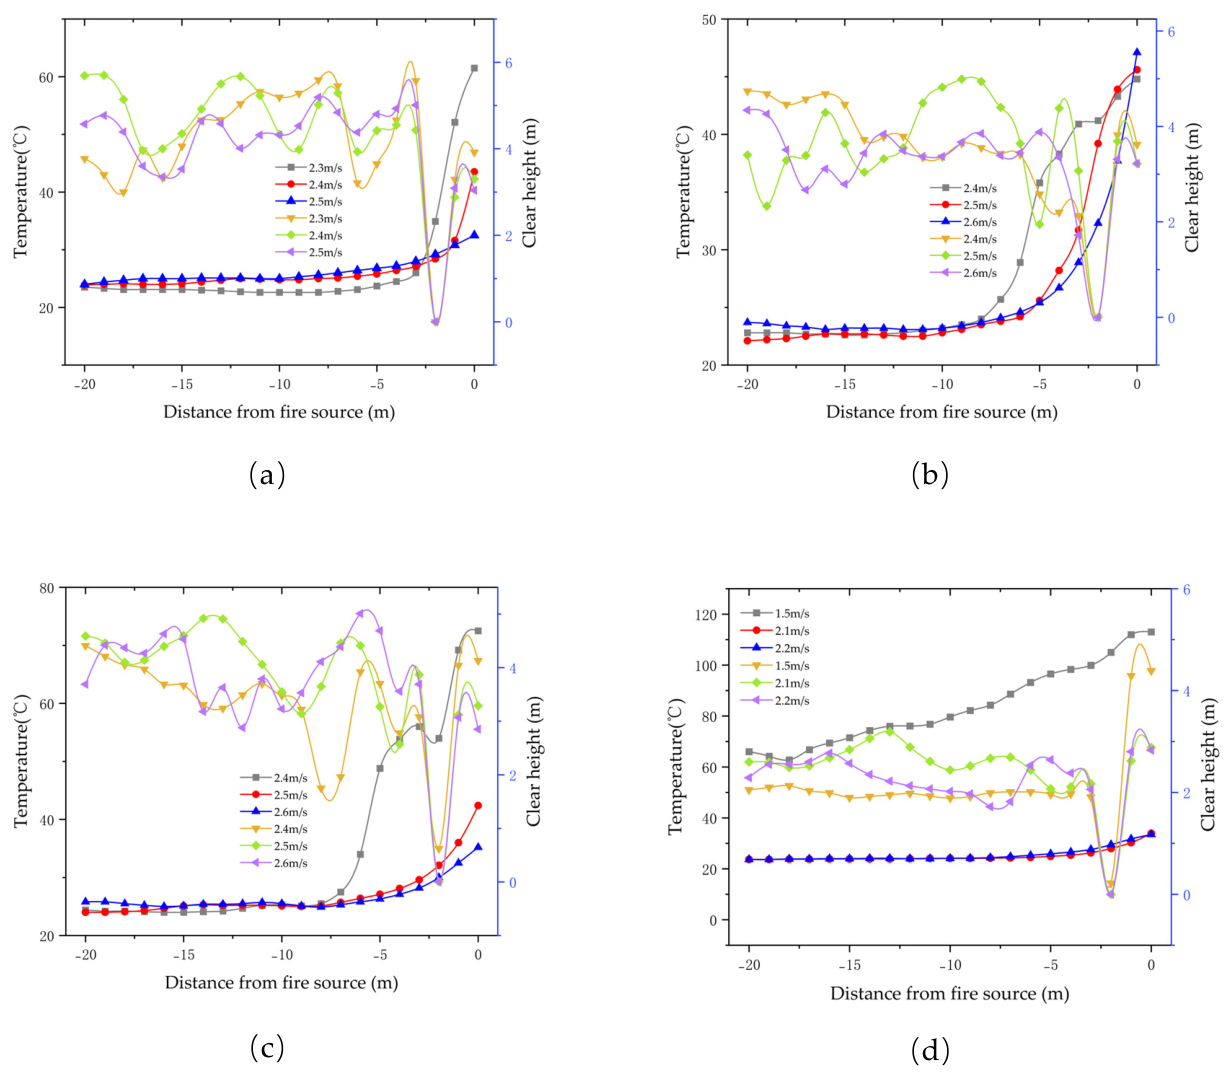
Figure 14.
Longitudinal smoke spread diagram in tunnels at different grades: (a) slope of -1%, (b) slope of 0%, (c) slope of +1%, (d) slope of +2%.
Figure 14.
Longitudinal smoke spread diagram in tunnels at different grades: (a) slope of -1%, (b) slope of 0%, (c) slope of +1%, (d) slope of +2%.
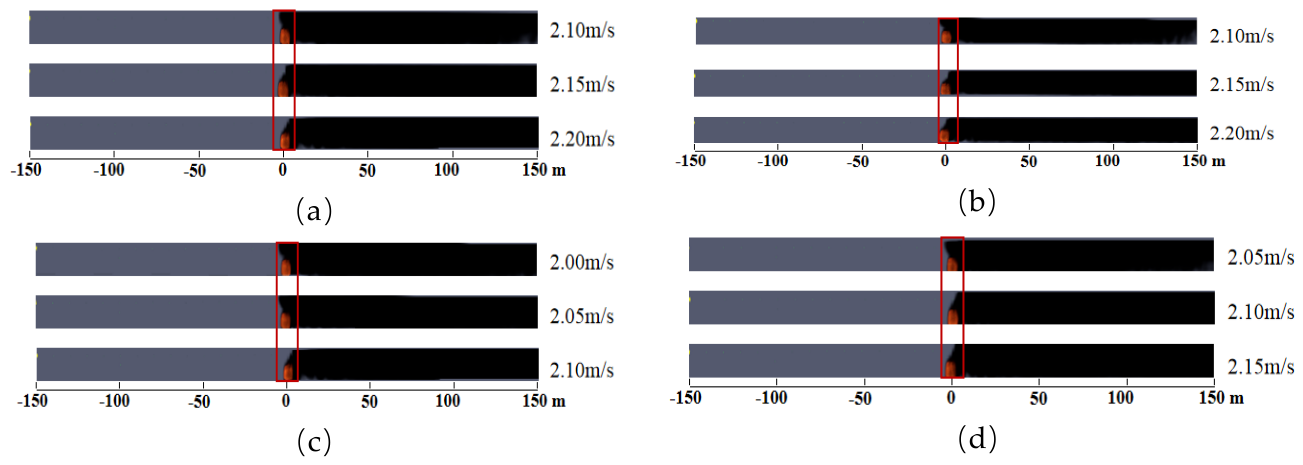
Figure 15.
Longitudinal temperature distribution diagram in tunnels at different grades: (a) slope of -1%, (b) slope of 0%, (c) slope of +1%, (d) slope of +2%.
Figure 15.
Longitudinal temperature distribution diagram in tunnels at different grades: (a) slope of -1%, (b) slope of 0%, (c) slope of +1%, (d) slope of +2%.
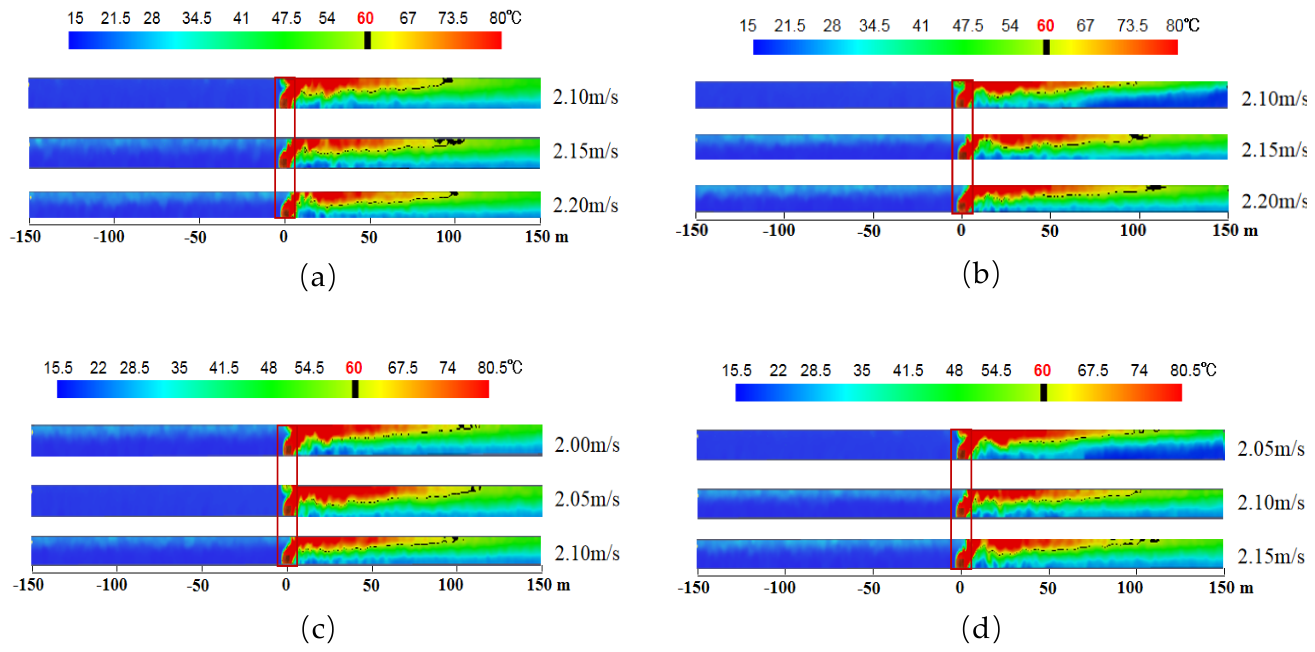
Figure 16.
Back-layering smoke flow discrimination chart at different grades: (a) slope of -1%, (b) slope of 0%, (c) slope of +1%, (d) slope of +2%.
Figure 16.
Back-layering smoke flow discrimination chart at different grades: (a) slope of -1%, (b) slope of 0%, (c) slope of +1%, (d) slope of +2%.
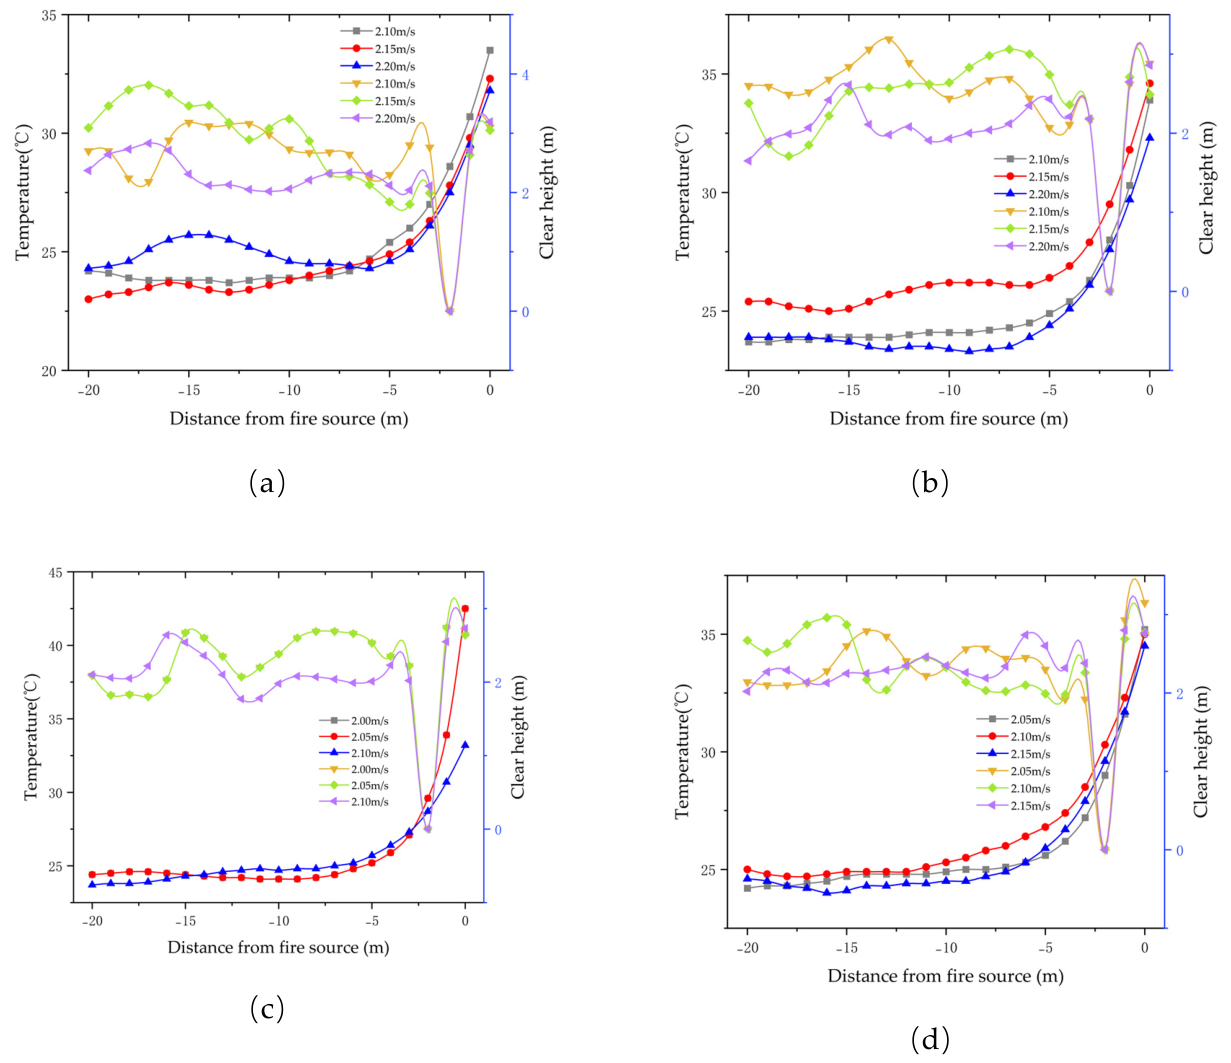

Table 1.
Sensitivity analysis table of critical wind speed of tunnel fire to absolute change of key parameters.
Table 1.
Sensitivity analysis table of critical wind speed of tunnel fire to absolute change of key parameters.
| Fire source power | Cross-sectional shape | Gradient | Critical wind speed | Absolute variation of single factor |
| 4 MW | 5 m | 0% | 2.2 m/s | 0.5 m/s |
| 6 MW | 2.4 m/s | |||
| 8 MW | 2.6 m/s | |||
| 10 MW | 2.7 m/s | |||
| 4 MW | 2 m | 0% | 2.4 m/s | 0.2 m/s |
| 3 m | 2.6 m/s | |||
| 4 m | 2.6 m/s | |||
| 5 m | 2.2 m/s | |||
| 4 MW | 5 m | -1% | 2.15 m/s | 0.05 m/s |
| 0% | 2.15 m/s | |||
| 1% | 2.10 m/s | |||
| 2% | 2.10 m/s |
Disclaimer/Publisher’s Note: The statements, opinions and data contained in all publications are solely those of the individual author(s) and contributor(s) and not of MDPI and/or the editor(s). MDPI and/or the editor(s) disclaim responsibility for any injury to people or property resulting from any ideas, methods, instructions or products referred to in the content. |
© 2026 by the authors. Licensee MDPI, Basel, Switzerland. This article is an open access article distributed under the terms and conditions of the Creative Commons Attribution (CC BY) license (http://creativecommons.org/licenses/by/4.0/).
Copyright: This open access article is published under a Creative Commons CC BY 4.0 license, which permit the free download, distribution, and reuse, provided that the author and preprint are cited in any reuse.


