

Submitted:
01 May 2026
Posted:
06 May 2026
You are already at the latest version
Abstract
The purpose of the present study was to carry out measurements of the activity concentrations of radon (222Rn) and thoron (220Rn) in homes, to calculate the annual effective inhalation dose and the induced risk of lung cancer associated with the exposure to 222Rn and 220Rn, for individuals living in the towns of Moanda and Franceville, in Gabon. One hundred (100) radon-thoron detectors of the brand RADUET were deployed in these localities, 50 per city, i.e., one detector per home. The results of the radon concentrations varied in the range 91-156 Bq m-3 in Moanda, with arithmetic and geometric mean values of 113.2 ± 2.8 Bq m−3 and 111.8 (1.0) Bq m−3, respectively, and in the range 76-139 Bq m-3 in Franceville, with arithmetic and geometric mean values of 105.0 ± 1.9 Bq m−3 and 104.2 (1.0) Bq m−3, respectively. These mean values are above the United Nations Committee on the Effects of Atomic Radiation (UNSCEAR) worldwide average values of 40 Bq m−3 (arithmetic mean) and 45 Bq m−3 (geometric mean). For thoron, the concentrations varied in the range 3-945 Bq m−3, with arithmetic and geometric mean values of 69.5 ± 0.4 Bq m−3 and 24.4 (3.9) Bq m−3 at Moanda, and in the range 4-78 Bq m−3, with arithmetic and geometric mean values of 18.4 ± 0.4 Bq m−3 and 11.6 (0.4) Bq m−3 in Franceville. This shows that the mean concentration values of thoron were significantly higher than the UNSCEAR world average value of 10 Bq m−3. Overall, the highest concentration values were recorded in the town of Moanda and the lowest in the town of Franceville. The dose values estimated in the present study demonstrate that the population in Moanda and in Franceville may be exposed to a relatively significant potential risk of radon-and thoron-induced cancer.
Keywords:
radon
; thoron
; RADUET
; activity concentration
; effective inhalation dose
; cancer risk
; Moanda
; Franceville
; Gabon
1. Introduction
Radon (222Rn) and thoron (220Rn) are colorless, odorless, and chemically inert radioactive gases. They come respectively from the decay chains of uranium (238U) and thorium (232Th) present in the earth's crust [1]. Their disintegration gives rise to elements that are themselves radioactive, to each stabilize at a lead isotope [2]. Radon has been recognized by the World Health Organization (WHO) as a carcinogen agent since 1988 [3], and classified by the International Center for Radiological Protection (IARC) as a definite lung carcinogen agent since 1987 [4]. As an isotope of radon, thoron has almost the same chemical characteristics as radon although fewer studies exist on thoron because of its short half-life (55.6 s) unlike radon (3.8 d). However, it may not be appropriate to neglect the contribution of thoron because ignoring it may lead to an overestimation of radon and/or an underestimation of radiological risk in the environment [5]. Exposure to these gases is a public health problem in many parts of the world. According to an epidemiological investigation by Darby et al consecutive exposure to 100 Bq.m-3 of radon results in a 16% excess relative risk of lung cancer [6,7]. The World Health Organization recommended that a radon concentration of 100 Bq.m−3 should be used as a national reference value and stated that this value was justified from a public health effect perspective [7]. The UNSCEAR estimates that 52% of exposure to natural radiation is attributable to radon and thoron, radon contributing to 92% (i.e., 1.15mSv) and thoron to 8% (i.e., 0.1 mSv) [8,9]. This indicate that the contribution of thoron may be considered as negligible. However, a study by Sondzo et al [9,10] showed that the annual effective dose due to exposure to radon and thoron in Djeno, Republic of Congo, was 1.11 mSv, radon and thoron contributing to 51% and 49%, respectively. This demonstrates the fact that the contribution of thoron is not always negligible and highlights the importance of carrying thoron measurements. In this regard, studies are being carried out more and more all over the world to evaluate radon and thoron concentrations and the associated radiation doses indoors [11,12,13,14]. Studies for the evaluation of radon and thoron concentrations in dwellings in Moanda and Franceville, Gabon, originate from the work undertaken by Loemba et al in 2018 [15]. This work showed the presence of a high concentration of 226Ra and 232Th, the direct precursors of radon and thoron, in the soil, rocks and water in the Mounana region [15,16,17]. The main aim of the present study was to provide an answer to the lack of radiological data by directly measuring radon and thoron concentrations in homes in Moanda and Franceville, using RADUET passive radon-thoron discriminating nuclear trace detectors (commercially known as RADUET). The concentrations measured will be used to assess annual effective doses, in order to deduce the risk of lung cancer induced by exposure to these radioactive gases using conventional formulas.
2. Materials and Methods
Study Area
Gabon is a Central African country, the only one in the world to date to have had the privilege of hosting natural nuclear reactors, discovered in the Mounana region in the south-east of the country in 1972 [18]. The areas selected in our study are located close to this region, in the province of Haut-Ogooué where the climate is equatorial. The soil of this province is rich in minerals, notably gold, manganese and uranium which rest on the sedimentary basin of Franceville [18]. Moanda is a town located 41 km from Franceville. This mining town of around 71,099 inhabitants (worldometer, 2024), the capital of Lemboumbi-Leyou department, it is the capital of manganese, the extraction of which is the region's main activity for COMILOG (the world's leading manganese producer). It is the province's second-largest city after Franceville [18]. Franceville is a city in Gabon, the capital of the province of Haut-Ogooué and the Mpassa department, it is the third city in the country in terms of number of inhabitants. It is watered by the Ogooué River as well as the Mpassa River and is located 512 km southeast of Libreville, the capital of the country. Its population is 132,895 inhabitants (worldometer, 2024). The climate is subequatorial due to a short three-month dry season from June to August [19,20].
Deployment and Collect of Detectors
The measurement points were chosen on the basis of random sampling. Data collection took place in two main stages. The first was the awareness campaign on radon, presentation of measuring devices to the concerned populations and deployment of detectors. This stage took place from 04/15/2022 to 04/16/2022 in Moanda and from 04/17/2022 to 19/04/2022 in Franceville (Table 1). One RADUET detector was placed per dwelling in a room frequently occupied, the living room in the present case. The houses involved in the study were all one-level cement brick houses with direct ground contact. The detectors were hung far from openings, between 1.5 and 2 m height from the floor and approximately 20 cm from the wall [21,22]. The second stage was the detector collect campaign. The collect of each device occurred on 06/28/2022 in Moanda and on 06/30/2022 in Franceville, about 2.5 months after the deployment phase. The loss rate was approximately 10%. The samples, grouped and packaged in hermetically sealed plastic packaging, were sent to the Institute of Radiation Emergency Medicine of Hirosaki University in Japan for physicochemical analysis and determination of concentrations.
Measurement of Radon and Thoron Activity Concentrations
RADUET
To determine radon and thoron concentrations, we used commercially available RADUET monitors, which are passive integrated radon-thoron discriminators, developed at the National Center for Radiological Sciences (NIRS) in Japan, were used [23]. These detectors have two diffusion chambers with different ventilation rates and each chamber contains a 10×10 mm2 CR-39 chip. The latter was manufactured by Nagas Landauer, Ltd (Ibaraki, Japan) and used to detect alpha particles emitted by radon and thoron, with a detection limit of 2 Bq m-3 for radon and 8 Bq m-3 for thoron [24]. The RADUET contains two chambers, the low diffusion rate chamber is made of electron conductive plastic with an interior volume of 30 cm3, the high diffusion rate chamber is also made of the same material, but has six holes in the wall and is covered with an electro-conductive sponge to prevent radon and thoron daughter products as well as aerosols from infiltrating inside (Figure 1) [25]. While one chamber (the low air-exchange rate chamber) measures radon predominantly, the other chamber measures both radon and thoron (the high air-exchange rate chamber) [25,26]. Thoron concentration is then determined by subtracting the result from one detector to the other. The difference in track density between the two CR-39 plates makes it possible to estimate the concentrations of radon and thoron separately. In fact, radon gas can diffuse into the low air-exchange rate chamber through an invisible gap which functions as a high air-diffusion rate barrier. Due to its very short half-life, only a very small amount of thoron goes into the chamber compared to the amount for radon with a longer half-life [27]. Additionally, both radon and thoron can get into the high air-exchange rate chamber.
Laboratory Analysis
The CR-39 plates were chemically etched for 24 h in a 6 M NaOH solution (240 g in 1 L of water) at 60 °C. The counting of nuclear tracks was done using a microscope and a camera for observation, images were recorded on a memory card then transferred to an appropriate computer so that they can be read by the image software "Image-J".
The average concentrations of radon and thoron were calculated using the following formulas [9,26,27]:
where:
where and are the mean concentrations of radon and thoron during the exposure period in Bq.m−3. dL and dH are the total alpha track densities (track.m−2) taken from the CR-39 detectors of low and high air-exchange rate chambers. fRn1 and fTn1 are the radon and thoron calibration coefficients for the low air-exchange rate chamber in tracks.m−2.kBq−1.m3 h−1. fRn2 and fTn2 are the radon and thoron calibration coefficients for the high air-exchange rate chamber in tracks.m−2 .kBq−1 m3 .h−1. t is the exposure time in hours and b is the background track density of the CR-39 detector in tracks.m−2. It should be noted that the low air-exchange rate chamber limits diffusion of thoron into the chamber, therefore, fRn1 >> fTn1. The high air-exchange rate chamber is designed such that both radon and thoron can diffuse into the chamber easily, and fRn2 ~ fTn2. [28,29,30]. The calibration procedure for the RADUETs used in this study was detailed by Kranrod et al (2020) [30].
Calculation of Annual Effective Dose and Cancer Risk Index
Annual Effective Inhalation Dose
- -
- For radon
- -
- For thoronwhere:
- -
- is the effective inhalation dose for radon;
- -
- effective inhalation dose for thoron;
- -
- EETC (Bq m-3) is the measured activity concentration of thoron progeny determined in reference [31];
- -
- and (Bq m-3) are the measured activity concentrations of radon and thoron, respectively;
- -
- FepRn and FeqTn (unitless) are the equilibrium factors for radon and thoron, respectively; FepRn was taken equal to 0.4 and FeqTn was determined by experimental measurements, (for Franceville), (for Moanda) [22];
- -
- are the effective dose conversion factors for radon and thoron progeny (respectively equal to 9 and 40);
- -
- Focc (unitless) is the occupancy factor recommended for the studied area, equal to 0.6 [32];
- -
- T (h) is the exposure time which was adjusted to one years, i.e., 8760 h.
Excess Lifetime Cancer Risk
3. Results
Figure 2 and Figure 3 show that radon and thoron concentrations measured in Moanda and Franceville follow a lognormal distribution.
Table 2 shown us the minimum and maximum concentrations, the arithmetic, geometric means and median in Bq m-3 of radon and thoron measured in homes in Moanda and Franceville.
Figure 4 shown On the other hand, the boxplots of radon and thoron activity concentrations maesured in the cities of Moanda and Franceville, with the World Health Organization and International Commission on Radiological Protection (ICRP) reference level for activity concentrations to radon and thoron.
In Table 3 we have the minimum and maximum annual effective dose inhalation, the arithmetic, geometric means and median in mSv of radon and thoron measured in homes in Moanda and Franceville.
4. Discussion
Radon and Thoron Concentrations
Of the 100 detectors deployed, i.e., 50 per city, 44 were recovered in Moanda and 47 in Franceville, the remaining (10) were considered as losses. Figure 2 and Figure 3 show that radon and thoron concentrations measured in Moanda and Franceville follow a lognormal distribution. As shown in Table 2 (and Figure 4), in Moanda, the lowest radon concentration was 91 ± 1 Bq m−3 (Cité CB) and the highest was 156 ± 1 Bq m−3 (Cité Alliance). In Franceville, the lowest and highest radon concentrations measured were 76 ± 1 Bq m−3 (Maba military camp) and 139 ± 1 Bq m−3 (Potos neighbourhood), respectively. For thoron, the concentrations varied in the range 3-945 Bq m−3 (Oasis neighbourhood) in Moanda and in the range 4-78 Bq m−3 in Franceville. Figure 4 also show a significant number of outliers in the distribution of thoron concentrations measured in Moanda that may be considered as abnormal values.
The arithmetic and geometric means for radon were, respectively, 113.2 ± 2.8 Bq m−3 and 111.8 (1.0) Bq m−3 in Moanda, and 105.0 ± 1.9 Bq m−3 and 104.2 (1.0) Bq m−3 in Franceville. These average values were above 100 Bq m−3, the WHO reference level [3], but they were below 300 Bq m−3, the reference level recommended by the International Commission on Radiological Protection (ICRP) [31,39]. Compared to the worldwide arithmetic and geometric mean values, 40 Bq m−3 and 45 Bq m−3, respectively [12,13,14], the arithmetic and geometric mean values determined in this study in Moanda and Franceville are greater than twice the UNSCEAR worldwide average values. Concerning thoron, the arithmetic and geometric mean values were, respectively, 69.0 ± 0.4 Bq m−3 and 24.4 ± 3.9 Bq m−3 in Moanda, and 18 ± 0.4 Bq m−3 and 12.2 ± 0.4 Bq m−3 in Franceville. These average values are 1.2 to 6.9 times greater than the UNSCEAR world average value of 10 Bq m−3 [12]. The main reason that may explain the high values of radon and thoron concentrations observed in Moanda and Franceville, compared to the UNSCEAR worldwide estimated values, is that these two cities are located in the province of Haut-Ogooué, characterized by the geological formation called the Francevillian, rich in elements such as uranium, manganese and others.
Overall, only 5 homes (11.4%) had thoron concentrations greater than 100 Bq m−3 and 1 home had thoron concentration much greater than 300 Bq m−3. The results obtained showed a predominance of thoron than radon in Moanda, unlike in Franceville. We can assume that 232Th may be more abundant than 238U in Moanda. A thorough characterization of Moanda soil may show to what extent this finding holds.
Annual Effective Inhalation Dose
The annual effective inhalation dose values estimated for radon were in the range 1.7-3.0 mSv with an arithmetic mean value of 2.1 ± 0.05 mSv for Moanda, and in the range 1.4-2.6 mSv with an arithmetic mean value of 2.0 ± 0.04 mSv for Franceville (Table 3). These average effective inhalation dose values are above the UNSCEAR determined value of 1.1 mSv [12]. For thoron, the annual effective inhalation dose values obtained varied in the range 0.1-5.7 mSv, with an arithmetic mean value of 1.0 mSv in Mounana, and in the range 0.02-0.8 mSv with an arithmetic average value of 0.4 mSv in Franceville. These values are higher than the UNSCEAR estimated value of 0.09 mSv [12]. Furthermore, the median values indicate that 50% of the homes sampled have a dose greater than or equal to 0.6 mSv in Moanda and 0.3 mSv in Franceville.
Excess Lifetime Cancer Risk
The ELCR is the probability that an individual will develop or die from cancer during their lifetime due to exposure to radon. The ELCR range obtained for radon and for Moanda was 6-10 %, with an average value of 7 %. For Franceville, ELCR range was 5-9 % with an average value of 7 %. The ELCR values determined in this study are higher than the action level of 1.3% given by the United States Environmental Protection Agency (EPA) [33]. However, the conversion coefficient for this rate in Gabon has not yet been established. It is worth noting that no cancer risk coefficient has been specifically determined for Gabon. Therefore, the ELCR values estimated in the present study may have been overestimated. Furthermore, the cancer risk coefficient value (RF =5.5 ×10⁻² Sv-1) used to compute ELCR in this study was derived from different types of ionizing radiation exposure, not only radon exposures. Considering the first results obtained in this study, radiation protection remedial measures should be considered.
Comparison with Selected Studies in the Literature
Several studies on radon and thoron have been carried out around the world (Table 4). They used different types of appropriate detectors to measure activity concentrations in dwellings.
The results obtained in our study are close to those of two regions in Cameroon (southern Adamawa and Poli/Lolodorf) [25,32]. They are about twice the concentration values measured in Mvangan (Cameroon) and Bonghwa County (South Korea), and lower (arithmetic mean) than those determined in Ebolowa (Cameroon) and in west south Africa [10,11,34,35]. They are up to about 4 times the concentration values obtained in Djeno in Congo [9].
Thoron concentrations measured in this study (Table 5) in Moanda are intermediate (arithmetic means) between those determined in Djeno (Congo) and Lolodorf (Cameroon).
Values (arithmetic mean, geometric mean, median) determined in this study in Franceville are globally lower than those measured elsewhere.
5. Conclusion
The aim of this study was to carry out direct measurements of radon and thoron concentrations in dwellings in Moanda and Franceville (Gabon), and to calculate the annual effective inhalation dose and the induced cancer risk associated with the exposure to thoron and radon in these localities. Regarding radon, the study revealed that the geometric and arithmetic average concentrations estimated in our study were significantly higher than the UNSCEAR world average values. These average values were also above the WHO reference level but they remained below the ICRP reference level. Concerning thoron, the arithmetic and geometric mean values were up to 6.9 times greater than the UNSCEAR world average value. About 11% of homes had thoron concentrations greater than the WHO reference level for radon and, in one instance, thoron concentration exceeded the ICRP reference level for radon. Furthermore, the results obtained showed a predominance of thoron than radon in Moanda. The average effective inhalation dose values due to radon and thoron exposures were higher than the UNSCEAR determined values for radon and thoron. The excess lifetime cancer risk values estimated in the present study were higher than the EPA action level. The dose values and ELCR estimated in the study demonstrate that the population in Moanda and in Franceville may be exposed to a relatively significant potential risk of radon-and thoron. and their progeny induced cancer. and their progeny. We recommend more representative studies, also for the case of other dwelling types, to confirm or invalidate these conclusions for the area, but also epidemiological studies to make these results and conclusions more realistic.
Author Contributions
For research articles with several authors, a short paragraph specifying their individual contributions must be provided. The following statements should be used “Conceptualization, Sylvere Yannick Loemba Mouandza; methodology, Sylvere Yannick Loemba Mouandza; software, Tokonami Shinji; validation, Tokonami Shinji; formal analysis, Sylvere Yannick Loemba Mouandza and Ronixe Bipolo Djeune; investigation, Sylvere Yannick Loemba Mouandza, Evaldie-Domonique Durastanti-Rabenga Mombo, Ndong Wilfried and Ronixe Bipolo Djeune; resources, Philippe Ondo Meye; data curation, Philippe Ondo Meye; writing—original draft preparation, Sylvere Yannick Loemba Mouandza and Philippe Ondo Meye; visualization, Beaud Conrad Mabika Ndjembidouma; supervision, Sylvere Yannick Loemba Mouandza and Ndong Wilfried; project administration, Thierry Blanchard Ekogo, Tokonami Shinji and Germain Hubert Ben-Bolie; funding acquisition, Saïdou. All authors have read and agreed to the published version of the manuscript.
Funding
Please add: This work is part of a joint project between Hirosaki University in Japan, Yaoundé University in Cameroon and Masuku University of Science and Technology in Gabon.
Acknowledgments
The first author is grateful to Profesor Benoit Gall for their help in sending the samples to the University of Hirosaki in japon.
Conflicts of Interest
Declared.
References
- Institut de Radioprotection et de Surete Nucleaire- IRSN, le radon: un gaz radioactif dans mon habitation. 2020. Available online: https://www.nouvelle aquitaine.ars.sante.fr/sites.
- N’GUESSAN Kodjo JoéI Fabrice, impact du radon sur la sante de la populaion du district d’Abidjan: cas de la commune d’Abobo, Mémoire de Master; Université Felix HOUPHOUET BOIGNY de COCODY, 2014.
- World Health Organization-WHO: handbook on indoor radon: a public health perspective; Geneva, 2009; Available online: https://www.int/publications/i/item/9789241547673.
- Organisation Mondiale de la Santé-OMS: Radon et santé, OMS. 2021. Available online: https://www.who.int/fr/news-room/fact-sheets/detail/radon-and-health.
- JEANMAIRE, L. Radioactivité naturelle des aliments. Radioprot. GEDIM. 1985, vol 20 N°1, 21–31. [Google Scholar] [CrossRef]
- Valentin, J. Rayonnement: niveaux et doses dans la- vie quotidienne. Radioprotection 1994, 29(3). [Google Scholar]
- Darby, S.; Hill, D.; Auvinen, A.; Barros-Dios, J. M.; Baysson, H.; Bochicchio, F.; Deo, H.; Falk, R.; Forastiere, F.; Hakama, M.; Heid, I.; Kreinbrock, L.; Kreuzer, M.; Lagarde, F.; Mäkeläinen, I.; Muirhead, C.; Oberaigner, W.; Pershagen, G.; Ruano-Ravina, A.; Ruosteenoja, E.; Schaffrath Rosario, A.; Tirmarche, M.; Tomášk, L.; Whitley, E.; Wichmann, H. E.; Doll, R. Radon in homes and risks of lung cancer: collaborative analysis of individual data from 13 European case-control studies. BMJ 2005, 330(7485), 223–227. [Google Scholar] [CrossRef] [PubMed]
- McLean, A.R.; Adlen, E.K.; Cardis, E. Une reformulation des bases de données scientifiques naturelles concernant les effets sur la santé des rayonnements ionisants de faible intensité. Proc. R. Soc. B., 2017. [Google Scholar] [CrossRef]
- Sondzo, J.S.; Dallou, G.B.; Ondo Meye, P. Simultaneous measurements of radon, thoron and thoron progeny and induced cancer risk assessment in Djeno, Pointe-Noire, Republic of Congo. Radiat. Prot. Dosim. 2024, V. 200(5), 437–447. [Google Scholar] [CrossRef] [PubMed]
- Mbida, M.S.; Akamba, M.B.; Manga, A. Indoor radon, external dose rate and assessment of lung cancer risk in dwellings: the case of Ebolowa town, Southern Cameroon. Int. J. Environ. Anal. Chem. 2021, 103(17), 5957–5973. [Google Scholar] [CrossRef]
- Akamba, M.B.; Manga, A.; Mbida, M.S.; et al. H., Indoor radon (222Rn) measurements and estimation of annual effective dose in Mvangan locality, south Cameroon. Radiat. Prot. Dosim. 2022, 198(20), 1565–1574. [Google Scholar] [CrossRef] [PubMed]
- United Nations Scientifc Committee on the Efect of Atomic Radiation. -UNSCEAR, Sources, efects and risks of ionizing radiation. In Lung Cancer from Exposure to Radon, AnnexB; United Nation Publication: NewYork, 2019; Available online: https://www.unscear.org/unscear/en/publications/2019.html.
- United Nations Scientifc Committee on the Effects of Atomic Radiation –UNSCEAR, Report to the General Assembly, Sources and effects of Ionizing Radiation. In New York; 1988; Volume 559, 6, pp. 1047–1048. Available online: https://www.tandfonline.com/doi/abs/10.1080/09553008914551081.
- Blanchardon1, E.; Laurier, D.; Paquet, F. Dosimétrie du radon: les points de vue de l'UNSCEAR et de la CIPR sont-ils contradictoires ? Radioprotection 2009, Vol. 44(2), 207–216. [Google Scholar] [CrossRef]
- Loemba Mouandza, S.Y.; Moubissi, A.B.; Abiama, E. Study of natural radioactivity to Assess of radiation hazards from soil samples collected from Mounana in south-east of Gabon. Int. J. Radia. Res. 2018, 16(4), 443–453. [Google Scholar]
- Loemba Mouandza, S.Y.; Moubissi, A.B.; Abiama, E.; et al. Radiation background from rock samples and hazards assessment: case of Mounana in Gabon. Int. J. Low. Radiat. 2021, Vol. 11(3/4), 259–272. [Google Scholar] [CrossRef]
- Loemba Mouandza, S.Y. Radioactivité naturelle et dose d’exposition externe dans la région de Mounana au Sud-Est du Gabon. Thèse de Doctorat/PhD, Université des Sciences et Techniques de Masuku, 2019. [Google Scholar]
- Contamination radiologique relevée en 2009 sur l'ancien site minier uranifère de COMUF-AREVA à Mounana (GABON), Note CRIIRAD N°09-118. 2009. Available online: https://www.criirad.org/sommaire_gabon/.
- Landry, L. Impacte de l'exploitation minière sur les populations de l'environnement dans les Haut-Ogooué; Braineforest, 2010. [Google Scholar]
- Peel, M.C.; Finlayson, B.L.; Mac, T.A. World of the Köppen-Geiger climate classification. Hydrol. Earth Syst. Sci. 2007, Vol. 11. [Google Scholar] [CrossRef]
- International Organization for Standardization-ISO 11665-4; Measurement of radioactivity in the environment air: radon-222 – part 4: integrated measurement method for determining average activity concentration using passive and delayed analysis. Geneva, 2021. Available online: https://www.icrp.org/publication.asp?id=ICRP%20Publication%20137.
- Loemba Mouandza, S.Y.; Saïdou; Ndong, W. Direct measurement of indoor thoron and radon progeny and estimation of inhalation dose in three cities in Gabon: Comparison of the use of thoron typical and measured equilibrium factor values. J. Environ. Ra-Dioactivity 2024, 280, 107557. [Google Scholar] [CrossRef] [PubMed]
- Tokonami, S. Characteristics of thoron (220Rn) and its progeny in the indoor environment. Int. J. Environ. Res. Public Health 2020, 17, 8769. [Google Scholar] [CrossRef] [PubMed]
- BINENG, G.S. Exposition du public à la radioactivité naturelle dans la zone à potentiel uranifère et thorifère de Lolodorf: de la mesure de la radioactivité à l'évaluation de la dose et du risque radiologique. In Thèse de l'Université de Yaoundé I; 2020. [Google Scholar]
- Saïdou; Tchuente, S.Y.F.; Bouba, O. Indoor radon measurements in the uranium regions of Poli and Lolodorf, Cameroon. J. Environ. Radioact. 2014, 136, 36–40. [Google Scholar] [CrossRef] [PubMed]
- GONDJI, D.S. Mesure de la radioactivité naturelle et des éléments de trace métalliques et évaluation de la dose et du risque radiologique à l'aide des codes RESRAD dans la zone cobalto-nickelifère de Lomié. In Thèse de Yaoundé I; 2023. [Google Scholar]
- Kranrod, C.; Tamakuma, Y.; Hosoda, M.; et al. Importance of Discriminative Measurement for Radon Isotopes and Its Utilization in the Environment and Lessons Learned from Using the RADUET Monitor. Int. J. Env. Res. Public Health 2020, 17(11), 4141. [Google Scholar] [CrossRef] [PubMed]
- Sherafat, S.; Mansour, S.N.; Mosaferi, M. First indoor radon mapping and assessment excess lifetime cancer risk in Iran. Methods X 2019, 6, 2205–2216. [Google Scholar] [CrossRef] [PubMed]
- Ndjana, N.J.E.; Manga, A.; Saïdou; et al. Natural radioactivity in building materials, indoor radon measurements, and assessment of the associated risk indicators in some localities of the Centre Region, Cameroon. Environmental Science and Pollution Research, 2022. [Google Scholar]
- C. Kranrod, Y. Tamakuma , M. Hosoda and S. Tokonami, Importance of Discriminative Measurement for Radon Isotopes and Its Utilization in the Environment and Lessons Learned from Using the RADUET Monitor, International journal of Environemental Research and Public Health,Received: 30 April 2020; Accepted: 09 June 2020; Published: 10 June 2020, Int. J. Environ. Res. Public Health 2020, 17, 4141; doi:10.3390/ijerph17114141.
- International Commission on Radiological Protection – ICRP. Occupational intakes of radionuclides: part 3. Annals of the ICRP, New York, 2017. [Google Scholar]
- Saïdou; Modibo, O.B.; Ndjana, N.J.E.; et al. Indoor radon measurements using radon track detectors and electret ionization chambers in the bauxite-bearing areas of southern Adamawa, Cameroon. Int. J. Environ. Res. Public Health 2020, 17, 67–76. [Google Scholar] [CrossRef] [PubMed]
- Agence des États-Unis pour la protection de l'environnement -US-EPA. Méthodes de réduction du radon: guide du propriétaire; Washington, 1986. [Google Scholar]
- Lee, E.R.; Chang, B.U.; Kim, H.J. Geographical distribution of indoor radon and related geological characteristics in Bonghwa County, a provisional radon-prone area in Korea. Radiat. Prot. Dosim. 2014, 167, 620–625. [Google Scholar] [CrossRef] [PubMed]
- Lindsay, R.; Newman, R.T.; Speelman, W.J. Une étude du niveau de radon dans l’air dans les maisons de Paarl (Afrique du Sud) et des termes sources associés, à l’aide de chambres à électret et spectrométrie gamma. 2008, vol. 66(11). [Google Scholar]
- Vimal, M.; Singh, S.P.; RP Chauhan, R.P.; et al. Mesure des niveaux intérieurs de radon, de thoron et de leurs descendants dans les habitations du district d'Ambala, Haryana, nord de l'Inde, à l'aide de détecteurs de traces nucléaires à semi-conducteurs. J. Roum. De Phys. 2014, 59(7). [Google Scholar]
- Sainz-Fernandez, C.; Fernadez-Villar, A.; Fuente-Merino, I. The spanish indoor radon mapping strategy; Radon Group: University of Cantabria, C/Cardenal Herrera Oria s/n 39011, Santander, Spain: Nuclear Safety Council, C/Justo Dorado 11, 28040 Madrid, Spain, 2014. [Google Scholar]
- Cile, S.; Altinsoy, N.; Celebi, N. Radon concentrations in three underground lignite mine in Turkey. In Radiation Protection Dosimétry(1); 2010; pp. 78–82. [Google Scholar]
- International Commission on Radiological Protection Publication- ICRP, Lung cancer risk from radon and progeny and statement on radon, p 115, 2010. Available online: https://www.icrp.org/publication.asp?id=icrp%20publication%20115.
Figure 1.
Layout of RADUET type detector (left). RADUET detector (above) and thoron progeny detector (below) hung in a room involved in the study (right).
Figure 1.
Layout of RADUET type detector (left). RADUET detector (above) and thoron progeny detector (below) hung in a room involved in the study (right).
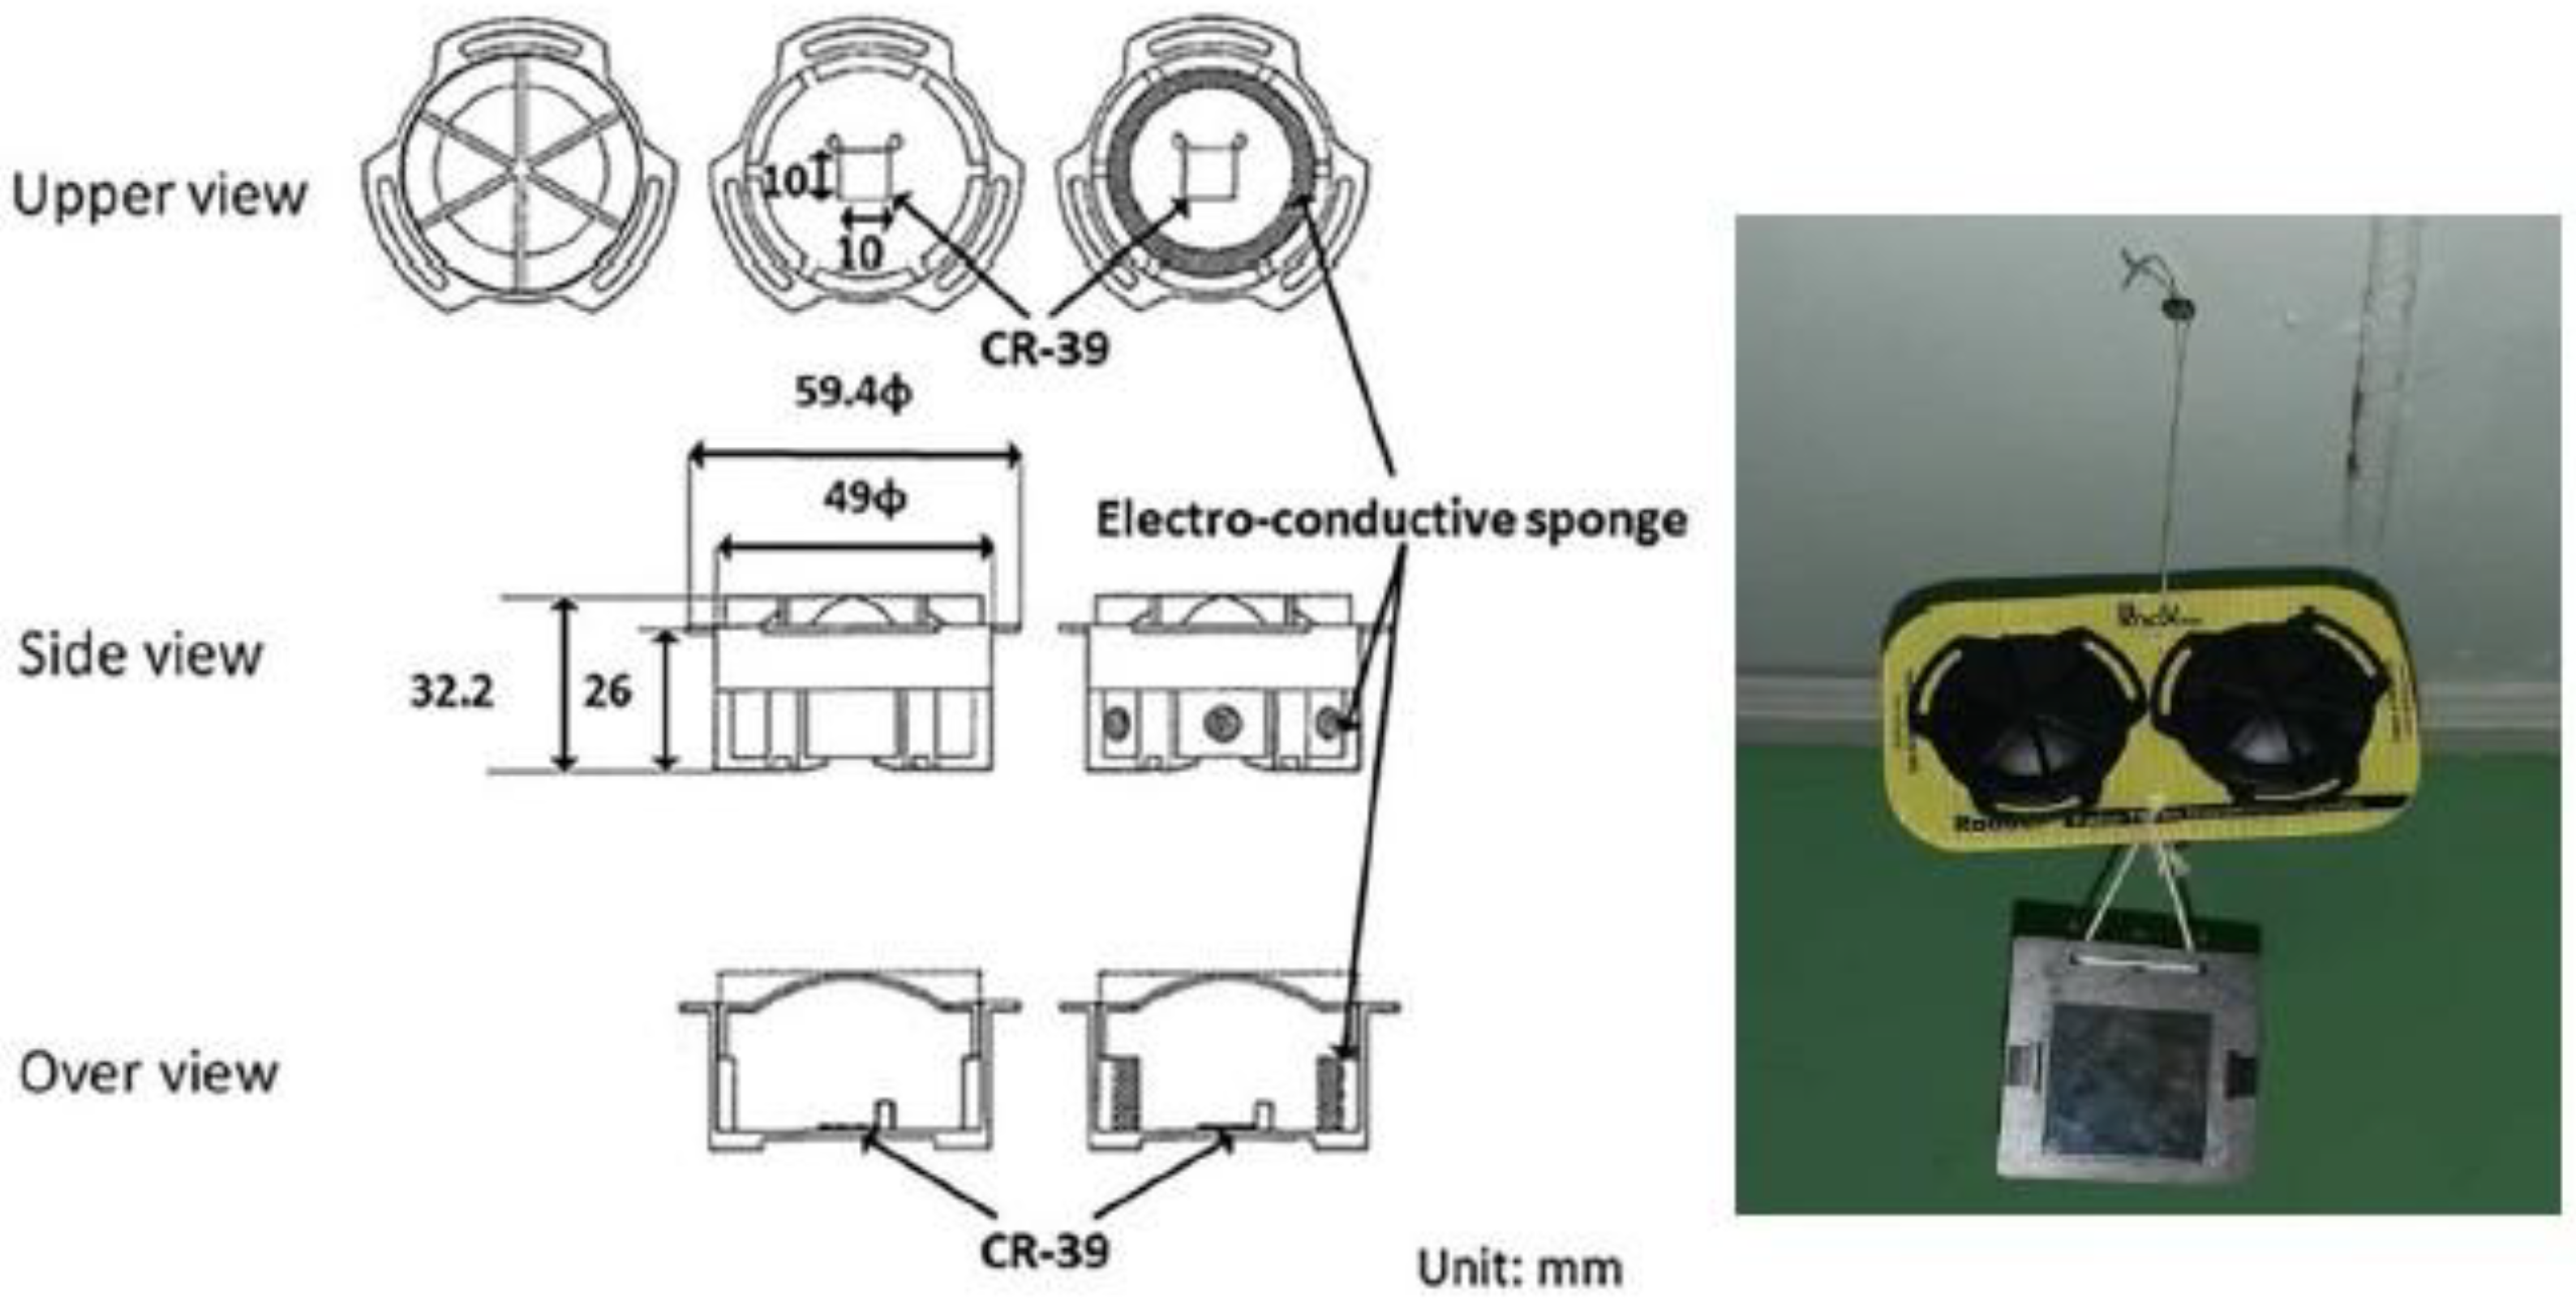
Figure 2.
Distribution of radon activity concentrations in Moanda and Franceville.
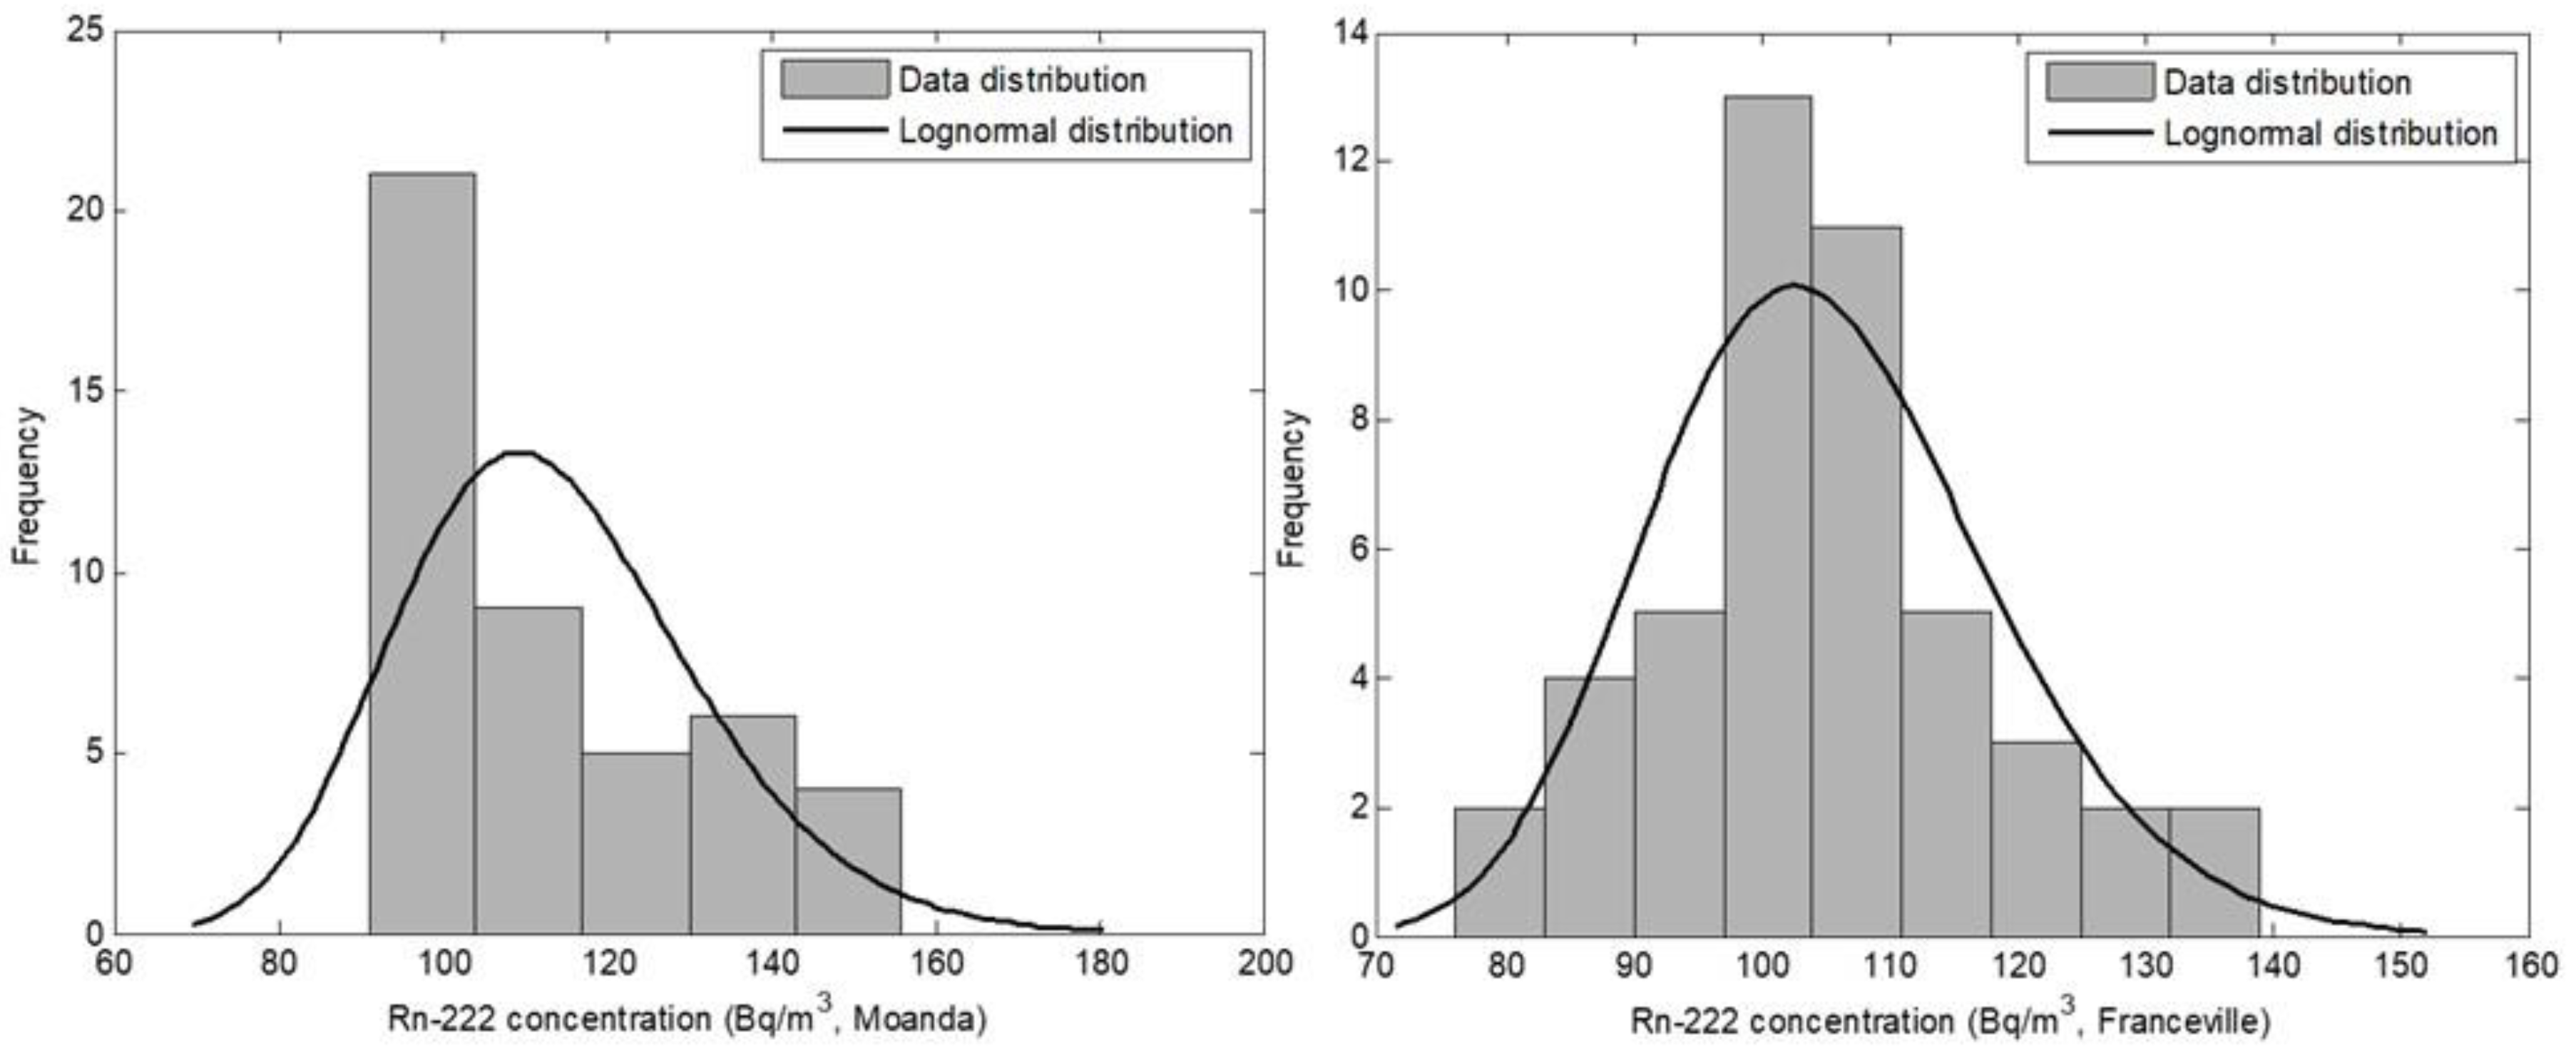
Figure 3.
Distribution of thoron activity concentrations in Moanda and Franceville.
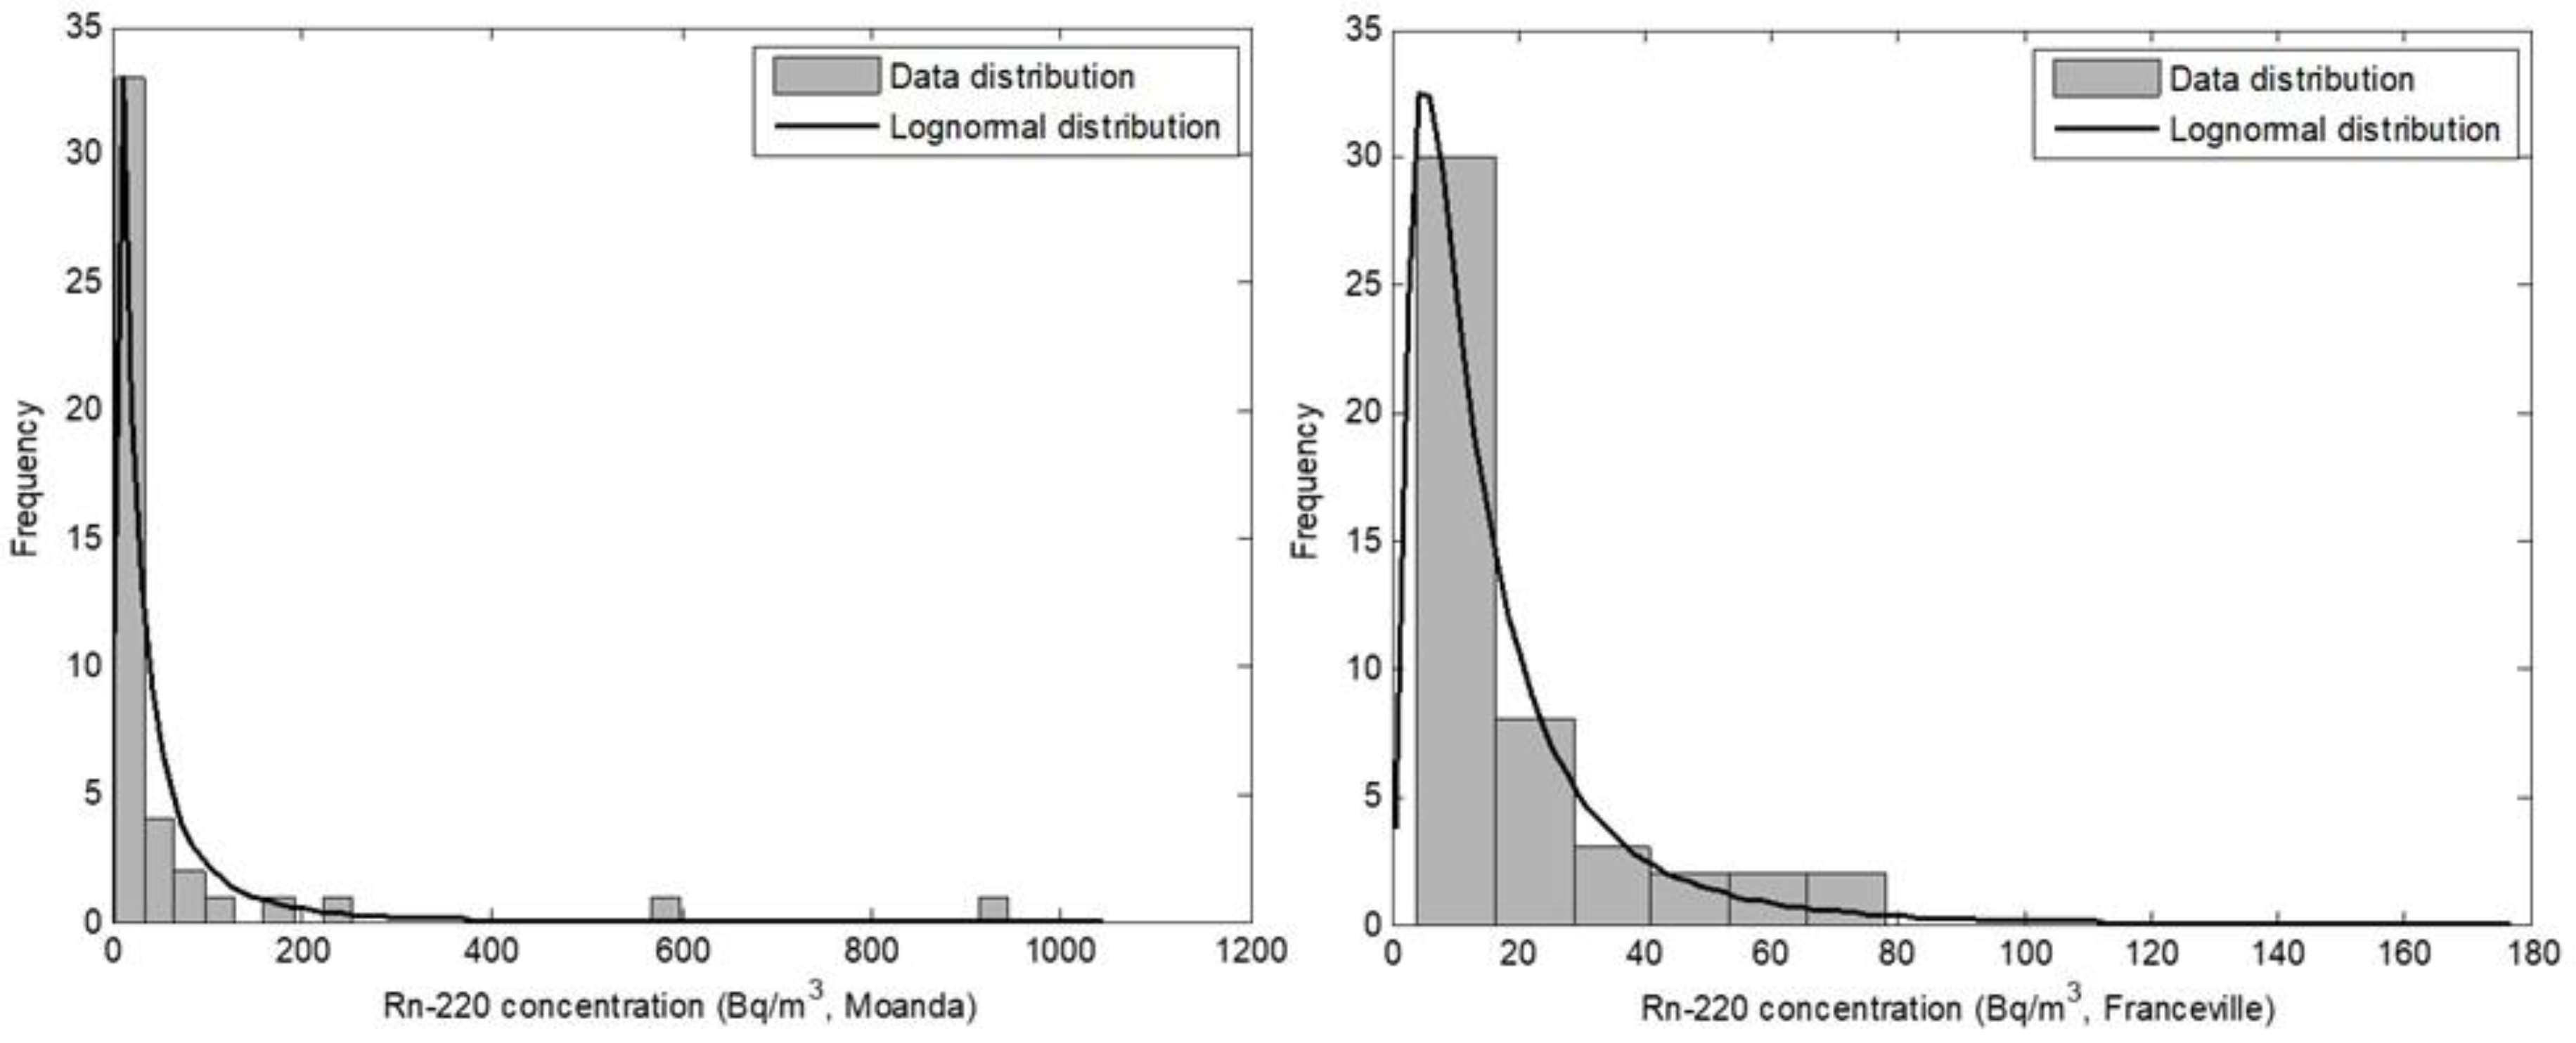
Figure 4.
Boxplots of radon and thoron activity concentrations maesured in the cities of Moanda and Franceville.
Figure 4.
Boxplots of radon and thoron activity concentrations maesured in the cities of Moanda and Franceville.
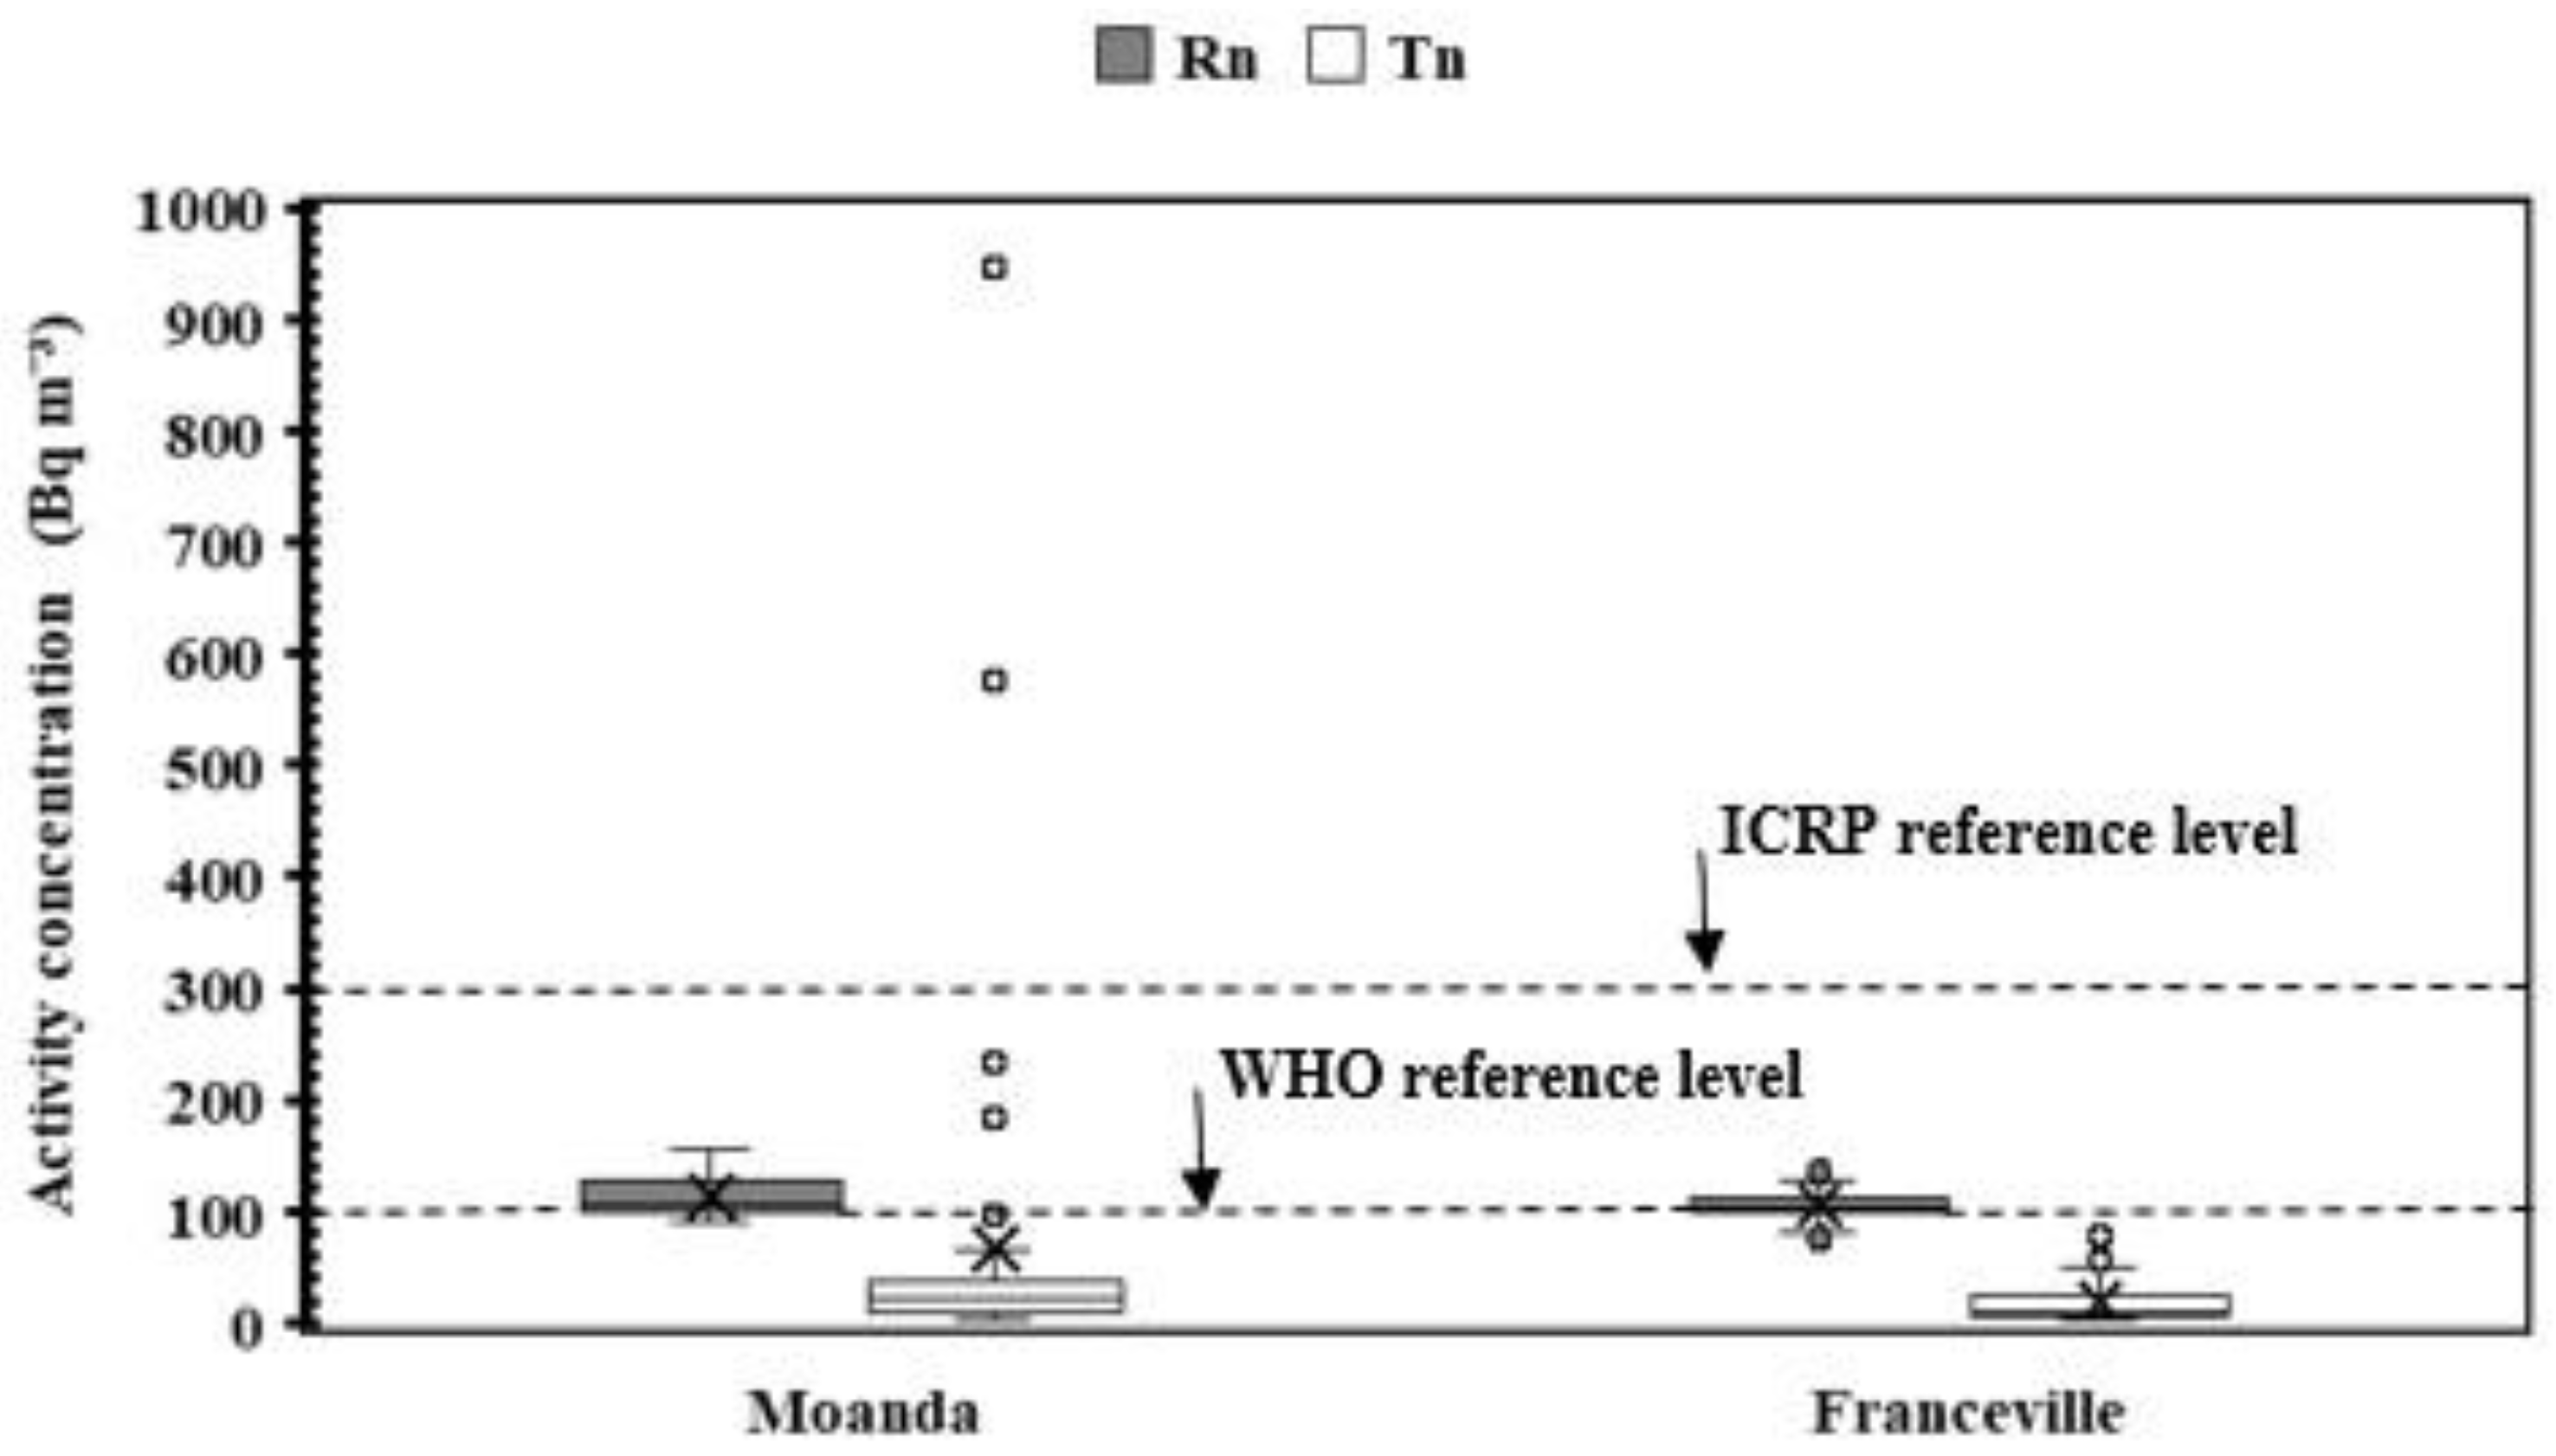

Table 1.
Geolocation of some sampled points and dates of deployment and withdrawal of detectors.
| Identification | Longitude (East) | Latitude (South) | Deployment date | withdrawal date |
| Franceville | ||||
| 365/607 | -1,632709 | 13,541254 | 19/04/2022 | 30/06/2022 |
| 303/618 | -1,632663 | 13,542738 | 19/04/2022 | 30/06/2022 |
| 324/648 | -1,640271 | 13,572224 | 20/04/2022 | 01/07/2022 |
| 307/613 | -1,641713 | 13,571272 | 20/04/2022 | 01/07/2022 |
| Moanda | ||||
| 359/717 | -1,5481 | 13,215206 | 15\04\22 | 28\06\22 |
| 353/706 | -1,54847 | 13,212875 | 15\04\22 | 28\06\22 |
| 371/742 | -1,551226 | 13,21243 | 16\04\22 | 29\06\22 |
| 368/736 | -1,561421 | 13,216027 | 16\04\22 | 29\06\22 |
Table 2.
Concentrations (Bq m-3) of radon and thoron measured in homes in Moanda and Franceville.
| Cities | Moanda | Franceville | ||
| Statistical parameters |
Radon |
Thoron |
Radon |
Thoron |
| MIN | 90.9 | 3 | 75.9 | 4 |
| MAX | 156.2 | 945 | 139.0 | 78 |
| AM ± SD | 113.2 ± 2.8 | 69.0 ± 0.4 | 105.0 ± 1.9 | 18 ± 0.4 |
| GM (GSD) | 111.8 (1.0) | 24.4 (3.9) | 104.2 (1.0) | 12.2 (0.4) |
| MEDIAN | 105.8 | 22 | 104.3 | 11 |
Table 3.
Annual effective inhalation dose in (mSv) for radon and thoron in homes in Moanda and Franceville.
Table 3.
Annual effective inhalation dose in (mSv) for radon and thoron in homes in Moanda and Franceville.
| Cities | Moanda | Franceville | ||
| Statistical parameters | Radon | Thoron | Radon | Thoron |
| MIN | 1.7 | 0.1 | 1.4 | 0.02 |
| MAX | 3.0 | 5.7 | 2.6 | 0.8 |
| AM ± SD | 2.1 ± 0.05 | 1.0 | 2.0 ± 0.04 | 0.4 |
| GM ± (GSD) | 2.1 (1.0) | - | 2.0 (1.0) | - |
| MEDIAN | 2.0 | 0.6 | 2.0 | 0.3 |
Table 4.
Comparison with selected studies on radon in the literature.
| Country | Place | AM (Bq m−3) | GM (Bq.m−3) | Range (Bq m−3) | References |
| South Africa | West | 132 | - | 28 - 465 | [35] |
| South Africa | East | 37 | - | 8 - 998 | [35] |
| South Korea | Bonghwa County | 49 | 37 | - | [34] |
| Spain | - | 95 | 56.6 | 10 - 15400 | [37] |
| Turkey | - | 81 | 57 | 1 - 1400 | [38] |
| Cameroon | Southern Adamawa | 108 | 102 | 43 - 270 | [32] |
| Cameroon | Poli, Lolodorf | 103 | 102 | 75 - 137 | [25] |
| Cameroon | Ebolowa | 135.6 | 63 | 23-2620 | [10] |
| Cameroon | Mvangan | 64 | 60 | 36-150 | [11] |
| Congo | Djeno | 29 | 28 | 20-44 | [9] |
| Gabon | Moanda | 113.2 | 111.8 | 90.9 - 156.2 | This study |
| Gabon | Franceville | 105.0 | 104.2 | 75.9 - 139.0 | This study |
Table 5.
Comparison with selected studies on thoron in the literature.
| Country | Place | AM (Bq.m−3) | GM (Bq.m−3) | Range (Bq.m−3) | MED (Bq.m−3) | References |
| India | Ambala | - | - | 1.2 - 69.2 | 14.4 | [36] |
| Cameroon | Lolodorf | 149 | 105 | 18 - 451 | 10 | [34] |
| Congo | Djeno | 29 | 28 | 20-44 | - | [9] |
| Gabon | Moanda | 69.0 | 24.4 | 4 - 78 | 22 | This study |
| Gabon | Franceville | 18 | 12.2 | 3 - 945 | 11 | This study |
Disclaimer/Publisher’s Note: The statements, opinions and data contained in all publications are solely those of the individual author(s) and contributor(s) and not of MDPI and/or the editor(s). MDPI and/or the editor(s) disclaim responsibility for any injury to people or property resulting from any ideas, methods, instructions or products referred to in the content. |
© 2026 by the authors. Licensee MDPI, Basel, Switzerland. This article is an open access article distributed under the terms and conditions of the Creative Commons Attribution (CC BY) license (http://creativecommons.org/licenses/by/4.0/).
Copyright: This open access article is published under a Creative Commons CC BY 4.0 license, which permit the free download, distribution, and reuse, provided that the author and preprint are cited in any reuse.