Submitted:
03 May 2026
Posted:
04 May 2026
You are already at the latest version
Abstract
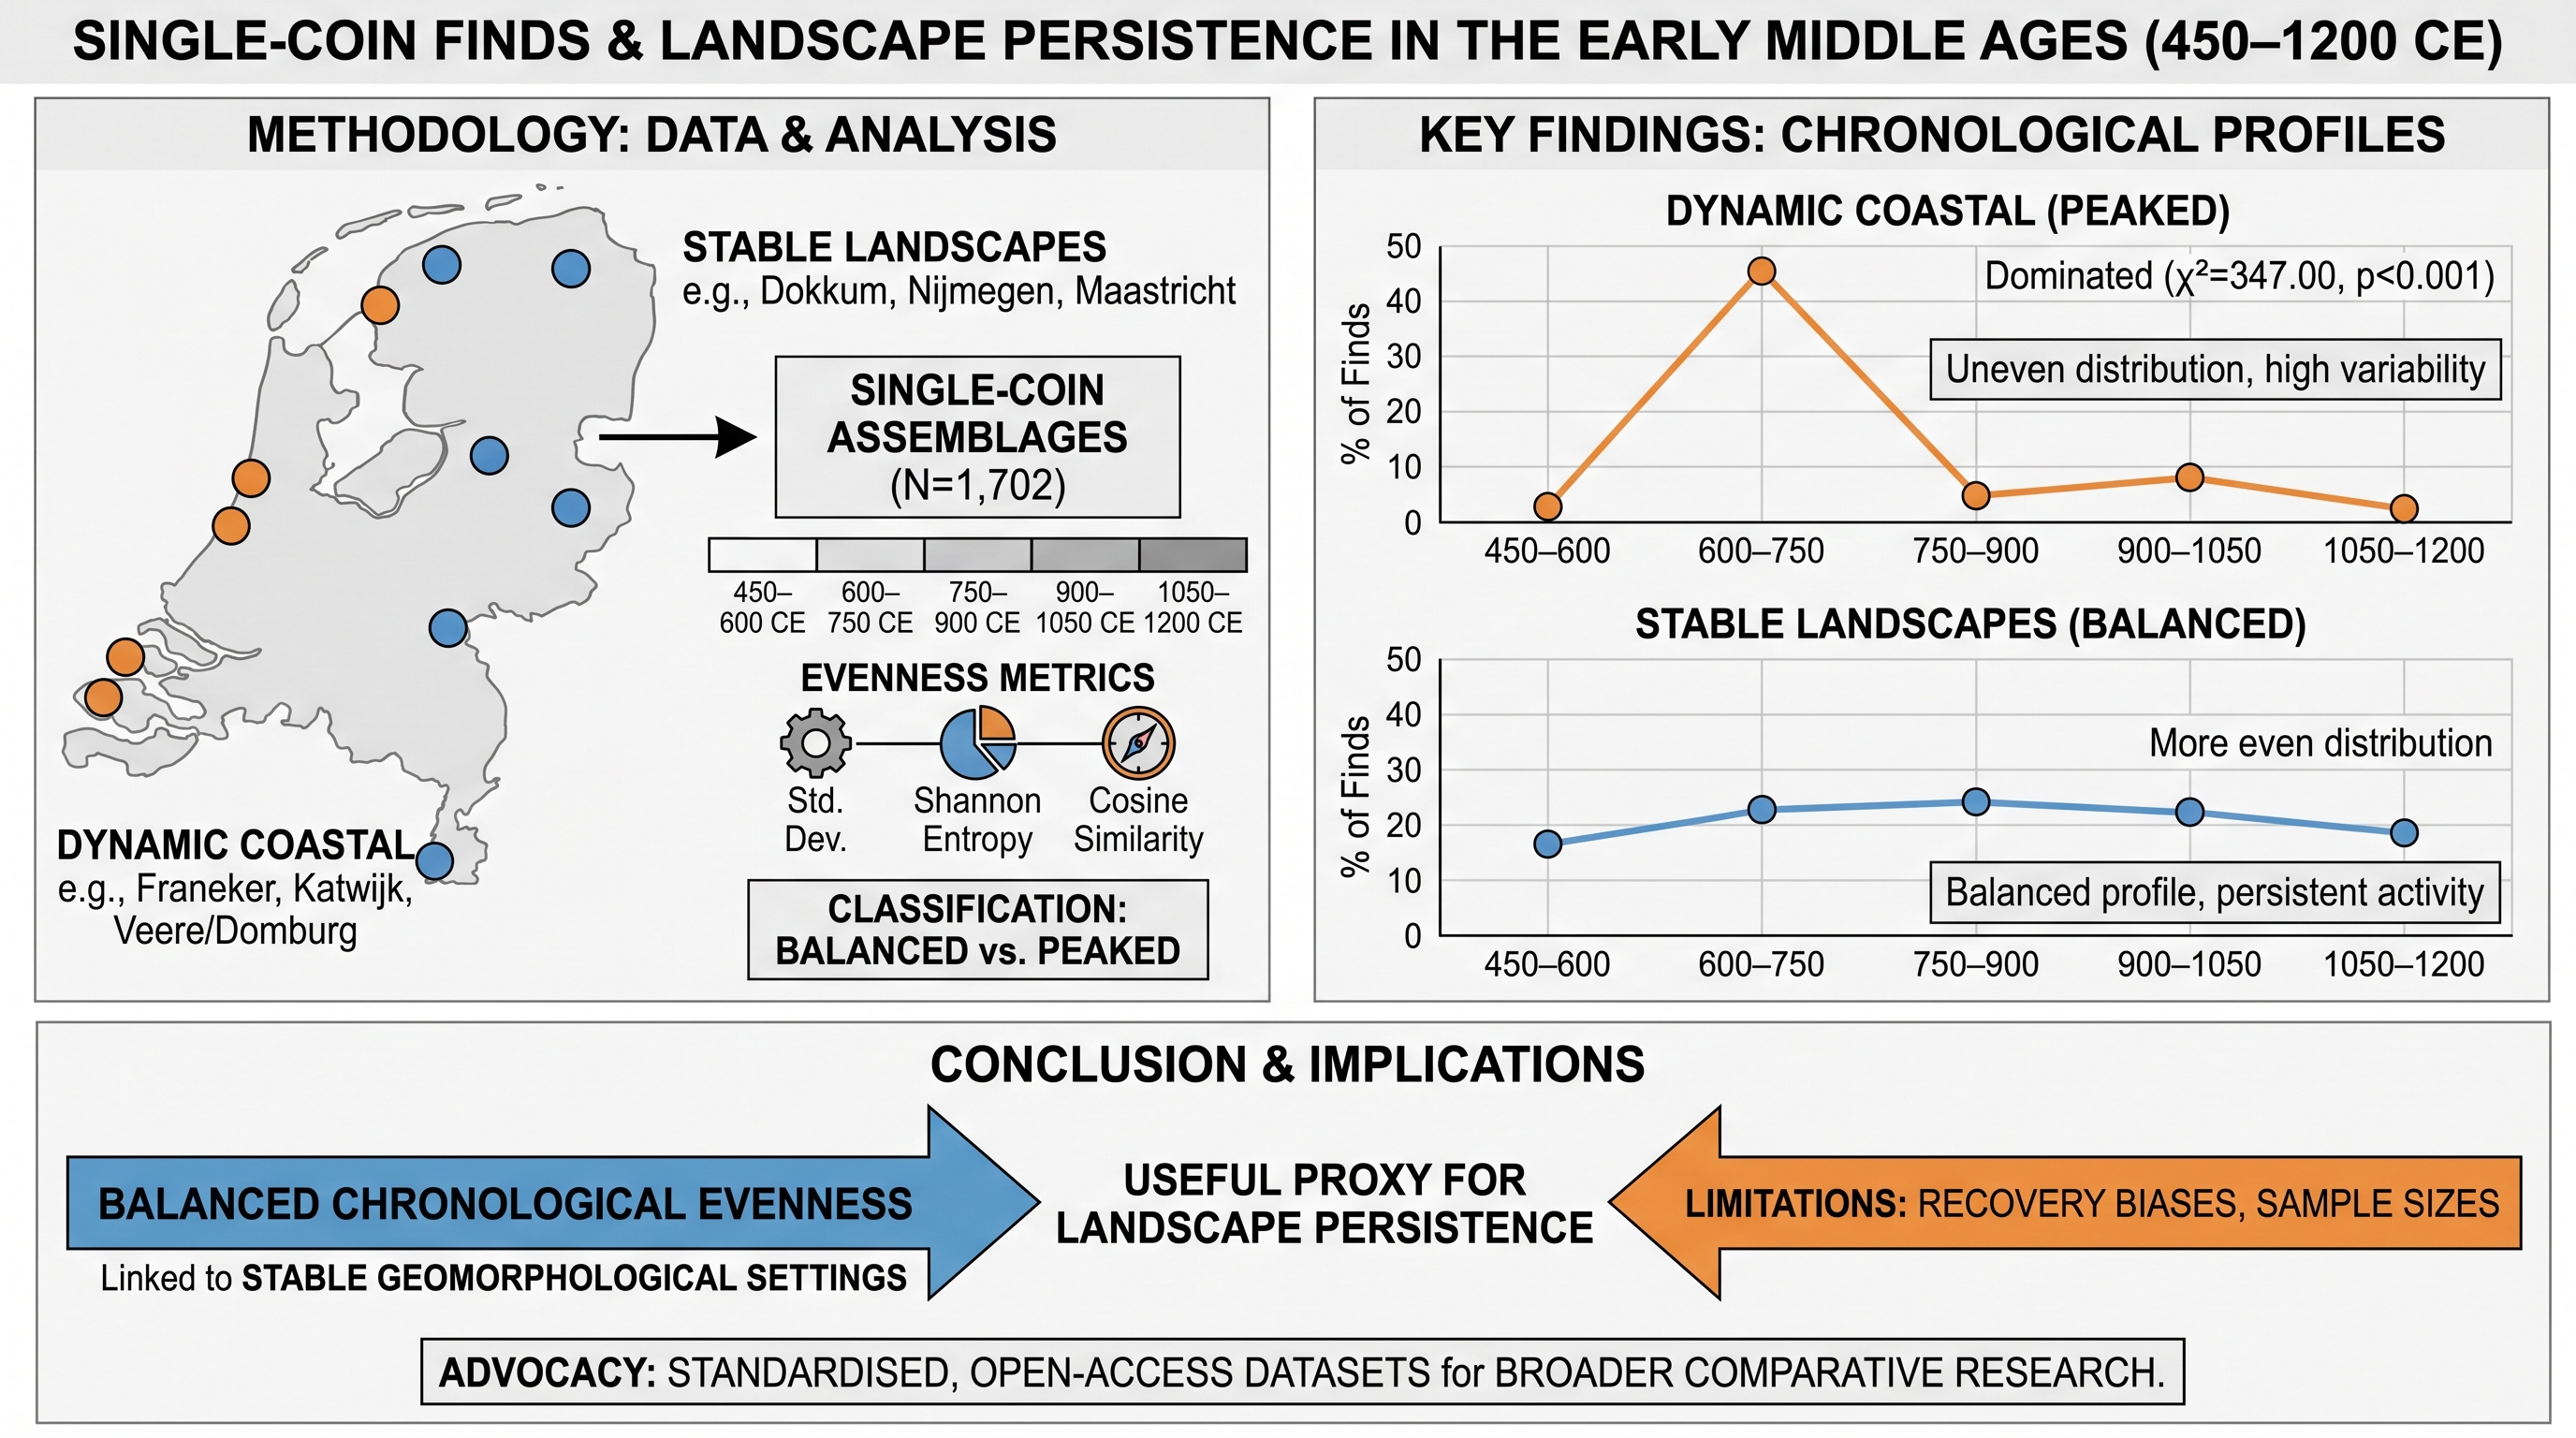
Single-coin finds are increasingly valued as a source for understanding patterns of human activity in the Early Middle Ages. This pilot study examines whether the chronological evenness of single coins can serve as a quantitative proxy for persistent human occupation and landscape stability. Six sites in the Netherlands (450–1200 CE) are compared: three located near relatively stable Pleistocene topographic features (Noardeast-Fryslân/Dokkum, Nijmegen, and Maastricht) and three in dynamic coastal or near-coastal Holocene landscapes (Waadhoeke/Franeker, Katwijk, and Veere/Domburg). All single finds were assigned to five standardised 150-year periods. Chronological evenness was measured using three complementary indices: standard deviation of percentage shares, Shannon entropy, and cosine similarity to a uniform distribution. Sites were classified as “balanced” when at least two metrics met predefined thresholds. The results demonstrate a clear distinction between the two groups. Assemblages from stable landscape positions show relatively balanced chronological profiles, while those from dynamic coastal zones exhibit strongly peaked distributions dominated by the 600–750 CE period (χ² = 347.00, df = 4, N = 1,702, p < 0.001, Cramér’s V = 0.452). Greater chronological evenness appears linked to proximity to stable geomorphological settings. These findings suggest that single-coin evenness can function as a useful proxy for long-term landscape persistence when combined with geo-archaeological evidence. Limitations include recovery biases and variable sample sizes. The study advocates the development of standardised, open-access single-coin datasets to facilitate broader comparative research.
Keywords:
single-coin finds
; chronological evenness
; landscape persistence
; topographic seĴing
; Early Middle Ages
; Netherlands
1. Introduction
Reconstructing long-term human presence and settlement patterns in the Early and High Middle Ages (450–1200 CE) in the Netherlands remains challenging. Traditional archaeological proxies each have significant limitations. Ceramic typologies often span several centuries and therefore offer limited chronological resolution for distinguishing continuous occupation from episodic activity [1]. Burial grounds can be used over long periods without necessarily indicating continuous habitation nearby [2]. Written sources are scarce, heavily biased towards elite and ecclesiastical contexts, and geographically uneven in their coverage [3].
In this context, single-coin finds are increasingly recognised as a valuable complementary source of information [4,5]. While the total number of coins has frequently been used as an indicator of economic intensity and the identification of mint locations, the chronological distribution of single coins has received far less systematic attention. A relatively balanced distribution across broad chronological periods may reflect more persistent human activity, whereas strongly peaked distributions are more likely to indicate temporary intensification or episodic presence.
Previous research has identified regional variation in single-coin distributions across the Rhine–Meuse area [6,7,8,9]. Building on these observations, the present pilot study compares single-coin chronological profiles from six sites in the Netherlands. Three sites are situated in relatively stable topographic positions, characterised by proximity to higher Pleistocene substrates or terraces: Noardeast-Fryslân (Dokkum) near the northernmost Pleistocene landscape elements, Nijmegen near the elevated ice-pushed ridge along the river Waal, and Maastricht on a fluvial terrace of the Meuse [10,11,12]. The other three sites lie in more dynamic coastal or near-coastal Holocene landscapes: Waadhoeke (Franeker) in western Friesland, Katwijk at the mouth of the Old Rhine, and Veere (Domburg) on Walcheren in Zeeland [10,11,13,14].
The central hypothesis is that single-coin assemblages from sites with greater proximity to stable Pleistocene topographic elements will exhibit a more balanced chronological distribution across the five standardised 150-year periods than those from dynamic Holocene coastal and lowland settings. These profiles are evaluated using three complementary measures of chronological evenness: standard deviation of percentage shares, Shannon entropy, and cosine similarity to a uniform distribution. It is expected that the observed patterns will align with independent geo-archaeological and archaeological evidence on long-term occupation and landscape dynamics. This pilot study examines whether chronological evenness in single-coin finds can serve as a useful quantitative proxy for landscape persistence when integrated with other lines of evidence [10,13].
2. Materials and Methods
All single coins were assigned to five standardised 150-year chronological periods: 450–600, 600–750, 750–900, 900–1050, and 1050–1200 CE. These intervals were chosen to balance chronological resolution with the inherent dating uncertainties of early medieval coinage while corresponding approximately to major socio-economic transitions.
Data were collected primarily from the national NUMIS database maintained by De Nederlandsche Bank [16]. A systematic and reproducible filtering protocol was applied. All filters were first reset. Searches were then conducted per municipality (Vindplaats > Gemeente) for the six study areas. Only records explicitly classified as single finds were retained using the following checkboxes: ‘losse vonds’, ‘losse vondst’, ‘losse vondst (?)’, ‘losse vondst / schat’, and ‘losse vondts’. Hoards and collective finds were systematically excluded. Only genuine, circulating coins were included in the analysis. Pseudo-coins, fibulae, jetons, weights, and other non-monetary or imitative objects were deliberately excluded. When a coin’s documented date range spanned two periods, the mean date was calculated and the coin was assigned to the period containing that mean date.
For Nijmegen, an independently compiled dataset by the author (Numismagus collection, N = 97) served as the primary source [17]. This dataset was cross-validated against the NUMIS database (verified 1 May 2026, N = 25), yielding virtually identical chronological distributions and evenness metrics (both SD = 6.7, Shannon entropy = 2.24, cosine similarity = 0.95). This close correspondence supports the representativeness of the NUMIS single-find records for the purposes of this study.
Data for the other five sites were compiled from NUMIS and, where relevant, supplemented with published excavation reports and grey literature. All counts per period and per site were extracted directly from the filtered NUMIS output and hand-counted. To minimise errors, every count was independently recounted by the author on separate occasions. Discrepancies were resolved through re-examination of the original database records.
A “balanced chronological profile” was operationalised using three complementary quantitative measures of evenness. A distribution was classified as balanced when it met at least two of the following criteria: (1) a standard deviation (SD) of the percentage shares across the five periods of ≤ 12%; (2) a Shannon entropy value ≥ 2.0; and (3) a cosine similarity to a uniform distribution ≥ 0.85. Distributions failing to meet at least two thresholds were classified as peaked.
Two groups of sites were compared (see Figure 1). Group 1 consists of three locations with proximity to relatively stable Pleistocene topographic elements: Noardeast-Fryslân (Dokkum) in northern Friesland, Nijmegen near the elevated ice-pushed ridge along the river Waal, and Maastricht on a fluvial terrace of the Meuse. Group 2 comprises three sites in dynamic coastal or near-coastal Holocene landscapes: Waadhoeke (Franeker) in western Friesland, Katwijk at the mouth of the Old Rhine (South Holland), and Veere (Domburg) on Walcheren in Zeeland [10,11].
All statistical analyses were performed using chi-square tests, Cramér’s V effect sizes, adjusted standardised residuals, Shannon entropy, and cosine similarity. The coin profiles were interpreted in combination with landscape characteristics such as fluvial dynamics, terp occupation, and relative elevation.
3. Results
Three locations — Noardeast-Fryslân (Dokkum), Nijmegen, and Maastricht — exhibit relatively balanced single-coin profiles across the five standardised 150-year periods. In contrast, the sites of Waadhoeke (Franeker), Katwijk, and Veere (Domburg) show strongly peaked distributions, particularly in the 600–750 CE period.
Noardeast-Fryslân (N = 85) displays a balanced profile (SD = 10.7%, Shannon entropy = 2.11, cosine similarity = 0.88), with the highest number of coins in the 600–750 period (32 coins). Nijmegen (N = 97) shows the most even profile (SD = 6.7%, Shannon entropy = 2.24, cosine similarity = 0.95), with no period contributing less than 9% or more than 30% of the assemblage. Maastricht (N = 32), despite its smaller sample size, also meets the criteria for a balanced profile (SD = 10.6%, Shannon entropy = 2.10, cosine similarity = 0.88).
Table 1 presents the chronological distribution (absolute counts and percentages) of single-coin finds for all six sites. Table 2 summarises the quantitative measures of chronological evenness (SD, Shannon entropy and cosine similarity) and the resulting classification for each site. Figure 2 shows the relative chronological distribution of single-coin finds by site. A distribution was classified as “Balanced” when it met at least two of the following criteria: standard deviation of percentage shares ≤ 12%, Shannon entropy ≥ 2.0, and cosine similarity to a uniform distribution ≥ 0.85. Sites failing to meet at least two of these thresholds were classified as “Peaked”.
The chronological distribution differs significantly between the stable landscape group and the dynamic landscape group (χ² = 347.00, df = 4, N = 1,702, p < 0.001, Cramér’s V = 0.452; see Table 3). This indicates a moderate to strong association between landscape type and the chronological evenness of single-coin finds. All three sites in the stable landscape group were classified as “Balanced”, whereas all three sites in the dynamic landscape group were classified as “Peaked”. Within the stable group, the profiles are statistically homogeneous (χ² = 10.45, df = 8, N = 214, p = 0.235). In contrast, the dynamic group shows a highly significant internal difference (χ² = 191.75, df = 8, N = 1,488, p < 0.001), primarily caused by the extreme peak at Veere (Domburg).
4. Discussion
The results show a clear distinction between the two groups. Assemblages from locations with proximity to relatively stable Pleistocene topographic elements — Noardeast-Fryslân (Dokkum), Nijmegen, and Maastricht — display relatively balanced chronological profiles. In contrast, the sites in dynamic coastal and near-coastal Holocene landscapes — Waadhoeke, Katwijk, and Veere — are characterised by strongly peaked distributions, dominated by the 600–750 CE period. This contrast is statistically significant and evident in all three evenness metrics [10].
These findings indicate that greater chronological evenness in single-coin assemblages is associated with proximity to higher and more stable topographic positions, often linked to Pleistocene substrates or terraces, rather than the immediate substrate beneath the findspot. Notably, Dokkum, situated on an elevated terp but located near the northernmost Pleistocene landscape elements, shows a balanced profile comparable to that of Maastricht on a fluvial terrace of the Meuse [10,11].
The three sites are also associated with early ecclesiastical and historical attestations: Dokkum (mission of Saint Boniface, martyred there in 754 CE, as recorded in the near-contemporary Vita Bonifatii by Willibald), Nijmegen (mentioned as a Carolingian palatium in a charter of Charlemagne dated 777 CE), and Maastricht (early cult of Saint Servatius, with a Merovingian church and continuous veneration attested from the late 6th/7th century onward in hagiographic sources and archaeology) [18,19,20].
Importantly, these three sites were not necessarily major urban centres during the Early Middle Ages, nor did they belong to the first generation of cities in the classic sense during the 11th–13th centuries [15]. They combined geomorphologically stable positions with repeated textual recognition across centuries, supporting more persistent human activity. The dynamic sites lack comparable long-term historical mentions and show strongly episodic coin loss. This pattern positions the stable sites as a kind of “low-profile backbone” of long-term activity in the Netherlands, complemented by the more dynamic coastal zones [10].
However, several limitations should be taken into account. The NUMIS database combines publicly reported single finds — which include many metal-detected coins and amateur discoveries — with coins recovered during professional archaeological excavations. The spatial and temporal distribution of these finds is therefore influenced by factors such as the intensity of metal-detecting activity, amateur reporting behaviour, the location and research priorities of excavations, and taphonomic processes (e.g., erosion and sedimentation in dynamic coastal landscapes). Sample sizes also differ substantially between sites, ranging from 32 coins in Maastricht to 936 in Veere, which affects the robustness of the evenness metrics at smaller assemblages.
Furthermore, the interpretation of chronological evenness as a direct proxy for landscape persistence remains inferential. A strongly peaked profile, particularly in the 600–750 CE period, may reflect periods of heightened monetary circulation and economic activity (e.g., sceattas trade) rather than solely differences in the persistence of human activity [6,7,9].
Extended analyses of the NUMIS database suggest that the site-level patterns observed here form part of a broader east–west gradient in chronological evenness across the Rhine–Meuse delta [8]. The present pilot study provides a fine-grained, site-based perspective that may contribute to understanding the geo-morphological factors underlying this larger-scale spatial heterogeneity. This study offers an alternative lens through which patterns of human activity in the Early Middle Ages can be examined — one that integrates quantitative numismatic data with specific landscape characteristics.
Funding
This research received no external funding.
Institutional Review Board Statement
Not applicable.
Informed Consent Statement
Not applicable.
Data Availability Statement
The Numismagus dataset for Nijmegen is publicly available via FigShare at https://doi.org/10.6084/m9.figshare.31387345. Data for the other five sites were obtained from the publicly accessible NUMIS database of De Nederlandsche Bank available via De Nieuwe Schatkamer at https://www.denieuweschatkamer.nl/.
Acknowledgments
During the preparation of this manuscript, the author used Grok (xAI) to assist with statistical testing, data analysis, and language refinement. All AI-generated output was critically reviewed, verified, and substantially edited by the author, who takes full responsibility for the accuracy, integrity, and content of the final publication.
Conflicts of Interest
The author declares no conflicts of interest.
References
- Dijkstra, M.; de Rue, Y.; van Veen, M.; van de Venne, A. KNA-Leidraden Anorganisch Materiaal: Leidraad 5 Aardewerk uit de Middeleeuwen en Nieuwe Tijd (ca. 450–heden); SIKB: Amersfoort, 2020. [Google Scholar]
- Theuws, F. Burial archaeology and the transformation of the Roman world in Northern Gaul (4th to 6th centuries). In Archaeology, history and biosciences: Interdisciplinary perspectives; Brather-Walter, S., Ed.; De Gruyter: Berlin, Boston, 2019; pp. 125–150. [Google Scholar] [CrossRef]
- McKitterick, R. History and memory in the Carolingian world; Cambridge University Press: Cambridge, 2004. [Google Scholar] [CrossRef]
- Burström, N.M. Money, coins, and archaeology. In Money and coinage in the Middle Ages; Naismith, R., Ed.; Brill: Leiden, 2019; pp. 231–263. [Google Scholar] [CrossRef]
- Naismith, R. Money and coinage in the Middle Ages. In Money and coinage in the Middle Ages; Naismith, R., Ed.; Brill: Leiden, 2018; pp. 1–18. [Google Scholar] [CrossRef]
- Metcalf, D.M.; Op den Velde, W. The monetary economy of the Netherlands, c. 690–c. 760 and the trade with England: A study of the ‘Porcupine’ sceattas of Series E. Jaarb. Voor Munt.-En. Penningkd. 2010, 96, 1–138. [Google Scholar]
- Op den Velde, W.; Metcalf, D.M. The monetary economy of the Netherlands, c. 690–c. 715 and the trade with England: A study of the sceattas of Series D. Jaarb. Voor Munt.-En. Penningkd. 2007, 90, 1–52. [Google Scholar]
- Blackburn, M. ‘Productive’ sites and the pattern of coin loss in England, 600–1180. In Markets in early medieval Europe: Trading and ‘productive’ sites, 650–850; Pestell, T., Ulmschneider, K., Eds.; Windgather Press: Macclesfield, 2003; pp. 20–36. [Google Scholar] [CrossRef]
- Theuws, F. Reversed directions: Re-thinking sceattas in the Netherlands and England. Z. Für Archäologie Des. Mittelalt. 2019, 46, 27–84. [Google Scholar]
- Rensink, E.; Weerts, H.J.T.; Kosian, M.; Feiken, H.; Jansen, D.; Smit, B.I. Archeologische Landschappenkaart van Nederland, versie 3.0; Rijksdienst voor het Cultureel Erfgoed: Amersfoort, 2019. [Google Scholar]
- Wageningen Environmental Research. Geomorfologische Kaart van Nederland (v2023-01). Basisregistratie Ondergrond (BRO): Amersfoort, 2023. [Google Scholar]
- Van Enckevort H, Hendriks J, Nicasie M. Nieuw licht op donkere eeuwen: De overgang van de laat-Romeinse tijd naar de vroege middeleeuwen in Zuid-Nederland. Amersfoort: Rijksdienst voor het Cultureel Erfgoed; 2017. (Nederlandse Archeologische Rapporten 58). [CrossRef]
- Van Heeringen RM, van der Velde HM, editors. Struinen door de duinen: Synthetiserend onderzoek naar de bewoningsgeschiedenis van het Hollands duingebied. Amersfoort: Rijksdienst voor het Cultureel Erfgoed; 2017. (Nederlandse Archeologische Rapporten 52).
- Van Doesburg, J.; Stöver, J. Terpen en wierden, verleden, heden en toekomst: De omgang met rijksbeschermde terpen en wierden in de archeologische monumentenzorg; Rijksdienst voor het Cultureel Erfgoed: Amersfoort, 2018. [Google Scholar]
- Bijsterveld A-JA, Theuws FCWJ. Vroege stadswording in Nederland: Een Romeinse erfenis, Carolingiaanse impulsen en een stroomversnelling in de twaalfde eeuw. In: Taverne E, de Klerk L, Ramakers BAM, Dembski S, editors. Nederland stedenland: Continuïteit en vernieuwing. Rotterdam: nai010; 2012. p. 91-107.
- De Nederlandsche Bank. NUMIS: Numismatisch Informatie Systeem [Internet]. 1 May 2026. Available online: https://www.denieuweschatkamer.nl/.
- Duchateau, R.J. Nijmegen coinage 450–1200 CE: The Numismagus dataset [Dataset]; Figshare, 2026. [Google Scholar] [CrossRef]
- Talbot, C.H.; editor, Translators; The Anglo-Saxon missionaries in Germany: Being the lives of SS. Willibrord, Boniface, Sturm, Leoba and Lebuin, together with the Hodoeporicon of St. Willibald and a selection from the correspondence of St. Boniface; Sheed and Ward: London, 1954. [Google Scholar]
- Den Braven, A. Charlemagne’s palace at Nijmegen: Some thoughts on the economic implications of itinerant kingship. In Dorestad and its networks: Communities, contact and conflict in early medieval Europe; (Papers on Archaeology of the Leiden Museum of Antiquities 25); Willemsen, A., Kik, H., Eds.; Sidestone Press: Leiden, 2021; pp. 149–157. [Google Scholar]
- Theuws, F.C.W.J.; Kars, M. (Eds.) The Saint-Servatius complex in Maastricht. The Vrijthof excavations (1969–1970); (Merovingian Archaeology in the Low Countries 4); Habelt: Bonn, 2017. [Google Scholar]
Figure 1.
Map showing the spatial distribution of the two landscape groups: Group 1 (stable landscape): Noardeast-Fryslân (Dokkum), Nijmegen, Maastricht; Group 2 (dynamic landscape): Waadhoeke (Franeker), Katwijk, Veere (Domburg).
Figure 1.
Map showing the spatial distribution of the two landscape groups: Group 1 (stable landscape): Noardeast-Fryslân (Dokkum), Nijmegen, Maastricht; Group 2 (dynamic landscape): Waadhoeke (Franeker), Katwijk, Veere (Domburg).

Figure 2.
Relative chronological distribution of single-coin finds by site (450–1200 CE.


Table 1.
Chronological distribution of single-coin finds by site (450–1200 CE).
| Site | 450–600 | 600–750 | 750–900 | 900–1050 | 1050–1200 |
|---|---|---|---|---|---|
| Noardeast-Fryslân | 8 (9 %) | 32 (38 %) | 19 (22 %) | 7 (8 %) | 19 (22 %) |
| Nijmegen | 9 (9 %) | 19 (20%) | 22 (23 %) | 18 (19 %) | 29 (30 %) |
| Maastricht | 2 (6 %) | 10 (31 %) | 7 (22 %) | 3 (9 %) | 10 (31 %) |
| Waadhoeke | 23 (5 %) | 229 (54 %) | 119 (28 %) | 16 (4 %) | 37 (9 %) |
| Katwijk | 3 (2 %) | 96 (75 %) | 26 (20 %) | 0 (0 %) | 3 (2 %) |
| Veere | 1 (0 %) | 791 (85 %) | 128 (14 %) | 10 (1 %) | 6 (1 %) |
Percentages are rounded to the nearest whole number and might not add up to 100 %.
Table 2.
Quantitative measures of chronological evenness in single-coin finds.
| Site | N | SD (%) | Shannon Entropy | Cosine Similarity | Classification |
|---|---|---|---|---|---|
| Noardeast-Fryslân | 85 | 10.7 | 2.11 | 0.88 | Balanced |
| Nijmegen | 97 | 6.7 | 2.24 | 0.95 | Balanced |
| Maastricht | 32 | 10.6 | 2.10 | 0.88 | Balanced |
| Waadhoeke | 424 | 19.1 | 1.71 | 0.72 | Peaked |
| Katwijk | 128 | 28.5 | 1.03 | 0.58 | Peaked |
| Veere | 936 | 32.7 | 0.72 | 0.52 | Peaked |
Table 3.
Aggregated chronological distribution of single-coin finds by landscape group.
| Landscape Group | 450–600 | 600–750 | 750–900 | 900–1050 | 1050–1200 |
|---|---|---|---|---|---|
| Stable | 19 (9 %) | 61 (29 %) | 49 (22 %) | 29 (13 %) | 56 (27 %) |
| Dynamic | 27 (2 %) | 1,116 (75 %) | 273 (18 %) | 26 (2 %) | 46 (3 %) |
Percentages are rounded to the nearest whole number and might not add up to 100 %.
Disclaimer/Publisher’s Note: The statements, opinions and data contained in all publications are solely those of the individual author(s) and contributor(s) and not of MDPI and/or the editor(s). MDPI and/or the editor(s) disclaim responsibility for any injury to people or property resulting from any ideas, methods, instructions or products referred to in the content. |
© 2026 by the authors. Licensee MDPI, Basel, Switzerland. This article is an open access article distributed under the terms and conditions of the Creative Commons Attribution (CC BY) license (http://creativecommons.org/licenses/by/4.0/).
Copyright: This open access article is published under a Creative Commons CC BY 4.0 license, which permit the free download, distribution, and reuse, provided that the author and preprint are cited in any reuse.


