Introduction
In recent years, numerous research groups have developed a strong interest in photoluminescence, and a wealth of studies and reports have emerged. However, due to the limitations of current scientific technology and the complexity of molecular microscopic processes, a consensus on the photoluminescence mechanism of non-typical luminescent compounds has not yet been reached [
1].
The phenomenon of photoluminescence was first discovered through chlorophyll, which contains a large conjugated system. As more fluorescent phenomena were observed, increasing numbers of researchers became interested in this field. A typical example is Stokes’ observation in 1852 that the fluorescence wavelength is always longer than the excitation wavelength, a phenomenon now known as the Stokes shift [
2]. Today, the number of researchers engaged in photoluminescence studies continues to grow, and the volume of published papers has increased exponentially, accompanied by the development of increasingly advanced analytical methods and instruments.
In this study, hydantoin was chosen as the model compound. Single crystals were grown by dissolving hydantoin in water followed by slow evaporation. The emission spectra of hydantoin single crystals were observed using a laser confocal microscope. The crystal structure was solved using the single-crystal refinement software Olex2. Molecular energy levels were calculated with the quantum chemistry software ORCA [
3]. Hole-electron distributions, spin-orbit coupling, and fluorescence/phosphorescence emission rates were analyzed using Multiwfn [
4] to elucidate the photoluminescence mechanism of non-typical luminescent compounds.
Results and Discussion
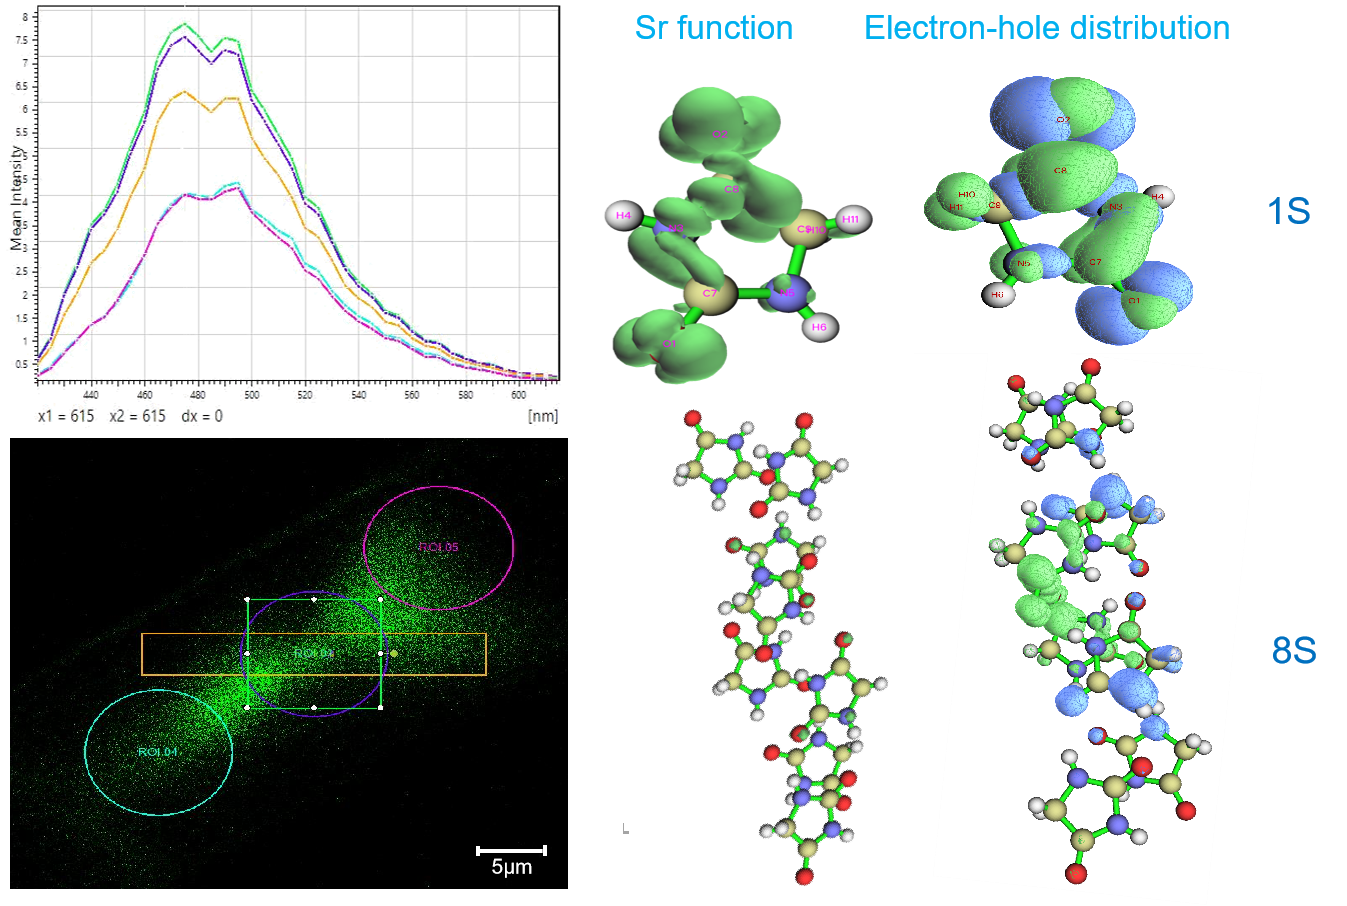
Figure 1 shows the spectra of a hydantoin single crystal acquired under a laser confocal microscope, along with the corresponding regions on the crystal. In
Figure 1(b,d), different colors and line shapes were used to delineate regions on the crystal.
Figure 1(a,c) present the spectra corresponding to each colored region in (b) and (d). It can be observed that for different regions of the same crystal, the peak shape and position of the emission spectra are essentially the same, but the emission intensity differs. This is attributed to the nearly identical molecular packing arrangement within the crystal, leading to similar types of binding energies of electrons before excitation and similar types of interactions between excited electrons and other electrons or nuclei; only the magnitudes of these forces vary with the molecular number. In
Figure 1(a,b), a smaller region exhibits stronger emission, an interesting phenomenon termed confinement-induced emission, which coincides with the subsequent analysis of average hole-electron attraction. The inset in
Figure 1(b) shows a photograph of the hydantoin single crystal under white light, corresponding to
Figure 1(b,d).
Figure 1(e,f) show the emission spectra of different crystal blocks with the same region size and the corresponding crystal regions. The emission peak shapes differ among crystal blocks, which is likely caused by local or overall differences in molecular packing modes. Partial or completely different molecular packing leads to changes in the binding energy of excited electrons, interactions between excited-state electrons and other electrons, and interactions between excited-state electrons and other nuclei. These variations alter the number of excited electrons, the delocalization range of excited electrons, and the hole-electron attraction energy, ultimately manifesting as differences in the peak shape of the emission spectra.
In summary, the following conclusions can be drawn from the laser confocal microscopy measurements on hydantoin single crystals: (a) Within a homogeneous crystal, the peak shape and position of emission spectra for regions of different sizes/shapes are essentially the same, because the molecular packing arrangement is nearly identical, resulting in the same types of binding energies and interactions; only the magnitudes vary with molecular number. (b) For different crystal blocks with the same region size/shape, both the emission peak shape and position differ. This is likely due to variations in molecular packing modes, which alter the binding energy, delocalization index, and hole-electron attraction energy, leading to distinct peak shapes and positions.
The following discussion focuses on theoretical calculations. The software packages Gaussian [
7] and ORCA were used, employing TD-DFT theory [
5,
6]. All analyses were performed with Multiwfn.
Figure 2(a,b) display the bandgaps/wavelengths calculated with different functionals and basis sets in Gaussian.
Table 1 lists the classification of the functionals used. According to the UV-Vis absorption spectrum in
Figure 2(c) and the laser confocal microscopy spectral analysis, the B3LYP and M06-2X functionals provide results closer to the experimental values. Therefore, B3LYP was selected as the functional for subsequent property calculations.
To explain the experimental phenomena, energy levels were calculated as a function of molecular number using ORCA.
Figure 2(d–g) present energy level statistics obtained with B3LYP/TZVP. (d) and (e) show the mean, variance, median, and average gap between consecutive energy levels for 16 levels of 1-8 molecules. (f) shows the energy level trends for 1-8 molecules; each line represents the energy level trend for a given singlet or triplet excitation at the same molecular count. For both singlet and triplet states, the energy increases with increasing energy level, consistent with the principle of minimum energy for electron configuration. However, the slopes of the curves differ, generally decreasing as the molecular number increases. This indicates that as the molecular number increases, orbital compression between atoms causes the energy gap to decrease sharply, but the compression trend gradually slows, consistent with the trends in (d) and (e).
Figure 2(g) shows the average excitation wavelength required for aggregates of 1-8 molecules. The red line represents SOC-corrected values, while the black line is uncorrected. As the molecular number increases, the average required excitation wavelength increases, i.e., the excitation energy decreases, in perfect agreement with the trend observed in
Figure 2(f).
Next, Multiwfn was used to analyze hole-electron distributions.
Figure 3(a) displays the average hole-electron Coulomb attraction energy for 1-8 molecules. For each group of molecules, the S₁-S₁₁ points were arithmetically averaged and connected, and similarly for T₁-T₁₀. As the molecular number increases, the overall hole-electron attraction energy decreases, with singlet and triplet states showing the same trend. Possible reasons include: an increase in molecular number leads to a larger excitation range, increasing the average hole-electron distance and thereby reducing the attraction energy; alternatively, a larger molecular number causes more diffuse excited electrons, whereas fewer molecules yield more localized excited electrons, again reducing the attraction energy. Notably, this result is in perfect agreement with the experimental observations.
Figure 3(b) shows the delocalization indices for holes (HDI) and electrons (EDI). The x-axis is the molecular number, and the y-axis is the average delocalization index (averaged over S₁-S₁₁ and T₁-T₁₀ for each group). Both HDI and EDI decrease with increasing molecular number. However, at small molecular numbers, HDI > EDI, whereas at large molecular numbers, HDI < EDI. This can also be observed in the hole-electron distribution maps in
Figure 4, indicating that as the molecular number increases, the sources and destinations of excited electrons become more concentrated.
It can also be seen that EDI changes very little with molecular number, while HDI decreases much faster. The slow decrease in EDI may be due to: (1) an increase in the binding energy of excited electrons as molecular number increases, reducing their kinetic energy; (2) the sharp drop in HDI pulling down the EDI; (3) the total space available for electron delocalization increasing much faster than the actual delocalization range of the excited electrons.
Figure 3(c) shows the average distance between the centers of mass of the hole and the electron for S₁-S₁₁ and T₁-T₁₀. The distances for singlet and triplet states are almost equal but fluctuate strongly with molecular number, reflecting the combined influence of molecular count and hole-electron delocalization.
Figure 3(d,e) present the Sr index (hole-electron overlap degree) for selected states (the level with the strongest hole-electron attraction: S₁, T₈; S₇, T₁₀; S₅, T₄; S₁₁, T₅). As the molecular number increases, the overlap degree decreases. This is due to the reduced delocalization index, which lowers the probability of hole-electron overlap and consequently reduces the attraction energy.
Figure 4 shows hole and electron distributions for 1-8 molecules, again selecting the level with the strongest hole-electron attraction. For a single molecule, the lone-pair electrons on oxygen atoms contribute significantly to the hole, indicating an n→π* transition for S₀→S₁. As the molecular number increases, the n→π* contribution gradually decreases while π→π* transitions become more prevalent. The hole-electron maps also show that the delocalization degree decreases with increasing molecular number, as discussed above.
In summary, from the in-depth hole-electron analysis we conclude that as the molecular number increases, both the delocalization indices of holes and electrons decrease, with HDI decreasing faster than EDI; concurrently, both the hole-electron overlap degree and the attraction energy decrease. These two observations are not contradictory because the integrated values of hole and electron distributions over all space are normalized to 1. The calculated values represent the fraction of the total space over which the hole or electron moves during the excitation. As the molecular number increases, intermolecular distances hinder the kinetic energy of the excited electrons.
Figure 5(a–c) are heatmaps of the spin-orbit coupling coefficients between three triplet states (T₁, T₂, T₃) and five singlet states (S₀-S₄). Color from white to red indicates increasing interaction strength. Red regions are concentrated around S₀ in all three maps, but in (b) and (c) red appears only for aggregates of four or more molecules. This indicates that the molecular count has little effect on T₁→S₀ but significantly influences the de-excitation from T₂ and T₃: for i > 1, the Ti→S₀ transition becomes stronger with more molecules, facilitating phosphorescence from high-orbital-angular-momentum triplet states. Additionally, for a single molecule, T₂ couples strongly with S₁ and S₂, while T₃ couples strongly with S₁ and S₂ for both one and two molecules. This shows that the sensitivity of spin-orbit coupling coefficients to molecular number depends on the triplet energy level: the higher the triplet energy, the greater the influence of molecular number on the SOC coefficient. Overall, the phosphorescence rate for the lowest triplet T₁→S₀ is unaffected by molecular number, but for higher-lying triplets the influence of molecular count gradually increases.
Figure 5(d) shows the rates calculated with ORCA. According to the vacuum energy levels in
Figure 2(f), S₁ > T₂, while S₂ and S₃ are greater than T₄ but less than T₅. Therefore, ISC rates were computed for S₁→T (T₁+T₂), S₂→T (T₁+T₂+T₃+T₄), and S₃→T (T₁+T₂+T₃+T₄). The red ISC rate curve increases sharply with increasing energy level, indicating that higher excited states facilitate easier spin flipping, leading to larger ISC rates and larger spin-orbit coupling coefficients. This is consistent with the excited-state energy diagram in
Figure 2(f), where the energy gap between singlet and triplet states decreases as the energy level increases for a single molecule.
Conclusions
Using a combination of laser confocal microscopy experiments on single crystals and theoretical calculations, the photoluminescence mechanism of the non-typical luminescent compound hydantoin was investigated in depth. Through analyses of energy levels, hole-electron distributions, spin-orbit coupling, and fluorescence/phosphorescence/ISC rates, the following conclusions were drawn:
(1) Within a homogeneous crystal, the peak shape and position of emission spectra from different regions are essentially the same; intensity differences arise from changes in the magnitude of interaction forces with varying molecular number. Smaller crystal regions give stronger emission (confinement-induced emission).
(2) Differences in molecular packing modes among different crystal blocks alter the binding energy of excited electrons, their delocalization range, and the hole-electron attraction energy, resulting in different emission peak shapes and positions.
(3) As the molecular number increases, the compression of energy gaps slows, the excitation wavelength increases, and the hole-electron attraction energy, delocalization indices, and overlap degree all decrease, with the hole delocalization index decreasing faster than that of the electron.
(4) The spin-orbit coupling coefficients associated with high-lying triplet states (T₂, T₃) are more sensitive to molecular number, whereas T₁→S₀ is unaffected.
(5) The intersystem crossing rate for high-energy excited states increases significantly, consistent with the reduced singlet-triplet energy gap at higher energy levels.
These findings provide a microscopic explanation of the electron correlation processes from excitation to de-excitation in non-typical luminescent compounds. This approach removes barriers between experiment and theory and offers powerful support for interpreting related phenomena. However, it is limited by computational resources and theoretical methods; full and comprehensive explanations remain a goal for the near future.
ASSOCIATED CONTENT
MATERIALS AND INSTRUMENTATION
Hydantoin (>99.0%) was purchased from TCI (Shanghai) Development Co., Ltd. Single crystals were grown by dissolving hydantoin in water and allowing the water to evaporate.
Laser confocal microscope.
UV-Vis absorption spectrometer (UV-8000), Shanghai Precision Instrument Co., Ltd.
COMPUTATIONAL METHODS
Olex2 (1.3.0) was used for single-crystal structure solution of hydantoin, and the structure was validated using the online CheckCif system.
Gaussian (G09) was used to calculate the maximum absorption/excitation wavelengths and S₁ energy levels with different methods.
ORCA (5.0) was used for geometry optimization and molecular calculations. Spin-orbit coupling (SOC) and energy level calculations were conducted using the linear-response time-dependent density functional theory (TD-DFT) method. For SOC and energy level simulations, the B3LYP functional was employed in combination with the TZVP basis set. The RIJCOSX acceleration algorithm was used. The numerical integration accuracy was set to gridx6, and convergence accuracy was set to tightSCF. For rate calculations, the B3LYP functional and the DEF2-TZVP basis set were used.