

Submitted:
30 April 2026
Posted:
01 May 2026
You are already at the latest version
Abstract
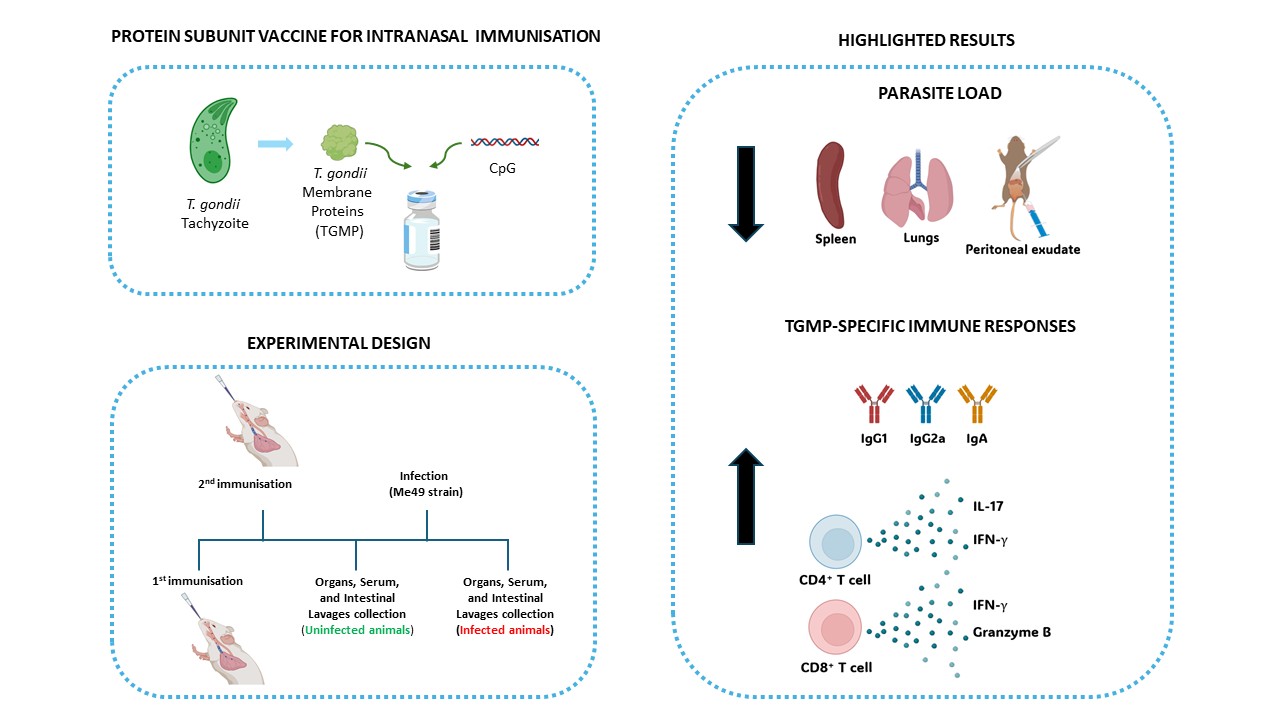
Toxoplasmosis is a prevalent zoonotic disease worldwide, affecting approximately one-third of the global human population. Primary infection with Toxoplasma gondii during pregnancy can induce miscarriage or congenital infection, leading to irreversible damage to the foetus. Moreover, reactivation of T. gondii infection in immunosuppressed individuals can result in fatal outcomes. No vaccine exists to prevent human disease caused by this parasite. Thus, a vaccine that could induce complete and lasting protection against human toxoplasmosis is an unmet need. In this work, a subunit vaccine, consisting of T. gondii membrane proteins (TGMP) from the T. gondii Me49 strain plus CpG-oligodeoxynucleotide adjuvant (CpG), was tested using BALB/cByJ mice. Intranasal immunisation with TGMP plus CpG (TGMP+CpG) raised TGMP-specific serum IgG and intestinal IgA antibody levels, and parasite-specific IFN-γ-producing CD4+ and CD8+ memory T cells. Dense granule proteins (GRA) 2 and 7, surface antigen (SAG)-related sequences 25, 29B, and 34A, microneme protein (MIC) 10, toxofilin, nascent polypeptide-associated complex (NAC) domain-containing protein and NAC subunit beta were identified as immunogenic proteins in the TGMP. Mice immunised with TGMP+CpG were challenged with T. gondii tachyzoites and showed a significant reduction in the parasitic burden in the peritoneal exudate, spleen, and lungs, compared to mice sham-immunised with CpG alone. Altogether, these results indicate that mucosal immunisation with TGMP plus CpG adjuvant is worth exploring as a vaccination approach to prevent toxoplasmosis.
Keywords:
toxoplasmosis
; intranasal vaccine
; systemic sustained mucosal immunity
; nasal delivery
1. Introduction
Toxoplasmosis is a disease caused by Toxoplasma gondii, an obligate intracellular protozoan parasite that significantly impacts human health, affecting approximately two billion people worldwide [1]. Its ubiquity varies significantly across countries, with moderate prevalence in central and southern Europe and high prevalence in Latin America and tropical Africa [2]. T. gondii infection severely affects immunosuppressed individuals, causing clinical manifestations, such as cerebral encephalitis, that may result in fatal outcomes [3]. Moreover, in primoinfected pregnant women, toxoplasmosis may lead to devastating consequences for the foetus. Depending on the pregnancy trimester when infection occurs, abortion or congenital toxoplasmosis (ocular disease, mental retardation, hydrocephaly) may occur [4]. Currently, the gold standard treatment for acute toxoplasmosis relies on a combination of pyrimethamine and sulfadiazine, despite its toxic effects and the need for a long-duration treatment [5]. However, it is only effective during the acute phase of infection and ineffective against latent toxoplasmosis, which can potentially and severely reactivate in immunosuppressed individuals.
Vaccination is considered an effective and adequate approach to prevent toxoplasmosis. However, no vaccine is currently available to prevent toxoplasmosis in humans, nor is one being tested in clinical trials [3]. Over the last 20 years, various experimental approaches have been used for vaccine development, including subunit vaccines targeting single or combined parasite proteins involved in host cell invasion and parasite persistence. Examples include surface antigens (SAG), rhoptry antigens (ROP), microneme antigens (MIC), and dense granule antigens (GRA), all of which are crucial for parasite-induced pathogenesis [6,7]. Despite ongoing efforts, an effective T. gondii vaccine for human use remains unavailable, with several studies showing variation in vaccine efficacy. However, a consensus was reached that vaccines using multiple antigens are more effective [8]. Almost all experimental vaccines developed so far have been evaluated in mouse models, and it is not always possible to easily and directly extrapolate experimental results to humans or cats. However, mouse models remain essential and offer numerous advantages, serving as a valuable tool in vaccine development, particularly for understanding the immune response and identifying potential issues before progressing to human trials [9]. The intranasal (i.n.) route enhances antigen delivery to target immune cells and induces both systemic and mucosal immunity, which are essential for protection against T. gondii infection [10]. Indeed, i.n. vaccination has been demonstrated to induce the production of secretory IgA in the intestinal mucosa, the primary gateway for the entry of T. gondii [10]. Our strategy was based on a previously developed i.n immunisation approach that proved highly effective in inducing long-term protection against infection caused by Neospora caninum, a T. gondii closely related protozoan parasite [11].
In this study, an i.n. vaccine formulation composed of T. gondii membrane proteins (TGMP) plus a CpG adjuvant (TGMP+CpG) was composed by key immunogenic proteins identified by immunoproteomics. Intranasal immunisation with TGMP+CpG formulation was effective in inducing TGMP-specific B and T cell responses, and host protection against acute toxoplasmosis.
2. Materials and Methods
2.1. Animals
Seven-week-old female BALB\c/cByJ (BALB/c) mice (20 – 25g) were purchased from Charles River Laboratories (Saint-Germain-Nuelles, France) and kept in the animal facilities of the Institute of Biomedical Sciences Abel Salazar (ICBAS, Porto, Portugal). All procedures were following the recommendations of the directive 2010/63/EU of the European Parliament for the protection of Vertebrate Animals used for Experimental and Other Scientific Purposes (ETS 123) and the Council of 22 September 2010 on animal protection used for scientific purposes, and Portuguese rules (DL 113/2013). All experiments and procedures involving animals were approved by the Organ Responsible for Animal Welfare (ORBEA) at ICBAS (document 315/2019/ORBEA) and the responsible national board authority, Direção-Geral de Alimentação e Veterinária (document 02/12/2019). The present study was performed in accordance with ARRIVE guidelines (https://arriveguidelines.org). All experimental animals were humanely euthanized by inhalation of isoflurane (anesthetic overdose induced using a 50 mL tube containing cotton soaked with approximately 1 mL of isoflurane), followed by cervical dislocation to ensure death.
BALB/c mice were selected for this study because they mount robust and well-characterised Th1/Th2 immune responses, making them an excellent model for evaluating vaccine-induced protection against both acute and chronic toxoplasmosis [12]. Although they are relatively resistant to lethal acute infection compared to other strains, this allows for a clear assessment of immune-mediated protection, including antibody production and cellular immunity, without confounding mortality effects.
2.2. Cell Culture
Vero cells (ATCC, CCL-81) were used as host cells to maintain and produce T. gondii tachyzoites. Cells were cultured in minimal essential medium containing Earle's salts (MEM), supplemented with 10% inactivated foetal bovine serum (FBS), 100 U/ml Penicillin, 0.1 mg/ml Streptomycin, and 1 mM Sodium Pyruvate (all from Life Technologies Europe, Bleiswijk, Netherlands). Vero cells were cultured and incubated at 37 °C in a humidified atmosphere containing 5% CO2. For cell collection, supplemented MEM medium was removed, and the cells were washed with phosphate-buffered saline solution (PBS). Then, trypsin-EDTA solution (0.25% trypsin/1 mM EDTA; Thermo-Fisher, Massachusetts, USA) was added, and the cells were incubated at 37 °C for 5 minutes until they detached from the flask. Supplemented MEM medium was added to inactivate trypsin, and the cell suspension was homogenized and centrifuged at 200g for 6 minutes at 4 ºC. Subsequently, the supernatant was discarded, and the cells were resuspended in growth medium and subcultured into new flasks.
2.3. Parasites
The ME49 strain of T. gondii, used in this study, was kindly provided by Dr. Marcus Meissner (Parasitology Department of the Faculty of Medicine, Heidelberg University, Germany). Tachyzoites were obtained by in vitro infection of Vero cells using an optimised protocol to provide a consistent source of parasites with minimal host cell contamination [11]. To maintain parasite culture in vitro, semi-confluent Vero cell cultures (7×10⁶ cells) were inoculated with tachyzoites at a multiplicity of infection (MOI) of 2 (14×10⁶ parasites/flask). For parasite isolation, infected Vero cells containing active intracellular tachyzoites (rosettes) were detached using a cell scraper and centrifuged at 1500g for 15 minutes at 4 ºC. The supernatant was discarded, and the cells were resuspended in 5 mL of PBS. Subsequently, Vero cells were disrupted by carefully passing them at least 10 times through a 25-G needle. PBS was added to a total volume of 40 mL, and the cell suspension was centrifuged at 1500g for 15 minutes. This procedure was repeated 2 times. The resulting pellet was resuspended in 3 mL of PBS and then passed through a PD-10 desalting column (GE, Healthcare, Freiburg, Germany), allowing the separation of parasites from cell debris. The parasite concentration was determined using a Neubauer chamber and Trypan Blue dye (0.4%, Sigma-Aldrich, St. Louis, Missouri, USA). The cell suspension was then used to prepare the parasite inoculum for in vivo infection experiments. The remaining suspension was centrifuged at 1500g, and the parasite pellets were stored at -80 °C to prepare TGMP, or the whole T. gondii antigen (TgS) extract.
2.4. Preparation of TGMP and TgS extracts
After isolation T. gondii tachyzoites were processed into hydrophilic proteins (TgHyd), hydrophobic membrane proteins (TGMP) or TgS. For phase separation, parasite pellets were resuspended in 0.75% Triton X-114 (Sigma-Aldrich) in PBS (1 mL per 10⁸ parasites), incubated on ice for 10 min, and then centrifuged at 10,000g for 30 min at 4°C. The supernatant underwent phase partitioning by warming to 30°C for 3 min followed by centrifugation at 1,000g for 3 min at room temperature, yielding TgHyd (upper aqueous phase, ~95%) and TGMP (lower detergent phase, ~5%). TGMP was precipitated with 4 volumes of absolute ethanol (vortexed 15 s, incubated 1 h on ice), pelleted at 12,000g for 20 min at 4°C, dried (30-60 min at RT), resuspended in sterile PBS (50 µL per 3 × 10⁸ parasites), and stored at 4°C until use. TgS was obtained by tachyzoite sonication (26 cycles of 15 s at 100 W, Branson W-185 D) in an ice bath, filtered (0.2 µm), and stored at 4°C until use.
2.5. TGMP and TgS protein profiles
TGMP and TgS were analysed by SDS-PAGE using an 8%-18% gradient running gel. The protein molecular weight (MW) standards used were from Bio-Rad (Precision Plus) or Santa Cruz Biotechnology (broad range marker). Samples containing 8 µg of protein (quantified using the Lowry protein assay) were previously heated at 95 °C for 5 minutes to denature the protein, and then loaded into the gel. Migration was performed in a vertical electrophoresis system (mini-PROTEAN® Tetra, Bio-Rad, California, USA) at a constant voltage of 100 V and a fixed current of 300 mA. After sample migration, the silver nitrate staining protocol was used to visualise the protein profile as previously described [13]. The gel image was captured using the ChemiDoc Imaging System (Bio-Rad), and the bands were analysed using the Image Lab software (Bio-Rad). For data analysis, lanes and bands were manually selected. The molecular weight analysis and quantity tools were used as provided in the Bio-Rad instructions.
2.6. Bone marrow-derived dendritic cells (BMDC)
BMDC were harvested by flushing femurs and tibias of adult female BALB/c mice with RPMI supplemented with 1 mM sodium pyruvate, 2 mM L-glutamine, 10% (v/v) inactivated FBS, 100 U ml-1 penicillin, and 100 µg ml-1 streptomycin (complete RPMI). After flushing, cells were cultivated in 6-well plates at a density of 106 cells/mL using complete RPMI, further supplemented with HEPES buffer (20 mM), β-mercaptoethanol (50 µM), and GM-CSF (20 ng/mL; supplemented RPMI; day 0 of differentiation). Cells were incubated for 3 days at 37 °C 5% CO2. On day 3, the medium was replaced with an equal volume of fresh, supplemented RPMI. On days 6 and 8, half the supplemented RPMI was replaced with fresh supplemented RPMI containing 20 ng/mL GM-CSF. On day 10, BMDC were recovered from the supernatant, followed by extended washing with warm RPMI to recover semi-adherent BMDC. Supernatants were centrifuged at 300g for 10 min. Cells were washed, and viable cells were counted using the trypan blue exclusion method. BMDC were used for the viability assay, for analysis of activation marker expression upon in vitro stimulation with TGMP and TgS, and for a co-culture assay with T cells from immunised animals to determine the proliferative capacity of primed T cells, as described below.
2.7. Cell viability assay
Cell viability was assessed by the thiazolyl blue tetrazolium bromide (MTT) reduction assay using spleen cells obtained from naïve BALB/c mice as previously described [14] and BMDC obtained as described above. Briefly, cells were seeded in 96-well plates at a density of 1 × 10⁵ cells/well. TGMP and TgS were added at 0.5-50 × 103 ng/mL and resuspended in supplemented RPMI. After 24 hours of treatment, 20 µL of MTT solution (Thermo-Fisher, Massachusetts, USA) was added to each well, and the plates were incubated at 37 °C and 5% CO2 for 3 hours. Formazan crystals were solubilized by a DMSO and isopropanol mixture (3:1). Absorbance was measured at 540 nm using a Synergy™ HTX multi-mode microplate reader (BioTek Instruments). Cell viability percentage was calculated by comparing the mean absorbance values of triplicate samples from treated and untreated control cells. CC50 was determined by nonlinear regression using GraphPad Prism (version 8.0.2, San Diego, California).
2.8. BMDC activation profile by flow cytometry
BMDC were seeded at 2 × 10⁵ cells/well in a round 96-well plate. Cells were stimulated with TGMP (4 µg/mL), TgS (4 µg/mL), and LPS (positive control; 0,1µg/mL; Sigma-Aldrich, St. Louis, Missouri, USA) with or without Polymixin B (8 µg/mL; Sigma-Aldrich, St. Louis, Missouri, USA) for 4 and 16 hours at 37°C in 5% CO2. The supernatant was discarded after centrifugation at 630g for 2 minutes at 8°C. Cells were incubated with APC eFluor 780 fixable viability dye (FVD) for 15 minutes at 4°C. After washing with PBS, monoclonal antibodies (mAbs) specific for surface markers were added to the cells and incubated for 25 minutes on ice, protected from light. The following mAbs were used: Alexa Fluor 647 anti-mouse Ly6G Ab (clone 1A8); eFluor 450 anti-mouse CD11c (clone N418); PerCP/Cy5.5 anti-mouse F4/80 (clone BM8); PE anti-mouse I-A/I-E (MHC II) Ab (clone M5/114.15.2); FITC anti-mouse CD80 (clone B7-1); PE/Cy7 anti-mouse CD86 (clone GL1). Cells were fixed in PBS containing 2% paraformaldehyde (PBS-2 % PFA) and washed with FACS buffer (2% foetal bovine serum (FBS) in 10 mM Sodium Azide in PBS). Each cell suspension was filtered into 5 mL round-bottom polystyrene test tubes using a cell strainer (Corning Falcon). Cell acquisition was performed in a BD FACSCanto™ II cytometer (BD Biosciences, New Jersey, USA) using FACS Diva™ software. Fluorescence minus one (FMO) and single stainings were performed to ensure accurate interpretation and analysis of data. Data were analysed using_FlowJo version 10.8.1 software (Tree Star Inc., Oregon, USA). The gating strategy used is shown in Supplementary Figure 1. Cells were gated based on forward scatter/side scatter (FSC-A/SSC-A), and the singlets were gated according to FSC-A vs FSC-H. Viable dendritic cells (DCs) were defined as CD11c+F4/80-Ly6G-FVD-. The number of events acquired for each sample was 50000 in the CD11c+F4/80-Ly6G-FVD- population. The expression of the activation markers was evaluated by the mean fluorescence intensity (MFI) for MHC II, CD80, or CD86 in the CD11c+Ly6G-F4/80- population.
2.9. Mouse immunisation, infection, and sample collection
Mice were randomly assigned to groups and i.n. immunised twice with an interval of three weeks with: CpG (ODN 1826 VacciGrade, Invivogen, San Diego, CA) at 0.25 μg/mL (5 μg per animal; 0.2 mg/Kg) or 0.5 mg/mL (10 μg per animal; 0.4 mg/Kg) plus TGMP at 0.5 mg/mL (10 µg per animal; 0.4 mg/Kg) or 1.5 mg/mL (30 µg per animal; 1.2 mg/Kg), all resuspended in saline solution (0.9% NaCl; TGMP+CpG group) or CpG alone at 0.25 μg/mL or 0.5 mg/mL resuspended in saline solution (CpG group, sham-immunised animals). The total number of animals used for each group and experiment is detailed in Supplementary Table 1. The animals were i.n. immunised with 20 µL of the formulation distributed through both nostrils, on day 0, under light isoflurane anaesthesia. This procedure was repeated three weeks after the first immunisation (corresponding to the booster immunisation). Two weeks after the booster immunisation, sera were collected from mice from experiments #1, #3, #4, and #5.
The UniProt 2021_03 database for the taxonomic selection of the proteome of T. gondii (strain ATCC 50611 / Me49) was considered for protein identification. Protein identification was performed with the Proteome Discoverer software (v2.5, Thermo Scientific). The proteins presented were identified by mass spectrometry after an approach of immunoproteomics and were considered based on the sequence coverage &#;10%, Unique peptide&#;2 and Score Sequest HT &#;1.5. aInformation obtained from the UniProt database for the specified entry.
The blood was collected from a tail puncture after light isoflurane anesthesia. Blood was collected (approximately 100 µL) and left at room temperature for one hour to clot. The samples were centrifuged at 2700 g for 20 minutes at 4°C, and serum was collected into labelled tubes and stored at -80°C for later quantification of TGMP-specific IgG1 and IgG2a antibodies and Western blotting.
In in vivo infection experiments, 3, 9, and 13 weeks after booster immunisation, animals were intraperitoneally (i.p.) infected with 5 ×10³ viable tachyzoites (inoculum volume of 200 μL). For inoculum preparation, parasites were isolated as previously described and resuspended in saline to a final concentration of 2.5 × 10⁴ parasites/mL. Five days post-infection (dpi) or one day dpi, mice were sacrificed. Peritoneal exudate cells (PEC) were collected by washing the peritoneal cavity with 3 mL of PBS/10 % SBF. These cells were then centrifuged at 4000g for 10 minutes, and the cell pellet was stored at -80 °C for later quantification of parasite load. Spleen, liver, lungs, heart, kidney, and brain were collected and stored at -80 °C for later quantification of parasite load.
Spleens were collected, processed as previously described [14], briefly cell suspensions were prepared by gentle mechanical dissociation in PBS with 3% FCS, erythrocytes were removed with an ammonium chloride-based lysis buffer, and the remaining cells were resuspended in supplemented DMEM and counted for viability by trypan blue exclusion using a Neubauer chamber, and analysed for T cells by flow cytometry in immunisation and infection experiments.
Intestinal lavage fluids (ILF) were collected from the intestine after successive lavages with PBS containing cOmplete™ Mini, EDTA-free Protease Inhibitor Cocktail (Roche, Basel, Switzerland). Briefly, PBS containing protease inhibitors was passed several times through the intestinal lumen to remove all mucus and faecal content, and then centrifuged at 4500 g for 15 minutes at 4ºC. Supernatant was collected after centrifugation at 10000 g for 1 hour at 4ºC and stored at -80ºC until TGMP-specific IgA antibody quantification. Blood samples were collected before infection (mice were placed in an induction chamber filled with isoflurane vapour until they reached a surgical plane of anaesthesia, as indicated by loss of righting reflex and slowed breathing; the tail vein was accessed for blood collection using a needle), and after infection at the time of sacrifice. Sera were obtained as previously described and stored at -80°C for later detection of TGMP-specific IgG1 and IgG2a antibodies.
2.10. Immunoproteomic analysis of TGMP
TGMP immune recognition was analysed by Western blot. After an SDS-PAGE using an 8%-18% gradient gel as previously described, proteins were transferred to a nitrocellulose membrane (0.45 Micron; 47mm; Advantec, Chiyoda, Tokyo) using the Trans-Blot Turbo transfer system (Bio-Rad, California, USA). After blocking with 5% non-fat milk diluted in T-TBS solution (10 mM Tris Base; 50 mM NaCl; 0.1% Tween 20) (M-TTBS), the membrane was incubated overnight at 4°C with the pooled sera from nine CpG (10 μg CpG/animal) or TGMP+CpG (10 μg CpG + 30 μg TGMP/animal) immunised animals at a dilution of 1:5000, using 5% M-TTBS. After being washed with T-TBS, the membrane was incubated with horseradish peroxidase-labelled goat anti-mouse IgG antibody (Southern Biotech) at a 1:2000 dilution for one hour at room temperature. The immunoreactive proteins were detected using ECL Western blotting detection reagent and analysed on the ChemiDoc Touch Imaging System (Bio-Rad, California, USA). Molecular weights of the detected bands were determined using Santa Cruz Biotechnology’s Broad Range Markers (sc-2361).
To perform immunoprecipitation of immunodominant TGMP, an 8%-18% gradient SDS-PAGE gel was performed as previously described. After protein staining with coomassie blue, the protein bands corresponding to the molecular weights previously identified by Western-blot, were excised and proteins were extracted from the polyacrylamide gel by the addition of elution Buffer (50 mM Tris-HCl, 150 mM NaCl, 0.1 mM EDTA, pH 7.5) and incubated at 30°C overnight, with gentle agitation. Subsequently, the proteins were precipitated with absolute ethanol and, after drying, were resuspended in binding buffer (BB; 0.01M sodium phosphate, pH 7.0 and 0.15M sodium chloride). Agarose beads coated with Protein G (Invitrogen) were equilibrated with BB and then incubated with the sera from TGMP+CpG immunised mice for 1 hour at room temperature. After washing with BB, antibody-coated agarose beads were incubated with the protein solution extracted from the polyacrylamide gel for 1 hour at room temperature with gentle continuous agitation. After incubation, the column was washed with BB and incubated with the elution Buffer (0.1 M glycine HCl, pH 2.6) while shaking for 2 minutes. After centrifugation, the eluted proteins were recovered, resuspended in 1 M Tris Base, and stored at -80°C for later protein analysis. Protein identification and quantification were performed using nanoscale liquid chromatography-tandem mass spectrometry (nanoLC-MS/MS) as previously described [15]. Data acquisition was controlled by Tune 2.11 software (Thermo Scientific, Bremen, Germany). The UniProt 2021_03 database for the taxonomic selection of the proteome of T. gondii (strain ATCC 50611 / Me49) was considered for protein identification. Protein identification was performed with the Proteome Discoverer software (v2.5, Thermo Scientific).
2.11. Antibody quantification by enzyme-linked immunosorbent assay (ELISA)
The quantification of TGMP-specific serum IgG1 and IgG2 and intestinal lavage fluid IgA was performed by ELISA. Ninety-six-well flat-bottom microtiter plates (Nunc MaxiSorp plates, Thermo Fisher Scientific) were coated overnight at 4°C with TGMP (5 µg/mL) in PBS. The plate was washed with TST buffer (10 mM Tris, pH 8.0; 150 mM NaCl; 0.005% Tween-20) and then blocked in TST buffer containing 2% BSA for one hour at room temperature. The solution was discarded, and 50 μL of the sample diluted in TST with 1% BSA (TST/1 % BSA) was added and incubated for one hour at room temperature. Six serial 1:3 dilutions were made, starting at 1:90 for serum and 1:10 for ILF. After incubation, the plate was washed 3 times with TST buffer, and the secondary antibody was added and incubated for one hour at room temperature. For IgG1 and IgG2a, Alkaline Phosphatase (AP)-Goat anti-mouse IgG1 (Southern Biotech, Birmingham, USA) and AP-Goat anti-mouse IgG2a (Southern Biotech, Birmingham, USA), respectively, were used at a fold dilution of 1:1000 in TST/1% BSA. For IgA, AP-Goat anti-mouse IgA (Southern Biotech, Birmingham, USA) was used at a dilution of 1:500 in TST/1% BSA. The plates were then washed three times with TST. The substrate was prepared by dissolving one p-nitrophenyl phosphate substrate tablet (Sigma-Aldrich, St. Louis, Missouri, USA) in 5 mL of AP buffer (50 mM Na2CO3, 1 mM MgCl2). Then, 50 μL was added per well and incubated in the dark at room temperature for 20 minutes. The reaction was stopped with 50 μL per well of 0.1 M EDTA, pH 8.0, and the colorimetric signal was quantified by measuring the absorbance at 405 and 570 nm in the Synergy HTX Multi-Mode Microplate Reader and using the Gen5 2.0 Data Analysis Software (both from BioTek Instruments, Vermont, USA).
2.12. Antigen-specific T cell proliferation by flow cytometry
A co-culture assay was performed using BMDC generated as described above and spleen T cells from CpG- or TGMP+CpG-immunised animals, prepared as previously described [14]. BMDC were seeded in 96-well round-bottom plates at a density of 2.5 × 10⁴ cells/well, and stimulated with TGMP (4 µg/mL) or TgS (4 µg/mL). A positive control was included, consisting of overnight stimulation with purified (no azide/low endotoxin) anti-CD3e (1µg/mL; clone 145-2C11; BD Biosciences, New Jersey, USA). Splenic T cells were isolated from TGMP+CpG or CpG immunised mice (15 weeks after boost immunisation) using the MojoSort™ Mouse CD3 T Cell Isolation Kit (BioLegend, California, USA), according to the manufacturer’s instructions, yielding untouched CD3⁺ T cells. Isolated T cells were labelled with CellTrace™ Violet (CTV) stain (Thermo Fisher Scientific) at 1:500 for 20 minutes at 37°C in the dark. To neutralize free reactive dye, T cells were resuspended in complete RPMI. BMDC (2.5 × 10⁴ cells/well) were co-cultured with CTV-labelled T cells (1 × 10⁵ cells/well) in 96-well round-bottom plates at a 1:4 ratio (BMDC: T cells) in complete RPMI for 5 days at 37°C, 5% CO₂. Control wells included T cells cultured with unstimulated BMDC. After incubation, the supernatants were stored for future analyses, upon centrifugation at 630g for 2 minutes at 8°C. Cells were incubated with APC eFluor 780 fixable viability dye (FVD; Invitrogen) for 15 minutes at 4°C. After washing with PBS, antibodies specific for T cell surface markers were added to the cells and incubated for 25 minutes on ice, protected from light. The following mAbs were used: APC anti-mouse CD3ε (clone 145-2C11; BioLegend), PE anti-mouse CD4 (clone RM4-5; BioLegend), FITC anti-mouse CD8 (clone 53-6.7; BioLegend). After incubation, the cell suspension was washed with FACS buffer and fixed in PBS-2% Paraformaldehyde (PFA) for 20-25 minutes at room temperature. After being washed and resuspended in FACS buffer, cells were filtered using a 5 mL round-bottom polystyrene test tube with a cell strainer (Corning). Cell acquisition was performed using BD FACSymphony A1 (BD Biosciences, New Jersey, USA). Fluorescence minus one (FMO) and single stainings were performed to ensure accurate interpretation and analysis of data. Data were analysed using FlowJo version 10.8.1 software (Tree Star Inc., Oregon, USA). The gating strategy is indicated in the Supplementary Figure 2. Cells were gated based on forward scatter/side scatter (FSC-A/SSC-A), and the singlets were gated according to FSC-A vs FSC-H. The number of events acquired for each sample was 30000 in the singlets and FVD- cell population. The CD4+ T cells were defined as CD3+CD4+CD8-, and CD8+ T cells were defined as CD3+CD8+CD4-. The percentage of proliferating CD4⁺ and CD8⁺ T cells was determined by the reduction in CTV fluorescence intensity, with each cell division corresponding to a halving of fluorescence.
2.13. DNA extraction and Quantitative Real-time PCR (Q-PCR)
Genomic DNA (gDNA) was extracted from spleen, kidney, liver, lung, heart, brain and PEC by the phenol-chloroform method, followed by precipitation with ammonium acetate/ethanol. Tissues were homogenized with 2 mL of lysis buffer (75 mM NaCl and 25 mM EDTA) and the PEC pellet in 500 μl of lysis buffer. From each tissue, 500 μL aliquots were collected, to which 50 μL of 10% SDS (final concentration 1% SDS) and 10 μL of 25 mg/mL Proteinase K (final concentration 0.5 mg/mL) were added, and incubated overnight at 55 °C. Then, 500 μL of phenol-chloroform (Merck) was added to the samples, which were centrifuged at 6000g for 15 minutes at 4°C. The aqueous phase was transferred to another microtube to which 500 μL of phenol-chloroform was added, and then the samples were centrifuged for 15 minutes at 6000g at 4°C. The resulting aqueous phase was transferred to another microtube to which 100% ethanol and 7.5 M ammonium acetate were added in the following proportions: ethanol volume 2× the volume of the aqueous phase and ammonium acetate 1/3 the volume of the aqueous phase. The mixture was incubated for 1 hour at -80°C, then centrifuged at 16,000 g for 15 minutes at 4°C. The pellet (gDNA) was washed with 500 μL of 70% ethanol and centrifuged at 16000g for 10 minutes at 4°C. The supernatant was discarded, and the samples were incubated at 37ºC for 30 minutes to allow the remaining ethanol to evaporate. gDNA was resuspended in 200 μL of ultra-pure water and stored overnight at 4 °C to facilitate solubilization. Samples were quantified using the Thermo Scientific Nanodrop 1000 spectrophotometer. The DNA concentration was adjusted to 50 ng/mL for PE and 200 μg/mL for the other tissues as a template DNA.
T. gondii gDNA was detected by qPCR, using primers and a probe designed for the T. gondii surface antigen 1 (SAG-1; GenBank: X14080), giving rise to an amplification product of approximately 100 bp. Product amplification was performed with 1 μL of sample DNA, in a final volume of 10 μL containing 0.2 μmol/L of each primer (SAG-1 forward: CCAGAGCCTCATCGGTCGTC; SAG-1 reverse: GGGTCCTTCCGCAG ACAAC), 0.2 μmol/L of probe (6FAM-CTGTyTGCACCGTAGGAGCACCT-BBQ; all designed by Tib Molbiol) and Kapa probe Fast qPCR Master Mix (Kapa Biosystems). The PCR program run was as follows: (a) denaturation at 95°C, 3 minutes; (b) amplification in 40 cycles (denaturation at 95°C, 3 seconds; combined annealing/extension 60°C, 30 seconds). To quantify the samples, a standard curve of parasite gDNA isolated from T. gondii tachyzoites was used, ranging from 5 × 10² to 5 × 10⁻² ng (2 × 10⁷ to 2 × 10³ parasites) for each run. Quantitative evaluation of fluorescence signals from PCR products was performed with Step-One Plus and analysed with Step One Software V2.3 (both from Applied Biosystems by Life Technologies, Bleiswijk, Netherlands).
2.14. Interferon-gamma (IFN-γ) quantification by ELISA
Splenocytes from immunised mice (CpG or TGMP+CpG) were processed as described [14]. Spleen cells were plated at 2 × 10⁵ cells per well in 96-well round-bottom plates and stimulated in triplicate with one of the following conditions: 4 μg/mL TGMP, 4 μg/mL TgS, or 1 μg/mL Concanavalin A (ConA; positive control). Cells were incubated at 37°C in 5% CO₂ for 48 hours. Supernatants were collected and stored at −80°C until cytokine analysis. According to the manufacturer's instructions, IFN-γ concentrations in culture supernatants were measured using the Mouse IFN-γ (homodimer) Uncoated ELISA Kit (Thermo Fisher Scientific). Briefly, 96-well plates were coated overnight at 4°C with the provided capture antibody. After washing and blocking, 100 μL of standards, controls, or supernatant samples were added in triplicate and incubated for 2 hours at room temperature. Plates were washed, incubated with the biotinylated detection antibody for one hour, then incubated with streptavidin-HRP for 30 minutes. After a final wash, 3,3',5,5'-Tetramethylbenzidine substrate was added, and the reaction was stopped with the stop solution (1M H3PO4). Absorbance was measured at 450 nm using the Synergy HTX Multi-Mode Microplate Reader and using the Gen5 2.0 Data Analysis Software (both from BioTek Instruments, Vermont, USA). IFN-γ concentrations were determined by interpolation from a standard curve generated with recombinant mouse IFN-γ standards.
2.15. Evaluation of the memory phenotype of spleen TCD4+ and TCD8+ cells
As previously described, a single-cell suspension was prepared from the spleen of each mouse [14]. 1×10⁶ spleen cells were added to each well of a round 96-well plate. The supernatant was discarded after centrifugation at 630g for 2 minutes at 8°C. Cells were incubated with APC eFluor 780 fixable viability dye (FVD) for 15 minutes at 4°C. After washing with PBS, antibodies specific for surface markers were added to the cells and incubated for 25 minutes on ice, protected from light. The following mAbs were used: APC anti-mouse CD3 (clone 17A2), BV421 anti-mouse CD4 (clone RM4-5), PerCP/Cy 5.5 anti-mouse CD8 (clone 53-6.7), PECy7 anti-mouse CD44 (clone IM7) and PE anti-mouse CD62L (clone MEL14) (all from eBioscience, California, USA). After incubation, the cell suspension was washed with FACS buffer, fixed with PBS-2% PFA for 20-25 minutes at room temperature. After being washed twice and resuspended in FACS buffer, cells were filtered using 5 mL round-bottom polystyrene test tube with cell strainer (Corning Falcon). Cell acquisition was performed using BD FACSCanto™ II cytometer (BD Biosciences). Fluorescence minus one (FMO) and single stainings were performed to ensure accurate interpretation and analysis of data. Data were analysed using_FlowJo version 10.8.1 software (Tree Star Inc.). The gating strategy is indicated in the Supplementary Figure 3. Cells were gated based on forward scatter/side scatter (FSC-A/SSC-A), and the singlets were gated according to FSC-A vs FSC-H. The number of events acquired for each sample was 50000 in the singlet FVD-cell population. CD4+ T cells were defined as CD3+CD4+CD8-, and CD8+ T cells were defined as CD3+CD8+CD4. The CD4+ T or CD8+ T cells displaying a CD44+CD62L+ phenotype were considered central memory TCD4+ or TCD8+ cells, and those displaying a CD44+CD62L– phenotype were considered effector memory TCD4+ or TCD8+ cells.
2.16. Evaluation of intracellular IFN-γ, IL-17, and Granzyme B (GranzB) by T cells
Spleen cells (1×10⁶) were stimulated with TGMP (4 µg/mL) and TgS (4µg/mL) for 16 hours at 37ºC, 5% CO2. The positive control consisted of the cell stimulation with Phorbol 12-myristate 13-acetate (50 ng/mL) plus Ionomycin (500 ng/mL) (PMA/IONO; both from Sigma-Aldrich) for 4 hours at 37 ºC, 5% CO2. Brefeldin A (100 μg/mL) was added to each well and incubated for 2 hours at 37°C and 5% CO2. The supernatant was discarded after centrifugation at 630 g for 2 minutes at 8°C. Cells were incubated with APC eFluor 780 fixable viability dye (FVD) for 15 minutes at 4°C. After washing with PBS, antibodies specific for surface markers were added to the cells and incubated for 25 minutes on ice, protected from light. The following mAbs were used for surface antigen staining: eFluor 506 anti-mouse CD3 (clone 17A2), BV421 anti-mouse CD4 (clone RM4-5), PerCP/Cy5.5 anti-mouse CD8 (clone 53-6.7), PECy7 anti-mouse CD44 (clone IM7) (all from eBioscience, California, USA). After incubation, the cell suspension was washed with FACS buffer, fixed with PBS-2% PFA for 20-25 minutes at room temperature. After being washed twice with FACS buffer, cells were permeabilised with FACS buffer plus 0.5% Saponin (Sigma) for 10 minutes at room temperature. To avoid Fcγ receptor nonspecific binding, cells were preincubated with anti-mouse CD16/CD32 (clone S17011E; BioLegend) for 10-15 minutes at 4°C. The following mAbs were used for intracellular labelling: PECy7 anti-mouse IFN-γ (XMG1.2); PE anti-mouse IL-17A (TC11-18H10.1); and eFluor 450 anti-mouse GranzB (NGZB) (all from Biolegend). Cells were incubated for 30 minutes in the dark at room temperature. After being washed and resuspended in FACS buffer, cells were filtered using a 5 mL round-bottom polystyrene test tube with a cell strainer (Corning Falcon). Cell acquisition was performed using a BD FACSCanto™ II cytometer (BD Biosciences). Fluorescence minus one (FMO) and single stainings were performed for accurate data interpretation and analysis. Data were analysed using_FlowJo version 10.8.1 software (Tree Star Inc.). Cells were gated based on forward scatter/side scatter (FSC-A/SSC-A), and the singlets were gated according to FSC-A vs FSC-H. The number of events acquired for each sample was 50000 in the singlets FVD- cell population. The gating strategy is indicated in the Supplementary Figure 4. The CD4+ T cells were defined as CD3+CD4+CD8-, and CD8+ T cells were defined as CD3+CD8+CD4-. Activated CD4+T or CD8+T cells were evaluated based on CD44 expression (CD3+CD4+CD44+ or CD3+CD8+CD44+). The IFN-γ, IL-17 and GranzB were evaluated in the CD4+T (CD3+CD4+IFN-γ+, CD3+CD4+IL-17+ and CD3+CD4+GranzB+) or CD8+T cells (CD3+CD8+IFN-γ+, CD3+CD8+IL-17+ and CD3+CD8+GranzB+) and also in the activated CD4+T (CD3+CD4+ CD44+IFN-γ+, CD3+CD4+ CD44+IL-17+ and CD3+CD4+ CD44+GranzB+) or activated CD8+ T cells (CD3+CD8+CD44+IFN-γ+, CD3+CD8+CD44+IL-17+ and CD3+CD8+CD44+GranzB+).
2.17. Statistical analyses
GraphPad Prism version 9.0 (GraphPad Software, Inc., California, USA) was used for statistical analysis. For multiple group comparisons with one independent variable, a one-way ANOVA with a Tukey post hoc test was used (Figure 1D). For group analysis with two independent variables, two-way ANOVA with a Tukey’s post-test was performed (Figure 1B,C). Unpaired Student’s t-test was used to compare statistical differences between two groups, and a one-way analysis of variance (ANOVA) test and Dunn's multiple comparisons for experiments with 3 or more groups (Figure 1F,G and 2B–D). When normality or homogeneity of variances was not observed, comparisons were carried out using the Mann-Whitney test. A Shapiro-Wilk test of normality was done to decide whether to use parametric or non-parametric tests. For the data obtained by flow cytometry (Figure 3B,D,F,G) and ELISA (3E), a two-way analysis of variance (ANOVA) and Sidak’s multiple comparisons test was performed. Statistical significance was assessed for P ˂ 0.05.
2.18. Data availability
The datasets used and/or analysed during the current study are available from the corresponding author on reasonable request.
3. Results
3.1. TGMP extract reveals an enrichment of proteins at 20, 30, and 35 kDa
The TGMP were extracted from T. gondii Me49 tachyzoites obtained by in vitro infection of Vero cells and isolated using size-exclusion chromatography. A gradient SDS–PAGE was used to analyse TGMP and TgS under reducing conditions. TGMP exhibited an enrichment of three protein bands with molecular weights (MW) of approximately 20, 30, and 35 kDa, compared to the TgS (Figure 1A).
3.2. TGMP extract induces the activation of DCs.
The biocompatibility of TGMP and TgS was assessed using the MTT assay with mouse spleen cells and BMDC to identify safe concentrations for the subsequent in vitro studies. Lower TGMP and TgS concentrations were used for BMDCs than for splenocytes, as these primary cultures are more sensitive to protein antigens and more prone to cytotoxicity than the more robust splenocyte population. TGMP did not significantly affect spleen cell viability at concentrations below 10 µg/mL (Figure 1B). However, TGMP reduced BMDC viability below 70% within the concentration range of 0.5-50 µg/mL, although it remained above 50% (Figure 1C).
The yield of viable DC (CD11c+F4/80-Ly6G-FVD-) was around 40%, as confirmed by flow cytometry analysis following BMDC differentiation. The activation of DC by TGMP or TgS was evaluated by measuring the surface expression of MHC II, CD80, and CD86 on viable DC upon stimulation. DCs were stimulated with TGMP or TgS for 4h and 16h prior to flow cytometric analysis of MHCII, CD80, and CD86 expression, timepoints selected based on established activation kinetics where MHCII surface expression increases quickly via mobilization of pre-existing pools and reduced internalization, detectable within 2-6h post-stimulation. In contrast, costimulatory molecules CD80/CD86 require prolonged signalling for maximal transcription/translation, with peak surface levels often at 12-24h [16,17]. The results showed that TGMP and TgS significantly increased MHC II and CD86 expression on viable DCs at 4 and 16 hours, respectively. These increases were comparable to the expression levels induced by the positive control (LPS). No differences were observed in CD80 expression after TGMP or TgS stimulations (Figure 1D). CD86 upregulation without CD80 is a well-documented phenomenon in T. gondii-stimulated DCs, as CD86 responds more robustly to parasite antigens via distinct signalling thresholds (CD86 has lower activation requirements and faster TLR/MyD88 kinetics), whereas CD80 requires stronger/prolonged stimuli, such as LPS, for equivalent induction. CD86 upregulation without CD80 is a well-documented phenomenon in T. gondii-stimulated DCs, as CD86 responds more robustly to parasite antigens via distinct signalling thresholds (CD86 has lower activation requirements and faster TLR/MyD88 kinetics), whereas CD80 requires stronger/prolonged stimuli, such as LPS, for equivalent induction [18,19]. To further confirm that the increased expression of MHC II and CD86 on DC was not due to endotoxin contamination, polymyxin treatment was conducted simultaneously with the various stimuli. The reversion of the stimulatory effect was only observed for LPS stimulation (data not shown).
3.3. Prime-boost immunisation induces TGMP-specific antibodies
The immunisation strategy (Figure 1E) was based on a method previously used in the murine model to vaccinate against N. caninum, a parasite closely related to T. gondii [11]. Serum TGMP-specific IgG1 and IgG2a levels were quantified at short (2 and 3 weeks) and long term (17 weeks) after the booster immunisation (Figure 1F). Intestinal TGMP-specific IgA levels were quantified at long term (Figure 1G). The obtained results indicated a significant increase in TGMP-specific IgG1 and IgG2a in animals immunised with TGMP+CpG, compared with the sham-immunised mice receiving CpG alone (Figure 1F). Independent experiments in which varying amounts of TGMP and CpG were used showed that all combinations tested TGMP+CpG (10 µg + 5 µg, 30 µg + 5 µg, 10 µg + 10 µg) induced a significant increase in TGMP-specific circulating IgG1 and IgG2a compared to the sham-immunised animals (Supplementary Figure 5B). In fact, a mixed IgG1 and IgG2a response was observed at all the time points tested, along with the varying amounts of TGMP and CpG used (Figure 1F, Supplementary Figure 5B). However, it was noted that when using 5 µg of CpG in the immunisation, the IgG2a/IgG1 ratios shifted to values above 1.0, indicating that the IgG2a response was greater than that of IgG1 (Supplementary Figure 5B). A significant increase in TGMP-specific IgA in the ILF from TGMP+CpG-treated animals was observed compared to sham-immunised animals (Figure 1G), as well as when 5 µg of CpG was used (Supplementary Figure 5C).
3.4. Nine major immunogenic proteins identified in the TGMP extract
To identify the principal immunogenic proteins composing TGMP, western blot analysis was performed using sera from TGMP+CpG or sham-immunised mice. Three prominent bands were detected with molecular weights of approximately 19, 30, and 35 kDa when using sera from mice immunised with TGMP+CpG (Figure 1H), and this bands were consistently detected across biological replicates. The sera from the sham-immunised mice did not significantly recognise TGMP proteins (Supplementary Figure 5D). The protein molecular weights of the major bands detected by Western blot and stained SDS-PAGE (Figure 1A,H) were similar, probably corresponding to the same proteins. The bands were excised, proteins were extracted from the SDS-PAGE gel, pooled, and immunoprecipitated using Protein G-coated beads pre-incubated with sera from TGMP+CpG immunised mice. The eluted proteins were then analysed by mass spectrometry. The results indicated that the eluted fraction consisted of proteins from mice (Mus musculus) and the T. gondii Me49 strain (Supplementary file S1). In Table 1 are listed nine T. gondii Me49 proteins identified by mass spectrometry that presented sequence coverage ≥10%, unique peptide ≥ 2, and score sequest HT ≥ 1.5. The higher the score HT the higher the certainty in the protein identification. The following proteins are listed from the highest to the lowest sequence coverage: dense granule protein 7 (GRA7; https://www.uniprot.org/uniprotkb/O00933/entry), SAG-related sequence 25 (SRS 25; https://www.uniprot.org/uniprotkb/S8FBZ9/entry), dense granule protein 2 (GRA2, https://www.uniprot.org/uniprotkb/P13404/entry), SAG-related sequence SRS34A (SRS34A; https://www.uniprot.org/uniprotkb/A0A125YIJ3/entry), Toxofilin (https://www.uniprot.org/uniprotkb/S8G4J8/entry), SAG-related sequence 29B (SRS29B, https://www.uniprot.org/uniprotkb/A0A125YP09/entry), Nascent polypeptide-associated complex (NAC) domain-containing protein (https://www.uniprot.org/uniprotkb/A0A125YY47/entry), NAC subunit beta (https://www.uniprot.org/uniprotkb/S8GBN3/entry) and microneme protein 10 (MIC10; https://www.uniprot.org/uniprotkb/A0A125YLT9/entry).
GRA2 and GRA7 have been recognised as having a significant role in both the acute and chronic phases of T. gondii infection, making them potential candidates for an effective vaccine [20,21]. The Uniprot data available for SRS25, SRS29B, SRS34A, Toxofilin, NAC domain-containing protein, NAC subunit beta, and MIC 10 consisted of unreviewed entries.
3.5. TGMP-loaded BMDC induces T cell proliferation
To assess the proliferative capacity of TGMP-primed T cells in response to TGMP antigenic presentation by DCs, co-culture assays were conducted using BMDC pre-loaded with TGMP or TgS and spleen T cells isolated from TGMP-immunised or sham-immunised animals. A positive control, consisting of T cells stimulated with anti-CD3 mAb, was included. As anticipated, a substantial increase in both CD4⁺ and CD8⁺ T cells in response to anti-CD3 stimulation was observed in both TGMP and sham-immunised mice, indicating that the T cells were functional and responsive. (Figure 1I). TGMP or TgS preloaded DCs induced detectable CD4⁺ T cell proliferation using T cells obtained from the spleens of mice immunised with TGMP+CpG as responders, but not from those immunised with CpG alone (Figure 1I). These results indicate that prior immunisation with TGMP induced TGMP and TgS-specific CD4⁺ memory T cells. A lower level of CD8⁺ T cell proliferation was observed using the same experimental conditions (Figure 1I). These results altogether indicate that the antigen recall response was predominantly restricted to the CD4⁺ T cell compartment.
3.6. Mice i.n. immunised with TGMP+CpG presented a lower parasitic burden upon infection with T. gondii.
The parasite load in the peritoneal exudate (PE) and organs (spleen, lung, liver, kidney, heart, and brain) collected from acutely infected animals (5 dpi) was assessed 3, 9, and 13 weeks after the boost immunisation (Figure 2A, B). As demonstrated, immunisation with TGMP+CpG (30 µg + 10 µg) significantly reduced parasite load in the PE and lungs at 3, 9, and 13 weeks after the boost compared with sham-immunised animals. In the spleen, a significant decrease in parasitic burden was observed 9 and 13 weeks after the boost immunisation. A tendency toward reduced parasitic load was observed in the liver, kidney, heart, and brain, although it did not reach statistical significance. The parasite load was also determined in the PE and tissues of mice immunised with different combinations of TGMP+CpG (10 µg + 5 µg; 30 µg+ 5 µg; 10 µg + 10 µg, Supplementary Figure 6A). In accordance with the results presented above, the parasite load was significantly reduced in the TGMP+CpG group compared to sham-immunised animals for all the TGMP+CpG combinations used. A decrease in the spleen, lung, and liver was also found, although it was not consistently significant (Supplementary Figure 6B). Taken together, these results showed a protective effect against T. gondii induced by i.n. immunisation with TGMP+CpG in both the short and long term.
3.7. Raised TGMP-specific antibody levels induced by immunisation are sustained following infection.
The levels of TGMP-specific IgG1 and IgG2a were measured in infected mice, 3, 9 and 13 weeks after booster immunisation with TGMP+CpG (30 µg TGMP + 10 µg CpG) or CpG alone (10 µg) (Figure 2C). The levels of IgG1 and IgG2a were similar to those previously quantified before infection, and a significant increase was observed in TGMP-specific IgG1 and IgG2a titres in the TGMP+CpG immunised mice compared to the sham-immunised mouse groups (Figure 2C). The significant differences were maintained when using different combinations of CpG and TGMP (Supplementary Figure 6B). A mixed IgG1 and IgG2a isotype profile was observed for all the experimental conditions assayed (Figure 2C and Supplementary Figure 6C).
The levels of parasite antigen-specific IgA were found significantly elevated at 3, 9, and 13 weeks following the TGMP+CpG booster immunisation in infected mice when compared to infected sham-immunised mice (Figure 2D). Using lower quantities of TGMP (10 µg) for immunisation also significantly increased IgA levels. However, when lower quantities of CpG (5 µg) were used, no differences were observed between TGMP+CpG immunised animals and sham-immunised animals, indicating that the amount of adjuvant is a key factor in achieving significant specific mucosal immunity (Supplementary Figure 6D).
3.8. TGMP immunisation did not affect the number of total and memory splenic T cells detected after T. gondii infection.
T cells play a critical role in immunity against T. gondii infection, essential in developing protective immunity against this parasite [3]. Subsequent experiments enabled us to investigate the role of vaccination-induced T cells from the very earliest stages following infection. For this, mice were infected three weeks after the boost immunisation and sacrificed one day post-infection (1 dpi; Figure 3A). The memory phenotype of T cells was evaluated ex vivo by flow cytometry. No differences were observed in the total numbers of CD4+ and CD8+ T cells (Figure 3B), as well as in the numbers of effector memory T cells (CD4+ or CD8+ TEM) and central memory T cells (CD4+ or CD8+ TCM) in both the TGMP+CpG and CpG immunised animals (Figure 3C,D).
3.9. IFN-γ production is induced by TGMP immunisation in response to T. gondii infection
IFN-γ is a crucial cytokine involved in the immune response against T. gondii, essential for controlling the parasite growth and ensuring host survival [22]. The levels of IFN-γ produced by splenocytes from immunised mice after recall stimulation with TGMP provided valuable information about the strength and specificity of the cellular immune response induced by TGMP+CpG or CpG immunisations. Mice were infected three weeks after the boost immunisation and sacrificed 1 dpi (Figure 3A).
A significantly higher production of IFN-γ by spleen cells of TGMP+CpG immunised animals was observed in response to TGMP stimulation when compared with unstimulated cells. (Figure 3E; Ctrl-; **** P <0.0001;). Additionally, a significant increase in IFN-γ production by TGMP-stimulated splenocytes from infected TGMP+CpG mice was observed, compared to infected CpG immunised mice. (### P < 0.001; Figure 3E). These findings indicate that TGMP+CpG immunisation induces a TGMP-specific Th1-type immunity. The ex vivo stimulation with TgS did not result in a significantly higher production of IFN-γ compared to unstimulated cells, and no significant differences were observed between the ability of splenocytes from T. gondii-infected TGMP+CpG and CpG sham-immunised animals to produce IFN-γ in response to TgS (Figure 3E).
3.10. TGMP immunisation induces T cell activation in response to T. gondii infection
Total and activated spleen CD4+ and CD8+ T cells from animals immunised from the same experimental design as previously (Figure 3A) were assessed by flow cytometry, following ex vivo stimulation with specific (TGMP and TgS) and non-specific (PMA/IONO) stimuli. No differences were observed in the numbers of total or activated CD4+ T cells and CD8+ T cells from infected TGMP+CpG-immunised animals and CpG sham-immunised animals. (Figure 3 F,G). However, after TGMP stimulation, significantly increased numbers of total and activated CD4+ and CD8+T cells producing IFN-γ+ were detected in infected the TGMP+CpG group compared to the infected sham-immunised group. A significant increase in the number of total and activated CD4+T cells producing IL-17 was also observed. Moreover, a substantial increase in the number of total and activated CD8+ T cells producing GranzB was observed following TGMP stimulation in the TGMP+CpG group compared to the sham-immunised control group (Figure 3F,G). These results altogether indicate that in infected mice of the TGMP+CpG immunised mouse group, T cells are activated and produce protective cytokines in response to parasite antigens.
4. Discussion
In this work, an i.n. immunisation approach based on a previously developed vaccination strategy against neosporosis [11] was assessed. The aim was to evaluate whether protection against i.p. infection with T. gondii could be achieved by employing an immunisation route capable of eliciting both systemic and mucosal antigen-specific responses. Infection was carried out intraperitoneally, as several studies have used i.p. infection with T. gondii Me49 tachyzoites to analyse the acute phase infection [23,24]. Studies using the N. caninum model have shown that this mucosal vaccination strategy not only protects against intragastric N. caninum infection, but also against intraperitoneal infection, a route that efficiently promotes rapid widespread parasite dissemination [11,25,26]. In this work, TGMP was used as a target antigen in combination with CpG adjuvant, a TLR9 agonist that promotes Th1-type immunity mediated by IFN-γ, the prototypical host-protective response in toxoplasmosis [27]. The use of CpG as an adjuvant leads to robust mucosal and systemic immunity [11,28], which is important for preventing and controlling toxoplasmosis [29]. Intranasal vaccination promoted mucosal immunity assessed by the high levels of anti-TGMP secretory IgA, which may agglutinate and/or neutralise parasites at the intestinal surface and prevent their invasion of enterocytes, as observed for anti-NcMP specific IgA [11,25]; other studies have reported that intranasal T. gondii vaccines elicited strong intestinal IgA responses associated with significantly reduced pathology [30,31]. TGMP extract was enriched in proteins with molecular weights of approximately 20, 30, and 35 kDa. This protein profile differed from similarly produced NcMP, a result of genetic divergence and functional specialization, leading to unique antigenic signatures and immune responses in each parasite [11,32]. Here, T. gondii GRA2, GRA7, SRS25, SRS29B, SRS34A, toxofilin, NAC-domain containing protein, NAC subunit beta, and MIC-1 were identified as TGMP immunodominant proteins. GRA2 (28 kDa) and GRA7 (29 kDa) are crucial for parasite replication and immune modulation, with GRA7 being expressed in all parasite stages and highly targeted in vaccine studies [20,33]. Furthermore, three surface antigens with a score of 8.0 were identified as belonging to the SRS protein superfamily (sequences related to SAG1 proteins): SRS25, SRS29B (formerly known as SAG1), and SRS34A (formerly known as SAG2A). SRS25, SRS29B, and SRS34A are surface antigens belonging to the SRS protein superfamily, which are involved in host immune modulation and virulence. SRS25 is expressed in both tachyzoites and sporozoites, and while it has a "degraded" SRS domain, it still modulates the host immune response [34]. SRS29B and SRS34A are critical for host-parasite interactions, mediating invasion and immune evasion [35]. Toxofilin is an actin-binding protein found in T. gondii tachyzoites, which may facilitate host cell invasion by disrupting the actin network [36]. MIC10, an 18 kDa protein, is highly expressed in tachyzoites and is involved in protein trafficking and targeting [37]. NAC-domain-containing protein (20.5 kDa) and the NAC subunit beta (38.8 kDa) are associated with protein trafficking and targeting during expression [38]. The diverse functions, structures, and localisations of these TGMP immunogenic proteins make them strong candidates for inducing both humoral and cellular immunity upon immunisation.
DCs are present in the nasal-associated lymphoid tissue and are interconnected with epithelial cells, M cells, subepithelial B cells, CD4+ and CD8+ T cells, and are pivotal in the protection against T. gondii infection [39]. Thus, the immunogenicity of TGMP and TgS was evaluated in vitro using murine BMDCs (characterised as CD11c+F4/80-Ly6G-) as a model using primary cells mimicking the in vivo activation of DCs In our experimental setup, exposure to TGMP and TgS significantly increased the expression of MHC II and CD86 on DCs, indicating that these antigen extracts, per se, enhance DCs activation. The TGMP and TgS components that stimulate DCs, as well as the putative PRRs, have not yet been identified. Our results also suggest preferential activation of CD4+ T cells: BMDC stimulated with TGMP or TgS induced antigen-specific proliferation of CD4⁺ T cells from TGMP+CpG immunised mice, but not of CD8⁺ T cells.
Another essential aspect of the immune response to T. gondii infection is the production of parasite-specific antibodies [40]. Parasite-specific antibodies block host cell invasion by parasites, facilitate phagocytosis through opsonisation, and activate the classical complement pathway [41]. The immunisation strategy used here effectively induced serum TGMP-specific IgG1 and IgG2a, as well as intestinal TGMP-specific IgA. The use of 10 µg and 30 µg of TGMP in the immunising preparation induced similar IgG1 and IgG2a titres. However, mucosal immunity depended on the CpG dose, since reducing the CpG dose from 10 µg to 5 µg failed to induce TGMP-specific IgA above control levels, as detected after infection. This finding is in accordance with other studies demonstrating that CpG effectively promotes IgA responses and antigen-specific IgG production by activating B cells [42]. The IgG2a/IgG1 ratio indicates that a balanced Th1/Th2 response was elicited by immunisation [43,44], which is described as important for the development of T. gondii resistance and host survival [45,46]. Moreover, these results indicate a vaccine-induced bias toward a Th1-type response, which is particularly significant given that we used BALB/c mice, which are naturally biased towards Th2-type immunity [47].
In the present study, we aimed to assess systemic vaccine efficacy rather than mucosal-mediated protection and focus on the host’s response when the parasite overcomes the mucosal barrier. Previous N. caninum vaccination using this vaccination strategy demonstrated both mucosal protection, achieved by intragastric infection, and systemic effective protection following infection via the i.p. route [11,25,26]. The i.p. route ensures strict dose control, high reproducibility, and straightforward monitoring, while the peritoneal cavity serves as the primary site for parasite multiplication and recruitment of neutrophils, lymphocytes, and monocytes, facilitating evaluation of broad systemic immunity [48].
A protective effect induced by immunisation was detected by assessing parasite load in PE, spleen, and lungs, but not consistently in other organs analysed, such as the liver, kidneys, heart, and brain. This data indicates that the liver, kidneys, heart, and brain exhibited lower parasite loads during the acute infection period.
Monocytes, neutrophils, and DCs play a key role in protecting the host against T. gondii by producing IL-12, which activates NK cells and T cells to secrete IFN-γ [3]. This cytokine is crucial for killing and inhibiting parasite replication [3,40]. CD4+ T cells are the main source of IFN-γ during both acute and chronic infection, providing essential help for CD8+ T cell responses [49]. CD8+ T cells, which also produce IFN-γ, are important effector cells for T. gondii control through cytotoxic activity [3]. Our results demonstrate that immunisation with TGMP+CpG, unlike CpG alone, induces both CD4+ and CD8+ T cell activation and elicits a significant TGMP-specific IFN-γ-mediated response.
IL-17 is another important cytokine in the control of T. gondii infection. Indeed, it facilitates neutrophil recruitment, mucosal defence, and macrophage activation, key factors in controlling pathogens such as T. gondii [50].
Intranasal immunisation with TGMP+CpG triggered TGMP-specific T cell responses, characterised by increased CD4+ T cells producing IFN-γ and IL-17, and CD8+ T cells producing Granzyme B and IFN-γ, indicating a protective immune response.
The activation of CD4+ T cells towards IL-17 and IFN-γ production reflects a mixed Th1/Th17 helper T cell response [51,52]. Although Th17 cells are often associated with hyperinflammation [53], their plasticity allows them to acquire IFN-γ production after vaccination, thereby enhancing Th1-type effector responses and promoting pathogen elimination, albeit at a potential cost of increased inflammation [54,55].
In T. gondii infection, Th17 responses are linked to both host defence and immunopathology, whereas durable control of the parasite relies predominantly on IFN-γ-driven Th1 immunity; chronic infection and some vaccine or immunization settings favour Th1 polarisation and IFN-γ production, which promotes parasite elimination but can also contribute to inflammation [56,57]. This dual-axis response (Th1/Th17) mirrors successful vaccine strategies against T. gondii and other intracellular pathogens, such as influenza and Listeria, where coordinated cytotoxicity and cytokine signalling are essential for effective protection [58,59,60,61].
The production of Granzyme B by CD8+ T cells is particularly important, as this key effector molecule enables cytotoxic T lymphocytes (CTLs) to directly eliminate infected host cells [58]. Granzyme B production indicates that CD8+ T cells were recently activated and able to directly eliminate target cells, thereby contributing to the effectiveness of vaccine-induced immunity [58]. The production of IFN-γ by CD8+ T cells additionally contributes to activate macrophages, enhancing their ability to clear pathogens and regulating the contraction and memory profile of CD8+ T cells, which is critical for establishing long-term immunity [59]. IFN-γ also suppresses IL-17 production by CD8+ T cells, ensuring that these cells maintain a focused cytotoxic and Th1-type response rather than adopting Th17-like characteristics [59,62]. The absence of IL-17 production in CD8+ T cells in this context is not a concern, as it rather indicates specialisation of these cells in the desired cytotoxic and Th1-type immunity [54,59].
In this study, the total T. gondii extract TgS was used as an internal control because it contains almost all T. gondii proteins, including soluble proteins, and has been shown to provide partial protection against T. gondii infection [63,64]. TgS showed the same ability as TGMP to activate DCs and stimulate antigen-specific T cell proliferation. However, TgS did not increase IFN-γ production by spleen cells compared with unstimulated controls, and no difference in IFN-γ levels was observed between the two groups of animals (CpG and CpG+TGMP immunised). Also, TgS stimulation increased the number of CD4+ T lymphocytes producing IFN-γ or IL-17, similar to TGMP, but had no effect on CD8+ T cells, unlike TGMP. These observations suggest that TGMP antigens could exert greater protective activity than those of TgS, as it induces CD8+ T cell responses, specifically the production of Granzyme B and IFN-γ.
Overall, the T cell responses induced in TGMP+CpG immunised mice reveal a multifaceted defence, combining CD8+ T cell cytotoxicity and CD4+ T cell cytokine support, which are essential for establishing durable protection against T. gondii infection.
Our study shows that TGMP are a valuable vaccine target, inducing antibody and cell-mediated immunity that provide effective protection against murine T. gondii infection. The next step will be to explore a multi-antigen approach, such as chimeric constructs combining immunodominant domains from the nine immunogenic proteins identified in TGMP. This will allow us to simplify delivery and boost immunogenicity, a determinant of vaccine efficacy, thereby offering considerable protection against this widespread and potentially fatal parasitic infection.
Acknowledgments:
None.
Author Contributions
.Carina Brito: data acquisition, analysis and interpretation; manuscript drafting; revision and final approval. Daniela Teixeira, Paula Goulart, Beatriz Rodrigues, Nuno Carvalho: data acquisition, analysis and interpretation; manuscript final approval. Alexandra Correia: experimental design, acquisition, analysis and interpretation of the data; participation in the manuscript's revision and final approval. Manuel Vilanova: data analysis and interpretation; participation in the manuscript's revision and final approval. Margarida Borges: experimental design, acquisition, analysis and interpretation of the data; manuscript drafting; revision and final approval.
Funding
This work is financed by national funds from FCT - Fundação para a Ciência e a Tecnologia, I.P., in the scope of the project UID/04378/2025 of the Research Unit on Applied Molecular Biosciences-UCIBIO and the project LA/P/0140/2020 of the Associate Laboratory Institute for Health and Bioeconomy —i4HB. CB is supported by FCT grant reference 2021.06472.BD and DOI https://doi.org/10.54499/2021.06472.BD.
Conflicts of interest
The authors state no conflict of interest.
References
- Smith, N.C.; Goulart, C.; Hayward, J.A.; Kupz, A.; Miller, C.M.; van Dooren, G.G. Control of human toxoplasmosis. Int. J. Parasitol. 2021, 51, 95–121. [Google Scholar] [CrossRef]
- Robert-Gangneux, F.; Dardé, M.L. Epidemiology of and diagnostic strategies for toxoplasmosis. Clin. Microbiol. Rev. 2012, 25(2), 264–96. [Google Scholar] [CrossRef]
- Brito, C.; Lourenço, C.; Magalhães, J.; Reis, S.; Borges, M. Nanoparticles as a Delivery System of Antigens for the Development of an Effective Vaccine against Toxoplasma gondii. Vaccines 2023, 11, 733. [Google Scholar] [CrossRef] [PubMed]
- Brito, C.; Silva, T.M.; Castro, M.M.; Wyrwas, W.; Oliveira, B.; Fonseca, B.M.; Oliveira, P.; Roberts, C.W.; Teixeira, N.; Borges, M. Toxoplasma gondii infection reduces serum progesterone levels and adverse effects at the maternal-foetal interface. Parasite Immunol. 2019, 42, e12690. [Google Scholar] [CrossRef] [PubMed]
- Dunay, I.R.; Gajurel, K.; Dhakal, R.; Liesenfeld, O.; Montoya, J.G. Treatment of Toxoplasmosis: Historical Perspective, Animal Models, and Current Clinical Practice. Clin. Microbiol. Rev. 2018, 31, e00057-17. [Google Scholar] [CrossRef] [PubMed]
- Mamaghani, A.J.; Fathollahi, A.; Spotin, A.; Ranjbar, M.M.; Barati, M.; Aghamolaie, S.; Karimi, M.; Taghipour, N.; Ashrafi, M.; Tabaei, S.J.S. Candidate antigenic epitopes for vaccination and diagnosis strategies of Toxoplasma gondii infection: A review. Microb. Pathog. 2019, 137, 103788. [Google Scholar] [CrossRef]
- Mamaghani, A.J.; Fathollahi, A.; Arab-Mazar, Z.; Kohansal, K.; Fathollahi, M.; Spotin, A.; Bashiri, H.; Bozorgomid, A. Toxoplasma gondii vaccine candidates: a concise review. Ir. J. Med. Sci. (1971 -) 2022, 192, 231–261. [Google Scholar] [CrossRef]
- Chu, K.-B.; Quan, F.-S. Recent progress in vaccine development targeting pre-clinical human toxoplasmosis. Parasites Hosts Dis. 2023, 61, 231–239. [Google Scholar] [CrossRef]
- Kaushik, S.; Kumari, L.; Deepak, R.K. Humanized mouse model for vaccine evaluation: an overview. Clin. Exp. Vaccine Res. 2024, 13, 10–20. [Google Scholar] [CrossRef]
- Nabi, H.; Rashid, I.; Ahmad, N.; Durrani, A.; Akbar, H.; Islam, S.; Bajwa, A.A.; Shehzad, W.; Ashraf, K.; Imran, N. Induction of specific humoral immune response in mice immunized with ROP18 nanospheres from Toxoplasma gondii. Parasitol. Res. 2016, 116, 359–370. [Google Scholar] [CrossRef]
- Ferreirinha, P.; Correia, A.; Teixeira-Coelho, M.; Osório, H.; Teixeira, L.; Rocha, A.; Vilanova, M. Mucosal immunization confers long-term protection against intragastrically established Neospora caninum infection. Vaccine 2016, 34, 6250–6258. [Google Scholar] [CrossRef]
- Wang, C.; Fu, S.; Yu, X.; Zhou, H.; Zhang, F.; Song, L.; Zhao, J.; Yang, Y.; Du, J.; Luo, Q.; et al. Toxoplasma WH3 Δrop18 acts as a live attenuated vaccine against acute and chronic toxoplasmosis. npj Vaccines 2024, 9, 1–13. [Google Scholar] [CrossRef]
- Blum, H.; Beier, H.; Gross, H.J. Improved silver staining of plant proteins, RNA and DNA in polyacrylamide gels. Electrophoresis 1987, 8, 93–99. [Google Scholar] [CrossRef]
- Borges, M.; Rosa, G.T.; Appelberg, R. The death-promoting molecule tumour necrosis factor-related apoptosis inducing ligand (TRAIL) is not required for the development of peripheral lymphopenia or granuloma necrosis during infection with virulentMycobacterium avium. Clin. Exp. Immunol. 2011, 164, 407–416. [Google Scholar] [CrossRef]
- Osório, H.; Silva, C.; Ferreira, M.; Gullo, I.; Máximo, V.; Barros, R.; Mendonça, F.; Oliveira, C.; Carneiro, F. Proteomics Analysis of Gastric Cancer Patients with Diabetes Mellitus. J. Clin. Med. 2021, 10, 407. [Google Scholar] [CrossRef] [PubMed]
- De Gassart, A. MHC class II stabilization at the surface of human dendritic cells is the result of maturation-dependent MARCH I down-regulation. Proc. Natl. Acad. Sci. U S A 2008, 105(9), 3491–6. [Google Scholar] [CrossRef] [PubMed]
- Li, J.-G.; DU, Y.-M.; Yan, Z.-D.; Yan, J.; Zhuansun, Y.-X.; Chen, R.; Zhang, W.; Feng, S.-L.; Ran, P.-X. CD80 and CD86 knockdown in dendritic cells regulates Th1/Th2 cytokine production in asthmatic mice. Exp. Ther. Med. 2016, 11, 878–884. [Google Scholar] [CrossRef]
- Gigley, J.P.; Bhadra, R.; Khan, I.A. CD8 T Cells andToxoplasma gondii: A New Paradigm. J. Parasitol. Res. 2011, 2011, 1–9. [Google Scholar] [CrossRef]
- Hargrave, K.E.; Woods, S.; Millington, O.; Chalmers, S.; Westrop, G.D.; Roberts, C.W. Multi-Omics Studies Demonstrate Toxoplasma gondii-Induced Metabolic Reprogramming of Murine Dendritic Cells. Front. Cell. Infect. Microbiol. 2019, 9, 309. [Google Scholar] [CrossRef]
- Mercier, C.; Lecordier, L.; Darcy, F.; Deslee, D.; Murray, A.; Tourvieille, B.; Maes, P.; Capron, A.; Cesbron-Delauw, M.-F. Molecular characterization of a dense granule antigen (Gra 2) associated with the network of the parasitophorous vacuole in Toxoplasma gondii. Mol. Biochem. Parasitol. 1993, 58, 71–82. [Google Scholar] [CrossRef]
- Jacobs, D.; Dubremetz, J.-F.; Loyens, A.; Bosman, F.; Saman, E. Identification and heterologous expression of a new dense granule protein (GRA7) from Toxoplasma gondii1Note: Nucleotide sequence data reported in this paper have been submitted to the GenBank™ Data Bank with the accession number U79158.1. Mol. Biochem. Parasitol. 1998, 91, 237–249. [Google Scholar] [CrossRef]
- Lüder, C.G.K. IFNs in host defence and parasite immune evasion during Toxoplasma gondii infections. Front. Immunol. 2024, 15, 1356216. [Google Scholar] [CrossRef] [PubMed]
- Wu, M.; Liu, S.; Chen, Y.; Liu, D.; An, R.; Cai, H.; Wang, J.; Zhou, N.; Obed, C.; Han, M.; et al. Live-attenuated ME49Δcdpk3 strain of Toxoplasma gondii protects against acute and chronic toxoplasmosis. npj Vaccines 2022, 7, 1–10. [Google Scholar] [CrossRef] [PubMed]
- Gavrilescu, L.C.; Denkers, E.Y. IFN-γ Overproduction and High Level Apoptosis Are Associated with High but Not Low Virulence Toxoplasma gondii Infection. J. Immunol. 2001, 167, 902–909. [Google Scholar] [CrossRef] [PubMed]
- Ferreirinha, P. Protective effect of intranasal immunization with Neospora caninum membrane antigens against murine neosporosis established through the gastrointestinal tract. Immunology 2014, 141(2), 256–67. [Google Scholar] [CrossRef]
- Ferreirinha, P.; Fróis-Martins, R.; Teixeira, L.; Rocha, A.; Vilanova, M.; Correia, A. Interferon-γ-dependent protection against Neospora caninum infection conferred by mucosal immunization in IL-12/IL-23 p40-deficient mice. Vaccine 2018, 36, 4890–4896. [Google Scholar] [CrossRef]
- Fisch, D.; Clough, B.; Frickel, E.-M. Human immunity to Toxoplasma gondii. PLoS Pathog. 2019, 15, e1008097. [Google Scholar] [CrossRef]
- Giddings, O.K.; Eickhoff, C.S.; Sullivan, N.L.; Hoft, D.F. Intranasal Vaccinations with the trans -Sialidase Antigen plus CpG Adjuvant Induce Mucosal Immunity Protective against Conjunctival Trypanosoma cruzi Challenges. Infect. Immun. 2010, 78, 1333–1338. [Google Scholar] [CrossRef]
- Cohen, S.B.; Denkers, E.Y. The gut mucosal immune response to Toxoplasma gondii. Parasite Immunol. 2015, 37, 108–117. [Google Scholar] [CrossRef]
- Yin, L.-T.; Ren, Y.-J.; You, Y.-J.; Yang, Y.; Wang, Z.-X.; Wang, H.-L. Intranasal immunisation with recombinant Toxoplasma gondii uridine phosphorylase confers resistance against acute toxoplasmosis in mice. Parasite 2023, 30, 46. [Google Scholar] [CrossRef]
- Liu, Z.; Yin, L.; Li, Y.; Yuan, F.; Zhang, X.; Ma, J.; Liu, H.; Wang, Y.; Zheng, K.; Cao, J. Intranasal immunization with recombinant Toxoplasma gondii actin depolymerizing factor confers protective efficacy against toxoplasmosis in mice. BMC Immunol. 2016, 17, 1–8. [Google Scholar] [CrossRef] [PubMed]
- Al-Bajalan, M.M.M.; Xia, D.; Armstrong, S.; Randle, N.; Wastling, J.M. Toxoplasma gondii and Neospora caninum induce different host cell responses at proteome-wide phosphorylation events; a step forward for uncovering the biological differences between these closely related parasites. Parasitol. Res. 2017, 116, 2707–2719. [Google Scholar] [CrossRef]
- Fischer, H.-G.; Stachelhaus, S.; Sahm, M.; E Meyer, H.; Reichmann, G. GRA7, an excretory 29 kDa Toxoplasma gondii dense granule antigen released by infected host cells. Mol. Biochem. Parasitol. 1998, 91, 251–262. [Google Scholar] [CrossRef]
- Wasmuth, J.D.; Pszenny, V.; Haile, S.; Jansen, E.M.; Gast, A.T.; Sher, A.; Boyle, J.P.; Boulanger, M.J.; Parkinson, J.; Grigg, M.E. Integrated Bioinformatic and Targeted Deletion Analyses of the SRS Gene Superfamily Identify SRS29C as a Negative Regulator ofToxoplasmaVirulence. mBio 2012, 3. [Google Scholar] [CrossRef]
- Theisen, T.C.; Boothroyd, J.C. Transcriptional signatures of clonally derived Toxoplasma tachyzoites reveal novel insights into the expression of a family of surface proteins. PLoS ONE 2022, 17, e0262374. [Google Scholar] [CrossRef]
- Delorme-Walker, V.; Abrivard, M.; Lagal, V.; Anderson, K.; Perazzi, A.; Gonzalez, V.; Page, C.; Chauvet, J.; Ochoa, W.; Volkmann, N.; et al. Toxofilin upregulates the host cortical actin cytoskeleton dynamics facilitating Toxoplasma invasion. J. Cell Sci. 2012, 125, 4333–4342. [Google Scholar] [CrossRef] [PubMed]
- Hoff, E.F.; Cook, S.H.; Sherman, G.D.; Harper, J.M.; Ferguson, D.J.; Dubremetz, J.-F.; Carruthers, V.B. Toxoplasma gondii: Molecular Cloning and Characterization of a Novel 18-kDa Secretory Antigen, TgMIC10. Exp. Parasitol. 2001, 97, 77–88. [Google Scholar] [CrossRef] [PubMed]
- Beatrix, B.; Sakai, H.; Wiedmann, M. The α and β Subunit of the Nascent Polypeptide-associated Complex Have Distinct Functions. J. Biol. Chem. 2000, 275, 37838–37845. [Google Scholar] [CrossRef]
- Lakhrif, Z.; Moreau, A.; Hérault, B.; Di-Tommaso, A.; Juste, M.; Moiré, N.; Dimier-Poisson, I.; Mévélec, M.-N.; Aubrey, N. Targeted Delivery of Toxoplasma gondii Antigens to Dendritic Cells Promote Immunogenicity and Protective Efficiency against Toxoplasmosis. Front. Immunol. 2018, 9, 317. [Google Scholar] [CrossRef]
- Dupont, C.D.; Christian, D.A.; Hunter, C.A. Immune response and immunopathology during toxoplasmosis. Semin. Immunopathol. 2012, 34, 793–813. [Google Scholar] [CrossRef]
- E Fadul, C.; Channon, J.Y.; Kasper, L.H. Survival of immunoglobulin G-opsonized Toxoplasma gondii in nonadherent human monocytes. Infect. Immun. 1995, 63, 4290–4. [Google Scholar] [CrossRef]
- Blaas, S.H.; Stieber-Gunckel, M.; Falk, W.; Obermeier, F.; Rogler, G. CpG-oligodeoxynucleotides stimulate immunoglobulin A secretion in intestinal mucosal B cells. Clin. Exp. Immunol. 2008, 155, 534–540. [Google Scholar] [CrossRef]
- Karakavuk, M.; Can, H.; Gül, A.; Döşkaya, A.D.; Alak, S.E.; Ün, C.; Gürüz, A.Y.; Döşkaya, M. GRA8 DNA vaccine formulations protect against chronic toxoplasmosis. Microb. Pathog. 2021, 158, 105016. [Google Scholar] [CrossRef] [PubMed]
- Cui, X.; Lei, T.; Yang, D.; Hao, P.; Li, B.; Liu, Q. Toxoplasma gondii immune mapped protein-1 (TgIMP1) is a novel vaccine candidate against toxoplasmosis. Vaccine 2012, 30, 2282–2287. [Google Scholar] [CrossRef]
- Ching, X.T.; Fong, M.Y.; Lau, Y.L. Evaluation of Immunoprotection Conferred by the Subunit Vaccines of GRA2 and GRA5 against Acute Toxoplasmosis in BALB/c Mice. Front. Microbiol. 2016, 7, 609–609. [Google Scholar] [CrossRef] [PubMed]
- Sana, M.; Rashid, M.; Rashid, I.; Akbar, H.; E Gomez-Marin, J.; Dimier-Poisson, I. Immune response against toxoplasmosis—some recent updates RH: Toxoplasma gondii immune response. Int. J. Immunopathol. Pharmacol. 2022, 36. [Google Scholar] [CrossRef]
- Schulte, S.; Sukhova, G.K.; Libby, P. Genetically Programmed Biases in Th1 and Th2 Immune Responses Modulate Atherogenesis. Am. J. Pathol. 2008, 172, 1500–1508. [Google Scholar] [CrossRef]
- C, S.S.; Hubal, A. Animal Models for Toxoplasma gondii Infection. Curr. Protoc. 2023, 3(9), e871. [Google Scholar] [CrossRef] [PubMed]
- Khan, I.A.; Hwang, S.; Moretto, M. Toxoplasma gondii: CD8 T Cells Cry for CD4 Help. Front. Cell. Infect. Microbiol. 2019, 9, 136. [Google Scholar] [CrossRef]
- Kelly, M.N.; Kolls, J.K.; Happel, K.; Schwartzman, J.D.; Schwarzenberger, P.; Combe, C.; Moretto, M.; Khan, I.A. Interleukin-17/Interleukin-17 Receptor-Mediated Signaling Is Important for Generation of an Optimal Polymorphonuclear Response againstToxoplasma gondiiInfection. Infect. Immun. 2005, 73, 617–621. [Google Scholar] [CrossRef]
- Crawford, M.P.; Sinha, S.; Renavikar, P.S.; Borcherding, N.; Karandikar, N.J. CD4 T cell-intrinsic role for the T helper 17 signature cytokine IL-17: Effector resistance to immune suppression. Proc. Natl. Acad. Sci. 2020, 117, 19408–19414. [Google Scholar] [CrossRef]
- Khader, S.A.; Gopal, R. IL-17 in protective immunity to intracellular pathogens. Virulence 2010, 1, 423–427. [Google Scholar] [CrossRef] [PubMed]
- Guiton, R.; Vasseur, V.; Charron, S.; Arias, M.T.; Van Langendonck, N.; Buzoni-Gatel, D.; Ryffel, B.; Dimier-Poisson, I. Interleukin 17 Receptor Signaling Is Deleterious duringToxoplasma gondiiInfection in Susceptible BL6 Mice. J. Infect. Dis. 2010, 202, 427–435. [Google Scholar] [CrossRef] [PubMed]
- Moroda, M.; Takamoto, M.; Iwakura, Y.; Nakayama, J.; Aosai, F. Interleukin-17A-Deficient Mice Are Highly Susceptible to Toxoplasma gondii Infection Due to Excessively Induced T. gondii HSP70 and Interferon Gamma Production. Infect. Immun. 2017, 85, e00399-17. [Google Scholar] [CrossRef]
- Pan, Y.; Yang, W.; Tang, B.; Wang, X.; Zhang, Q.; Li, W.; Li, L. The protective and pathogenic role of Th17 cell plasticity and function in the tumor microenvironment. Front. Immunol. 2023, 14, 1192303. [Google Scholar] [CrossRef]
- Gaddi, P.J.; Yap, G.S. Cytokine regulation of immunopathology in toxoplasmosis. Immunol. Cell Biol. 2007, 85, 155–159. [Google Scholar] [CrossRef]
- Fasquelle, F.; Vreulx, A.-C.; Betbeder, D. Improved ELISPOT protocol for monitoring Th1/Th17 T-cell response following T.gondii infection. PLoS ONE 2024, 19, e0301687. [Google Scholar] [CrossRef]
- Otani, N.; Nakajima, K.; Ishikawa, K.; Ichiki, K.; Ueda, T.; Takesue, Y.; Yamamoto, T.; Tanimura, S.; Shima, M.; Okuno, T. Changes in Cell-Mediated Immunity (IFN-γ and Granzyme B) Following Influenza Vaccination. Viruses 2021, 13, 1137. [Google Scholar] [CrossRef]
- Goulding, J.; Abboud, G.; Tahiliani, V.; Desai, P.; E Hutchinson, T.; Salek-Ardakani, S. CD8 T Cells Use IFN-γ To Protect against the Lethal Effects of a Respiratory Poxvirus Infection. J. Immunol. 2014, 192, 5415–5425. [Google Scholar] [CrossRef] [PubMed]
- Porte, R.; Belloy, M.; Audibert, A.; Bassot, E.; Aïda, A.; Alis, M.; Miranda-Capet, R.; Jourdes, A.; van Gisbergen, K.P.J.M.; Masson, F.; et al. Protective function and differentiation cues of brain-resident CD8+ T cells during surveillance of latent Toxoplasma gondii infection. Proc. Natl. Acad. Sci. 2024, 121. [Google Scholar] [CrossRef]
- Suzuki, Y. Interferon-gamma- and perforin-mediated immune responses for resistance against Toxoplasma gondii in the brain. Expert Rev. Mol. Med. 2011, 13, e31. [Google Scholar] [CrossRef] [PubMed]
- Tewari, K.; Nakayama, Y.; Suresh, M. Role of Direct Effects of IFN-γ on T Cells in the Regulation of CD8 T Cell Homeostasis. J. Immunol. 2007, 179, 2115–2125. [Google Scholar] [CrossRef]
- Yap, G.S.; Scharton-Kersten, T.; Ferguson, D.J.; Howe, D.; Suzuki, Y.; Sher, A. Partially protective vaccination permits the development of latency in a normally virulent strain of Toxoplasma gondii. 1998, 66, 4382–8. [Google Scholar]
- Wagner, A.; Schabussova, I.; Ruttkowski, B.; Peschke, R.; Kur, J.; Kundi, M.; Joachim, A.; Wiedermann, U. Prime-Boost Vaccination with Toxoplasma Lysate Antigen, but Not with a Mixture of Recombinant Protein Antigens, Leads to Reduction of Brain Cyst Formation in BALB/c Mice. PLoS ONE 2015, 10, e0126334. [Google Scholar] [CrossRef] [PubMed]
Figure 1.
T. gondii membrane antigen extract (TGMP) characterization, biological evaluation, and immunomodulatory effect. (A) Protein profile of TGMP and whole antigen extract (TgS). Gradient SDS-PAGE (8-18% acrylamide gel) after silver nitrate staining. Standard protein molecular weight (MW). (B-C) Effect of TGMP or TgS on cell viability using spleen cells and bone-marrow-derived dendritic cells (BMDC). Cells were treated with different concentrations of TGMP or TgS for 24h. Triplicates were run for each tested concentration, and data are expressed as mean + SD (Data shown is representative of three independent experiments). *P<0.05; **P<0.01; ***P<0.001; ****P<0.0001; ns = not significant. (D) Effect of TGMP and TgS on BMDC activation markers, MHCII, CD80 and CD86 after 4 and 16 hours of stimulation. Lipopolysaccharide (LPS) was used as a positive control. Data are expressed as mean ± SD (n = 3). *P<0.05; **P<0.01; ***P<0.001; ****P<0.0001. MFI: Mean Fluorescence Intensity. Comparisons were made between stimulated cells and unstimulated cells (Ctr-) for each time point. (E) Experimental design for in vivo experiments. BALB/c mice were intranasally immunised twice with CpG alone (CpG; 10 µg per animal) or CpG adjuvant plus TGMP (TGMP+CpG; 30 µg + 10 µg per animal). At 2, 3 and 17 weeks after the boost immunisation, the samples were collected for analysis. (F-G) Quantification of TGMP-specific IgG1 and IgG2a in the serum at 2, 3, and 17 weeks after the booster immunisation, and TGMP-specific IgA in the intestinal lavage fluids at 17 weeks after boost immunisation. The numbers above each graph represent the IgG2a/IgG1 ratio for each time point. Each dot represents an individual mouse, and horizontal lines correspond to the mean value in each group (2 weeks, n=6; 3 weeks, n = 8; 17 weeks, n = 5); Data are expressed as mean ± SD of the log10 of the antibody titres. **P<0.01; ***P<0.001; ****P<0.0001. Comparisons were made between CpG and TGMP+CpG groups. (H) Detection of immunogenic proteins from TGMP. Western blot was performed using pooled sera from immunised BALB/c mice with TGMP+CpG, collected 3 weeks after booster immunisation. Standard protein molecular weight (MW) is expressed in kDa. (I) T cell proliferation following in vitro co-culture of BMDC pre-loaded with TGMP or TgS and spleen T cells isolated from TGMP-immunised or sham-immunised (15 weeks after booster immunisation). Anti-CD3 stimulation was used as the positive control. Representative image from three independent experiments, each comprising a single measurement per condition.
Figure 1.
T. gondii membrane antigen extract (TGMP) characterization, biological evaluation, and immunomodulatory effect. (A) Protein profile of TGMP and whole antigen extract (TgS). Gradient SDS-PAGE (8-18% acrylamide gel) after silver nitrate staining. Standard protein molecular weight (MW). (B-C) Effect of TGMP or TgS on cell viability using spleen cells and bone-marrow-derived dendritic cells (BMDC). Cells were treated with different concentrations of TGMP or TgS for 24h. Triplicates were run for each tested concentration, and data are expressed as mean + SD (Data shown is representative of three independent experiments). *P<0.05; **P<0.01; ***P<0.001; ****P<0.0001; ns = not significant. (D) Effect of TGMP and TgS on BMDC activation markers, MHCII, CD80 and CD86 after 4 and 16 hours of stimulation. Lipopolysaccharide (LPS) was used as a positive control. Data are expressed as mean ± SD (n = 3). *P<0.05; **P<0.01; ***P<0.001; ****P<0.0001. MFI: Mean Fluorescence Intensity. Comparisons were made between stimulated cells and unstimulated cells (Ctr-) for each time point. (E) Experimental design for in vivo experiments. BALB/c mice were intranasally immunised twice with CpG alone (CpG; 10 µg per animal) or CpG adjuvant plus TGMP (TGMP+CpG; 30 µg + 10 µg per animal). At 2, 3 and 17 weeks after the boost immunisation, the samples were collected for analysis. (F-G) Quantification of TGMP-specific IgG1 and IgG2a in the serum at 2, 3, and 17 weeks after the booster immunisation, and TGMP-specific IgA in the intestinal lavage fluids at 17 weeks after boost immunisation. The numbers above each graph represent the IgG2a/IgG1 ratio for each time point. Each dot represents an individual mouse, and horizontal lines correspond to the mean value in each group (2 weeks, n=6; 3 weeks, n = 8; 17 weeks, n = 5); Data are expressed as mean ± SD of the log10 of the antibody titres. **P<0.01; ***P<0.001; ****P<0.0001. Comparisons were made between CpG and TGMP+CpG groups. (H) Detection of immunogenic proteins from TGMP. Western blot was performed using pooled sera from immunised BALB/c mice with TGMP+CpG, collected 3 weeks after booster immunisation. Standard protein molecular weight (MW) is expressed in kDa. (I) T cell proliferation following in vitro co-culture of BMDC pre-loaded with TGMP or TgS and spleen T cells isolated from TGMP-immunised or sham-immunised (15 weeks after booster immunisation). Anti-CD3 stimulation was used as the positive control. Representative image from three independent experiments, each comprising a single measurement per condition.
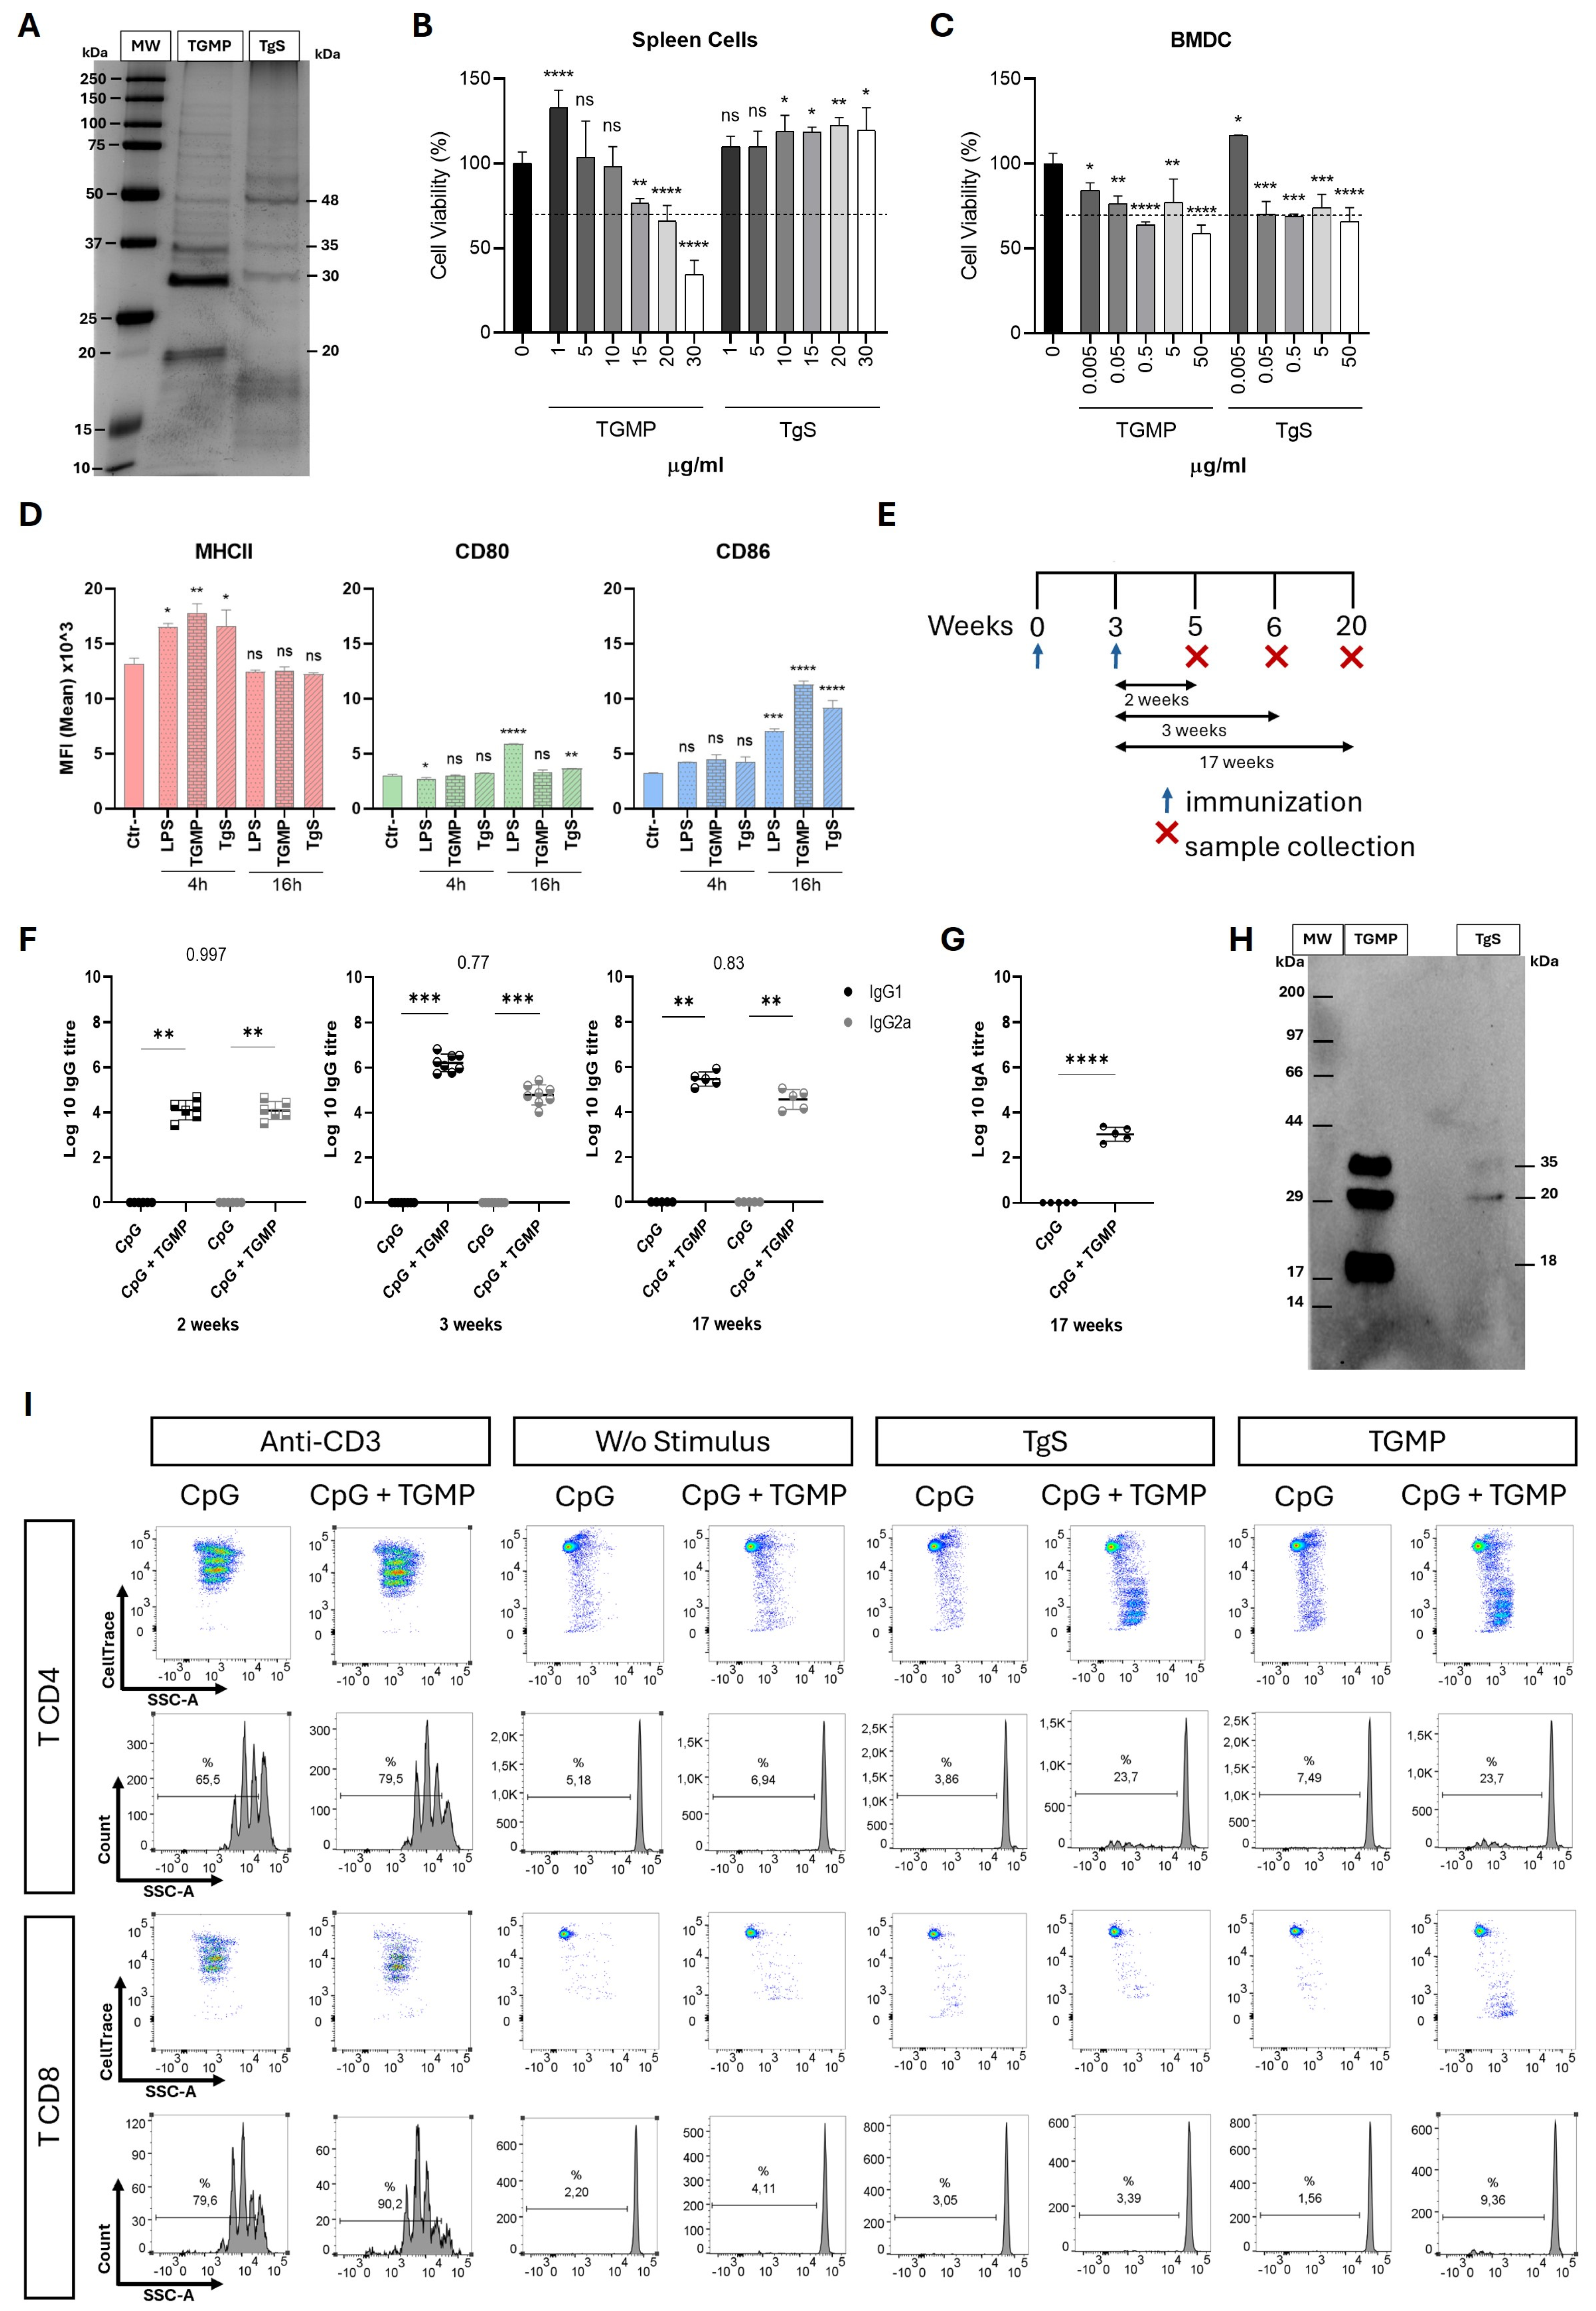
Figure 2.
Intranasal (i.n.) immunisation with T. gondii membrane antigen extract (TGMP) induces partial protection against acute infection and TGMP-specific humoral responses. (A) Experimental design for in vivo experiments. BALB/c mice were intranasally immunised twice with CpG alone (CpG; 10 µg per animal) or CpG adjuvant plus TGMP (TGMP+CpG; 30 µg + 10 µg per animal). Mice were intraperitoneally infected with 5000 tachyzoites of the Me49 T. gondii strain at 3, 9 and 13 weeks after the boost immunisation. Five days post-infection (5 dpi), the samples were collected for analysis. (B) Protective effect of i.n. immunisation with CpG plus TGMP (TGMP+CpG) against acute T. gondii infection. The parasite load was quantified by quantitative PCR for SAG-1, in the peritoneal exudate (PE), spleen, lung, liver, kidney, heart and brain. Each dot represents an individual mouse (3 weeks, n = 6; 13 and 9 weeks, n = 8). Data are expressed as mean ± SD. * P<0.05; **P<0.01; ***P<0.001; ****P<0.0001; ns = not significant. Comparisons were made between CpG and TGMP+CpG immunised animals. (C-D)T. gondii infection does not alter the profile of humoral responses of intranasal TGMP-immunised animals. Quantification of serum TGMP-specific IgG1 and IgG2a, and TGMP-specific IgA in the intestinal lavage fluid, 5 days post-infection (5dpi). The numbers above each graph represent the IgG2a/IgG1 ratio for each time point. Each dot represents an individual mouse, and horizontal lines correspond to the mean value in each group (3 weeks, n = 6; 9- and 13-weeks, n= 8). Data are expressed as mean ± SD of the log10 of the antibody titres. * P<0.05; **P<0.01; ***P<0.001; ****P<0.0001; ns = not significant; Comparisons were made between CpG group and TGMP+CpG group.
Figure 2.
Intranasal (i.n.) immunisation with T. gondii membrane antigen extract (TGMP) induces partial protection against acute infection and TGMP-specific humoral responses. (A) Experimental design for in vivo experiments. BALB/c mice were intranasally immunised twice with CpG alone (CpG; 10 µg per animal) or CpG adjuvant plus TGMP (TGMP+CpG; 30 µg + 10 µg per animal). Mice were intraperitoneally infected with 5000 tachyzoites of the Me49 T. gondii strain at 3, 9 and 13 weeks after the boost immunisation. Five days post-infection (5 dpi), the samples were collected for analysis. (B) Protective effect of i.n. immunisation with CpG plus TGMP (TGMP+CpG) against acute T. gondii infection. The parasite load was quantified by quantitative PCR for SAG-1, in the peritoneal exudate (PE), spleen, lung, liver, kidney, heart and brain. Each dot represents an individual mouse (3 weeks, n = 6; 13 and 9 weeks, n = 8). Data are expressed as mean ± SD. * P<0.05; **P<0.01; ***P<0.001; ****P<0.0001; ns = not significant. Comparisons were made between CpG and TGMP+CpG immunised animals. (C-D)T. gondii infection does not alter the profile of humoral responses of intranasal TGMP-immunised animals. Quantification of serum TGMP-specific IgG1 and IgG2a, and TGMP-specific IgA in the intestinal lavage fluid, 5 days post-infection (5dpi). The numbers above each graph represent the IgG2a/IgG1 ratio for each time point. Each dot represents an individual mouse, and horizontal lines correspond to the mean value in each group (3 weeks, n = 6; 9- and 13-weeks, n= 8). Data are expressed as mean ± SD of the log10 of the antibody titres. * P<0.05; **P<0.01; ***P<0.001; ****P<0.0001; ns = not significant; Comparisons were made between CpG group and TGMP+CpG group.
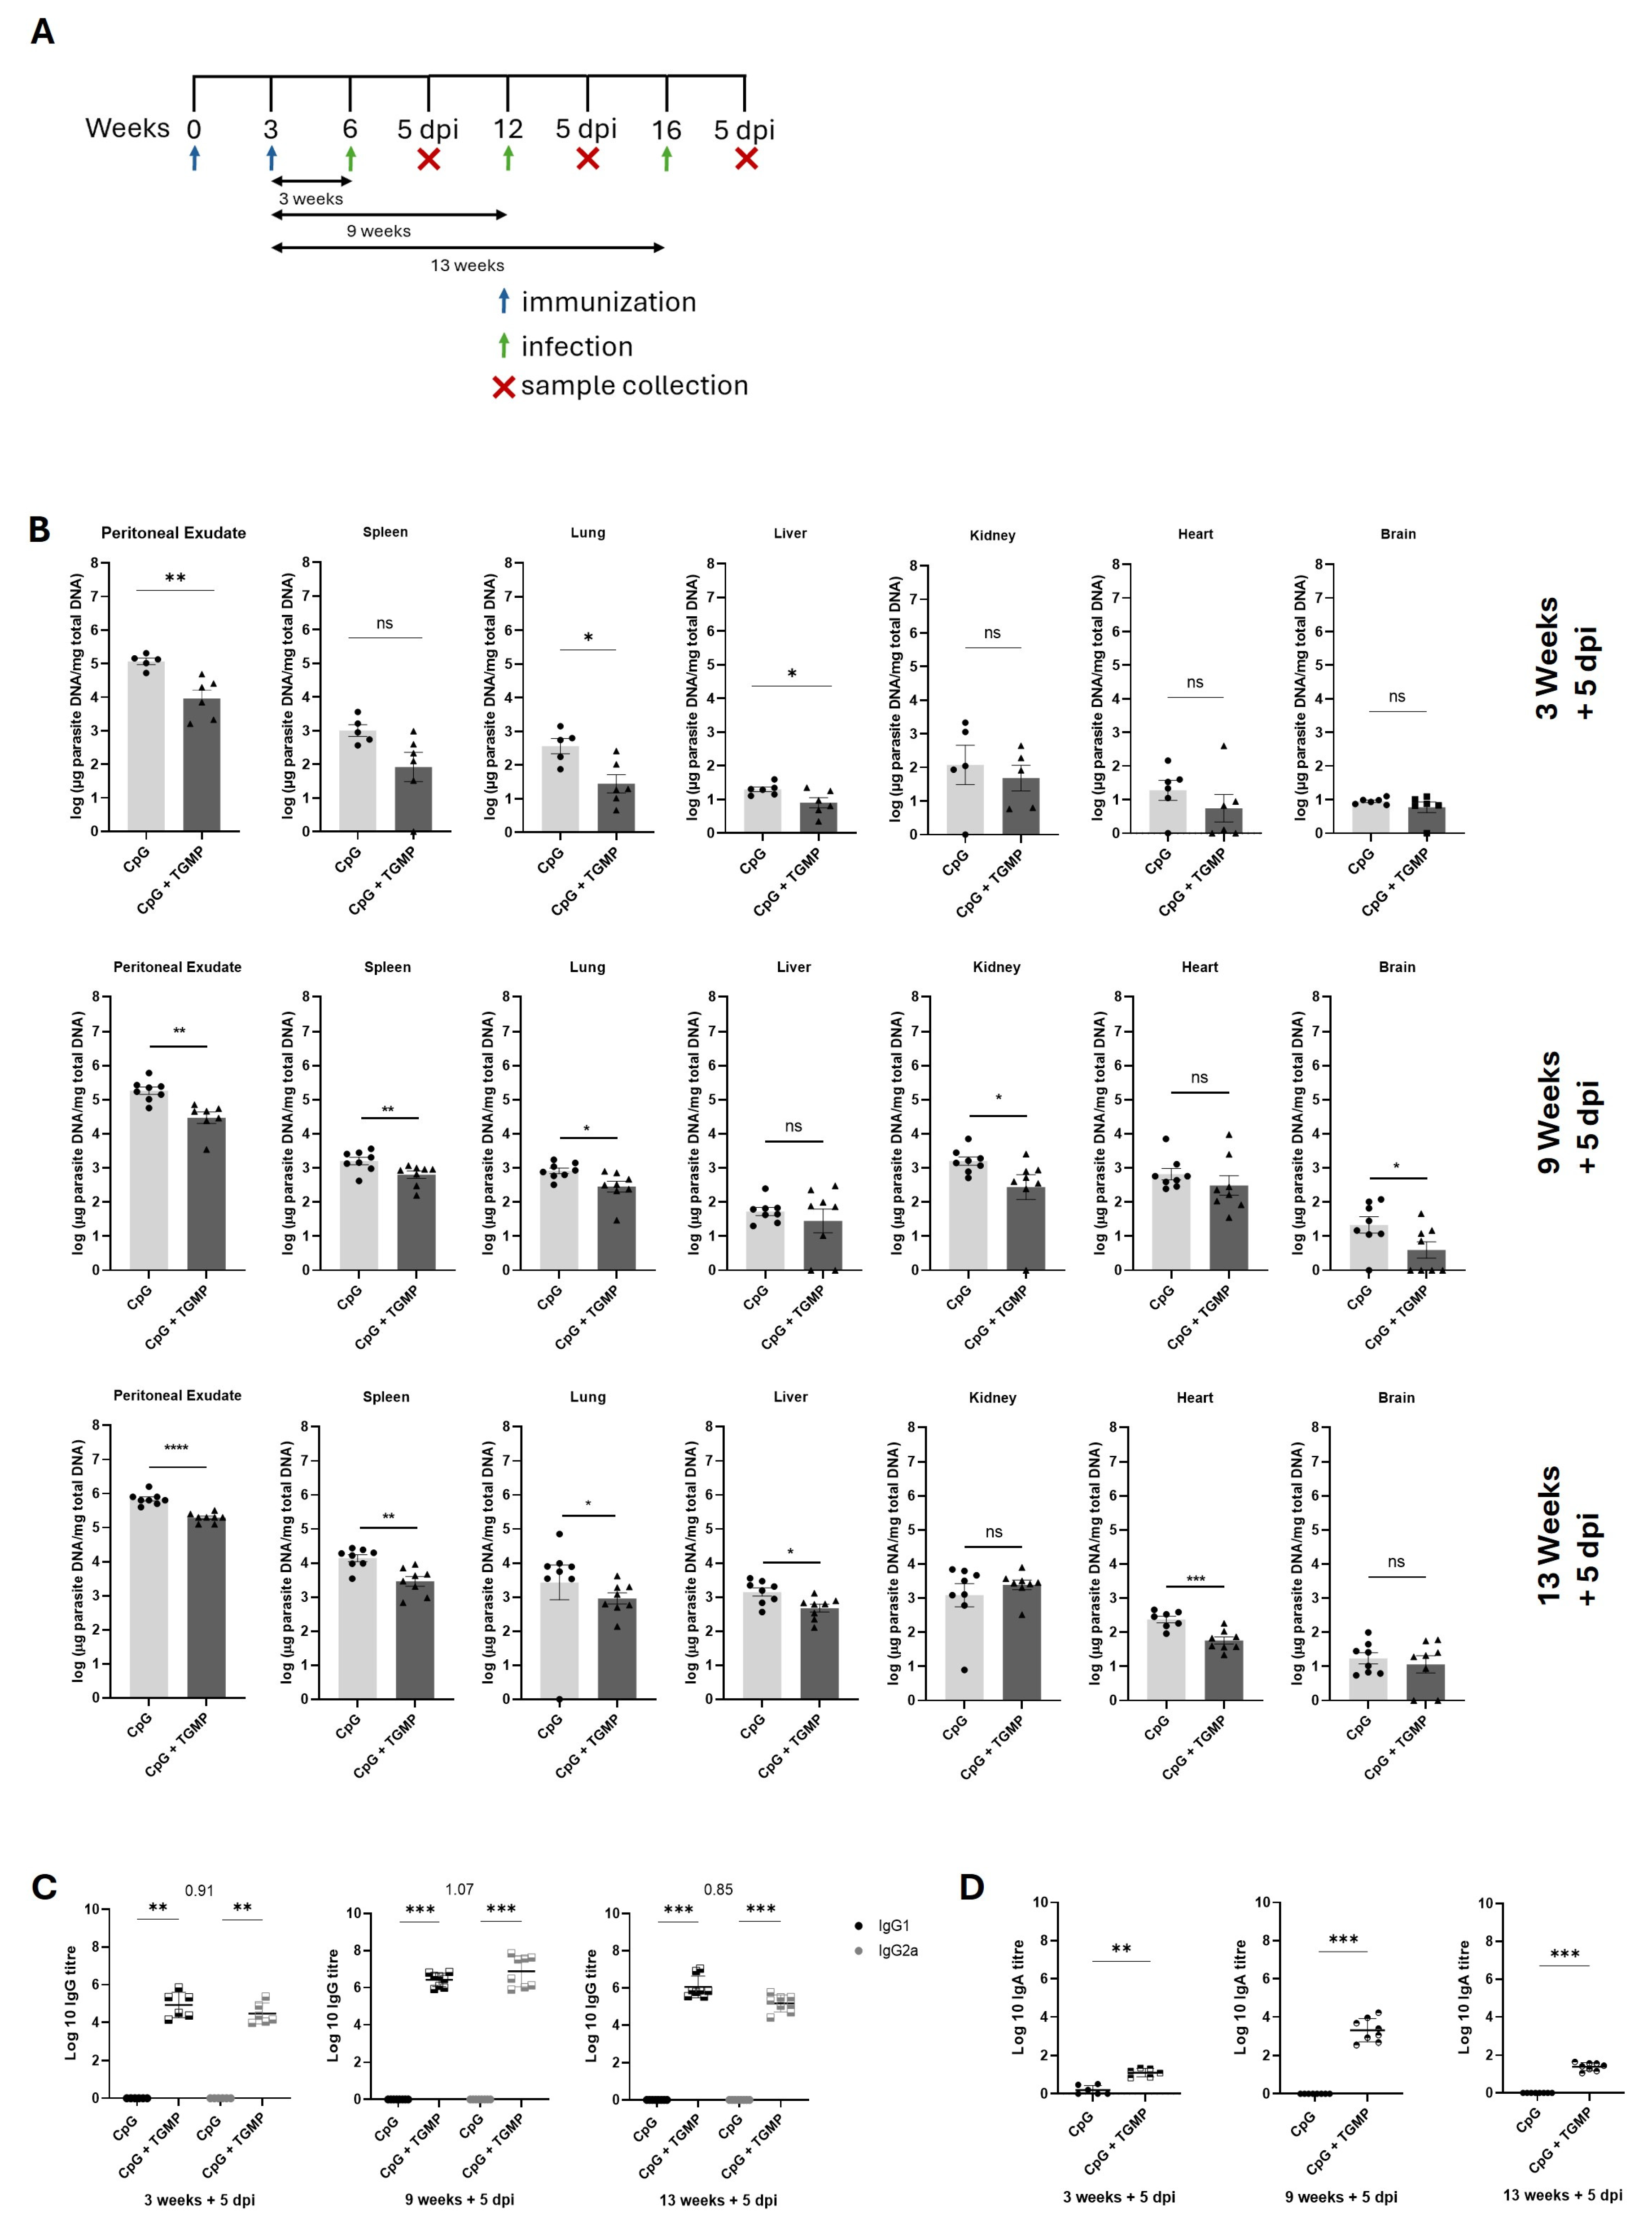
Figure 3.
Intranasal (i.n.) immunisation with membrane antigen extract (TGMP) induces TGMP-specific T cell responses after infection. (A) Experimental design for in vivo experiments. BALB/c mice were intranasally immunised twice with CpG alone (CpG; 10 µg per animal) or CpG adjuvant plus TGMP (TGMP+CpG; 30 µg + 10 µg per animal). Mice were intraperitoneally infected with 5000 tachyzoites of the Me49 T. gondii strain at 3 weeks after the booster immunisation. One day post-infection (1 dpi), spleens were collected for analysis. (B) Total TCD4+ (CD3+CD4+) and TCD8+ (CD3+CD8+) spleen cell numbers. (C-D) Spleen memory phenotype of CD4+ and CD8+ T cells. (C) Representative dot plot analysis of gated CD4+ and CD8+ T cells expressing CD44 and CD62L. The numbers within dotplots correspond to mean ± SD of percentage values for the particular quadrant region in the respective CpG immunised or TGMP+CpG immunised groups. (D) Numbers of spleen CD4 T effector memory cells (CD4 TEM; CD3+CD4+CD44+CD62L-); CD4 T central memory cells (CD4 TCM; CD3+CD4+CD44+CD62L+); CD8 T effector memory cells (CD8 TEM; CD3+CD8+CD44+CD62L-) and CD8 T central memory cells (CD8 TCM; CD3+CD8+CD44+CD62L+). Data represent the mean + SEM of mice analysed individually. The results are from two experiments that yielded concordant results (n = 10 in each group). Statistical analysis was performed by 2-way ANOVA and Sidak’s multiple comparisons test. ns: not significant. Comparisons were made between spleen cells from CpG and TGMP+CpG immunised mice. (E) IFN-γ production by splenocytes from immunised and sham-immunized infected mice. IFN-γ was quantified in the supernatant of spleen cells after in vitro stimulation with TGMP (4 µg/mL) and TgS (4 µg/mL) for 72 hours. Concanavalin A (Con A; 1 μg/mL) was used as a positive control. Each stimulus was tested in triplicate. Data are expressed as the mean ± SD of the values for each individual mouse. ***P<0.001; ****P<0.0001; ###P<0.001; ns = not significant; * Comparisons made between each stimulus and the control group. # Comparisons were made between CpG group and TGMP+CpG group for each stimulus. (F-G) Evaluation of spleen T cell activation and responses to TGMP stimulation. Spleen cells were ex vivo stimulated with TGMP (4 µg/mL) or TgS (4 µg/mL) for 16 hours. The phorbol 12-myristate 13-acetate plus Ionomycin (PMA/IONO) stimulation for 4 hours was used as a positive control. (F) CD4+T cells (CD3+CD4+), CD4+ T cells producing IFN-γ (CD3+CD4+IFNγ+), IL-17 (CD3+CD4+IL17+) and GranzB (CD3+CD4+GranzB+); activated CD4+T cells (CD3+CD4+CD44+), activated CD4+ T cells producing IFN-γ (CD3+CD4+CD44+IFNγ+), IL-17 (CD3+CD4+CD44+IL17+) and GranzB (CD3+CD4+CD44+GranzB+). (G) CD8+T cells (CD3+CD8+), CD8+ T cells producing IFN-γ (CD3+CD8+IFNγ+), IL-17 (CD3+CD8+IL17+) and GranzB (CD3+CD8+GranzB+); activated CD8+T cells (CD3+CD8+CD44+), activated CD8+ T cells producing IFN-γ (CD3+CD8+CD44+IFNγ+), IL-17 (CD3+CD8+CD44+IL17+) and (CD3+CD8+CD44+GranzB+). Data represent the mean + SEM of mice analysed individually. The results are from two experiments that yielded concordant results (n = 10 in each group). *: P<0.05; **: P<0.01; ***: P<0.001; ****: P<0.0001; ns: not significant. Comparisons were made between spleen cells from CpG and TGMP+CpG immunised mice.
Figure 3.
Intranasal (i.n.) immunisation with membrane antigen extract (TGMP) induces TGMP-specific T cell responses after infection. (A) Experimental design for in vivo experiments. BALB/c mice were intranasally immunised twice with CpG alone (CpG; 10 µg per animal) or CpG adjuvant plus TGMP (TGMP+CpG; 30 µg + 10 µg per animal). Mice were intraperitoneally infected with 5000 tachyzoites of the Me49 T. gondii strain at 3 weeks after the booster immunisation. One day post-infection (1 dpi), spleens were collected for analysis. (B) Total TCD4+ (CD3+CD4+) and TCD8+ (CD3+CD8+) spleen cell numbers. (C-D) Spleen memory phenotype of CD4+ and CD8+ T cells. (C) Representative dot plot analysis of gated CD4+ and CD8+ T cells expressing CD44 and CD62L. The numbers within dotplots correspond to mean ± SD of percentage values for the particular quadrant region in the respective CpG immunised or TGMP+CpG immunised groups. (D) Numbers of spleen CD4 T effector memory cells (CD4 TEM; CD3+CD4+CD44+CD62L-); CD4 T central memory cells (CD4 TCM; CD3+CD4+CD44+CD62L+); CD8 T effector memory cells (CD8 TEM; CD3+CD8+CD44+CD62L-) and CD8 T central memory cells (CD8 TCM; CD3+CD8+CD44+CD62L+). Data represent the mean + SEM of mice analysed individually. The results are from two experiments that yielded concordant results (n = 10 in each group). Statistical analysis was performed by 2-way ANOVA and Sidak’s multiple comparisons test. ns: not significant. Comparisons were made between spleen cells from CpG and TGMP+CpG immunised mice. (E) IFN-γ production by splenocytes from immunised and sham-immunized infected mice. IFN-γ was quantified in the supernatant of spleen cells after in vitro stimulation with TGMP (4 µg/mL) and TgS (4 µg/mL) for 72 hours. Concanavalin A (Con A; 1 μg/mL) was used as a positive control. Each stimulus was tested in triplicate. Data are expressed as the mean ± SD of the values for each individual mouse. ***P<0.001; ****P<0.0001; ###P<0.001; ns = not significant; * Comparisons made between each stimulus and the control group. # Comparisons were made between CpG group and TGMP+CpG group for each stimulus. (F-G) Evaluation of spleen T cell activation and responses to TGMP stimulation. Spleen cells were ex vivo stimulated with TGMP (4 µg/mL) or TgS (4 µg/mL) for 16 hours. The phorbol 12-myristate 13-acetate plus Ionomycin (PMA/IONO) stimulation for 4 hours was used as a positive control. (F) CD4+T cells (CD3+CD4+), CD4+ T cells producing IFN-γ (CD3+CD4+IFNγ+), IL-17 (CD3+CD4+IL17+) and GranzB (CD3+CD4+GranzB+); activated CD4+T cells (CD3+CD4+CD44+), activated CD4+ T cells producing IFN-γ (CD3+CD4+CD44+IFNγ+), IL-17 (CD3+CD4+CD44+IL17+) and GranzB (CD3+CD4+CD44+GranzB+). (G) CD8+T cells (CD3+CD8+), CD8+ T cells producing IFN-γ (CD3+CD8+IFNγ+), IL-17 (CD3+CD8+IL17+) and GranzB (CD3+CD8+GranzB+); activated CD8+T cells (CD3+CD8+CD44+), activated CD8+ T cells producing IFN-γ (CD3+CD8+CD44+IFNγ+), IL-17 (CD3+CD8+CD44+IL17+) and (CD3+CD8+CD44+GranzB+). Data represent the mean + SEM of mice analysed individually. The results are from two experiments that yielded concordant results (n = 10 in each group). *: P<0.05; **: P<0.01; ***: P<0.001; ****: P<0.0001; ns: not significant. Comparisons were made between spleen cells from CpG and TGMP+CpG immunised mice.
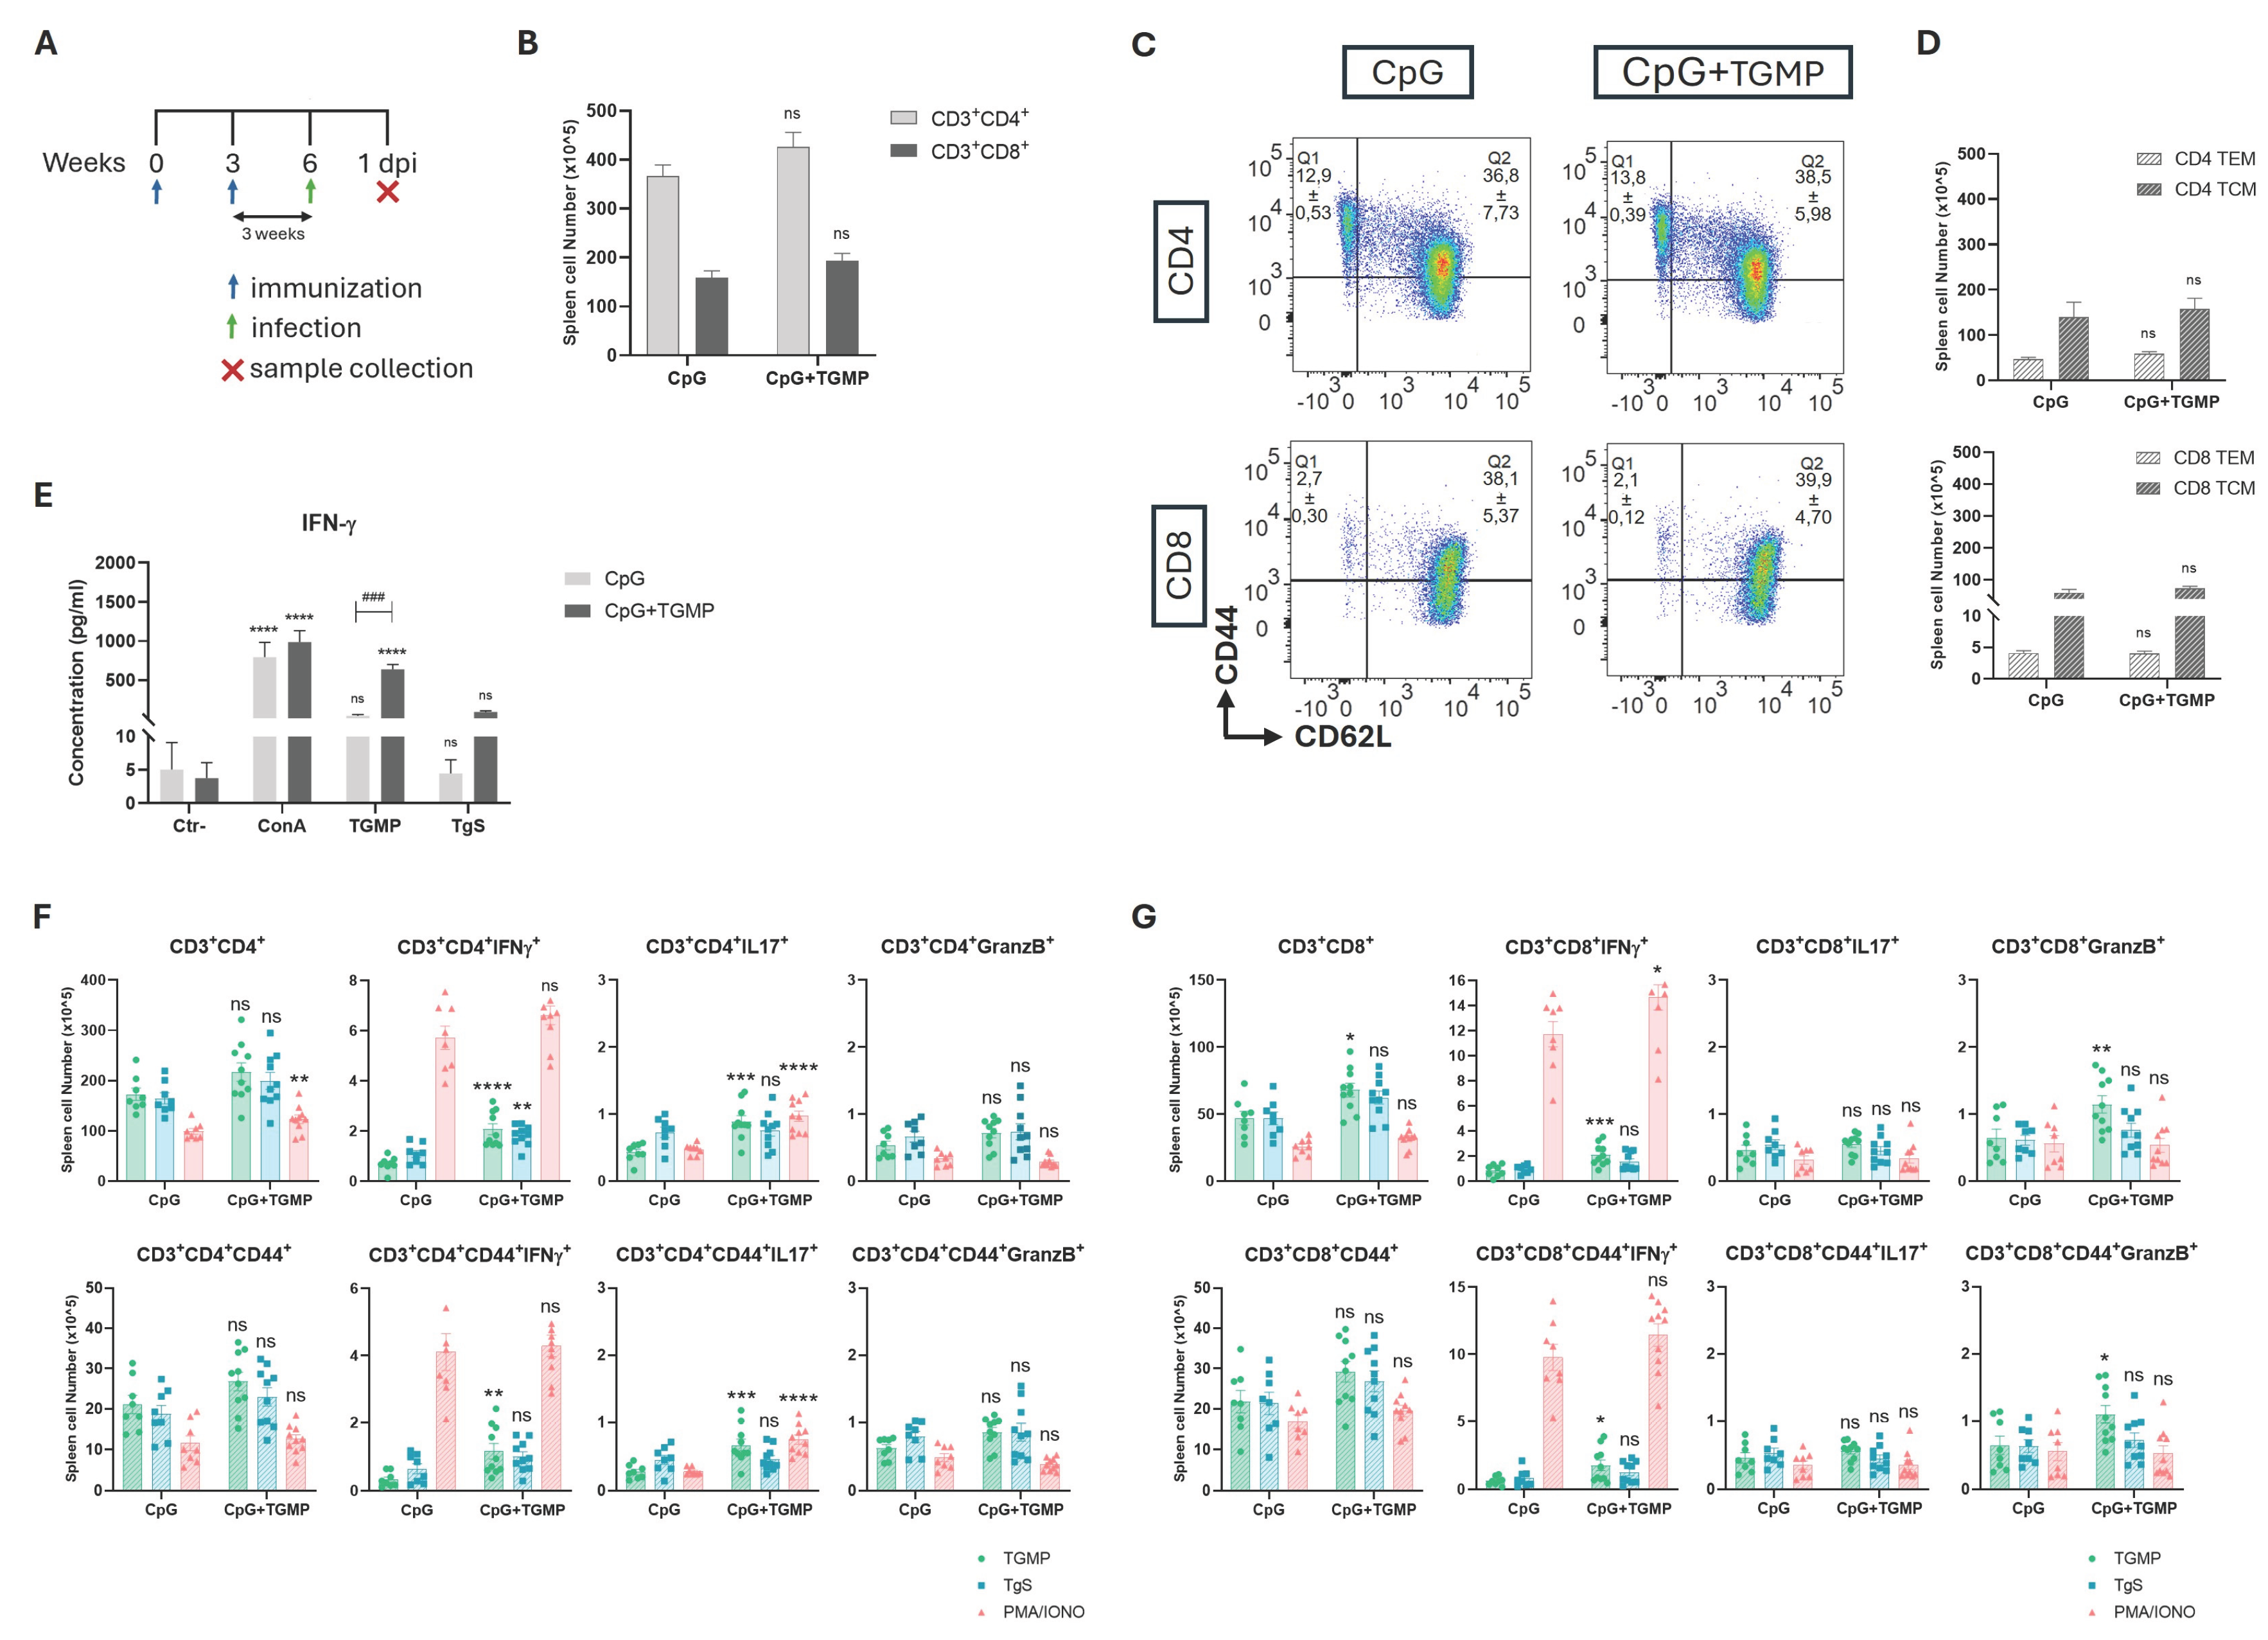

Table 1.
Description of the proteins identified by mass spectrometry. The sequence coverage in %, the number of unique peptides, the score sequest HT, the molecular weight in kDa and the access number in Uniprot presented for each protein.
Table 1.
Description of the proteins identified by mass spectrometry. The sequence coverage in %, the number of unique peptides, the score sequest HT, the molecular weight in kDa and the access number in Uniprot presented for each protein.
| Protein | Sequence Coverage (%) | N° of Unique Peptides | Score Sequest HT | Molecular Weight (kDa)a | Accession number |
| Dense granule protein 7 | 45 | 10 | 21,56 | 25,8 | O00933 |
| SAG-related sequence SRS25 | 34 | 3 | 9,17 | 20,8 | S8FBZ9 |
| Dense granule protein 2 | 28 | 6 | 15,47 | 19,8 | P13404 |
| SAG-related sequence SRS34A | 26 | 3 | 5,83 | 19,1 | A0A125YIJ3 |
| Toxofilin | 19 | 4 | 5,74 | 26,8 | S8G4J8 |
| SAG-related sequence SRS29B | 15 | 4 | 8,4 | 34,7 | A0A125YP09 |
| Nascent polypeptide-associated complex (NAC) domain-containing protein | 15 | 2 | 5,22 | 20,5 | A0A125YY47 |
| Nascent polypeptide-associated complex subunit beta | 14 | 4 | 9,07 | 38,8 | S8GBN3 |
| Microneme protein MIC10 | 11 | 2 | 4,76 | 23,1 | A0A125YLT9 |
Disclaimer/Publisher’s Note: The statements, opinions and data contained in all publications are solely those of the individual author(s) and contributor(s) and not of MDPI and/or the editor(s). MDPI and/or the editor(s) disclaim responsibility for any injury to people or property resulting from any ideas, methods, instructions or products referred to in the content. |
© 2026 by the authors. Licensee MDPI, Basel, Switzerland. This article is an open access article distributed under the terms and conditions of the Creative Commons Attribution (CC BY) license (http://creativecommons.org/licenses/by/4.0/).
Copyright: This open access article is published under a Creative Commons CC BY 4.0 license, which permit the free download, distribution, and reuse, provided that the author and preprint are cited in any reuse.