
Submitted:
30 April 2026
Posted:
02 May 2026
You are already at the latest version
Abstract
Background: Perception-based evaluation using Likert-scale survey data is widely applied in tourism and transport research, yet conventional point-valued encoding imposes artificial precision and overlooks ambiguity between adjacent ordinal categories. This limitation is particularly relevant in experiential contexts, where subjective judgments often involve transitional evaluations. Methods: This study develops a parameterized fuzzy–entropy exploratory factor analysis (FE-EFA) framework for uncertainty-aware analysis of ordinal perception data. The approach transforms ordinal responses into fuzzy membership distributions, constructs a correlation structure in membership space, and incorporates Shannon entropy and Jensen–Shannon divergence to characterize distributional dispersion and representation differences. The framework is applied to survey data from Chengdu Tramway Line 2 (N = 1242; 32 indicators). Results: Under the Kaiser criterion (eigenvalues > 1), conventional EFA yields a seven-factor structure, whereas FE-EFA identifies an additional eighth factor located near the retention boundary. Under a unified factor specification, both approaches preserve a consistent high-level structure, while FE-EFA shows clearer factor separation, fewer cross-loadings, and more coherent indicator clustering. From an information-theoretic perspective, FE-EFA produces higher entropy (average = 0.8688) and moderate Jensen–Shannon divergence (average = 0.0133), indicating a controlled redistribution of ordinal information rather than structural distortion. Entropy-informed weighting further reveals systematic shifts in indicator importance across key dimensions. Conclusions: The FE-EFA framework extends conventional Likert-scale analysis by introducing an uncertainty-aware representation layer prior to factor extraction. It preserves overall structural stability while improving the resolution of latent constructs and the sensitivity of indicator representation. The proposed approach provides a practical and theoretically grounded basis for perception-based evaluation and decision support in tramway cultural-tourism development and related contexts.
Keywords:
fuzzy exploratory factor analysis (FE-EFA)
; ordinal data
; uncertainty-aware representation
; Shannon entropy
; Jensen–Shannon divergence
; Likert-scale analysis
; perception-based evaluation
; tramway tourism
1. Introduction
Tourist mobility is closely linked to transport infrastructure, which shapes destination development trajectories [1,2]. Among urban transport modes, tramway systems occupy a distinctive position in cultural-tourism contexts. Unlike buses operating in mixed traffic or metro systems detached from the urban surface, tramways function at street level and maintain continuous visual and spatial interaction with their surroundings. The travel process thus becomes an experiential interface through which urban landscapes are perceived and interpreted, positioning perception as a critical analytical dimension rather than a secondary outcome in tramway-based tourism studies.
In empirical research, such perceptual dimensions are typically measured through structured survey instruments, most commonly Likert-type scales [3,4,5,6]. However, the methodological implications of treating ordinal Likert responses as interval-scale data remain insufficiently examined. From a measurement-theoretic perspective, Likert responses indicate relative ordering without guaranteeing equal intervals between categories [7]. Nevertheless, they are routinely assigned numerical values and analyzed as interval data, implicitly assuming uniform distances between adjacent categories—an assumption that has been repeatedly questioned [8,9]. This issue is particularly salient in experiential evaluation contexts, where respondents frequently exhibit hesitation or ambiguity between adjacent response levels.
Although prior research acknowledges the tension between ordinal measurement and interval-based statistical treatment [10,11,12], practical applications often rely on point-valued encoding for analytical convenience [13]. In exploratory factor analysis (EFA), this practice compresses adjacent-category ambiguity into single-valued representations, leading to potential information loss at the preprocessing stage. At its core, this gives rise to a representation–analysis mismatch: ordinal responses containing boundary ambiguity are reduced to precise numerical inputs, while EFA operates on correlation structures that implicitly assume metric continuity and exact measurement. As a result, the factor structure is extracted from a representation that may be structurally misaligned with the ordinal and uncertain nature of perception data.
Existing methodological extensions provide partial solutions but remain limited in scope. Fuzzy exploratory factor analysis preserves uncertainty through membership-based representations [14], yet typically assumes that fuzziness is introduced at the data collection stage, thereby restricting applicability in studies relying on conventional ordinal survey designs. Meanwhile, fuzzy set theory provides a formal mechanism for representing partial membership [15], and Shannon entropy offers a quantitative measure of information dispersion [16]. These approaches collectively suggest that response variability contains meaningful information rather than mere noise [17,18,19]. However, they have rarely been integrated into a unified factor-analytic framework that operates directly on standard Likert-scale data while preserving uncertainty at the representation stage.
Consequently, three structural limitations persist in existing approaches:
- Adjacent-category ambiguity is not explicitly represented at the data level;
- Informational uncertainty is not systematically incorporated into latent structural analysis;
- Formal comparison between alternative preprocessing strategies remains underdeveloped.
To address these limitations, this study develops a parameterized fuzzy–entropy exploratory factor analysis (FE-EFA) framework. The proposed approach introduces an uncertainty-aware preprocessing stage that transforms ordinal responses into fuzzy representations, constructs an uncertainty-sensitive correlation structure, and integrates entropy-based measurement with divergence-based comparison within a unified analytical procedure. Rather than replacing conventional EFA, the framework provides a complementary representation-level extension that preserves ordinal ambiguity while maintaining structural interpretability.
The transformation is governed by a parameterized mechanism controlling adjacent-category ambiguity and central concentration, whose combined effect is expressed through a normalized ratio representing the overall level of uncertainty. This design enables flexible uncertainty representation without modifying the original questionnaire format. By incorporating entropy into the analytical process, the framework further quantifies the informational dispersion of perception data and explicitly links uncertainty to indicator-level and structural characteristics.
The framework is applied to a dataset of 1,242 respondents and 32 indicators in the context of tramway cultural-tourism evaluation in Chengdu. By comparing point-valued and uncertainty-aware analytical routes under a unified empirical setting, the study examines how different encoding strategies influence factor structures and their associated informational properties.
This study makes three main contributions. First, it develops a parameterized FE-EFA framework that enables uncertainty-aware preprocessing of conventional ordinal survey data without requiring changes to questionnaire design. Second, it introduces an information-theoretic perspective into factor analysis by incorporating Shannon entropy and Jensen–Shannon divergence, allowing both perceptual dispersion and representation-induced information differences to be explicitly quantified. Third, through an empirical comparison, it demonstrates that uncertainty-aware preprocessing preserves global factor structure while refining indicator-level information profiles and improving structural clarity.
Overall, the novelty of this study lies in introducing a post hoc uncertainty-aware representation layer that bridges standard Likert-scale measurement and fuzzy analytical frameworks within a unified and operational factor-analytic procedure, thereby addressing the representation–analysis mismatch inherent in ordinal perception data.
2. Theoretical Background and Research Design
2.1. Experiential Dimensions of Mobility-Based Tourism Evaluation
The relationship between transport infrastructure and tourism extends beyond the facilitation of spatial movement. Transport systems function not merely as conduits connecting origins and destinations, but as constitutive components of the tourist experience itself [1,2]. This perspective is particularly relevant for street-level tramway systems, which maintain continuous visual and spatial interaction with surrounding urban environments. Unlike underground metro systems or isolated vehicular travel, tramways enable what can be conceptualized as embedded mobility, where the journey itself forms an integral part of the destination experience.
In cultural-tourism contexts, this embeddedness has direct implications for evaluation design. Tramway corridors often traverse areas characterized by distributed cultural resources, including architectural heritage, public spaces, and symbolic landscapes. Consequently, key evaluation attributes—such as visual coordination, cultural identity, environmental comfort, and service accessibility—are inherently perceptual rather than purely physical. These attributes cannot be adequately captured through objective operational indicators alone, but instead require perception-based measurement frameworks.
This shift from objective performance metrics to experiential evaluation introduces a fundamental methodological challenge. Perception-based indicators are intrinsically subjective, linguistically expressed, and often imprecise, with evaluations frequently distributed across adjacent ordinal categories rather than concentrated at a single level. As a result, the analytical treatment of such data must account not only for latent structural relationships but also for the uncertainty embedded in human judgment, which motivates the need for uncertainty-aware representation and analysis.
2.2. Representational Uncertainty in Ordinal Survey Responses
Perception data in tourism research are predominantly collected using Likert-type scales, which provide ordered categorical responses to capture subjective evaluations [3,4,5,6]. From a measurement-theoretic perspective, such responses are ordinal: they convey ranking information without ensuring equal distances between adjacent categories [7].
However, in empirical practice, these ordinal responses are routinely encoded as point-valued numerical variables and analyzed using statistical methods that assume interval-scale properties [8,13]. This practice introduces a representational simplification in which each response is treated as an exact numerical value, implicitly neglecting the ambiguity that may exist between adjacent categories.
This issue becomes particularly pronounced in experiential evaluation settings. When respondents assess attributes such as cultural atmosphere, visual quality, or symbolic meaning, their judgments often lie between adjacent categories rather than aligning precisely with a single discrete level. Under point-valued encoding, such boundary ambiguity is compressed into a single category choice, effectively discarding uncertainty at the data representation stage.
When these encoded values are subsequently used in exploratory factor analysis (EFA), the implications extend beyond measurement. EFA extracts latent structures based on correlation patterns among observed indicators [10,11,12]; if the input data have already undergone uncertainty compression, the resulting factor structure may reflect a reduced or distorted representation of the underlying perceptual landscape.
Existing approaches to this issue have primarily focused on modifying data collection instruments, for example through fuzzy Likert scales that allow respondents to express partial membership across categories [9]. While conceptually rigorous, such approaches require redesigning survey instruments and are therefore not readily applicable to widely used conventional datasets. This limitation motivates the need for a post hoc strategy that can recover uncertainty from standard ordinal responses without altering the original measurement design.
2.3. Parameterized Fuzzy Representation and Entropy Measurement
Fuzzy set theory provides a natural framework for representing partial membership and modeling uncertainty in categorical data [15]. Instead of assigning each observation to a single category, fuzzy representation allows a response to be distributed across adjacent categories with varying degrees of membership. When applied to ordinal survey data, this enables the explicit modeling of boundary ambiguity inherent in subjective judgments [9,15].
In this study, ordinal responses are transformed into fuzzy membership distributions through a parameterized mapping mechanism. The transformation is governed by two interpretable parameters: one controls the degree of ambiguity between adjacent categories, and the other determines the concentration of membership around the observed category. These parameters correspond to behavioral aspects of response formation—namely, hesitation and confidence.
Importantly, due to normalization constraints in the membership function, the combined effect of these parameters can be expressed through a normalized ratio governing overall uncertainty. This implies that the transformation is effectively controlled along a single uncertainty dimension, despite being parameterized in two components. In practice, parameter ranges are specified to ensure that the observed category retains maximal membership, and sensitivity analysis is conducted rather than seeking a single optimal configuration.
While fuzzy representation preserves uncertainty at the encoding stage, an additional mechanism is required to quantify its informational implications. Shannon entropy provides a measure of distributional dispersion, capturing the degree of uncertainty or spread within a probability distribution [16]. When applied to fuzzy response distributions, entropy reflects the extent to which evaluations are concentrated or dispersed across adjacent categories [17].
Furthermore, Jensen–Shannon divergence offers a symmetric and bounded metric for comparing distributions derived under different representation schemes [19]. By measuring the divergence between point-valued and fuzzy distributions of the same indicator, it becomes possible to quantify the informational shift introduced by uncertainty-aware preprocessing. Together, entropy and divergence establish an information-theoretic layer that complements structural analysis.
2.4. Comparative Analytical Framework
The analytical strategy adopted in this study is explicitly comparative rather than substitutive. The proposed framework is not intended to replace conventional EFA, but to evaluate how uncertainty-aware representation influences factor-analytic outcomes under controlled conditions.
Two parallel analytical routes are constructed based on the same dataset and indicator system. The first follows the conventional approach, in which Likert responses are directly encoded as numerical values and used to construct a Pearson correlation matrix for factor extraction [10,11]. This serves as the baseline benchmark. The second route introduces an uncertainty-aware preprocessing stage. Ordinal responses are transformed into fuzzy membership distributions, preserving adjacent-category ambiguity at the data level [9,15]. These representations are then used to construct a correlation structure in membership space, enabling factor extraction under uncertainty-aware conditions. In parallel, entropy is computed to characterize distributional dispersion, and Jensen–Shannon divergence is used to quantify representation differences between the two encoding strategies [16,17,19].
By comparing these two analytical routes, the study examines whether incorporating uncertainty at the representation stage leads to improved structural clarity, enhanced interpretability, and greater information sensitivity. On this basis, the proposed fuzzy-entropy exploratory factor analysis (FE-EFA) is positioned as an extension of conventional EFA at the representation level, rather than a modification of its core estimation procedure.
3. Indicator System and Data Source
The indicator system employed in this study was developed through a two-stage procedure integrating literature-based extraction and expert refinement. An initial pool of candidate indicators was constructed through systematic review of prior studies on tramway systems and cultural tourism evaluation. This pool was subsequently screened and consolidated through expert consultation to ensure conceptual relevance, clarity, and coverage of key experiential and operational dimensions.
The finalized questionnaire comprises 32 indicators covering various aspects of tramway-based cultural tourism evaluation. These indicators include, for example, track landscape, vehicle styling, passenger visual field, thermal environment, station spacing rationality, and tourism information services. Together, they capture both perceptual and functional characteristics of tramway systems, and are consistent with the experiential evaluation perspective outlined in Section 2.
Empirical data were collected through a structured questionnaire survey conducted among users of Chengdu Tramway Line 2. Respondents were required to have direct experience with the tramway system to ensure the validity of perception-based evaluation. After data screening and validation, a total of 1,242 valid responses were retained for analysis. All indicators were measured using a five-point Likert scale, generating ordinal response data suitable for both conventional and uncertainty-aware analytical treatments.
To ensure the statistical validity of factor extraction and establish a baseline structure for comparison, standard diagnostic tests were conducted. As summarized in Table 1, the Kaiser–Meyer–Olkin (KMO) measure reaches 0.8755, indicating strong sampling adequacy, while Bartlett’s test of sphericity is highly significant ( = 25147.27, df = 496, p < 0.001), confirming that the correlation matrix is appropriate for latent structure detection. In addition, the Kaiser criterion (eigenvalues > 1) indicates a seven-factor solution for the conventional point-valued EFA, which serves as the baseline dimensionality for subsequent comparison.
This baseline structure provides a critical reference point for subsequent analysis. In the following section, the proposed fuzzy-entropy exploratory factor analysis (FE-EFA) framework is applied to the same dataset, enabling a controlled comparison between conventional point-valued representation and uncertainty-aware fuzzy representation in terms of factor structure, information retention, and interpretability.
4. Fuzzy-Entropy Exploratory Factor Analysis Framework
4.1. Parameterized Fuzzy Membership Representation
Let denote the original response matrix, where n is the number of respondents and m is the number of indicators. Each observation is an ordinal Likert-scale response.
To explicitly represent the uncertainty inherent in ordinal evaluations, each response is transformed into a fuzzy membership vector over the five response categories. For respondent on indicator , the fuzzy representation is defined as:
where and
The membership values are constructed using two nonnegative parameters:
: boundary fuzziness (adjacent-category ambiguity)
: central concentration (confidence in selected category)
Although both parameters are introduced to capture distinct aspects of the transformation, their normalized formulation implies that the resulting membership structure depends primarily on their relative magnitude, i.e., the ratio /. This effectively reduces the degree of freedom to a single dimension, which enhances interpretability while maintaining flexibility and avoiding over-parameterization. In practice, different levels of fuzziness can therefore be controlled by adjusting this ratio.
For interior categories , the membership is assigned as:
and zero otherwise.
For boundary categories, the probability mass that would otherwise fall outside the admissible support is reassigned to the nearest valid category. Accordingly, when :
and when :
This construction ensures normalization, non-negativity, and maximum membership at the observed category. In this way, each ordinal response is represented not as a single fixed point, but as a local fuzzy distribution over adjacent response levels.
4.2. Fuzzy Correlation Modeling
Instead of collapsing fuzzy representations into scalar expected scores, the proposed framework models dependence directly in the fuzzy membership space. Let
denote the mean membership vector of indicator .
The fuzzy covariance between indicators and is defined as:
The corresponding fuzzy variance is:
The fuzzy correlation coefficient is then given by:
The resulting fuzzy correlation matrix
This formulation evaluates dependence through the centered inner product of fuzzy membership vectors, so that uncertainty is preserved in the vector-valued representation throughout correlation construction rather than being removed through scalar reduction. As a result, the proposed framework avoids the degeneracy induced by expectation-based collapse and allows ordinal ambiguity to enter factor analysis through the correlation structure itself.
4.3. Factor Extraction Under Uncertainty
Factor extraction is performed on the fuzzy correlation matrix . The eigenvalue decomposition of provides the spectral basis for determining the underlying latent structure.
Let denote the k-th eigenvalue of . The number of retained factors is determined using the Kaiser criterion, under which a factor is retained if
This criterion selects components that explain more variance than an individual standardized indicator. As the correlation structure is constructed in the fuzzy membership space, the resulting eigenvalues reflect the distributional characteristics of uncertainty-aware representations rather than point-valued approximations.
Accordingly, factor retention in the FE-EFA framework is directly governed by the spectral properties of the fuzzy correlation matrix, allowing ordinal ambiguity to be incorporated into latent structure identification through the eigenvalue profile.
4.4. Entropy-Based Information Characterization
For each indicator , let
denote the empirical probability distribution of the original ordinal responses.
By averaging respondent-level membership vectors, the fuzzy category distribution of indicator is obtained as
The normalized Shannon entropy of the fuzzy distribution is computed as
And the corresponding dispersion coefficient is
This entropy-based characterization captures the degree of informational dispersion induced by uncertainty-aware preprocessing. Higher entropy indicates greater ambiguity or response spread across adjacent categories, whereas lower entropy indicates a more concentrated fuzzy distribution.
4.5. Entropy-Structure Coupled Weighting
To incorporate both latent structural relevance and information concentration, the proposed framework constructs an entropy-structure coupled weighting scheme.
Let denote the variance contribution of factor , and let denote the loading of indicator on factor . The structural importance of indicator is defined as:
After normalization, the structural weight becomes:
The final entropy-informed weight is:
This construction assigns greater importance to indicators that are both structurally influential in the retained factor solution and relatively information-concentrated after fuzzy transformation.
4.6. Jensen–Shannon Divergence
To quantify the distributional difference between point-valued and fuzzy representations, the Jensen–Shannon (JS) divergence is employed. For each indicator ,let denote the empirical probability distribution of the original ordinal responses, and let denote the corresponding fuzzy distribution derived from membership aggregation.
The Jensen–Shannon divergence between and is defined as:
Where the midpoint distribution is given by:
The Kullback–Leibler divergence is defined as:
Where .
The average divergence across all indicators is computed as:
This divergence provides a symmetric and bounded measure of how uncertainty-aware fuzzy transformation redistributes category-level information relative to direct point-valued encoding, thereby serving as an indicator of representation shift introduced by the proposed framework.
4.7. Interpretation of the FE-EFA Framework
The proposed FE-EFA framework should be understood as a distribution-level extension of conventional EFA. Its main role is not to replace classical factor analysis, but to provide an uncertainty-aware analytical layer for ordinal perception data.
More specifically, the framework:
- Reserves ordinal ambiguity at the representation stage through fuzzy membership construction;
- Incorporates uncertainty directly into correlation modeling in membership space;
- Enables factor extraction on an uncertainty-aware correlation structure;
- Enhances interpretation through entropy measurement, divergence analysis, and entropy-informed weighting.
In this sense, FE-EFA extends the conventional point-valued workflow by improving how ordinal responses are represented before latent-structure analysis and by making the informational consequences of representation choices analytically visible.
5. Results and Discussion
5.1. Factor Retention and Factor Interpretation
5.1.1. Factor Retention Under the Kaiser Criterion
To evaluate the effect of uncertainty-aware preprocessing on latent dimensionality, exploratory factor analysis was conducted for both approaches using the Kaiser criterion (eigenvalues > 1). Applying the same retention rule ensures that any difference in the number of factors arises from changes in the correlation structure rather than methodological variation.
A sensitivity analysis was performed by varying the ratio between boundary fuzziness and central concentration. The results remain stable across a reasonable range, indicating that the factor retention outcome is not sensitive to parameter selection. A moderate uncertainty level was used in the main analysis.
As shown in Table 2, the point-valued EFA retains seven factors, with the eighth eigenvalue slightly below the threshold (0.968). In contrast, FE-EFA retains eight factors, as the eighth eigenvalue exceeds unity (1.096). The first seven eigenvalues are similar across the two methods, and the difference occurs at the retention boundary. This pattern is also observed in the scree plot (Figure 1).
5.1.2. Marginal Factor Under Uncertainty-Aware Representation
The additional factor identified by FE-EFA originates from variation that is weakly represented under point-valued encoding. In Likert-scale data, responses often lie between adjacent categories, especially for perception-based indicators.
Point-valued encoding assigns each response to a single category, which may reduce sensitivity to subtle covariance patterns. The FE-EFA approach distributes responses across adjacent categories, allowing intermediate states to contribute to the correlation structure.
This difference becomes critical near the retention threshold. Variation that is insufficient to support an additional factor under point-valued encoding becomes detectable when ordinal ambiguity is preserved. The eighth factor can therefore be interpreted as a marginal dimension that is present but compressed in the original representation.
5.1.3. Seven-Factor Structure Under Point-Valued EFA
The seven-factor solution obtained from the point-valued EFA provides a baseline representation of the latent structure. The factors correspond to Image and Cultural Display, Route Planning, Travel Comfort, Comprehensive Benefits, Service Facilities, Operation and Management, and Community Integration.
This structure is consistent with the conceptual design of the indicator system and captures the main dimensions of tramway cultural-tourism evaluation. However, the rotated loading matrix indicates that some factor boundaries are not clearly separated. Several indicators show moderate secondary loadings, particularly those related to spatial organization, accessibility, and community interaction.
These patterns suggest that certain dimensions are partially aggregated under point-valued encoding. The seven-factor solution is therefore useful as a reference, but may not fully capture finer distinctions among related constructs. The detailed interpretation is reported in Table 3.
5.1.4. Eight-Factor Structure Under FE-EFA
Under FE-EFA, an eight-factor structure is retained. The overall configuration is similar to the baseline solution, but with clearer separation in specific domains.
A key difference is the decomposition of the original “Comprehensive Benefits” factor into two dimensions: Promotion Effectiveness and Financial Viability. Indicators related to media exposure and image dissemination are grouped into the former, while revenue-related indicators are assigned to the latter. This separation reflects a more explicit distinction between symbolic and economic effects.
Other factors remain consistent with the baseline structure, including image and cultural display, travel comfort, route planning, operational management, service facilities, and community integration. At the same time, indicator clustering within factors becomes more coherent.
The additional factor mainly involves indicators located near the boundary between spatial planning, media perception, and community-related interaction. This suggests that FE-EFA separates relationships that are partially merged under point-valued encoding. The full interpretation is presented in Table 4.
5.1.5. Comparison of the Two Structures
The two solutions are similar at the overall level, with consistent main dimensions across methods. Differences appear at a finer level.
FE-EFA retains an additional marginal factor and separates certain aggregated dimensions into more specific components. Indicator grouping is also more consistent within factors.
These results indicate that uncertainty-aware representation improves the resolution of the factor structure. Rather than introducing new constructs, it makes existing relationships more distinguishable, particularly near the boundaries between related dimensions.
5.2. Controlled Comparison Under a Unified Eight-Factor Specification
To distinguish the effect of factor retention from structural organization, both analytical routes were re-estimated under a fixed eight-factor specification. This controlled setting allows a direct comparison of indicator allocation and factor clarity when dimensionality is held constant.
5.2.1. Overall Structural Correspondence
At the overall level, the two methods produce comparable factor frameworks. The main thematic dimensions remain identifiable in both solutions, indicating that the underlying conceptual structure of the indicator system is stable across analytical routes.
Differences become apparent when examining the internal organization of factors. With the number of factors fixed, variations emerge in indicator allocation and the sharpness of factor boundaries. The FE-EFA solution shows more consistent grouping of conceptually related indicators, whereas the point-valued solution exhibits a relatively more diffuse structure.
5.2.2. Indicator Allocation and Cross-Loading Patterns
The clearest difference between the two methods is observed in cross-loading patterns. Under the eight-factor specification, the point-valued solution contains a larger number of moderate cross-loadings, while the FE-EFA solution shows a more distinct allocation of indicators.
Using a secondary-loading threshold of 0.30, five cross-loading indicators are identified in the point-valued solution, compared to two in the FE-EFA solution. This reduction indicates a clearer separation between latent constructs under uncertainty-aware preprocessing.
Table 5 summarizes the comparison between the two solutions. While the cumulative variance explained by the point-valued solution is higher, the FE-EFA solution shows stronger structural clarity and more coherent indicator clustering.
The difference is particularly evident for indicators related to spatial planning, accessibility, media perception, and community interaction. In these domains, responses are more likely to involve ambiguity between adjacent ordinal categories. The FE-EFA representation appears to reduce overlap between factors in such cases.
5.2.3. Structural Interpretation Under FE-EFA
The reduction in cross-loadings is associated with clearer factor boundaries and more stable interpretation. In the FE-EFA solution, indicators are more consistently grouped within factors, and the distinction between related dimensions becomes more explicit.
By contrast, the point-valued solution shows broader and partially overlapping factors, especially in domains where perception-based evaluation is involved. This pattern is consistent with the aggregation effect observed under discrete encoding.
It should be noted that the improvement under FE-EFA is not reflected in all statistical indicators. Under the unified specification, the cumulative explained variance remains higher in the point-valued solution (65.995%) than in the FE-EFA solution (58.947%).
However, the main advantage of FE-EFA lies in the improved separation of latent constructs rather than variance maximization. As illustrated in Figure 2, the FE-EFA solution provides a clearer structural representation when ordinal uncertainty is taken into account.
5.3. Entropy, Jensen–Shannon Divergence, and Weight Reallocation
To further examine how uncertainty-aware preprocessing affects the internal representation of indicators, this section analyzes four aspects: entropy-based dispersion, indicator-level Jensen–Shannon (JS) divergence, entropy-informed weight reallocation, and structural divergence in correlation patterns. These measures provide a complementary information-theoretic perspective beyond factor loading patterns.
5.3.1. Entropy as a Measure of Representation Dispersion
Entropy was used to quantify the dispersion of indicator evaluations under the point-valued and FE-EFA representations. In this context, entropy reflects the degree of uncertainty in the distribution of responses across ordinal categories.
As shown in Figure 3, entropy values under FE-EFA are consistently higher than those under the point-valued representation across all indicators. The average entropy under FE-EFA is 0.8688, indicating an overall increase in distributional dispersion.
This difference is driven by the representation mechanism. Point-valued encoding assigns each observation to a single category, whereas FE-EFA allows partial membership across adjacent categories. As a result, the support of the distribution is expanded and artificial concentration at single points is reduced.
The increase in entropy should not be interpreted as additional noise. Instead, it reflects the preservation of ordinal ambiguity that is suppressed under point-valued encoding. From an information-theoretic perspective, this indicates that FE-EFA retains additional distributional information relevant for subsequent structural analysis.
5.3.2. Indicator-Level Distributional Divergence
To assess how the fuzzy representation modifies the distribution of ordinal responses, Jensen–Shannon (JS) divergence was computed for each indicator by comparing the point-valued distribution with the corresponding fuzzy distribution.
Unlike entropy, which measures dispersion within a single representation, JS divergence captures the degree of redistribution between representations. It therefore quantifies the extent to which the FE-EFA transformation departs from the original point-valued encoding.
Table 6 reports the 10 indicators with the highest JS divergence values. The largest divergence is observed for Passenger visual field (0.0302), followed by Regional visual coordination (0.0265) and Operating speed (0.0262). At the same time, the average JS divergence across all indicators remains relatively small (0.0133), indicating that the overall distributional structure is largely preserved.
Indicators with higher JS divergence are mainly concentrated in perceptual and interaction-related domains. In these cases, responses are more likely to span adjacent categories, making them sensitive to fuzzy transformation. The redistribution of probability mass across neighboring categories becomes more pronounced.
Higher JS divergence does not indicate distortion. Instead, it reflects where the fuzzy representation makes latent ambiguity visible. In this sense, JS divergence serves as a diagnostic measure of representation change rather than a measure of inconsistency.
5.3.3. Weight Reallocation Under Entropy Constraints
Based on the entropy results, indicator weights were recalculated using entropy-based dispersion measures. The comparison between point-valued and FE-EFA weights is presented in Figure 4.
Overall, the two weighting schemes remain broadly comparable. However, indicator-level deviations are observed, reflected as upward and downward shifts rather than uniform changes. These shifts indicate that entropy differences translate into directional adjustments in indicator importance.
Indicators such as Advertising revenue and Surrounding land use and development show increased weights under FE-EFA, whereas indicators such as Passenger visual field and Layout design show relative decreases. This pattern indicates that FE-EFA does not preserve the original weighting structure unchanged.
Instead, indicator importance is recalibrated by combining structural contribution with entropy-based information concentration. Entropy thus functions as a regularizing component that links distributional characteristics to final weights, making the weighting scheme more responsive to the informational profile of ordinal data.
5.3.4. Structural Divergence in Correlation Patterns
In addition to distributional changes, FE-EFA modifies the correlation structure among indicators. To examine this effect, absolute differences between the point-valued and fuzzy correlation matrices were computed.
Table 7 reports the indicator pairs with the largest changes in pairwise correlations. The most pronounced differences involve indicators related to spatial design, media perception, and operational performance. These domains are typically associated with perceptual and context-dependent evaluations.
A consistent directional pattern is observed. Correlations that are weakly negative under point-valued encoding often become close to zero or weakly positive under FE-EFA. This suggests that some negative associations may be influenced by rigid category boundaries rather than stable underlying relationships.
At the aggregate level, structural changes remain moderate. The average absolute correlation difference is 0.0569, with a maximum of 0.2015. The structural Jensen–Shannon divergence between the two correlation matrices is 0.0212, indicating that the overall dependency structure is largely preserved.
These changes can be interpreted as a smoothing effect on ordinal discontinuities. By allowing partial membership across adjacent categories, FE-EFA reduces abrupt transitions and produces more continuous covariance relationships.
5.3.5. Integrated Interpretation
The combined results from entropy, JS divergence, weight adjustment, and correlation analysis show that FE-EFA refines the representation of ordinal data without altering its overall structure.
Entropy increases due to the redistribution of category membership, while JS divergence indicates that these changes remain controlled and localized. Weight reallocation reflects adjustments in indicator importance based on both structural relevance and information concentration. At the same time, correlation patterns exhibit moderate but systematic changes.
Overall, these results indicate that uncertainty-aware preprocessing improves the sensitivity and interpretability of the factor model, particularly for perception-based indicators where responses are inherently ordinal and transitional.
5.4. Practical Implications and Summary of Findings
The comparative results in Section 5.1, Section 5.2 and Section 5.3 show that introducing uncertainty-aware representation leads to consistent differences in factor structure, indicator allocation, and information distribution.
Under the same retention criterion, FE-EFA captures an additional marginal dimension that remains close to the retention boundary in the point-valued solution. When the number of factors is fixed, the FE-EFA results exhibit clearer loading patterns and fewer cross-loadings, indicating a more stable separation of latent constructs. These differences are further reflected at the distributional level, where entropy and Jensen–Shannon divergence reveal systematic shifts in how ordinal responses are represented and aggregated.
At the indicator level, entropy-based weighting produces directional adjustments rather than uniform changes, with some indicators gaining importance while others decrease. This suggests that uncertainty-aware preprocessing does not simply rescale the original results, but modifies the internal balance of the system by incorporating both structural contribution and distributional characteristics.
From a practical perspective, these findings imply that perception-based evaluation results may depend not only on the observed responses but also on how ordinal information is represented prior to analysis. In applied settings such as cultural tourism or transport service evaluation, this has implications for how key dimensions are identified and how indicator importance is interpreted in decision-making contexts.
6. Conclusions
This study proposes a parameterized fuzzy–entropy exploratory factor analysis (FE-EFA) framework for the analysis of ordinal Likert-scale perception data. By introducing a fuzzy membership representation and integrating entropy-based measures, the framework extends conventional EFA at the data representation stage while preserving its core analytical structure.
The results show that incorporating uncertainty into ordinal data representation affects both factor retention and structural clarity. Under a unified empirical setting, FE-EFA identifies an additional marginal factor that remains near the retention boundary in the point-valued solution. When dimensionality is controlled, the FE-EFA results exhibit clearer factor separation, fewer cross-loadings, and more coherent indicator clustering.
From an information-theoretic perspective, the proposed framework captures distributional characteristics that are not observable under point-valued encoding. The increase in entropy reflects the preservation of ordinal ambiguity, while the relatively low Jensen–Shannon divergence indicates that the overall distributional structure remains stable. In addition, entropy-informed weighting reveals systematic shifts in indicator importance, linking structural contribution with information concentration.
These findings suggest that the representation of ordinal data plays a substantive role in factor-analytic outcomes. Rather than altering the conceptual structure, the FE-EFA framework improves the resolution of latent relationships by making implicit uncertainty analytically visible. This provides a more informative basis for interpreting perception-based evaluation results.
In practical terms, the proposed approach offers a flexible and applicable tool for analyzing perception data in cultural tourism, transport evaluation, and related domains. It allows uncertainty to be incorporated without modifying survey design, making it suitable for a wide range of existing datasets.
The present study focuses on a specific parameterization of uncertainty and a single empirical context. Future research may examine alternative forms of uncertainty representation, explore applications in different domains, and further investigate the interaction between representation, information measures, and latent structure identification.
Supplementary Materials
The following supporting information can be downloaded at the website of this paper posted on Preprints.org
Author Contributions
Conceptualization and methodology, J.P.; data investigation, Y.S.; writing—original draft, J.P.; writing—review and editing, J.P. and Y.S. All authors have read and agreed to the published version of the manuscript.
Funding
This research was funded by Sichuan characteristic philosophy and social science planning project "Sichuan statistical development special topic", grant number SC22TJ04.
Institutional Review Board Statement
Not applicable.
Informed Consent Statement
Not applicable.
Data Availability Statement
The original contributions presented in the study are included in the article: further inquiries can be directed to the corresponding author.
Conflicts of Interest
The authors declare no conflicts of interest.
References
- Prideaux, B. The role of the transport system in destination development. Tour. Manag. 2000, 21, 53–63. [Google Scholar] [CrossRef]
- Khadaroo, J.; Seetanah, B. The role of transport infrastructure in international tourism development: A gravity model approach. Tour. Manag. 2008, 29, 831–840. [Google Scholar] [CrossRef]
- Likert, R. The method of constructing an attitude scale. In Scaling; Routledge: London, UK, 2017; pp. 233–250. [Google Scholar] [CrossRef]
- Drinkwater, B.L. A comparison of the direction-of-perception technique with the Likert method in the measurement of attitudes. J. Soc. Psychol. 1965, 67, 189–196. [Google Scholar] [CrossRef]
- Likert, R.; Roslow, S.; Murphy, G. A simple and reliable method of scoring the Thurstone attitude scales. Pers. Psychol. 1993, 46, 689–690. [Google Scholar] [CrossRef]
- Bodur, S.; Topal, S.; Gürkan, H.; Edalatpanah, S.A. A novel neutrosophic Likert scale analysis of perceptions of organizational distributive justice via a score function: A complete statistical study and symmetry evidence using real-life survey data. Symmetry 2024, 16, 598. [Google Scholar] [CrossRef]
- Stevens, S.S. On the theory of scales of measurement. Science 1946, 103, 677–680. [Google Scholar] [CrossRef] [PubMed]
- Jamieson, S. Likert scales: How to (ab)use them. Med. Educ. 2004, 38, 1217–1218. [Google Scholar] [CrossRef]
- Memmedova, K.; Ertuna, B. Development of a fuzzy Likert scales to measure variables in social sciences. Inf. Sci. 2024, 662, 119792. [Google Scholar] [CrossRef]
- Worthington, R.L.; Whittaker, T.A. Scale development research. Couns. Psychol. 2006, 34, 806–838. [Google Scholar] [CrossRef]
- Fabrigar, L.R.; Wegener, D.T.; MacCallum, R.C.; Strahan, E.J. Evaluating the use of exploratory factor analysis in psychological research. Psychol. Methods 1999, 4, 272–299. [Google Scholar] [CrossRef]
- Agresti, A. Categorical Data Analysis, 2nd ed.; John Wiley & Sons: New York, NY, USA, 2002. [Google Scholar] [CrossRef]
- Norman, G. Likert scales, levels of measurement and the “laws” of statistics. Adv. Health Sci. Educ. 2010, 15, 625–632. [Google Scholar] [CrossRef]
- Baradaran, V.; Ghorbani, E. Development of fuzzy exploratory factor analysis for designing an e-learning service quality assessment model. Int. J. Fuzzy Syst. 2020, 22, 1772–1785. [Google Scholar] [CrossRef]
- Zadeh, L.A. Fuzzy sets. Inf. Control 1965, 8, 338–353. [Google Scholar] [CrossRef]
- Shannon, C.E. A mathematical theory of communication. Bell Syst. Tech. J. 1948, 27, 379–423. [Google Scholar] [CrossRef]
- De Luca, A.; Termini, S. A definition of a nonprobabilistic entropy in the setting of fuzzy sets theory. Inf. Control 1972, 20, 301–312. [Google Scholar] [CrossRef]
- Xia, M.; Xu, Z. Hesitant fuzzy information aggregation in decision making. Int. J. Approx. Reason. 2011, 52, 395–407. [Google Scholar] [CrossRef]
- Sabirov, D.S.; Shepelevich, I.S. Information entropy in chemistry: An overview. Entropy 2021, 23, 1240. [Google Scholar] [CrossRef] [PubMed]
Figure 1.
Scree plot with Kaiser cutoff.
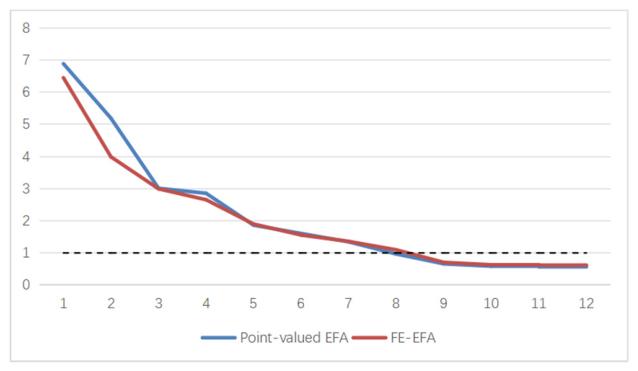
Figure 2.
Structural clarity comparison under the unified eight-factor specification.
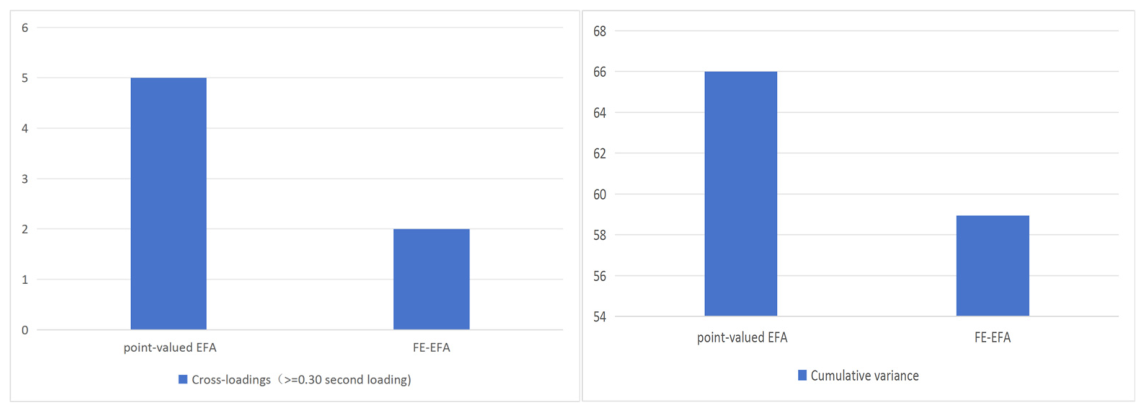
Figure 3.
Entropy comparison between point-valued and FE-EFA.
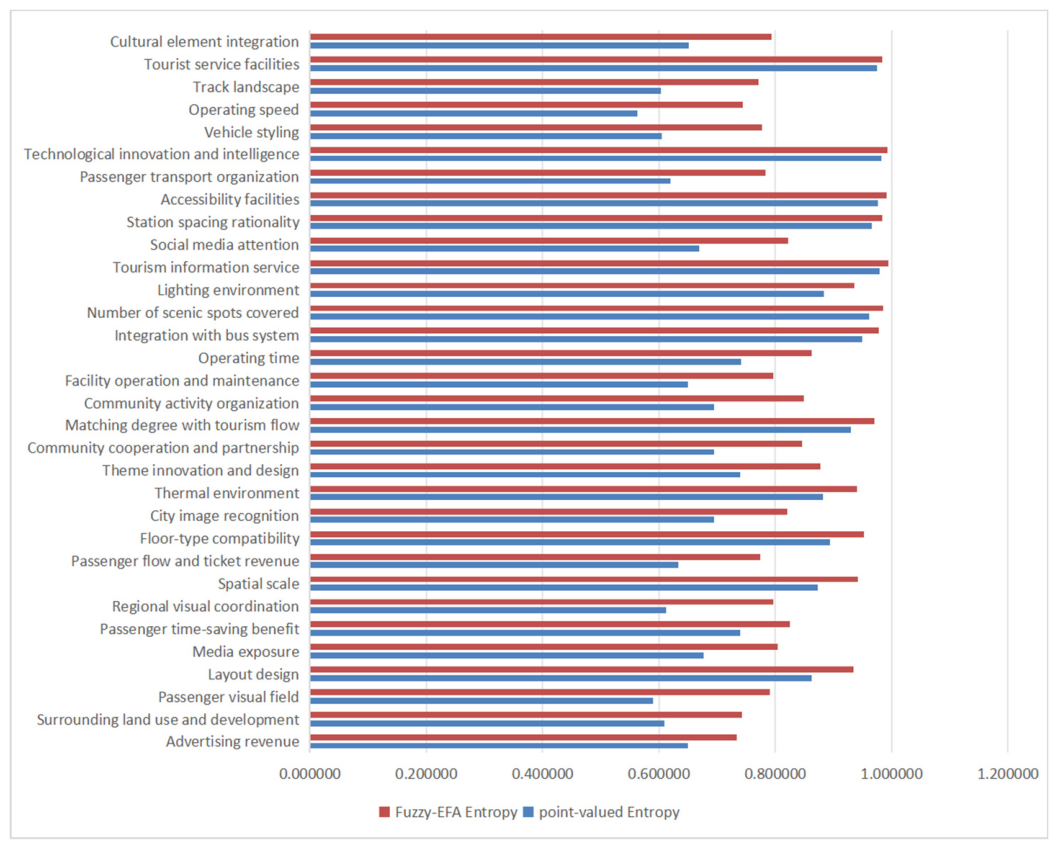
Figure 4.
Indicator weight changes between point-valued and FE-EFA.
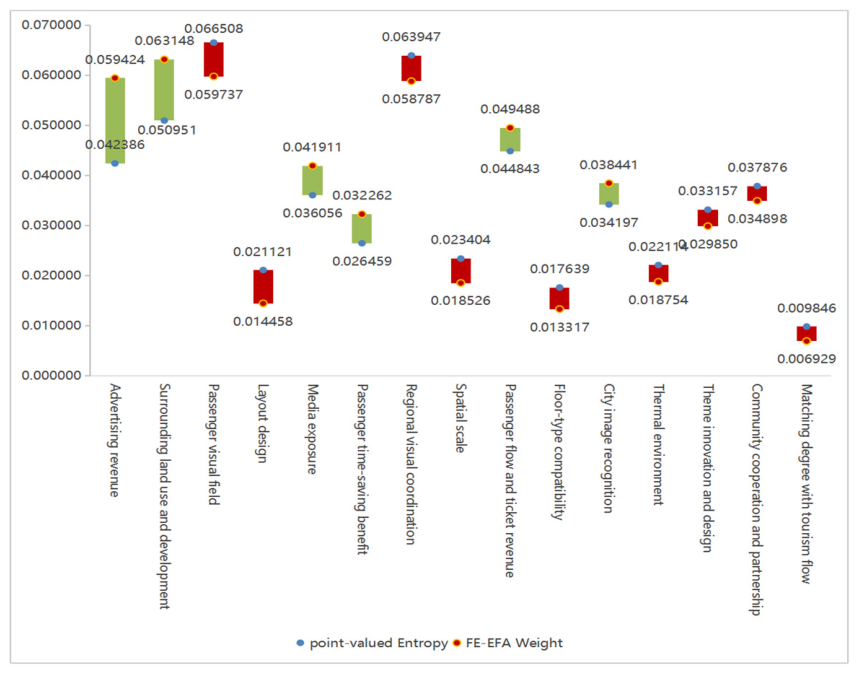

Table 1.
Data suitability and factor-retention summary.
| Item | Value | Interpretation |
|---|---|---|
| Sample size | 1242 | Adequate for stable factor estimation relative to 32 indicators |
| KMO | 0.8755 | Indicates strong sampling adequacy for factor analysis |
| Bartlett's test | = 25147.27, df = 496, p < 0.001 | Rejects identity matrix; correlations are sufficient for structure extraction |
| Factor retention by Kaiser criterion (point-valued data) | 7 | Provides baseline dimensionality under conventional point-valued representation for subsequent comparative analysis |
Table 2.
Eigenvalue comparison and factor retention based on the Kaiser criterion.
| Component | Point-valued EFA eigenvalue | > 1 | FE-EFA eigenvalue | > 1 |
|---|---|---|---|---|
| 1 | 6.883832738 | yes | 6.448284653 | yes |
| 2 | 5.187731438 | yes | 3.98757216 | yes |
| 3 | 3.011279147 | yes | 2.994138765 | yes |
| 4 | 2.854998336 | yes | 2.654173176 | yes |
| 5 | 1.862966624 | yes | 1.898130942 | yes |
| 6 | 1.605240391 | yes | 1.55696784 | yes |
| 7 | 1.345720183 | yes | 1.358777848 | yes |
| 8 | 0.967620909 | no | 1.096302318 | yes |
Table 3.
Interpretation of the Seven-Factor Structure (Point-valued EFA).
| Factor | Factor Name | Main Indicators | Interpretation |
|---|---|---|---|
| Factor 1 | Image and Cultural Display | Track landscape; Vehicle styling; Regional visual coordination; Passenger visual field; Cultural element integration | Represents the visual image and cultural expression of the tramway system, emphasizing landscape quality, vehicle appearance, spatial visual experience, and the integration of cultural elements into the tourism environment. |
| Factor 2 | Route Planning | Number of scenic spots covered; Integration with bus system; Station spacing rationality; Matching degree with tourism flow | Represents the rationality and connectivity of route design, including attraction coverage, multimodal integration, stop spacing, and alignment with tourism movement patterns. |
| Factor 3 | Travel Comfort | Thermal environment; Spatial scale; Lighting environment; Floor-type compatibility; Layout design | Represents the environmental and spatial comfort experienced by passengers during travel, including thermal conditions, interior scale, lighting, floor compatibility, and layout quality. |
| Factor 4 | Comprehensive Benefits | Surrounding land use and development; Passenger flow and ticket revenue; Advertising revenue; Passenger time-saving benefit; City image recognition; Media exposure; Social media attention | Represents the broader comprehensive benefits generated by the tramway system, including economic returns, efficiency gains, land-use effects, and wider image and publicity impacts. |
| Factor 5 | Service Facilities | Tourist service facilities; Accessibility facilities; Tourism information service; Technological innovation and intelligence | Represents the quality and completeness of supporting facilities and service functions, including tourism-oriented services, accessibility support, information provision, and intelligent technology applications. |
| Factor 6 | Operation and Management | Facility operation and maintenance; Operating time; Passenger transport organization; Operating speed | Represents the operational efficiency and management quality of the tramway system, covering maintenance, service hours, passenger organization, and operating performance. |
| Factor 7 | Community Integration | Theme innovation and design; Community activity organization; Community cooperation and partnership | Represents the extent to which the tramway system is integrated with local community life through thematic design, activity participation, and cooperative relationships with community stakeholders. |
Table 4.
Interpretation of the Eight-Factor Structure (FE-EFA).
| Factor | Factor Name | Main Indicators | Interpretation |
|---|---|---|---|
| F1 | Image and Cultural Display | Track landscape; Vehicle styling; Regional visual coordination; Passenger visual field; Cultural element integration | Represents the aesthetic aspects of the tourism transit system, emphasizing cultural representation and visual harmony. |
| F2 | Travel Comfort | Thermal environment; Spatial scale; Lighting environment; Floor-type compatibility; Layout design | Represents the physical comfort experienced by passengers, including factors like climate control, spatial design, and lighting. |
| F3 | Promotion Effectiveness | City image recognition; Media exposure; Social media attention | Represents the broader socio-economic benefits and external recognition of the system, including branding and media impact. |
| F4 | Route Planning | Number of scenic spots covered; Integration with bus system; Station spacing rationality; Matching degree with tourism flow | Represents the design and planning of the routes, including coverage of tourist spots, connectivity with other transport modes, and rationality of station placement. |
| F5 | Operation and Management | Facility operation and maintenance; Operating time; Passenger transport organization; Operating speed | Represents the efficiency and management of the transit system, including operational timelines, maintenance, and passenger handling. |
| F6 | Service Facilities | Tourist service facilities; Accessibility facilities; Tourism information service; Technological innovation and intelligence | Represents the infrastructure supporting tourists, such as accessibility, technology use, and service availability. |
| F7 | Community Integration | Theme innovation and design; Community activity organization; Community cooperation and partnership | Represents the interaction between the transit system and local communities, focusing on community engagement and cooperative initiatives. |
| F8 | Financial Viability | Surrounding land use and development; Passenger flow and ticket revenue; Advertising revenue; Passenger time-saving benefit | Represents the financial and operational sustainability of the transit system, including the generation of revenue through passenger flow, advertising, and land development. |
Table 5.
Unified 8-factor comparison summary.
| Metric | Point-valued EFA | FE-EFA |
|---|---|---|
| Retained factors (Kaiser) | 7 | 8 |
| Cumulative variance (8 factors) | 65.995% | 58.947% |
| Number of cross-loadings (≥0.30) | 5 | 2 |
| Structural clarity | Moderate | High |
| Indicator clustering | More dispersed | More coherent |
Table 6.
Top 10 indicators ranked by Jensen–Shannon divergence.
| Rank | Indicator | JS divergence |
|---|---|---|
| 1 | Passenger visual field | 0.0302 |
| 2 | Regional visual coordination | 0.0265 |
| 3 | Operating speed | 0.0262 |
| 4 | Vehicle styling | 0.0244 |
| 5 | Track landscape | 0.0236 |
| 6 | Passenger transport organization | 0.0222 |
| 7 | Social media attention | 0.0201 |
| 8 | Community activity organization | 0.0195 |
| 9 | Community cooperation and partnership | 0.0195 |
| 10 | Passenger flow and ticket revenue | 0.0190 |
Table 7.
Top 10 structural changes in pairwise correlations.
| Indicator Pair | Point-valued Correlation | FE-EFA Correlation | |Δρ| | |
|---|---|---|---|---|
| Layout design | Media exposure | -0.1660 | 0.0354 | 0.2015 |
| Layout design | City image recognition | -0.1348 | 0.0488 | 0.1836 |
| Spatial scale | Media exposure | -0.1325 | 0.0451 | 0.1776 |
| Floor-type compatibility | Media exposure | -0.1326 | 0.0355 | 0.1681 |
| Lighting environment | Media exposure | -0.1360 | 0.0220 | 0.1580 |
| Station spacing rationality | Facility operation and maintenance | -0.1419 | 0.0154 | 0.1574 |
| Layout design | Operating speed | -0.1359 | 0.0192 | 0.1551 |
| Integration with bus system | Facility operation and maintenance | -0.1541 | 0.0008 | 0.1550 |
| Spatial scale | City image recognition | -0.1177 | 0.0370 | 0.1546 |
| Floor-type compatibility | Social media attention | -0.1350 | 0.0166 | 0.1516 |
Disclaimer/Publisher’s Note: The statements, opinions and data contained in all publications are solely those of the individual author(s) and contributor(s) and not of MDPI and/or the editor(s). MDPI and/or the editor(s) disclaim responsibility for any injury to people or property resulting from any ideas, methods, instructions or products referred to in the content. |
© 2026 by the authors. Licensee MDPI, Basel, Switzerland. This article is an open access article distributed under the terms and conditions of the Creative Commons Attribution (CC BY) license (http://creativecommons.org/licenses/by/4.0/).
Copyright: This open access article is published under a Creative Commons CC BY 4.0 license, which permit the free download, distribution, and reuse, provided that the author and preprint are cited in any reuse.


