Submitted:
21 April 2026
Posted:
23 April 2026
You are already at the latest version
Abstract
Microplastics are particles derived from polymer degradation, and their occurrence and abundance have been assessed across various environments and compartments. The method commonly used for their evaluation and quantification in sediments involves a marine salt solution for decantation. However, due to the high incidence of plastics in marine environments, this salt may already contain a considerable concentration of microplastics and must be carefully filtered to minimize interference during laboratory processing. To assess the importance of this procedure, sediment samples from an estuarine environment, in which the salt used for laboratory sorting was not filtered, were compared with samples from semiarid reservoirs, in which the salt underwent filtration before decantation. All other procedures were identical, performed by the same team under controlled airborne contamination conditions. The Mann–Whitney test applied to samples with and without NaCl filtration revealed a significantly lower incidence of microplastics in samples whose salt had been filtered. Based on these findings, a filtration protocol for NaCl used in sediment decantation was developed, emphasizing an accessible, low-cost product widely applied in natural environmental quality assessments. Only through the standardization of methodologies and sampling units will it be possible to compare environments in terms of actual anthropogenic impact, generating outcomes that provide scientific support for conservation actions and impact mitigation.
Keywords:
environmental impact
; microplastic filtration
; screening protocol
; NaCl
1. Introduction
Synthetic polymers, namely plastics, stand out for their density, long lifespan, and variable colors, shapes, and thicknesses, characteristics associated with their wide applicability, durability, and low cost [1]. Plastics are not reliably biodegradable, do not completely decompose, and accumulate in environments such as continental and marine waters [2]. When exposed to factors such as ultraviolet radiation, temperature variations, and chemical abrasion, these materials undergo a continuous degradation process [3]. This mechanism results in the oxidation of the polymer structure, followed by its fragmentation into progressively smaller sizes, potentially reaching the nanoparticle scale [4].
Microplastics, in turn, are solid synthetic polymer particles ranging from 1.0 µm to 5.0 mm [3]. Considered an environmental threat since the 1970s, microplastics have been increasingly discussed not only academically but also in society as a whole, mainly due to the lack of standardization when measuring their abundance and the impacts they cause. More recently, efforts have focused on understanding threshold values for the real damage they cause, both in the environment and in the biota.
Microplastics can be classified as primary or secondary according to their use. Primary particles are used as raw material for manufacturing a wide range of plastic items, whereas secondary particles originate from the degradation of macroplastics improperly discarded in the environment [5,6].
Numerous domestic and industrial activities lead to the release of plastic waste in inappropriate locations, where improper disposal becomes a major source of microplastics in diverse ecosystems. In terrestrial environments, the main contributors to the presence of microplastics are waste discarded on the ground, persistent dumps, and landfills, from which they are leached into aquatic environments. These sources ultimately result in aquatic pollution in different environments, such as rivers, lakes, reservoirs, lagoons, and estuaries, with the marine environment being their final destination [7].
In the context of microplastic screening in sediments, the use of saline solution is widely adopted due to its efficient flotation, low cost, and accessibility. This application is based on the physicochemical characteristics of NaCl, particularly its high solubility and the resulting increase in solution density, factors that favor the separation of microplastics by flotation [8]. However, the reliability of this method is potentially compromised by a methodological bias often neglected: intrinsic contamination of the reagent, since sea salt can contain hundreds of microplastic particles per kilogram [8,9] and is commonly used without a reliable prior filtration step.
After separation, the identification of microplastics is mainly performed through vibrational spectroscopy techniques, such as Fourier Transform Infrared Spectroscopy (FTIR) and Raman Spectroscopy [10,11,12,13]. Established in the study of synthetic polymers [14], these techniques are based on the excitation and detection of molecular vibrations, generating characteristic spectra that function as chemical “fingerprints” of materials [15]. However, both the pre-screening procedures and the spectroscopic analysis require adjustments and standardization to ensure the reliability of results and, consequently, minimize methodological noise.
Spectroscopy makes it possible to identify polymer composition by comparison with previously established reference spectra. In the case of FTIR, the sample is irradiated with infrared light in the 400–4000 cm−1 range (mid-infrared region) [15]. Radiation absorption varies according to molecular structure, with signals recorded in transmission or reflection modes, enabling detailed characterization [15].
Given the challenges mentioned, this study prioritizes the often insufficient care regarding the prior incidence of microplastics in NaCl [8] used in the preparation of routinely employed materials for microplastic screening, especially in the critical step of preparing the saline solution, which requires an effective and systematic pre-filtration procedure of NaCl for microplastic assessment in sediments. The experimental design directly compares two protocols: one using NaCl without prior treatment and another employing NaCl submitted to pre-filtration. The FTIR method was used for chemical identification of isolated particles, a step that also requires accuracy and observer expertise when characterizing the polymeric composition of microplastics, as many compounds are revealed to be organic after careful chemical analysis. Thus, the primary objective of this approach is to draw attention to the potential overestimation of environmental pollution by microplastics through reliable pre-filtration of the saline solution and a consistent extraction and preparation protocol for microplastics intended for spectroscopic evaluation.
2. Materials and Methods
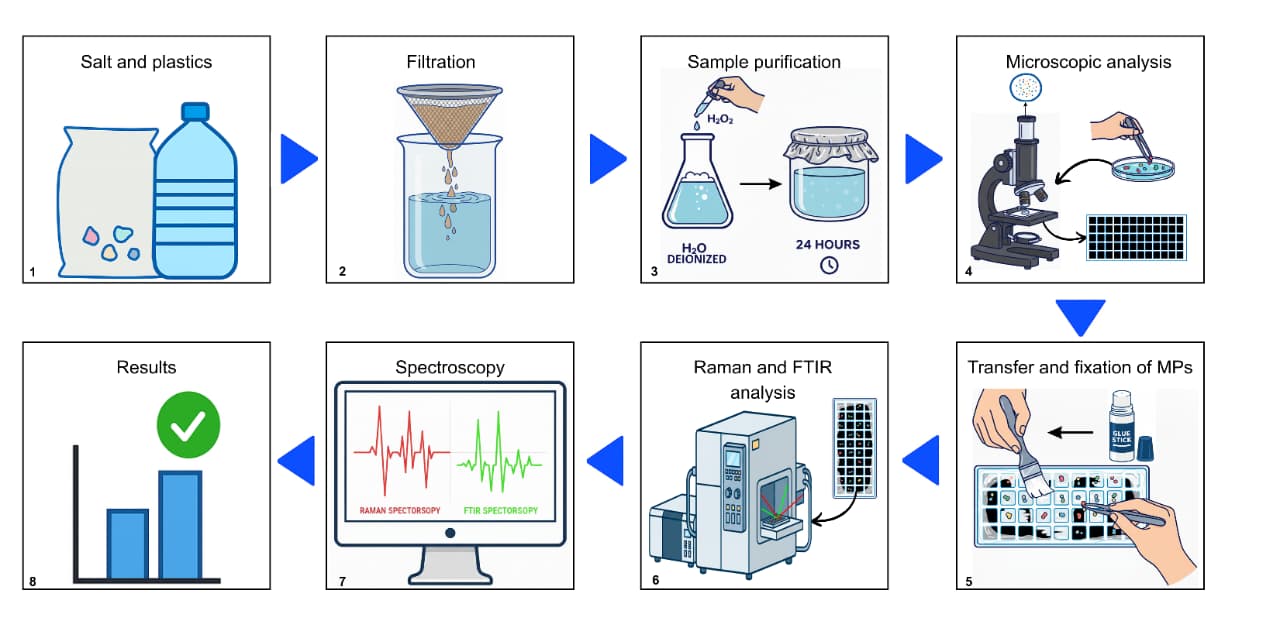
Sediment samples from two aquatic environments were analyzed: an estuary in the metropolitan region of the capital of Paraíba, and reservoirs in the semiarid region of Paraíba. Sixty samples were collected in the estuarine environment between March 2019 and February 2020, and 150 samples were collected in the reservoirs throughout 2022.
The sampling followed the same standardized protocol, using a Van Veen grab, deployed one to three times per sampling point until 0.5 kg of sediment was obtained. To minimize plastic contamination, the material was carefully transferred with the aid of a stainless-steel spatula into glass jars previously washed with distilled water. The samples were properly labeled and transported in thermal boxes to the laboratory, where they underwent processing and sorting (Appendix A).
The methodological distinction between the two datasets lies in the sorting stage: the estuarine samples were processed using an unfiltered saline solution, whereas the reservoir samples were processed using a filtered saline solution. This comparative approach allowed the evaluation of the influence of saline solution filtration on the detection of microplastics.
2.1. Laboratory Screenings
The processing of sediment samples followed a standardized protocol, beginning with weighing the material on a precision balance (Shimadzu; 0.01 g) and storing it in pre-weighed aluminum containers. The sediment samples (100 g) were dried in an oven at 60°C for 48 hours. A new weighing was then performed to record the final dry weight, with all steps detailed in the supplementary material. It is necessary to emphasize that throughout this study, the Airborne Contamination Control Protocol – ACC Protocol [16] was rigorously applied, both to the samples and to the controls. Its purpose is to identify airborne fibers, which visually differ from microplastics originating from the sediment under a stereomicroscope screening and, if present, must be excluded from the calculation of the total number of microplastics in the samples.
2.2. Screening of Estuary Samples—Unfiltered Saline Solution
The dried sediment was transferred to a beaker, where a NaCl solution (140 g/L) prepared in filtered distilled water was added. The mixture was then homogenized with a glass rod for five minutes and left to settle for 4 hours, with the beaker sealed with aluminum foil for decantation. After this period, the sample was subjected to filtration through a 20 µm mesh using an aluminum sieve attached to the mesh to facilitate the process. Distilled water was used to remove all filtrate residue and transfer the material to a Petri dish triple-washed with filtered distilled water, always using the same 20 µm mesh. Subsequently, the supernatant was analyzed under a stereomicroscope to quantify the microplastics per sample.
For control, a NaCl solution (140 g/L) in filtered distilled water was prepared, homogenized with a glass rod for 5 minutes, sealed with aluminum foil, and left to settle for decantation. Then, 1 L of the supernatant was screened for visual quantification of microplastics, following the same protocol applied to the samples.
2.3. Screening of Reservoir Samples—Filtered Saline Solution
The difference lies in the first step of laboratory screening, when the saline solution (140 g/L) was subjected to prior filtration before being added to 100 g of sediment. This mixture was homogenized with a glass rod for 5 minutes, sealed with aluminum foil, and left to rest for 4 hours for complete decantation, confirmed by the visual clarification of the supernatant. The supernatant was then processed for visual screening, following the same control protocol used for the estuarine samples.
2.4. Identification of the Chemical Composition of Microplastics and Statistical Analysis
The microplastic particles obtained from the saline solution were separated and placed on microfossil slides containing 60 quadrants. Their chemical composition was then determined using a Fourier-transform infrared (FTIR) microscope (AIR-sight Infrared/Raman Microscope model, Shimadzu). A 15X objective was used for the identification of the microplastics. The analyses were performed in reflectance mode, covering a wavenumber range of 400–4000 cm−1, with a resolution of 8 nm and 128 scans per sample. Polymers were identified by comparing the collected spectra with the instrument’s library data. The acceptance criterion used was similarity values above 620.
The data used in this study were processed with the aid of statistical packages in RStudio Software, version R 4.3.2. The statistical analysis began with verification of data normality using the Shapiro-Wilk test, adopting the criterion of p > 0.05 as indicative of a normal distribution. Considering that the data did not meet this assumption, the nonparametric Mann-Whitney test was applied to compare independent medians, in order to assess the significance of differences in the number of microplastics in samples without and with pre-filtration of the saline solution used.
3. Results
The Shapiro–Wilk test indicated that the data regarding the amount of microplastics did not show a normal distribution in either of the groups analyzed. The samples without prior filtration of the saline solution presented statistics (W = 0.67869; p = 2.172 × 10⁻⁹), whereas the samples with filtration presented (W = 0.82457; p = 5.557 × 10⁻¹²). Given the absence of normality, the nonparametric Mann–Whitney test was used as the most appropriate statistical tool for comparing the two datasets. The result obtained (U = 6621; p = 3.048 × 10⁻¹⁵) showed a statistically significant difference between the groups, confirming the disparity in the amount of microplastics in the samples without and with pre-filtration, at a 5% significance level.
Figure 1 visually demonstrates this statistical difference, clearly illustrating the reduction in the number of particles identified when the saline solution was previously filtered through a 20 µm mesh. Even in the control of the unfiltered solution, 37 microplastics filaments were recorded. Thus, the importance of pre-filtration in this study was evident, as the incidence of microplastics was significantly higher in the estuarine environment where saline pre-filtration did not occur. It is confirmed that using a filtered saline solution in the laboratory sediment-screening process for microplastics increases the reliability of environmental assessments and reduces one of the most common methodological errors in sample processing, which typically leads to an overestimation of the actual anthropogenic impact in the area. Considering this, a Laboratory Sediment Screening Protocol was established to ensure that the recorded abundance of microplastics in sediment samples accurately represents their true occurrence in the environment, rather than being influenced by subtle methodological inconsistencies throughout the process. After all, saline solution is essential for the physical decantation process of microplastics due to its easy acquisition, widespread use, and low cost.
Regarding the chemical composition of the microplastics, 60 samples were analyzed using the μ-FTIR technique. After careful manual review of the spectra obtained, 41 samples (68.33%) were identified: 14 were classified as ethylene-vinyl alcohol (EVOH); 9 as cellulose and derivatives, such as cotton, categorized as “others” for not being synthetic polymers; 5 as polyacetylene (PA); 5 as polystyrene (PS); 4 as nylon (polyamide); and 4 as polyvinyl alcohol (PVA) (Figure 2).
4. Discussion
Indeed, as demonstrated [8], sea-extracted salt, the main source of salt consumed in Brazil, contains insoluble material on the order of 0.32 ± 0.57 g/kg with an average density of 3443 ± 2696.54 particles/kg in the refined salts sold in the country. The types of plastics found in refined table salt were polyethylene (PE), polyethylene terephthalate (PET), polypropylene (PP), and polystyrene (PS) [8]. Koelmans et al. [17] evaluated the risk of plastic particles in the environment and stated that the most abundant polymers found among the assessed microplastics were polyethylene (PE), polyethylene terephthalate (PET), polyamide (PA, a group of fibers that includes nylon), polypropylene (PP), polystyrene (PS), polyvinyl alcohol (PVA), and polyvinyl chloride (PVC). Given these cases and many others available in the literature, the question arises: “how much of this originates from methodological noise present in the analytical procedure?” In the effort to increase the reliability of environmental impact analyses involving microplastics, this study highlights the importance of a simple standardization step: using filtered commercial salt solutions for sediment decantation. Therefore, it becomes mandatory that anyone employing marine-derived NaCl in laboratory screenings for sediment decantation, or after the combustion of organic matter, whether using H2O2 or not, takes responsibility for filtering it before use, since it is widely used for this purpose due to its low cost and easy acquisition.
An indication of the effect of not filtering the saline solution was the presence of up to 37 microplastic filaments in the control used during the laboratory screening of the sediment proposed here, since after filtering the saline solution employed, the control dropped to zero during the reservoir sediment stage [18]. Several studies that investigated and quantified microplastics in domestic salt demonstrate the high incidence of polymers [19,20], particularly fibers and filaments [21], which are the materials most used in intermediate steps to facilitate the decantation of microplastics in laboratory screenings. Thus, research on microplastic impacts in different environments, whether in sediments, water, or even in the tissues of organisms that ingest them, often uses saline solutions, provided that proper attention is given to the filtration process employed in the methodology [22,23]. As argued [24], there are many methodological recommendations in the literature, but it is still necessary to develop and adopt a standardized protocol for the use of saline solution, especially when marine-derived salt is employed, into ensure more accurate estimates of microplastic abundance in assessments of anthropogenic impact across different environments.
In view of the above, a procedural protocol is proposed that prioritizes the proper filtration of the salt used in sediment decantation for microplastic counting, regardless of the type of salt employed. The Laboratory Salt Screening Protocol is presented in Annex 1 and was widely applied and adjusted to the needs of this research, so that in studies of this nature, aimed at assessing anthropogenic impact on soils and sediments, it may be properly applied according to their objectives, but with the understanding that the NaCl used must be carefully selected and precisely filtered. In laboratory microplastic screening, the first precaution must be the preparation of the workspace and of the researcher performing the procedure.
Given the above and the significant number of microplastics in the sample with the smallest number of pseudoreplicates, the need for filtering the saline solutions used in sediment screening for microplastic quantification is confirmed, according to the Laboratory Sediment Screening Protocol proposed here, to ensure that the microplastics found in the sample originate exclusively from the sample itself and not from the salt used.
The polymers identified differ substantially in their degradation pathways and potential contributions to environmental microplastic loads. Polystyrene (PS) and polyamides exhibit high persistence and limited photodegradation, favoring the formation of fragments and microfibers widely reported in aquatic environments [25]. Polyacetylene shows greater susceptibility to photochemical oxidation and lower ecological relevance due to its limited industrial use. Polyvinyl alcohol (PVA) is distinguished by its water solubility and higher biodegradation rates, reducing its potential for environmental accumulation. Ethylene-vinyl alcohol (EVOH) undergoes slow microfragmentation. These structural and functional differences suggest that the relative contribution of these polymers to microplastic dynamics is heterogeneous and dependent on intrinsic properties, environmental conditions, and usage contexts. EVOH is a polymer that undergoes photodegradation, but its propensity to generate microplastics is lower than that of polymers such as PE, PP, PS, PET, and nylon. Finally, synthetic polyamides negatively impact the environment due to the intense and continuous release of microfibers, for example in the domestic and industrial use of washing machines for synthetic textiles. In 2020, this material represented 5% of the global fiber market, around 5.4 million tonnes [26]. Every finding is valuable, but there is still a long road ahead in the effort to reduce the impact caused by microplastics.
5. Conclusions
The objective of drawing attention to the careless and indiscriminate use of sea salt during laboratory sample screening for microplastic detection was achieved. This study confirms that the pre-filtration of the saline solution used in the process of screening microplastics in sediment samples in the laboratory is essential to increase the reliability of the assessment of the environment under study, reducing one of the most common methodological errors in sample processing. In this way, a Laboratory Sediment Screening Protocol was created so that the abundance of microplastics recorded in the evaluated sediments is faithful to their occurrence in the environment and not derived from the methodology applied in the screening process, since the saline solution is essential for the physical process of decanting microplastics, is easy to obtain, widely used, and low-cost. Regarding the chemical composition of microplastics, the μ-FTIR technique was able to identify 68.33% of the analyzed samples using the library available in the equipment. The chemical characterization of microplastics is essential to trace the sources of contamination and the dispersion routes of impactful synthetic polymers, as well as to ensure maximum accuracy of the data; identification via reference library must be corroborated by manual validation of the spectra, reinforcing the robustness of the findings to provide a solid basis for future research and for the continuous monitoring of environmental quality, so that, with reliability, scientific research contributes to the development of more effective environmental policies to mitigate widespread microplastic pollution.
Supplementary Materials
The following supporting information can be downloaded at the website of this paper posted on Preprints.org, PTSL - PROTOCOL FOR SALINE SOLUTION FILTRATION IN MICROPLASTIC ANALYSIS. This protocol describes the method for extracting and identifying microplastics in sediments using density separation with NaCl saline solution. The procedure involves filtration and microscopic analysis, with strict contamination controls, offering a low-cost alternative for quantifying and characterizing the morphology of microplastics.
Author Contributions
M.L.C.R. and A.L.V. designed the study, data curation, formal analysis, visualization, investigation, writing-review and editing. W.R.FB. and C.S.P participated in investigation, made the figures, data curation, writing-review and editing. P.K.L.R. made contributions in writing-review and editing text. All authors have read and agreed to the published version of the manuscript.
Funding
This research was funded by PELD Rio Paraíba Integrado, Chamada FAPESQ/PELD nº 21/2020, grant number nº 403/2021 and National Institute of Science and Technology on Molecular Sciences (INCT-CiMol), Grant CNPq 406804/2022-2.
Data Availability Statement
Research data are available in the body of the manuscript.
Acknowledgments
I would like to thank Professor Dr. Elquio Eleamen Oliveira, responsible for the Central Multiusuário de Análise e Caracterização Químico-Biológica (CM-ACQuimBio), for the availability and support in conducting the spectroscopic analyses. We are also deeply grateful to technician Malu Maria Lucas dos Reis for her essential support in carrying out the polymer analyses.
Conflicts of Interest
The authors declare no conflicts of interest.
Appendix A
SUPPLEMENTARY MATERIAL - PTSL
PROTOCOL FOR SALINE SOLUTION FILTRATION IN MICROPLASTIC ANALYSIS
This protocol describes the method for extracting and identifying microplastics in sediments using density separation with NaCl saline solution. The procedure involves filtration and microscopic analysis, with strict contamination controls, offering a low-cost alternative for quantifying and characterizing the morphology of microplastics.
1. MATERIALS AND REAGENTS
- Precision balance
- Drying oven
- Stereoscopic microscope
- Glass beaker (1 L) – (2 units per sample)
- Glass Petri dishes (minimum of 5 units)
- Glass rod
- Filtration membrane (20 µm)
- Aluminum sieve
- Rubber band
- Aluminum container with lid (capacity: 250 mL)
- Wash bottles
- Stainless steel spatula
- Microtubes (1.5/2 mL)
- Sodium chloride (NaCl)
- Distilled water (filtered with 20 µm membrane)
- 70% ethanol
- Aluminum foil
- Personal protective equipment (gloves, mask, cotton lab coat)
2. EXPERIMENTAL PROCEDURE
2.1. Preparation and Drying of Sediment
- Weigh 250 g of wet sediment.
- Dry in the oven at 60 ± 5 °C for 48 h or until the sample is completely dry.
2.2. Preparation of the saline solution
- Weigh 140 g of NaCl.
- Add the salt to a beaker triple-washed with filtered distilled water.
- Bring the volume to ~1 L with filtered distilled water.
- Stir the solution with a glass rod for 5 minutes or until fully saturated.
2.3. Assembly of the filtration system
- Wash the sieve, rubber band, and filtration membrane 3× with filtered distilled water.
- Cover the top of the sieve with the membrane and secure it with the rubber band.
- Fit the filtration system over a new and clean beaker.
- Filter the saline solution.
2.4. Extraction of Microplastics by Flotation
- Weigh 100 g of dry sediment and transfer it to the beaker containing the filtered saline solution.
- Homogenize the mixture for 5 minutes with a glass rod.
- Cover the beaker with aluminum foil and allow it to rest for 4 h for decantation.
- Filter the supernatant using a 20 µm mesh, avoiding disturbance of the settled sediment.
2.5. Transfer and Microscopic Analysis
- Clean the bench with 70% ethanol.
- Place three Petri dishes beside the stereoscopic microscope, filling the bottom with filtered distilled water (blank).
- Rinse the 20 µm mesh with filtered distilled water, transferring the material to a new Petri dish.
- Analyze the plates under the stereoscopic microscope and identify possible microplastics.
- Record morphology and predominant color of each microplastic particle.
- Transfer the microplastics to labeled microtubes (1.5–2 mL) containing 70% ethanol.
Contamination Prevention
Apply the Airborne Contamination Control Protocol [16].
Environment: Perform the procedure in a location with low foot traffic.
Clothing: Always use a 100% cotton lab coat and PPE.
Notes
Chemical confirmation: To validate visual identifications, use µ-FTIR or Raman spectroscopy.
Clean organic matter from the microplastics with hydrogen peroxide (35%) before spectroscopic analysis.
References
- Montagner, C.C.; Dias, M.A.; Paiva, E.M.; Vidal, C. Microplásticos: ocorrência ambiental e desafios analíticos. Quim Nova 2021, 44, 1328–52. [Google Scholar] [CrossRef]
- Geyer, R.; Jambeck, J.R.; Law, K.L. Production, use, and fate of all plastics ever made. Sci Adv. 2017, 3(7), e1700782. [Google Scholar] [CrossRef]
- Pappis, T.; Kapusta, S.C.; Ojeda, T. Metodologia de extração de microplásticos associados a sedimentos de ambientes de água doce. Eng Sanit Ambient. 2021, 26, 749–56. [Google Scholar] [CrossRef]
- Browne, M.A.; Galloway, T.; Thompson, R. Microplastic-an emerging contaminant of potential concern? Integr Environ Assess Manag 2007, 3(4). [Google Scholar] [CrossRef] [PubMed]
- Thompson, R.C.; Olsen, Y.; Mitchell, R.P.; Davis, A.; Rowland, S.J.; John, A.W.; et al. Lost at sea: where is all the plastic? Science 2004, 304(5672), 838. [Google Scholar] [CrossRef]
- Vendel, A.L.; Bessa, F.; Alves, V.E.; Amorim, A.L.; Patrício, J.; Palma, A.R. Widespread microplastic ingestion by fish assemblages in tropical estuaries subjected to anthropogenic pressures. Mar Pollut Bull. Available at. 2017, 117(1-2), 448–55. [Google Scholar] [CrossRef] [PubMed]
- Hooper, D.U.; Chapin, F.S., III; Ewel, J.J.; Hector, A.; Inchausti, P.; Lavorel, S.; et al. Effects of biodiversity on ecosystem functioning: a consensus of current knowledge. Ecol Monogr. 2005, 75. [Google Scholar] [CrossRef]
- Falasco, C.F. Avaliação da presença de partículas insolúveis e microplásticos em sais de origem marinha do Brasil [tese]; Universidade de São Paulo: São Paulo, 2019. [Google Scholar]
- Rakib, M.R.; Al Nahian, S.; Newton, S.; Parvin, A.; Eke, W.; Komola, R.; et al. Microplastics pollution in salt pans from the Maheshkhali Channel, Bangladesh. Sci Rep. 2021, 11(1), 23187. [Google Scholar] [CrossRef]
- Imhof, H.K.; Ivleva, N.P.; Schmid, J.; Niessner, R.; Laforsch, C. Contamination of beach sediments of a subalpine lake with microplastic particles. Curr Biol. 2013, 23, R867–8. [Google Scholar] [CrossRef]
- Frias, J.P.; Otero, V.; Sobral, P. Evidence of microplastics in samples of zooplankton from Portuguese coastal waters. Mar Environ Res. 2014, 95, 89–95. [Google Scholar] [CrossRef] [PubMed]
- Song, Y.K.; Hong, S.H.; Jang, M.; Kang, J.H.; Kwon, O.Y.; Han, G.M.; et al. Large accumulation of micro-sized synthetic polymer particles in the sea surface microlayer. Environ Sci Technol. 2014, 48, 9014–21. [Google Scholar] [CrossRef]
- Enders, K.; Lenz, R.; Stedmon, C.A.; Nielsen, T.G. Abundance, size and polymer composition of marine microplastics ≥10 μm in the Atlantic Ocean and their modelled vertical distribution. Mar Pollut Bull. 2015, 100, 70–81. [Google Scholar] [CrossRef]
- Everall, N.J.; Chalmer, J.M.; Griffiths, P.R. Vibrational spectroscopy of polymers: principles and practice; Wiley-VCH: Weinheim, 2007. [Google Scholar]
- Käppler, A.; Fischer, D.; Oberbeckmann, S.; Schernewski, G.; Labrenz, M.; Eichhorn, K.J.; et al. Analysis of environmental microplastics by vibrational microspectroscopy: FTIR, Raman or both? Anal Bioanal Chem. 2016, 408, 8377–91. [Google Scholar] [CrossRef]
- Paiva, B.O.; Lima, A.C.; Silva, C.P.; Souza, T.C.; Vendel, A.L. How to control the airborne contamination in laboratory analyses of microplastics? Braz Arch Biol Technol. 2022, 65. [Google Scholar] [CrossRef]
- Koelmans, A.A.; Redondo-Hasselerharm, P.E.; Nor, N.H.; de Ruijter, V.N.; Mintenig, S.M.; Kooi, M. Risk assessment of microplastic particles. Nat Rev Mater. Available from. 2022, 7(2), 138–52. [Google Scholar] [CrossRef]
- Pereira, C. Impacto por microplásticos no sedimento em sistemas aquáticos da Paraíba [relatório PIBIC]; UEPB: Campina Grande, 2023. [Google Scholar]
- Yang, D.; Shi, H.; Li, L.; Li, J.; Jabeen, K.; Kolandhasamy, P. Microplastic pollution in table salts from China. Environ Sci Technol. 2015, 49(22), 13622–7. [Google Scholar] [CrossRef]
- Ha, D.T. Microplastic contamination in commercial sea salt of Vietnam. Vietnam J Sci Technol. 2021, 59(3), 333–44. [Google Scholar]
- Makhdoumi, P.; Hossini, H.; Pirsaheb, M. Microplastic pollution in table salt and sugar: occurrence, qualification and quantification and risk assessment. J Food Compos Anal. 2023, 119, 105261. [Google Scholar] [CrossRef]
- Rochman, C.M.; Tahir, A.; Williams, S.L.; Baxa, D.V.; Lam, R.; Miller, J.T.; et al. Anthropogenic debris in seafood: plastic debris and fibers from textiles in fish and bivalves sold for human consumption. Sci Rep. 2015, 5(1), 1–10. [Google Scholar] [CrossRef] [PubMed]
- da Silva Batista, K.A.; Amado, E.M. Impactos da poluição marinha por microplásticos em anêmonas do mar: estado da arte e perspectivas futuras. In Editora Licuri; 2023; pp. 104–17. [Google Scholar] [CrossRef]
- Alves, V.E.N.; Figueiredo, G.M. Microplastic in the sediments of a highly eutrophic tropical estuary. Mar Pollut. Bull. 2019, 146, 326–35. [Google Scholar] [CrossRef] [PubMed]
- Lee, J.; Chae, K.J. A systematic protocol of microplastics analysis from their identification to quantification in water environment: A comprehensive review. J Hazard Mater. 2020. [Google Scholar] [CrossRef] [PubMed]
- Abourich, M.; Bellamy, A.; Ajji, A.; Claveau-Mallet, D. Washing machine filters to mitigate microplastics release: Citizen science study to estimate microfibers capture potential and assess their social acceptability. Environ Chall. 2024, 16, 100984. [Google Scholar] [CrossRef]
Figure 1.
Comparison between filtered and unfiltered saline solution samples using the Mann-Whitney test. Values are presented as median ± interquartile range and denote statistically significant difference between groups (p < 0.05).
Figure 1.
Comparison between filtered and unfiltered saline solution samples using the Mann-Whitney test. Values are presented as median ± interquartile range and denote statistically significant difference between groups (p < 0.05).

Figure 2.
Distribution of types of microplastics identified by μ-FTIR technique (n=41).

Disclaimer/Publisher’s Note: The statements, opinions and data contained in all publications are solely those of the individual author(s) and contributor(s) and not of MDPI and/or the editor(s). MDPI and/or the editor(s) disclaim responsibility for any injury to people or property resulting from any ideas, methods, instructions or products referred to in the content. |
© 2026 by the authors. Licensee MDPI, Basel, Switzerland. This article is an open access article distributed under the terms and conditions of the Creative Commons Attribution (CC BY) license (http://creativecommons.org/licenses/by/4.0/).
Copyright: This open access article is published under a Creative Commons CC BY 4.0 license, which permit the free download, distribution, and reuse, provided that the author and preprint are cited in any reuse.


