

Submitted:
21 April 2026
Posted:
23 April 2026
You are already at the latest version
Abstract
The growing deployment of green hydrogen technologies is increasing pressure on freshwater resources, motivating the exploration of alternative water sources that do not compete with human consumption. In this work, the direct use of untreated produced water from the Shushufindi 78 oil well (Ecuador) as an electrolyte for the hydrogen evolution reaction (HER) was experimentally evaluated. A comprehensive physicochemical characterization (ICP-OES, anions, BTEX), combined with electrochemical techniques (cyclic voltammetry, Tafel analysis, electrochemical impedance spectroscopy) and gas chromatography, was performed to correlate electrolyte composition with electrochemical performance. Despite the high salinity (~52 ± 5 g·kg⁻¹) and complex matrix composition, hydrogen production was achieved without pretreatment. Absolute hydrogen quantification yielded 10.29 µmol after 4 h of electrolysis, corresponding to a Faradaic efficiency of 43.8% and an electrical efficiency of 54.1% under non-optimized conditions. Comparative gas chromatography experiments using different electrolyte compositions revealed that alkaline systems, particularly mixtures of produced water with KOH, enhance hydrogen production, as evidenced by increased chromatographic peak areas. Impedance analysis showed reduced ohmic losses with KOH addition, while mineral scaling (CaCO₃ and Mg (OH)₂) increased interfacial resistance and reduced catalytic activity. These results demonstrate the feasibility of using produced water as an electrolyte for hydrogen production, highlighting the critical role of electrolyte composition within a circular economy framework.
Keywords:
hydrogen evolution reaction (HER)
; produced water from oil reservoirs
; electrolysis
; electrochemical impedance spectroscopy
; Faradaic efficiency
; circular economy
1. Introduction
The global transition toward decarbonized energy systems has positioned green hydrogen as a key energy vector for reducing emissions in hard-to-abate sectors. According to the International Renewable Energy Agency (IRENA), hydrogen and its derivatives could account for approximately 14% of final energy demand by 2050 [1,2]. However, large-scale hydrogen production via water electrolysis poses a significant challenge due to its high freshwater demand. It is estimated that by 2030, hydrogen production could require an additional 2.1 billion cubic meters of freshwater annually [3].
Given that only 2.5% of the Earth's water is freshwater, and that only a fraction is readily accessible for human use, water availability becomes a critical constraint for the sustainable deployment of electrolysis technologies.[4] Consequently, there is a growing need to explore alternative water sources that do not compete with drinking water or agricultural use.
Several strategies have been investigated to reduce freshwater dependency, including seawater desalination, wastewater reuse, and the utilization of industrial effluents [5]. However, desalination technologies such as reverse osmosis increase overall energy consumption and generate concentrated brines that require further treatment [6]. Similarly, treated wastewater is often prioritized for agricultural irrigation or aquifer recharge, limiting its availability for energy applications [2].
Recent studies have explored the use of wastewater streams as alternative electrolytes for hydrogen production, highlighting their potential to simultaneously address water treatment and energy generation challenges. Electrochemical approaches have demonstrated that wastewater electrolysis can reduce energy consumption by replacing the oxygen evolution reaction (OER) with the oxidation of organic or inorganic contaminants, thereby improving overall system efficiency. However, most of these studies are conducted under controlled conditions or using simplified synthetic matrices, limiting their applicability to real industrial effluents characterized by high salinity and complex chemical composition [7].
Furthermore, comprehensive reviews have emphasized that hydrogen production from wastewater is highly dependent on the physicochemical characteristics of the feedstock, including ionic strength, organic load, and the presence of multivalent ions. Despite these advances, a lack of experimental studies using untreated, highly complex matrices such as oilfield produced water remains a critical gap in the literature, particularly regarding interfacial electrochemical behavior and system efficiency under realistic conditions [8].
In this context, oilfield produced water represents a promising yet underexplored alternative. This industrial effluent, generated during hydrocarbon extraction, is characterized by high salinity and a complex chemical composition, including dissolved salts, organic compounds, trace metals, and radio nuclides [9,10]. Globally, approximately 250 million barrels of produced water are generated daily, a significant portion of which requires costly treatment or disposal. Its utilization in electrolysis processes could transform an environmental liability into a valuable energy resource, aligning with circular economic principles in the energy sector.
However, the direct use of produced water in electrolysis poses significant physicochemical and electrochemical challenges. High concentrations of chlorides, sulfides, multivalent ions, and organic compounds may induce parasitic reactions, promote the chlorine evolution reaction (CER) at the anode, and compromise the stability of membranes and electrodes [11]. In addition, the presence of Ca²⁺ and Mg²⁺ increases the risk of scaling through the formation of poorly soluble carbonates and hydroxides, thereby affecting charge-transfer resistance and reducing the electrochemically active area [12]. These interactions may ultimately lead to Faradaic efficiency losses and accelerated degradation of the electrochemical system [11]. Furthermore, variations in electrolyte composition can significantly affect hydrogen production rates, as evidenced by gas chromatography analyses, highlighting the importance of electrolyte optimization not only for efficiency but also for reaction kinetics and gas evolution behavior.
Recent MDPI-based studies have reinforced the strategic relevance of produced water as an alternative feedstock for hydrogen generation, particularly in regions where freshwater availability constrains electrolyzer deployment. Abdelhamid et al. reported that produced water can represent a viable resource for green hydrogen production; however, most sources exceed direct electrolyzer feed requirements and typically require treatment or conditioning prior to use. In this context, the present study distinguishes itself by experimentally evaluating untreated produced water under laboratory electrolysis conditions, providing new insights into interfacial limitations associated with the direct use of complex industrial effluents [9].
Despite the growing interest in non-conventional water sources, including seawater, industrial wastewater, and produced water, significant gaps remain in terms of experimental comparability and predictive modeling [13,14]. Water quality requirements, treatment approaches, and reported results remain difficult to compare due to the lack of standardized protocols and operating criteria. This limitation hinders data extrapolation and scalability, highlighting the need for integrated studies combining detailed characterization of real matrices with rigorous electrochemical analysis and predictive modeling [13,14].
Current electrolysis simulations often rely on simplified approaches in which electrolyte parameters are assumed to remain constant, limiting the ability of such models to capture the dynamic interactions among dissolved species, membranes, and electrodes. These interactions directly affect key electrochemical phenomena, such as charge-transfer resistance (Rct), ionic transport, and overall system efficiency, thus representing a major challenge for the prediction and optimization of electrolyzers under real operating conditions [13,14]. In this regard, the establishment of tolerance thresholds based on reproducible experimental data, through the combined use of voltammetry, electrochemical impedance spectroscopy (EIS), ion chromatography (IC), and gas chromatography (GC), emerges as a key approach for developing quantitative correlations between electrolyte composition and interfacial performance [15,16].
In parallel, recent advances in bioelectrochemical systems have demonstrated the potential of integrating modeling and optimization techniques, such as artificial intelligence and hybrid predictive frameworks, to enhance hydrogen production from wastewater. For instance, microbial electrolysis cells (MECs) have been successfully optimized using data-driven approaches to identify optimal operating conditions, including pH, temperature, and organic load. While these strategies provide valuable insights into process optimization, their applicability to conventional electrolysis systems remains limited due to fundamental differences in reaction mechanisms and electrolyte composition [17].
Within this framework, the present work addresses the experimental evaluation of the direct use of produced water from the Shushufindi 78 oil well (Ecuador) as an electrolyte for electrochemical hydrogen production [9,10]. Unlike most studies reported in the literature, which are based on synthetic matrices or partially conditioned waters, this work employs a real sample without any chemical pre-treatment. To this end, a detailed physicochemical characterization was integrated with electrochemical analysis, including cyclic voltammetry, Tafel slope determination, electrochemical impedance spectroscopy (EIS), and chromatographic quantification and comparative evaluation of hydrogen production under different electrolyte compositions[15]. Additionally, the effect of electrolyte alkalization through KOH addition was investigated to assess its influence on hydrogen production and electrochemical performance.
The main contribution of this study lies in establishing, for the first time, a direct experimental relationship between the ionic composition of untreated produced water, the interfacial impedance response, and the Faradaic efficiency of the electrochemical system. This approach enables the identification of the dominant limiting mechanisms governing hydrogen production, particularly those associated with ohmic losses and surface scaling phenomena [11,12].
In this context, the present work demonstrates the feasibility of direct hydrogen production using real produced water without any prior treatment, providing a realistic assessment of electrochemical performance under non-ideal conditions [9]. A systematic correlation is established between electrolyte composition and key electrochemical parameters, allowing for the quantification of both Faradaic and electrical efficiencies. Furthermore, electrochemical impedance spectroscopy (EIS) analysis reveals that mineral scaling, primarily associated with the formation of CaCO₃ and Mg (OH)₂, constitutes one of the principals limiting mechanisms affecting interfacial processes and system performance [12,15].
The study also includes a comparative evaluation of hydrogen production across different electrolyte compositions, supported by gas chromatography measurements, which provide quantitative insight into gas generation rates and compositional variations. Overall, these results contribute to the development of a robust baseline for the valorization of industrial effluents, particularly produced water, within circular economy frameworks aimed at sustainable energy production [2,6].
The remainder of this paper is organized as follows. Section 2 describes the sampling procedure and transport conditions. Section 3 presents the physicochemical characterization of the produced water. Section 4 focuses on the electrochemical analysis of the hydrogen evolution reaction (HER). Section 5 evaluates hydrogen production and efficiency metrics. Section 6 examines the dynamic electrochemical response using electrochemical impedance spectroscopy (EIS), including equivalent circuit modeling and the analysis of interfacial phenomena, followed by the main findings of the study.
2. Materials and Methods
The produced water used in this study was directly collected at the wellhead of the Shushufindi 78 oil well, located in the Sucumbíos province, Ecuador (0°16′ S, 76°38′ W). Sampling was performed using pre-conditioned amber glass bottles to prevent photochemical degradation following the protocols established in ISO 5667-3:2024 [18] for water sampling, storage, and handling. During transport to the laboratory, samples were maintained under a controlled cold chain (2–8 °C) to preserve their physicochemical integrity prior to analysis.
A detailed physicochemical characterization was conducted to assess the suitability of the produced water as an electrolyte for hydrogen production [10,11]. Key parameters, including pH, electrical conductivity, total dissolved solids (TDS), and ionic composition, were determined using standard analytical techniques while trace elements were analyzed by inductively coupled plasma optical emission spectroscopy and other species potentially involved in scaling and interfacial processes [12]. Mercury analysis was performed using cold vapor atomic absorption spectrometry (CVAAS) with a Flow Injection Mercury System (FIMS-400, PerkinElmer, Inc., Waltham, MA, USA). The analysis of BTEX compounds was carried out using a gas chromatograph (Clarus® 680, PerkinElmer, Inc., Waltham, MA, USA).
Electrochemical characterization was carried out using a potentiostat/galvanostat (model 750D, CH Instrument, Austin, TX, USA) in a conventional three-electrode configuration, consisting of a working electrode (WE), a reference electrode (Ag/AgCl, 3M KCl), and a platinum wire counter electrode (CE, Pt wire). The electrolyte solutions were tested under controlled laboratory conditions, and all potentials were reported with respect to the reference electrode used.
Electrochemical impedance spectroscopy (EIS) measurements were performed over a wide frequency range (10⁵–10⁻¹ Hz) using a small-amplitude sinusoidal perturbation (5–10 mV) applied around the open-circuit potential (OCP) or under steady-state polarization conditions. Complementary impedance spectra were also acquired at OCP without external DC polarization within a frequency window of 1 Hz to 82.5 kHz, ensuring operation within the linear response regime of the system. The resulting spectra were interpreted using equivalent circuit models to extract key parameters associated with solution resistance, charge-transfer kinetics, and interfacial phenomena[15,19].
Hydrogen and oxygen evolution were quantitatively analyzed using gas chromatography (GC-2030 Plus, Shimadzu, Japan) equipped with a thermal conductivity detector (TCD). Gas samples were collected during electrolysis and calibrated against certified gas standards to ensure accurate quantification. This approach enabled the determination of gas production rates and Faradaic efficiencies under varying electrolyte compositions.
The combined application of physicochemical characterization, electrochemical analysis, and gas chromatography ensures analytical traceability, experimental reproducibility, and comparability with previously reported studies in the literature [9,14,20]. Moreover, this combined approach enables the establishment of direct correlations between electrolyte composition, interfacial electrochemical behavior, and hydrogen production performance, thereby supporting a comprehensive evaluation of produced water as a viable electrolyte for hydrogen generation [11,15].
3. Results
3.1. General Physicochemical Properties
The initial physicochemical analysis included the determination of parameters such as pH, electrical conductivity, turbidity, total dissolved solids (TDS), sulfates, chlorides, nitrites, and chemical oxygen demand (COD). These results provide essential information on the salinity level, the presence of impurities, and the chemical nature of the electrolyte, which are critical factors influencing ionic transport, interfacial electrochemical behavior, and gas evolution processes during electrolysis [11,20].
The average values obtained, calculated from three replicated measurements, are presented in Table 1, together with the expanded uncertainty estimated at a 95% confidence level. This uncertainty was determined based on the standard deviation of the replicates and the corresponding Student’s t-factor for two degrees of freedom. These physicochemical properties provide the basis for interpreting the electrochemical performance of the system, including hydrogen and oxygen production behavior, as well as the efficiency of the electrolytic process.
The high conductivity and TDS values confirm the highly saline nature of the produced water, which significantly influences ionic transport, ohmic resistance, and overall electrochemical performance [10,11].The results further indicate that the produced water exhibits a pH of 6.92 ± 0.08, corresponding to a near-neutral to slightly acidic medium.
Under these conditions, the hydrogen evolution reaction (HER) is influenced not only by proton availability but also by water dissociation and the interaction of dissolved ionic species at the electrode interface. These factors affect the electrochemical mechanisms of adsorption and recombination, typically described by the Volmer–Tafel and Volmer–Heyrovsky pathways [21].
Figure 1.
Schematic representation of the hydrogen evolution reaction (HER): (1) Volmer step, (2) Tafel step, and (3) Heyrovsky step.
Figure 1.
Schematic representation of the hydrogen evolution reaction (HER): (1) Volmer step, (2) Tafel step, and (3) Heyrovsky step.
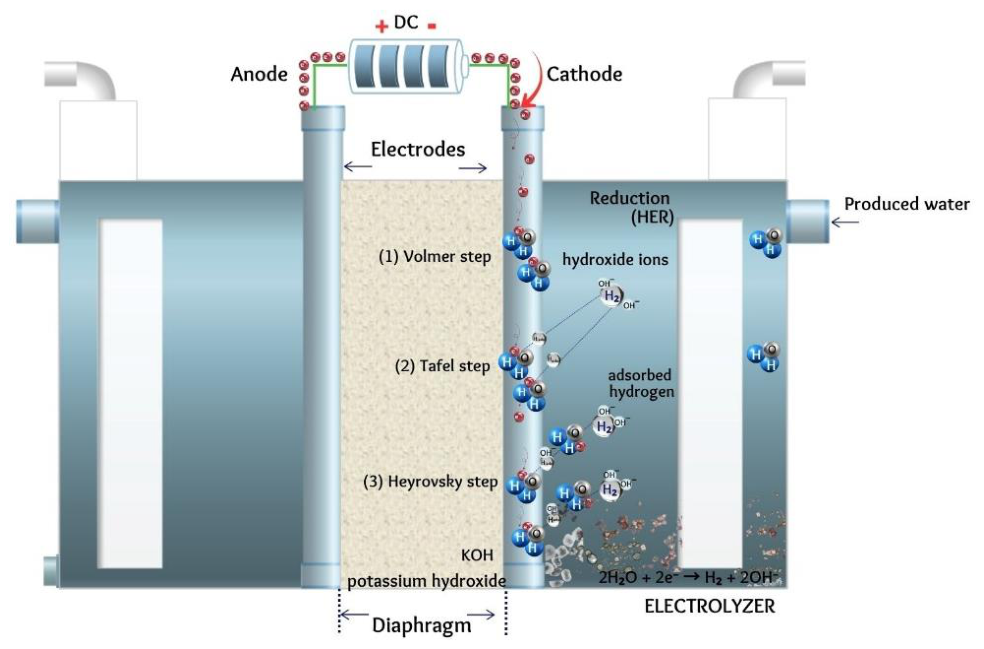
However, the matrix exhibits high salinity, as evidenced by an electrical conductivity of 104.400 ± 1,939 µS/cm and a high total dissolved solids (TDS) content (43.633 ± 2.735 g/L), resulting in a highly conductive yet chemically complex electrolyte. These conditions enhance ionic transport while simultaneously introducing competing interactions at the electrode–electrolyte interface, which may affect charge-transfer processes and overall electrochemical performance [10,11,20].
3.2. Ionic Composition and Salinity
The ionic composition of the produced water was determined using inductively coupled plasma optical emission spectrometry (ICP-OES), a widely used technique for multielemental analysis in complex aqueous matrices.
Given the high salinity of the matrix, its ionic strength plays a critical role in electrochemical behavior, particularly influencing ionic transport, interfacial reactions, and scaling phenomena. In particular, the presence of multivalent ions such as Ca²⁺ and Mg²⁺ is expected to promote the formation of low-solubility compounds (e.g., CaCO₃ and Mg (OH)₂), which can deposit on the electrode surface, reduce the electrochemically active area, and increase the charge transfer resistance (Rct) [11,12]. These effects are directly associated with the efficiency losses and interfacial limitations observed during electrolysis [11].

Table 2.
Presents the results obtained for the main cations identified in the sample.
| Element |
Wavelength (λ) (nm) |
Concentration (mg/L) |
Molarity (mol/L) |
| Calcium (Ca) | 317.933 | 1684.013 | 0.042 |
| Magnesium (Mg) | 285.213 | 304.453 | 0.0125 |
| Potassium (K) | 766.490 | 264.340 | 0.0068 |
The detected concentrations are consistent with the typical composition of produced water associated with oil reservoirs, commonly dominated by Na, Ca, Mg, and K. This chemical composition reflects diagenetic processes and water–rock interactions, including carbonate dissolution, evaporite influence, and cation exchange in clay minerals [10].
The high salinity and elevated content of divalent cations indicate a hard and highly mineralized electrolyte, conditions that strongly promote scaling phenomena [12] particularly under alkaline operation or in anion exchange membrane Electrolyzers (AEM). [20]In such systems, cathodic precipitation of Mg (OH)₂ and CaCO₃ is expected. During the hydrogen evolution reaction (HER), the local pH near the electrode surface increases (Figure 3), further enhancing precipitation processes. These deposits can accumulate on the electrode surface, leading to partial blockage of active sites, reduced electrochemically active area, and increased charge-transfer resistance (Rct), ultimately limiting hydrogen production and contributing to the observed efficiency losses [11].
These observations are consistent with previous studies on wastewater electrolysis, where the formation of precipitates and surface deposits has been identified as a key factor influencing electrochemical performance. In particular, the interaction between dissolved ions and electrode materials has been shown to significantly affect hydrogen production efficiency, gas purity, and long-term system stability. Comparative analyses of different electrode materials have demonstrated that precipitation phenomena, such as phosphate and hydroxide formation, can modify the electrode surface and introduce additional resistive layers, ultimately limiting charge-transfer processes.
However, unlike studies based on secondary effluents or controlled synthetic solutions, the present work evaluates a highly complex and saline matrix, where multiple ionic species simultaneously contribute to interfacial heterogeneity. This highlights the importance of considering real electrolyte compositions when assessing electrochemical performance, as simplified systems may underestimate the impact of scaling, adsorption, and fouling mechanisms [22].
Figure 2.
Schematic representation of cathodic precipitates: (a) Mg (OH)₂ and (b) CaCO₃.
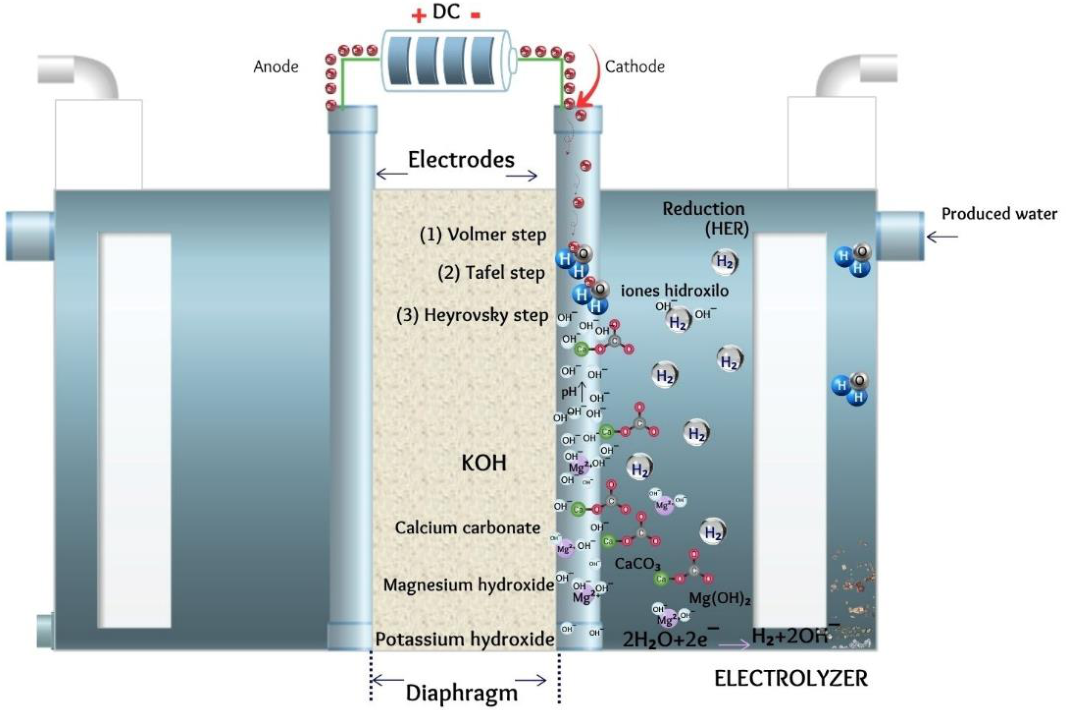
As a result, these deposits contribute to increased ohmic resistance (RΩ), higher charge transfer resistance (Rct), and a reduction in the electrochemically active surface area of the catalyst. [11,12,15] Consequently, the presence of calcium and magnesium plays a critical role in limiting electrochemical performance by promoting interfacial blockage and resistive layer formation, ultimately affecting hydrogen evolution kinetics and overall system efficiency.
Sodium (Na) was determined after a prior dilution (1:100), as its concentration in the original matrix exceeded the linear detection range of the instrument. The final concentration obtained was 18,081 mg/L, corresponding to approximately 0.78 mol/L of Na. The high concentration of Na contributes significantly to ionic conductivity, enhancing charge transport within the electrolyte, although it does not directly participate in the HER mechanism.
The presence of alkali cations plays a significant role in the kinetics of the hydrogen evolution reaction (HER), as they influence the interfacial water structure and the organization of the electrical double layer at the electrode electrolyte interface [23,24]. These effects can modify the adsorption energy of reaction intermediates and impact the overall reaction pathway.
Additionally, elements such as iron and manganese are present in concentrations commonly found in groundwater and produced water, particularly under reducing redox conditions that favor the solubility of Fe and Mn species [25]. These species may also contribute to surface fouling or secondary reactions under electrochemical conditions. Lithium is also of particular interest due to its potential strategic value, as well as its possible contribution to ionic conductivity and its relevance in critical mineral recovery processes. [26] . These parameters are summarized in Table 3.
Trace metal analysis performed using inductively coupled plasma optical emission spectrometry (ICP-OES) revealed the presence of additional elements at low concentrations, in some cases approaching or below the quantification threshold (<10 mg/L). The presence of these trace metals may contribute to secondary electrochemical reactions, surface fouling, and potential modifications of the electrode surface under operating conditions [11,25,27].
Furthermore, the identification of anions such as sulfates, chlorides, nitrates, and sulfide (see Table 4) confirms the compositional complexity of the produced water matrix and highlights the importance of defining ionic and metallic tolerance thresholds. These thresholds are essential for optimizing the durability, selectivity, and electrochemical performance of electrolyzers operating under real conditions with complex industrial electrolytes, particularly in relation to parasitic reactions and competing anodic processes [11,20].
The salinity of the sample was estimated based on the sum of the major ions analyzed and using the standard chlorinity relationship. The ionic sum yielded approximately 51.7 g·kg⁻¹, while the chlorinity-based estimation resulted in approximately 56.6 g·kg⁻¹.
Given the good agreement between both methods and the discrepancy observed with the gravimetric TDS value (43.6 g·kg⁻¹), a representative salinity of 52 ± 5 g·kg⁻¹ is proposed as a technical reference value. This parameter is particularly relevant, as salinity directly influences ionic strength, conductivity, and interfacial electrochemical processes, thereby affecting hydrogen evolution kinetics and overall system performance [11,13].
3.2.1. BTEX and Mercury Results
The presence of volatile aromatic compounds (BTEX: benzene, toluene, ethylbenzene, and xylenes) was confirmed by gas chromatography following standard method 6200B. Although the detected concentrations were low, these compounds may influence fouling processes on electrodes and membranes during electrolyzer operation.
These organic species may adsorb onto the electrode surface, modifying the local interfacial environment, blocking active sites, and altering catalytic activity. As a result, they may contribute to deviations in hydrogen evolution behavior and to the reduction of electrochemical efficiency under prolonged operation [11,27].
Table 5.
Volatile aromatic compounds (BTEX) detected in produced water.
|
BTEX compound |
Analytical method | Concentration (µg/L) | Method detection limit (MDL) |
| Toluene |
Standard Methods 6200B |
69.0 | 0.1–1 µg/L |
| Benzene | 40.3 | 0.1–1 µg/L | |
| m,p-Xylene | 17.4 | 0.2–1 µg/L |
The detected BTEX concentrations are above the method detection limits but remain relatively low, suggesting a limited yet potentially significant impact on electrode fouling and long-term system stability. Even at low concentrations, these compounds may contribute to surface adsorption phenomena, modifying interfacial properties and affecting electrochemical performance during prolonged operation [11,27].
3.2.2. Mercury (Hg)
Mercury analysis was performed using cold vapor atomic absorption spectrometry (CVAAS). The results indicate that no significant concentration of soluble mercury (Hg) was detected in the samples analyzed (<0.0002 mg/L). Therefore, mercury is not expected to play a relevant role in the electrochemical behavior of the system under the conditions studied.
3.3. Electrochemical Cell Configuration
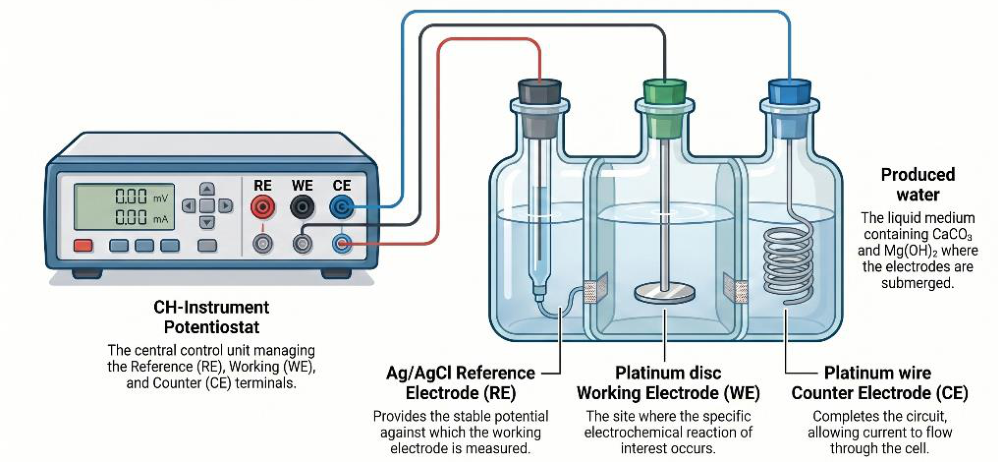
Electrochemical measurements were carried out using a CHI750D potentiostat in a conventional three-electrode configuration. The system consisted of a platinum (Pt) disk electrode with an area of 0.0314 cm² as the working electrode (WE), a platinum wire as the counter electrode (CE), and an Ag/AgCl electrode as the reference electrode (RE).
The experimental setup is illustrated in Figure 3 and was designed to ensure accurate control of the electrode potential and reliable measurement of current response, enabling the evaluation of HER and OER kinetics under realistic electrolyte conditions [21].
Figure 3.
Experimental configuration of the electrochemical cell for HER studies.
3.3.1. Cyclic Voltammetry (HER)
The electrochemical activity toward the hydrogen evolution reaction (HER) was evaluated by cyclic voltammetry (CV). [28,29]Experiments were conducted in two different media: (1) phosphate-buffered saline (PBS, pH 7.10, 0.1 mol·L⁻¹), shown as the black curve, and (2) produced water (real sample, pH 6.96), shown as the red curve (Figure 4). The same working, counter, and reference electrodes were used in both cases to ensure consistent experimental conditions.
The potential window and scan rate were kept constant for both electrolytes to ensure comparability. This approach allows a direct assessment of the influence of electrolyte composition on HER activity, particularly in terms of overpotential, current density, and interfacial electrochemical behavior [29].
3.3.2. Tafel Slope Analysis
The unusually high Tafel slope (244 mV·dec⁻¹) observed in this study can be attributed not only to intrinsic kinetic limitations but also to significant ohmic contributions associated with the complex electrolyte matrix. In particular, the formation of insulating inorganic deposits (CaCO₃ and Mg (OH)₂) on the electrode surface likely introduced additional uncompensated resistance (iR drop), thereby affecting the polarization response [11,12,21,30].
It is important to note that no full iR compensation was applied to the polarization curves, meaning that the reported Tafel slope reflects both kinetic and resistive contributions. [29,31]Therefore, the obtained value should be interpreted as an apparent Tafel slope under realistic operating conditions rather than as an intrinsic kinetic parameter. This behavior is consistent with the presence of interfacial limitations, including surface fouling, scaling, and mass transport effects, which collectively contribute to deviations from ideal HER kinetics [11,21,26] (see Figure 5).
3.4 Hydrogen Quantification by Gas Chromatography
Hydrogen production was quantified using gas chromatography (GC) equipped with a thermal conductivity detector (GC–TCD), which provides a response proportional to the gas concentration in the effluent stream [32,33].
Electrolysis was conducted for 4 hours under steady-state conditions in a sealed electrochemical cell with a headspace volume of 3.5 mL (3500 µL). The accumulated hydrogen was quantified using a calibration curve obtained from certified standard gases.
The total amount of hydrogen produced in the cell was estimated as 10.29 µmol through volumetric extrapolation, according to the following relationship [34]; Table 6.
where:
- (µmol) is the amount of hydrogen determined by gas chromatography corresponding to the injected gas volume using the GC sampling loop,
- (µL) is the volume of gaseous sample introduced into the chromatograph,
- (µL) is the total gas volume available in the electrochemical cell, where hydrogen accumulates during electrolysis.
The experimental hydrogen production corresponds to the total amount of hydrogen generated in the electrochemical cell, estimated from the volumetric extrapolation of the chromatographically quantified hydrogen.
3.6. Faradaic Efficiency
The Faradaic efficiency was calculated based on the experimentally quantified amount of hydrogen obtained by gas chromatography and the theoretical amount estimated using Faraday’s law:
Considering a total transferred charge of C, the theoretical amount of hydrogen produced was 23.5 µmol, while the experimentally obtained amount was 10.29 µmol, resulting in a Faradaic efficiency of 43.8%.
The observed Faradaic efficiency is lower than that typically reported for Pt-based electrocatalysts operating under controlled conditions (90–100%) [2,36]. This difference can be largely attributed to the complex nature of the produced water matrix used as the electrolyte, which contains both organic compounds (BTEX, light hydrocarbons) and inorganic species (metal ions, chlorides, sulfates) [10,11,20]. These species can induce competitive adsorption on the electrode surface, block active sites, and promote the formation of surface deposits during electrolysis [11,26].
During electrolysis, the formation of deposits on the platinum electrode surface was observed (Figure 6), likely associated with precipitates such as calcium carbonate (CaCO₃), magnesium hydroxide (Mg (OH)₂), and metal oxides or hydroxides generated under operating conditions [12,27]. These deposits act as a partial barrier, reducing the number of available active sites for HER and increasing the charge-transfer resistance (Rct), which ultimately contributes to the observed decrease in process efficiency [11].
3.7. Electrical Efficiency
The electrical efficiency of the electrolysis processes was defined as the ratio between the chemical energy stored in the produced hydrogen and the electrical energy supplied to the system during 4 hours of electrolysis.
Using an average operating potential of V vs Ag/AgCl and a total charge of C, the electrical energy supplied was 6.79 J. Considering that the chemical energy associated with the produced hydrogen was 2.94 J, an electrical efficiency of 54.1% was obtained using Equation (15):
3.8. Impedance Analysis and Interfacial Modeling
3.8.1. Data Acquisition and Treatment (EIS)
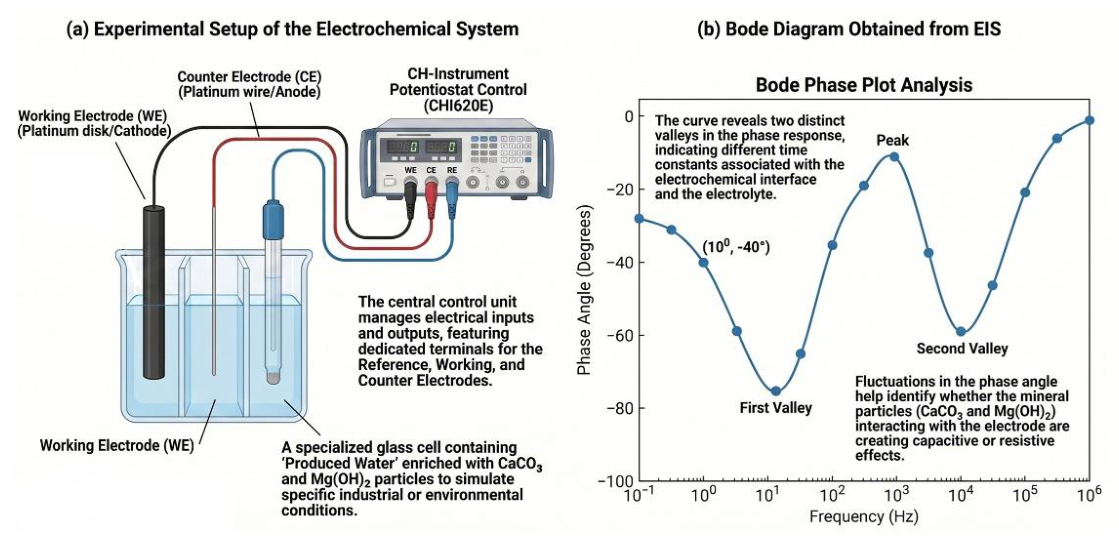
Electrochemical impedance spectroscopy (EIS) was employed to analyze the dynamic response of the electrochemical system and to discriminate the contributions associated with solution ohmic resistance , interfacial charge transfer resistance , non-ideal capacitive behavior of the double layer (constant phase element, CPE), and mass transport phenomena at low frequencies [15,19,37].
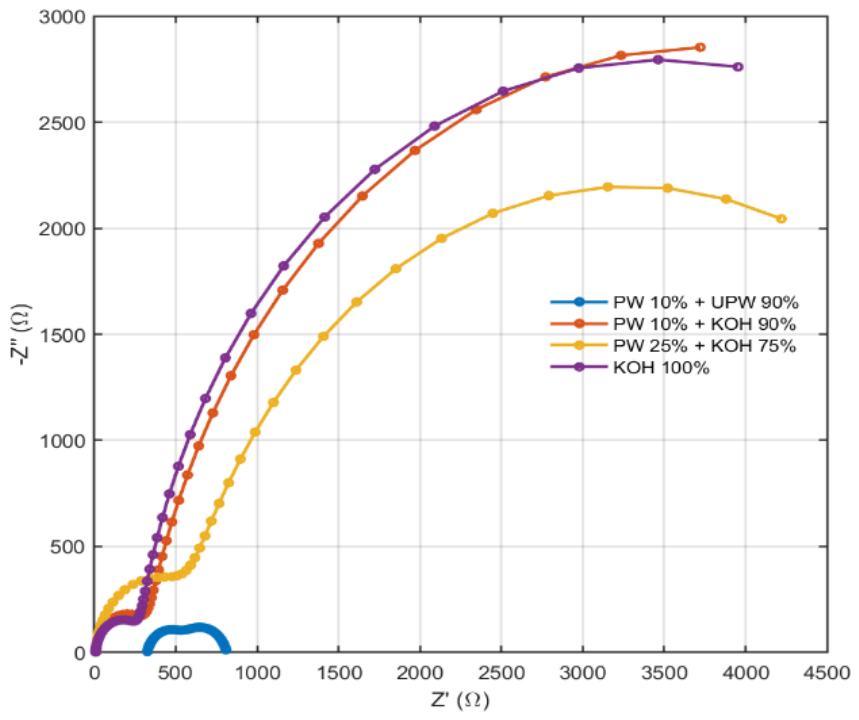
Experimental data were analyzed using Nyquist and Bode plots, allowing the estimation of key electrical parameters such as , , and CPE. The comparison between different electrolytes—100% KOH, 10% produced water + 90% ultrapure water, 10% produced water + 90% KOH, and 25% produced water + 75% KOH (all compositions expressed as % v/v)—allowed a systematic assessment of the impact of electrolyte composition on ohmic resistance, charge-transfer kinetics, and mass transport phenomena governing electrochemical hydrogen production [11,13].
In the comparative plots, both experimental data (raw) and equivalent circuit fitting (fit) are presented, following best practices to validate model robustness and identify potential deviations associated with non-ideal processes [15,19].
The use of real produced water introduces additional complexity due to scaling and fouling effects, which are reflected in the impedance response, particularly through increased values and deviations from ideal capacitive behavior [11,12,27].
Figure 7.
Experimental setup of the electrochemical system (a) and Bode diagram obtained from electrochemical impedance spectroscopy (EIS) (b).
Figure 7.
Experimental setup of the electrochemical system (a) and Bode diagram obtained from electrochemical impedance spectroscopy (EIS) (b).
3.9. Comparative Response in Nyquist Plot
Nyquist plot represents a powerful tool for distinguishing the contributions of solution resistance, charge-transfer processes, and diffusion-related phenomena in complex electrochemical systems [15,19]. In this study, the comparison of four electrolyte systems revealed clear differences in terms of ohmic losses, charge-transfer kinetics, and diffusion-related contributions associated with mass transport and bubble dynamics [35,38].
In the high-frequency region, the system composed of 10% produced water (PW) + 90% ultrapure water (UPW) exhibits a significantly higher ohmic resistance compared to systems containing KOH, indicating limited ionic conductivity in the absence of an alkaline supporting electrolyte. This behavior confirms that dilution of produced water in ultrapure water leads to a predominantly resistive system, with substantial energy losses associated with ohmic drop [11,13]. In contrast, the 100% KOH system and PW + KOH mixtures display low and comparable values, demonstrating that alkalization effectively compensates for the limited conductivity of the untreated matrix and restores favorable conditions for electrolysis.
In the low-frequency region, KOH-containing systems exhibit a depressed semicircle, characteristic of active charge transfer processes and non-ideal capacitive behavior, which can be adequately described by an equivalent circuit of the type [19,37]. The similarity between 100% KOH and 10% PW + 90% KOH suggests that moderate incorporation of produced water does not significantly deteriorate interfacial kinetics under alkaline conditions. Meanwhile, the 25% PW + 75% KOH system shows a slight increase in impedance in this region, consistent with enhanced interfacial heterogeneity and a broader distribution of time constants.
From a physicochemical perspective, this behavior can be attributed to the presence of Ca, Mg, Fe, S, and Mn in the produced water. Under alkaline conditions, these species may promote the local formation of Ca (OH)₂, Mg (OH)₂, Fe (OH)₃, Mn (OH)₂, and CaCO₃, altering the electrode surface morphology and increasing the capacitive dispersion reflected in the CPE. [11,12,27]Although these effects modify the electrode–electrolyte interface, no severe kinetic blockage of the HER/OER is observed in the alkalized systems, particularly in the 10% PW + 90% KOH mixture.
At low frequencies, both the 100% KOH and PW + KOH systems exhibit a continuous increase in impedance without complete semicircle closure, a behavior typically associated with gas-evolving systems dominated by mass transport limitations, product accumulation, and bubble formation–detachment dynamics [35,38]. The 25% PW + 75% KOH system displays a more extended response compared to the 10% PW + 90% KOH system, suggesting a stronger influence of the complex composition of produced water on diffusion processes and interfacial stability. This difference may be related to higher concentrations of multivalent species, changes in surface wettability, and the incipient formation of inorganic deposits.
Overall, the Nyquist analysis demonstrates that alkalization of produced water significantly reduces ohmic losses while preserving acceptable interfacial kinetics for electrolysis. However, increasing the fraction of produced water enhances interfacial heterogeneity and alters mass transport processes without critically compromising the overall electrochemical performance of the system [11,13,20].
Figure 8.
Comparative Nyquist plots of the electrochemical system for different electrolyte compositions obtained by electrochemical impedance spectroscopy (EIS).
Figure 8.
Comparative Nyquist plots of the electrochemical system for different electrolyte compositions obtained by electrochemical impedance spectroscopy (EIS).
3.10. Bode Analysis and Interfacial Interpretation
The Bode representation enables a comprehensive evaluation of the dominant electrochemical processes across different frequency domains [15,19]. Figure 9 presents the impedance response in terms of (a) magnitude and (b) phase angle for the analyzed electrolyte systems.
In Figure 9a, the Bode magnitude plots show that, in the high-frequency region, all KOH-containing systems converge toward low impedance modulus values (|Z| ≈ 10 Ω), whereas the PW 10% + UPW 90% system maintains significantly higher values. This behavior indicates that the ohmic resistance of the electrolyte is predominantly controlled by the presence of KOH, which acts as a strong supporting electrolyte, rather than by the intrinsic ionic content of the produced water [11,13].
In the mid-frequency region, the responses of the KOH 100% and PW 10% + KOH 90% systems nearly overlap, suggesting similar charge-transfer kinetics and electrochemical properties. In contrast, the PW 25% + KOH 75% system exhibits a noticeable shift toward higher impedance values, indicating an increase in charge-transfer resistance (Rct) and enhanced interfacial heterogeneity. This behavior is attributed to the presence of multivalent ions and trace metallic species in the produced water, which may promote the formation of poorly soluble surface compounds such as hydroxides or carbonates, thereby modifying the electrode–electrolyte interface [11,12,27].
In the low-frequency region, all alkaline systems display a marked decrease in impedance and tend to converge, indicating that once sufficient ionic conductivity is achieved, the system is no longer limited by ohmic resistance. Instead, the electrochemical response becomes dominated by mass transport phenomena, including diffusion and gas evolution processes.[35,38] The slight deviation observed for the PW 25% + KOH 75% system suggests a stronger influence of matrix effects on diffusion and interfacial processes.
Conversely, the PW 10% + UPW 90% system exhibits a relatively flat impedance response over the entire frequency range, which is characteristic of a predominantly resistive system due to the absence of a supporting electrolyte.
The phase angle response, shown in Figure 9b, further supports these observations. The KOH based systems exhibit well-defined phase minima, indicating the presence of multiple time constants associated with charge-transfer processes and diffusion limitations [19,37] . The PW 25% + KOH 75% system presents a broader and slightly shifted minimum, reflecting increased interfacial heterogeneity and a wider distribution of relaxation times.
In contrast, the PW 10% + UPW 90% system shows phase values close to 0°, consistent with a predominantly resistive behavior with minimal capacitive contribution. At low frequencies, the phase response of alkaline systems is characteristic of gas-evolving electrodes, where bubble dynamics significantly influence mass transport, confirming that diffusion-related processes become the dominant limiting factor under the studied conditions [35,38].
3.11. Interfacial Interpretation and Matrix Effects
The impedance results confirm that the chemical composition of the produced water directly influences the electrochemical performance of the electrolyte [11,13,20].
Alkalization through KOH addition significantly reduces ohmic losses and promotes efficient transfer processes as widely reported for alkaline electrolysis systems.[14,39] However, increasing the fraction of produced water introduces matrix effects associated with multivalent ions, trace metals, and potential surface precipitation phenomena [10,12,25].
This behavior agrees with previous studies on alkaline electrolysis of low-quality water, where the addition of supporting electrolytes has been shown to enhance ionic conductivity and reduce ohmic resistance. Nevertheless, these improvements do not necessarily translate into enhanced reaction kinetics, as interfacial phenomena such as adsorption, surface blockage, and precipitation remain dominant limiting factors. In this context, the present results demonstrate that although alkalization mitigates resistive losses, it does not fully overcome the intrinsic limitations imposed by the complex composition of produced water [40].
These factors contribute to increased interfacial heterogeneity and affect both charge-transfer kinetics and transport phenomena. They may alter electrode wettability, surface morphology, bubble nucleation, growth, and detachment dynamics [27,35,38].
Despite these effects, the results indicate that moderate incorporation of produced water (PW 10% + KOH 90%) does not significantly compromise the overall electrochemical performance under alkaline conditions [9,20].However, higher fractions (PW 25% + KOH 75%) introduce measurable deviations, highlighting the critical role of electrolyte composition in optimizing system efficiency [11,13].
3.12. Equivalent Circuit Modeling
The electrochemical impedance spectra were analyzed using equivalent circuit modeling, which provides a quantitative and physically meaningful representation of the processes occurring at the electrode–electrolyte interface [15,19,29]. These circuits are constructed through combinations of ideal and non-ideal electrical elements, including resistances (R), capacitors (C), constant phase elements (CPE), and, when necessary, diffusion related components [37,41]. This approach enables an accurate reproduction of the experimentally measured impedance response.
Figure 10 presents the equivalent circuit model used to describe the electrochemical behavior of all evaluated electrolyte systems. Despite the differences observed in both Nyquist and Bode representations, all systems were consistently fitted using a single electrical configuration composed of a solution resistance (Rs) in series with two parallel R–CPE elements [15,19].
This finding indicates that the fundamental electrochemical processes governing the electrode–electrolyte interface remain unchanged across the different electrolyte compositions. However, significant variations in the fitted parameters were observed, particularly in the solution resistance (Rs) and the charge-transfer resistance (Rct), reflecting the strong influence of electrolyte composition on ionic conductivity and interfacial kinetics [11,13,39].
The solution resistance (Rs) is associated with ionic transport in the bulk electrolyte and is strongly dependent on electrolyte composition [13,29]. As expected, systems containing KOH exhibits significantly lower Rs values, confirming the enhanced ionic conductivity provided by the alkaline medium. [6,39]In contrast, the PW 10% + UPW 90% system shows a substantially higher Rs, indicating limited charge carrier availability and dominant ohmic losses.
The first R–CPE branch is attributed to the charge-transfer process coupled with the non-ideal double-layer capacitance at the electrode surface. The corresponding resistance (Rct) reflects the kinetics of the hydrogen evolution reaction (HER), while the associated CPE accounts for deviations from ideal capacitive behavior due to surface heterogeneity and interfacial complexity [21,37,42]. Notably, KOH-containing systems exhibit significantly higher Rct values, suggesting that although ionic transport is enhanced, the electrochemical reaction kinetics remain partially hindered, likely due to adsorption phenomena and surface interactions with species present in the electrolyte [11,26].
The second R–CPE branch represents slower interfacial processes, including adsorption/desorption phenomena, surface heterogeneity, and the formation of intermediate layers or deposits [11,27]. These effects become more pronounced in systems containing produced water, due to the presence of dissolved salts, multivalent ions, and trace contaminants. The increase in R3 values, particularly in the PW 25% + KOH 75% system, suggests stronger interactions between dissolved species and the electrode surface, leading to more complex interfacial dynamics.
The use of constant phase elements instead of ideal capacitors is justified by the non-ideal capacitive behavior of the electrode–electrolyte interface, as evidenced by the broad phase angle minima and dispersion observed in the Bode phase plots [19,37]. Such deviations from ideality are typically associated with surface roughness, chemical heterogeneity, non-uniform current distribution, and the presence of adsorbed species or surface precipitates. The CPE exponent values (n < 1) further confirm the existence of a distributed system with multiple relaxation times.
Although no explicit Warburg element was required to achieve an adequate fit, diffusion-related effects are implicitly captured by the second CPE. This suggests a distributed mass transport mechanism rather than an ideal semi-infinite diffusion regime. This interpretation is consistent with the low frequency Bode response, where mass transport phenomena particularly gas evolution and bubble formation, growth, and detachment play a significant role in the overall impedance behavior [35,38].
It is important to note that the terminals of the equivalent circuit correspond to the measurement nodes of the electrochemical cell. In practice, these terminals are defined between the working electrode (WE) and the reference electrode (RE). In a conventional three-electrode configuration, the potential is controlled with respect to the reference electrode, while the current flows between the working electrode and the counter electrode (CE) [29]. The small-amplitude sinusoidal perturbation is externally applied by the potentiostat around the open-circuit potential (OCP); therefore, the excitation source is not explicitly included in the equivalent circuit, which represents only the intrinsic linear response of the electrode–electrolyte interface [15,19].
The quantitative fitting parameters obtained from equivalent circuit modeling are summarized in Table 7. The results clearly demonstrate that electrolyte composition strongly influences both the resistive and capacitive elements of the system [15,19]. The PW 10% + UPW 90% system exhibits a significantly higher solution resistance (Rs = 324.8 Ω), reflecting its low ionic conductivity and the limited availability of charge carriers [13,29]. This is accompanied by moderate interfacial resistances (R2 and R3), indicating a system dominated by ohmic limitations.
In contrast, the incorporation of potassium hydroxide (KOH) leads to a substantial decrease in solution resistance (Rs ≈ 9–10 Ω), confirming the critical role of alkaline media in enhancing ionic transport [14,39]. However, this improvement in conductivity is accompanied by a notable increase in charge-transfer resistance (R2), reaching values above 6000 Ω in all KOH-containing systems. This behavior suggests that, although ionic conduction is facilitated, the electrochemical reaction kinetics at the electrode surface remain a limiting factor [21,26].
Additionally, the presence of a second resistive branch (R3) coupled with a second constant phase element (CPE2) indicates the existence of multiple interfacial processes, including adsorption phenomena, surface heterogeneity, and mass transport limitations [11,27]. The PW 25% + 75% KOH system exhibits the highest R3 value, suggesting stronger interactions between dissolved species and the electrode surface, leading to more complex interfacial dynamics.
The constant phase element exponents (n-values ranging from 0.821 to 0.989) further confirm the non-ideal capacitive behavior of the system. Values lower than unity indicate a distribution of relaxation times, typically associated with electrode surface roughness, non-uniform current distribution, and specific adsorption [19,37]. This effect is more pronounced in produced-water-based electrolytes, highlighting the influence of their complex chemical composition.
Finally, the low χ2 values (10⁻4-10⁻3) obtained from the fitting procedure confirm the good agreement between the experimental data and the proposed equivalent circuit model, validating its suitability for describing the electrochemical behavior of these systems [15,19].
Overall, the combined use of electrochemical impedance spectroscopy and equivalent circuit modeling provides a robust framework for analyzing ionic transport, charge-transfer processes, and interfacial phenomena in electrolysis systems employing complex aqueous matrices [15,19]. These findings offer valuable insights into the limitations and optimization strategies for hydrogen production using produced water as an alternative electrolyte, particularly in terms of balancing ionic conductivity and interfacial kinetics [9,11,20].
3.12. Comparative Hydrogen and Oxygen Production under Different Electrolyte Compositions
To further investigate the influence of electrolyte composition on gas evolution behavior, comparative gas chromatography (GC–TCD) experiments were conducted using four different electrolyte systems: (i) PW 10% + UPW 90%, (ii) 100% KOH, (iii) PW 10% + KOH 90%, and (iv) PW 25% + KOH 75%.
Hydrogen (H₂) and oxygen (O₂) were identified based on their characteristic retention times (tr ≈ 0.873 min for H₂ and tr ≈ 1.175 min for O₂), and their production was quantified through chromatographic peak areas. Absolute hydrogen quantification was performed using a previously validated GC–TCD calibration, while oxygen values are presented as semi-quantitative estimates derived from stoichiometric normalization and comparative peak analysis.[32,33] (Figure 11).
Electrolysis experiments were carried out for 120 min, with gas sampling performed every 30 min from the cathodic and anodic compartments, corresponding to headspace volumes of 55 mL and 64 mL, respectively.
The results (Table 6) show a clear dependence on gas production on electrolyte composition. The PW 10% + UPW 90% system exhibited the lowest hydrogen production, reaching 255.26 µmol at 120 min, reflecting its limited ionic conductivity and high ohmic resistance. [11,13]In contrast, alkaline systems showed a significant enhancement in hydrogen evolution. Pure KOH reached 3359.97 µmol, while the PW 10% + KOH 90% system exhibited the highest hydrogen production, achieving 4046.56 µmol after 120 min. The PW 25% + KOH 75% system also demonstrated high performance, reaching 3784.02 µmol, although with slightly increased dispersion in gas evolution behavior.
A similar trend was observed for oxygen production at the anode. The PW 10% + UPW 90% system presented the lowest O2 signal, whereas KOH-containing systems exhibited substantially higher responses. These results confirm that alkalization not only enhances hydrogen evolution at the cathode but also promotes the oxygen evolution reaction (OER), improving overall electrolysis performance [9,20,39], (see Figure 12).
From a physicochemical perspective, these results are consistent with the electrochemical impedance spectroscopy (EIS) analysis, which demonstrated that the addition of KOH significantly reduces solution resistance (Rₛ) and enhances ionic transport [15,19]. However, the presence of produced water introduces matrix effects associated with multivalent ions (Ca²⁺, Mg²⁺, S2-, and others) and organic compounds, which may lead to surface fouling, interfacial heterogeneity, and partial blockage of active sites [11,12,20]. These phenomena are reflected in the dispersion of chromatographic signals and contribute to the deviation from ideal Faradaic efficiency observed in Section 3.5.
Overall, the chromatographic analysis provides direct experimental evidence that electrolyte composition plays a critical role in determining hydrogen production rates and gas evolution behavior. Moderate incorporation of produced water into alkaline electrolytes preserves high hydrogen production while introducing manageable interfacial effects, highlighting its potential for practical electrolysis applications using real industrial effluents [9].
4. Discussion
The results obtained in this study provide a comprehensive and mechanistic understanding of the electrochemical behavior of untreated produced water as an electrolyte for hydrogen production, integrating physicochemical characterization, electrochemical kinetics, impedance spectroscopy, equivalent circuit modeling, and gas chromatography.
4.1. Physicochemical Constraints and Electrolyte Matrix Effects
From a physicochemical standpoint, the produced water exhibits high salinity (~52 ± 5 g·L⁻¹), which governs electrochemical performance through competing mechanisms. The high concentration of monovalent ions (Na⁺, Cl⁻) enhances ionic conductivity and reduces solution resistance, facilitating charge transport [13,29]. However, the presence of multivalent cations such as Ca²⁺ and Mg²⁺ promotes scaling via precipitation reactions (CaCO₃ and Mg(OH)₂), which reduce the electrochemically active surface area and increase interfacial resistance [11,12],
Sulfide species introduce an additional complexity. Under alkaline conditions, speciation shifts toward HS⁻ and S²⁻, limiting volatilization but promoting adsorption on metallic surfaces. These species can act as catalytic poisons, blocking active sites and altering the electronic structure of the electrode [11,20]. Thus, sulfide contributes simultaneously to electrolyte stability and interfacial inhibition.
Electrochemical results confirm significant deviations from ideal HER behavior. The high apparent Tafel slope (~244 mV·dec⁻¹) indicates a kinetically hindered regime influenced by ohmic losses, surface blockage, and mass transport limitations rather than intrinsic catalytic activity (Shinagawa). This suggests that the HER mechanism is strongly controlled by interfacial and transport phenomena in complex electrolytes.
Electrochemical impedance spectroscopy (EIS) quantitatively supports these observations. The system is well described by an Rs–(R₂||CPE₁)–(R₃||CPE₂) equivalent circuit, indicating two dominant time constants associated with fast charge-transfer and slower interfacial processes [15,19]. The solution resistance decreases markedly with KOH addition, reflecting enhanced ionic conductivity. However, this is accompanied by a significant increase in charge-transfer resistance, indicating persistent kinetic limitations at the interface.
This behavior reveals a key insight: improving ionic conductivity does not necessarily enhance electrochemical kinetics, as the system transitions from an ohmic-controlled regime to one dominated by interfacial processes [11,13].
The non-ideal capacitive response, evidenced by CPE exponents (0.821–0.989), indicates distributed relaxation times associated with surface heterogeneity, roughness, and adsorption phenomena [19,37]. Lower exponent values in produced-water systems confirm increased interfacial disorder due to impurities.
The absence of a distinct Warburg element suggests that mass transport does not follow ideal semi-infinite diffusion, but rather a distributed mechanism dominated by gas evolution dynamics.
Chromatographic analysis provides direct validation of these electrochemical findings. In the absence of KOH, hydrogen production is limited due to high resistance and poor ionic transport. Alkalization significantly enhances hydrogen generation, correlating with reduced Rs. However, Faradaic efficiency remains below ideal values, confirming that interfacial losses and kinetic limitations persist [9,11,20].
These results demonstrate that hydrogen production is governed by multi-scale coupling between ionic transport, interfacial kinetics, surface chemistry, and gas evolution. No single parameter controls system performance: instead, holistic interpretation is required.
Low-frequency impedance behavior highlights the role of bubble dynamics. Nucleation, growth, coalescence, and detachment reduce active surface area and disrupt local mass transport, contributing to interfacial heterogeneity [35,36].
From a technological perspective, the direct use of produced water is feasible but constrained by its complex composition. Alkalization improves conductivity but simultaneously enhances interfacial limitations due to scaling, adsorption, and fouling. Compared to studies using synthetic electrolytes, these results provide a more realistic representation of industrial electrolysis conditions [9,10].
Future work should focus on mitigating these limitations through selective pretreatment, development of fouling-resistant electrodes, and optimization of hydrodynamic conditions to improve bubble removal. Additionally, integrating predictive modeling with experimental validation will be essential for scaling electrolysis systems using non-conventional water sources.
Overall, hydrogen production from untreated produced water is governed by the interplay between ionic transport, interfacial kinetics, chemical speciation, and gas evolution dynamics. While alkalization enhances conductivity, impurities such as sulfide species and multivalent ions introduce interfacial constraints that limit overall efficiency. The combined use of EIS, equivalent circuit modeling, and gas chromatography provides a robust framework for identifying these limitations and guiding the design of optimized electrolysis systems.
5. Conclusions
Compared to existing literature, most studies on hydrogen production from wastewater rely on pretreated, diluted, or synthetic solutions to minimize matrix effects and improve system performance. In contrast, the present study demonstrates the feasibility of direct electrolysis using untreated produced water, providing a more realistic assessment of electrochemical behavior under industrially relevant conditions.
While previous works have primarily focused on optimizing electrode materials or operating conditions, this study advances the field by establishing a direct relationship between electrolyte composition, impedance response, and hydrogen production performance. This integrated approach enables a deeper understanding of the physicochemical and electrochemical limitations governing hydrogen evolution in complex aqueous systems.
In summary, this study demonstrates the technical feasibility of hydrogen production using untreated produced water under realistic operating conditions, achieving moderate efficiencies despite the complexity of the electrolyte matrix.
These factors contribute to increased interfacial heterogeneity and affect both charge-transfer kinetics and mass transport processes. They may alter electrode wettability, surface morphology, and bubble nucleation detachment dynamics [27,35,38].
Despite these effects, the results indicate that moderate incorporation of produced water (PW 10% + KOH 90%) does not significantly compromise the overall electrochemical performance under alkaline conditions [9,20]. However, higher fractions (PW 25% + KOH 75%) introduce measurable deviations, highlighting the importance of electrolyte composition in optimizing system efficiency [11,13].
Future work should focus on mitigating matrix effects through the development of anti-scaling and fouling-resistant electrode materials, optimization of electrolyte composition, and evaluation of long-term stability under continuous operation. In addition, the integration of experimental results with predictive modeling will be essential for scaling electrolysis systems based on non-conventional water sources.
Overall, this work provides a robust experimental framework for the valorization of industrial effluents in hydrogen production, contributing to the advancement of circular economy strategies in the energy sector.
Supplementary Materials
The following supporting information can be downloaded at: the website of this paper posted on Preprints.org, including additional chromatographic curves, electrochemical data, and complementary analysis of electrolyte composition.
Author Contributions
Conceptualization, E.C.-Q., P.G.-T., L.M.F.-R. and R.A.; methodology, E.C.-Q.; software, E.C.-Q., P.G.-T. and J.I.; validation, E.C.-Q., P.G.-T. and M.J.A.; formal analysis, E.C.-Q.; investigation, E.C.-Q. and G.R.; resources, E.C.-Q. and R.A.; data curation, E.C.-Q.; writing—original draft, E.C.-Q. and P.G.-T.; writing—review and editing, E.C.-Q., P.G.-T., L.M.F.-R. and R.A.; visualization, E.C.-Q., J.I., M.J.A., G.R. and R.A.; supervision, P.G.-T., L.M.F.-R. and R.A.; project administration, P.G.-T. and L.M.F.-R.; funding acquisition, R.A. All authors have read and agreed to the published version of the manuscript.
Funding
This research received partial support from SERTECPET for the initial physicochemical characterization stage, including financial assistance and the provision of produced water samples from the oil well used in this study.
Institutional Review Board Statement
Not applicable.
Informed Consent Statement
Not applicable.
Data Availability Statement
The data supporting the findings of this study are available within the article and its supplementary materials. Additional raw chromatographic and electrochemical data are available from the corresponding author
Acknowledgments
The authors acknowledge the support provided by the Research Group in Sustainable and Renewable Electrical Technologies (PAIDI-TEP023) and the collaborating institutions involved in this study, including the Pontificia Universidad Católica de Chile, the Universidad Andrés Bello (Chile), and the Millennium Institute on Green Ammonia (MIGA). This research was funded by ANID FONDECYT REGULAR N° 1220107, and ANID/Millennium Science Initiative Program/ICN2021_023
Conflicts of Interest
The authors declare no conflicts of interest.
Abbreviations
| HER | Hydrogen Evolution Reaction |
| OER | Oxygen Evolution Reaction |
| EIS | Electrochemical Impedance Spectroscopy |
| GC-TCD | Gas Chromatography–Thermal Conductivity Detector |
| PW | Produced Water |
| KOH | Potassium Hydroxide |
| UPW | Ultrapure Water |
| CPE | Constant Phase Element |
| OCP | Open Circuit Potential |
References
- Renewable Energy Agency I, Trade Organization Agency W. International trade and green hydrogen: Supporting the global transition to a low-carbon economy. 2023.
- Amini Horri B, Ozcan H. Green hydrogen production by water electrolysis: Current status and challenges. Curr Opin Green Sustain Chem 2024;47. [CrossRef]
- Kumar P, Date A, Mahmood N, Das RK, Shabani B. Freshwater supply for hydrogen production: An underestimated challenge. Int J Hydrogen Energy 2024;78:202–17. [CrossRef]
- Jones ER, Bierkens MFP, van Vliet MTH. Current and future global water scarcity intensifies when accounting for surface water quality. Nat Clim Chang 2024;14:629–35. [CrossRef]
- Shannon MA, Bohn PW, Elimelech M, Georgiadis JG, Marĩas BJ, Mayes AM. Science and technology for water purification in the coming decades. Nature 2008 452:7185 2008;452:301–10. [CrossRef]
- Mika Ł, Sztekler K, Bujok T, Boruta P, Radomska E. Seawater Treatment Technologies for Hydrogen Production by Electrolysis—A Review. Energies 2024, Vol 17, 2024;17. [CrossRef]
- Badea GE, Hora C, Maior I, Cojocaru A, Secui C, Filip SM, et al. Sustainable Hydrogen Production from Seawater Electrolysis: Through Fundamental Electrochemical Principles to the Most Recent Development. Energies (Basel) 2022;15. [CrossRef]
- Núñez R, Merayo N, Hermosilla D, Gascó A, Dos santos-García AJ, Caravaca Á. Electrochemical treatment of industrial wastewater for hydrogen production. Curr Opin Electrochem 2024;46. [CrossRef]
- Araya SS, Abdelhamid C, Latrach A, Rabiei M, Venugopal K. Produced Water Use for Hydrogen Production: Feasibility Assessment in Wyoming, USA. Energies 2025 2025. [CrossRef]
- Igunnu ET, Chen GZ. Produced water treatment technologies. International Journal of Low-Carbon Technologies 2011:157–77. [CrossRef]
- Becker H, Murawski J, Shinde D V, Stephens IEL, Hinds G, Smith G. Impact of impurities on water electrolysis: a review 2023. [CrossRef]
- Yang Q, Xu L, He Q, Wu D. Reduced cathodic scale and enhanced electrochemical precipitation of Ca 2+ and Mg 2+ by a novel fenced cathode structure: Formation of strong alkaline microenvironment and favorable crystallization. Water Res 2022;209:117893. [CrossRef]
- Majumdar A, Haas M, Elliot I, Nazari S. Control and control-oriented modeling of PEM water electrolyzers: A review. Int J Hydrogen Energy 2023;48:30621–41. [CrossRef]
- Vedrtnam A, Kalauni K, Pahwa R. Water Electrolysis Technologies and Their Modeling Approaches: A Comprehensive Review. Eng 2025;6. [CrossRef]
- Lazanas AC, Prodromidis MI. Electrochemical Impedance Spectroscopy─A Tutorial. ACS Measurement Science Au 2023;3:162–93. [CrossRef]
- Becker H, Murawski J, Shinde D V., Stephens IEL, Hinds G, Smith G. Impact of impurities on water electrolysis: a review. Sustain Energy Fuels 2023;7:1565–603. [CrossRef]
- Fathy A, Rezk H, Yousri D, Alharbi AG, Alshammari S, Hassan YB. Maximizing Bio-Hydrogen Production from an Innovative Microbial Electrolysis Cell Using Artificial Intelligence. Sustainability 2023, Vol 15, 2023;15. [CrossRef]
- ISO 5667-3:2024 - Water quality — Sampling — Part 3: Preservation and handling of water samples n.d. https://www.iso.org/es/contents/data/standard/08/22/82273.html?utm_source=chatgpt.com (accessed March 3, 2026).
- Andrzej Lasia. Electrochemical Impedance Spectroscopy and its Applications. New York: 2014. [CrossRef]
- Lindquist GA, Xu Q, Oener SZ, Boettcher SW. Membrane Electrolyzers for Impure-Water Splitting. Joule 2020;4:2549–61. [CrossRef]
- Shinagawa T, Garcia-Esparza AT, Takanabe K. Insight on Tafel slopes from a microkinetic analysis of aqueous electrocatalysis for energy conversion OPEN 2015:23955–6900. [CrossRef]
- Antonini G, Ordonez-Loza J, Mathew J, Cullen J, Muller C, Al-Omari A, et al. Electrode Materials Comparison for Hydrogen Production from Wastewater Electrolysis of Spiked Secondary Effluent. Sustainability (Switzerland) 2025;17. [CrossRef]
- Wang G, Chen A, Chen Y, Qiao F, Wang J, Yang N, et al. Advancements in electrochemical synthesis: Expanding from water electrolysis to dual-value-added products. EScience 2025;5. [CrossRef]
- Wang S, Wan C, Shah AH, Huang Y, Duan X. Electrical Double Layer Effects on Alkaline Hydrogen Reactions on Platinum. Precision Chemistry 2025;2025:611. [CrossRef]
- George E. Groschen, Terri L. Arnold, William S. Morrow, Kelly L. Warner. Scientific Investigations Report 2009-5006 National Water-Quality Assessment Program Occurrence and Distribution of Iron, Manganese, and Selected Trace Elements in Ground Water in the Glacial Aquifer System of the Northern United States. Scientific Investigations Report 2009–5006 2009.
- Lu X, Tu W, Zhou Y, Zou Z. Effects of Electrolyte Ionic Species on Electrocatalytic Reactions: Advances, Challenges, and Perspectives. Adv Energy Mater 2023;13. [CrossRef]
- Peyvandi K, Haghtalab A, Omidkhah MR. Using an electrochemical technique to study the effective variables on morphology and deposition of CaCO 3 and BaSO 4 at the metal surface 2012. [CrossRef]
- Yamada H, Yoshii K, Asahi M, Chiku M, Kitazumi Y. The 66th special feature “Novel Aspects and Approaches to Experimental Methods for Electrochemistry” Cyclic Voltammetry Part 1: Fundamentals †. Comprehensive Paper Electrochemistry 2022;90:102005. [CrossRef]
- Bard AJ., Faulkner LR. Electrochemical methods : fundamentals and applications. John Wiley & Sons, Inc.; 2001.
- van der Heijden O, Park S, Vos RE, Eggebeen JJJ, Koper MTM. Tafel Slope Plot as a Tool to Analyze Electrocatalytic Reactions. ACS Energy Lett 2024;9:1871–9. [CrossRef]
- Guidelli R, Compton RG, Feliu JM, Gileadi E, Lipkowski J, Schmickler W, et al. Definition of the transfer coefficient in electrochemistry (IUPAC Recommendations 2014). Pure and Applied Chemistry, vol. 86, Walter de Gruyter GmbH; 2014, p. 259–62. [CrossRef]
- Toonen A. Hydrogen Detection with a TCD using Mixed Carrier Gas on the Agilent Micro GC Author n.d.
- Poole CF. GAS CHROMATOGRAPHY. n.d.
- Harrison KW, Remick R, Martin GD, Hoskin A. Hydrogen Production: Fundamentals and Cas Study Summaries e Preprint. 2010.
- Hodges A, Hoang AL, Tsekouras G, Wagner K, Lee CY, Swiegers GF, et al. A high-performance capillary-fed electrolysis cell promises more cost-competitive renewable hydrogen. Nature Communications 2022 13:1 2022;13:1304-. [CrossRef]
- Zou X, Zhang Y. Noble metal-free hydrogen evolution catalysts for water splitting. Chem Soc Rev 2015;44:5148–80. [CrossRef]
- Cördoba-Torres P, Mesquita TJ, Nogueira RP. Relationship between the origin of constant-phase element behavior in electrochemical impedance spectroscopy and electrode surface structure. Journal of Physical Chemistry C 2015;119:4136–47. [CrossRef]
- Zhang Y;, Li Z;, Yu E;, Ye H;, Guo X;, Zhou D;, et al. Citation: A Review of Hydrogen Production via Seawater A Review of Hydrogen Production via Seawater Electrolysis: Current Status and Challenges 2024. [CrossRef]
- Carmo M, Fritz DL, Mergel J, Stolten D. A comprehensive review on PEM water electrolysis. Int J Hydrogen Energy 2013;38:4901–34. [CrossRef]
- Chauhan D, Ahn YH. Alkaline electrolysis of wastewater and low-quality water. J Clean Prod 2023;397:136613. [CrossRef]
- Magar HS, A Hassan RY, Mulchandani A. Electrochemical Impedance Spectroscopy (EIS): Principles, Construction, and Biosensing Applications 2021. [CrossRef]
- Ledezma-Yanez I, Wallace WDZ, Sebastián-Pascual P, Climent V, Feliu JM, Koper MTM. Interfacial water reorganization as a pH-dependent descriptor of the hydrogen evolution rate on platinum electrodes n.d. [CrossRef]
Figure 4.
Cyclic voltammetry profile on a Pt electrode toward the hydrogen evolution reaction (HER).
Figure 4.
Cyclic voltammetry profile on a Pt electrode toward the hydrogen evolution reaction (HER).
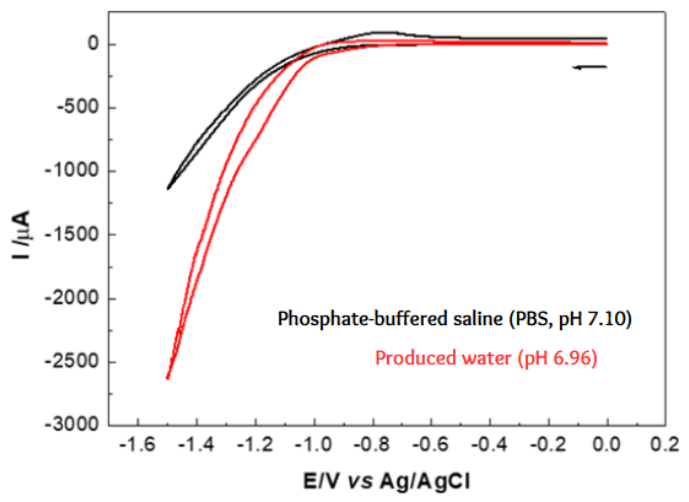
Figure 5.
Cyclic voltammetry profile on a Pt electrode toward the hydrogen evolution reaction (HER).
Figure 5.
Cyclic voltammetry profile on a Pt electrode toward the hydrogen evolution reaction (HER).
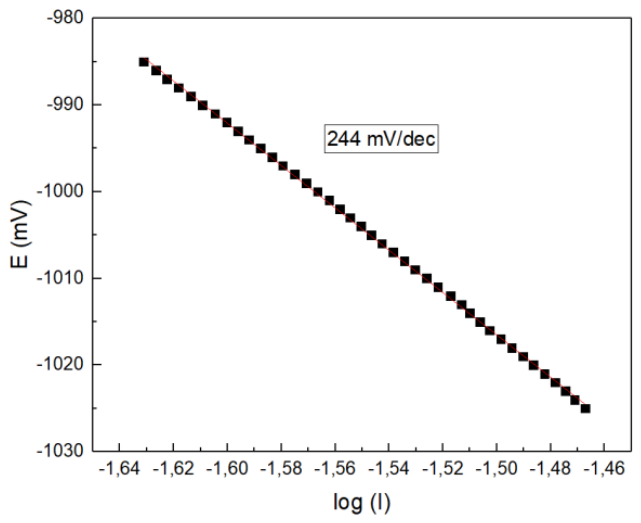
Figure 6.
Deposit formation on the surface of the platinum electrode during electrolysis.
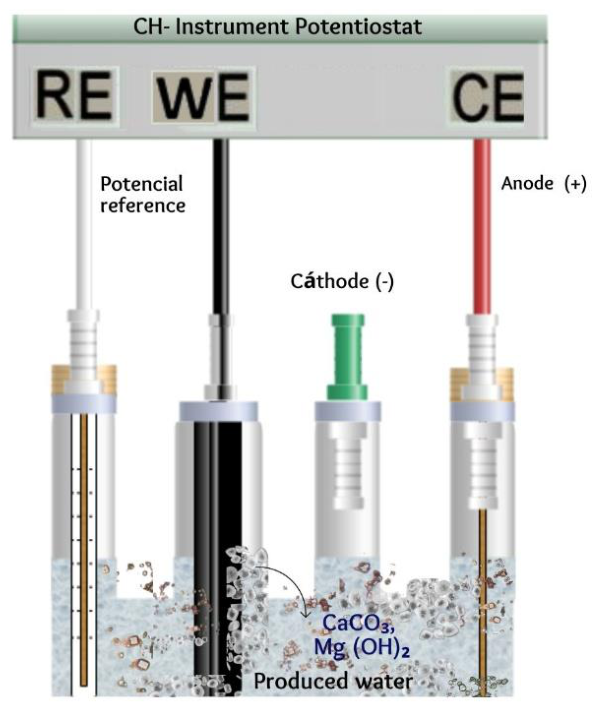
Figure 9.
Bode plots obtained by electrochemical impedance spectroscopy (EIS) for different electrolyte compositions: (a) impedance magnitude (|Z|), and (b) phase angle (θ) as a function of frequency.
Figure 9.
Bode plots obtained by electrochemical impedance spectroscopy (EIS) for different electrolyte compositions: (a) impedance magnitude (|Z|), and (b) phase angle (θ) as a function of frequency.
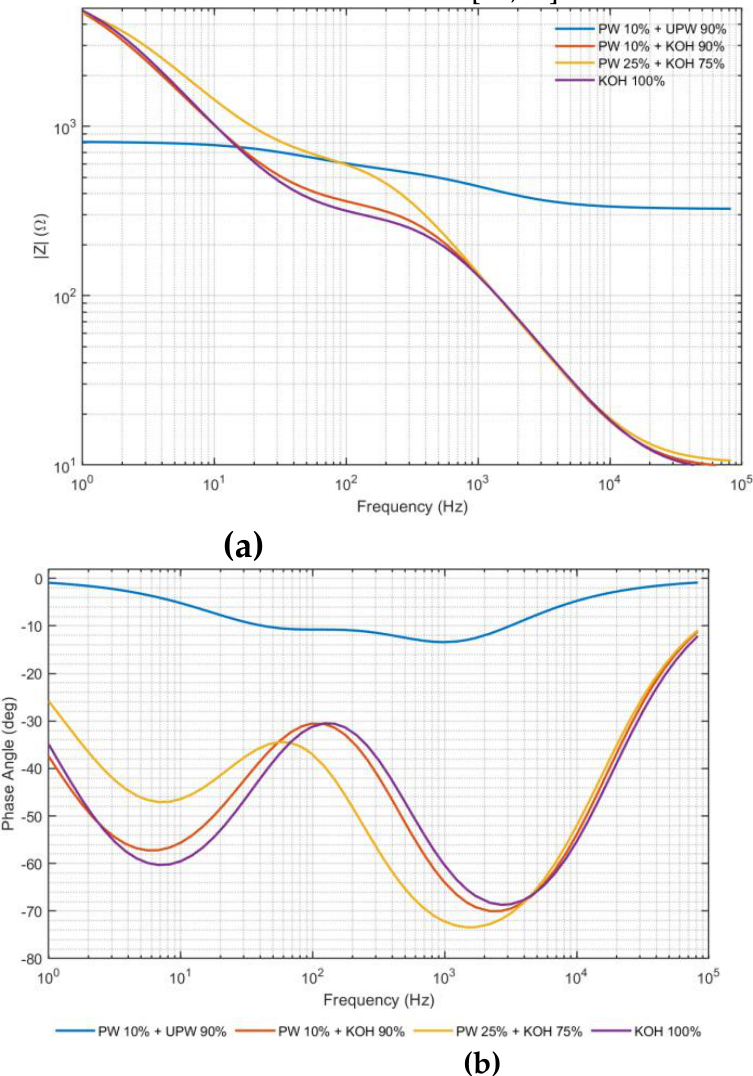
Figure 10.
Equivalent electrical circuit model used to fit the EIS response of the different electrolyte systems.
Figure 10.
Equivalent electrical circuit model used to fit the EIS response of the different electrolyte systems.
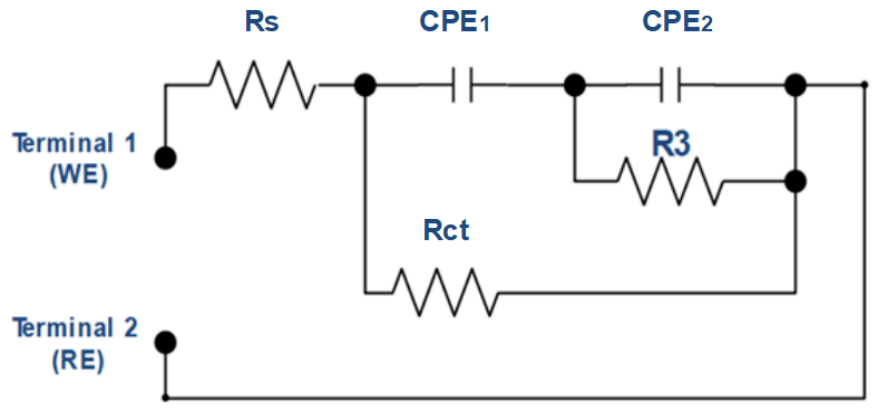
Figure 11.
Equivalent electrical circuits of the different electrolytes.
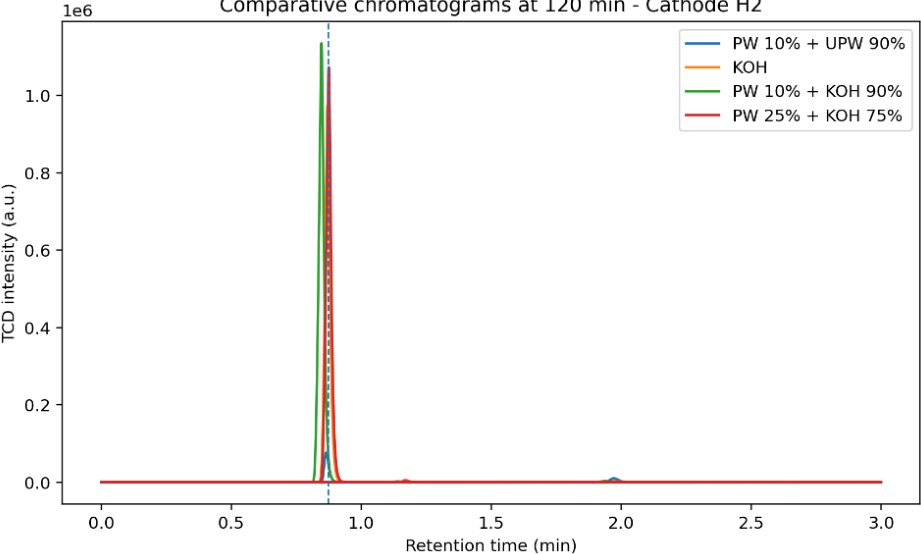
Figure 12.
Equivalent electrical circuits of the different electrolytes.
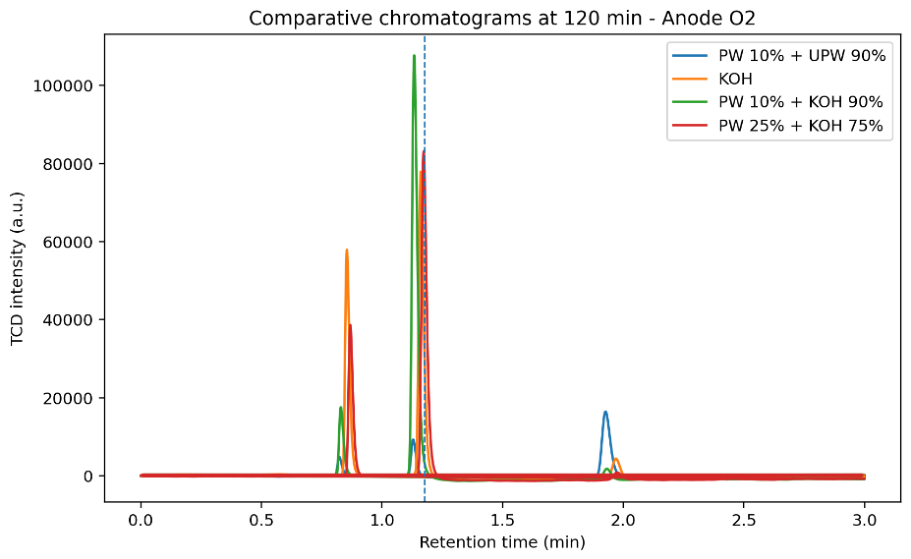
Table 1.
Physicochemical Parameters of Produced Water.
|
Physicochemical Parameter |
Method | Average Value |
Uncertainty (±) |
Unit |
| pH | Electrometric method | 6.92 | 0.08 | (dimensionless) |
| Electrical conductivity | Electrical conductivity and resistivity of water | 104.400 | 1.939 | µS/cm |
| Turbidity | Nephelometric method | 100.17 | 4.360 | NTU |
| Total Dissolved Solids (TDS) | Gravimetric method by evaporation | 43.6 | 2.73 | g/L |
| Chemical Oxygen Demand (COD) | Dichromate oxidation in acidic medium with digestion | 1.642 | 3.790 | mg O₂/L |
| Measurement temperature | Thermometric method | 19.03 | 0.2867 | °C |
Table 3.
Trace metal detected in produced water (Fe, Li, Mn).
| Element | Unit | Wavelength (λ) (nm) | Concentration (mg/L) |
| Iron (Fe) | (mg/L) | 238.204 | 1.576 |
| Lithium (Li) | (mg/L) | 670.784 | 3.891 |
| Manganese (Mn) | (mg/L) | 257.610 | 0.275 |
Table 4.
Anion analysis in produced water (SO₄²⁻, Cl⁻, NO₃⁻).
| Detected ions | Method | Wavelength (λ) (nm) | Average value | Uncertainty (±) | Unit |
| Sulfates (SO₄²⁻) | Precipitation with barium chloride crystals using LED source with optical filter | 466 | 63.00 | 4.966 | mg/L |
| Chloride (Cl⁻) | Volumetric titration with mercuric nitrate | ---- | 31,333 | 1,433 | mg/L |
| Nitrates (NO₃⁻) | Colorimetry using chromotropic acid reagent | 420 | 14.50 | 2.15 | mg/L |
| Sulfide (S2-) | Ion-selective electrode | ---- | 32.10 | 3.04 | mg/L |
Table 6.
Chromatographic quantification of hydrogen production during electrolysis.
| Tiempo de electrólisis (h) | Área cromatográfica (xi) (a. u) | mol) |
|---|---|---|
| 1 | 23608 | 0.139 |
| 2 | 45133 | 0.144 |
| 3 | 57515 | 0.146 |
| 4 | 60492 | 0.147 |
| ∑ | 186748 | 0.576 |
Table 7.
Equivalent circuit fitting parameters obtained from EIS analysis.
| Electrolyte | (Rs) | (Rct) | (R3) | CPE1-T | CPE1-n | CPE2-T | CPE2-n | χ² |
| (Ω) | (Ω) | (Ω) | (F·s^ (n-1)) | (F·s^ (n-1)) | ||||
| PW 10% + UPW 90% | 324.8 | 488.1 | 293.6 | 1.29×10⁻⁵ | 0.821 | 3.68×10⁻⁶ | 0.855 | 9.64×10⁻⁴ |
| PW 10% + KOH 90% | 9.545 | 7195 | 304.8 | 2.68×10⁻⁵ | 0.879 | 1.44×10⁻⁶ | 0.989 | 5.96×10⁻⁴ |
| PW 25% + KOH 75% | 10.24 | 6066 | 548.4 | 2.06×10⁻⁵ | 0.851 | 1.63×10⁻⁶ | 0.989 | 8.56×10⁻⁴ |
| KOH | 9.058 | 6693 | 264.7 | 2.28×10⁻⁵ | 0.91 | 1.51×10⁻⁶ | 0.978 | 2.62×10⁻⁴ |
Disclaimer/Publisher’s Note: The statements, opinions and data contained in all publications are solely those of the individual author(s) and contributor(s) and not of MDPI and/or the editor(s). MDPI and/or the editor(s) disclaim responsibility for any injury to people or property resulting from any ideas, methods, instructions or products referred to in the content. |
© 2026 by the authors. Licensee MDPI, Basel, Switzerland. This article is an open access article distributed under the terms and conditions of the Creative Commons Attribution (CC BY) license.
Copyright: This open access article is published under a Creative Commons CC BY 4.0 license, which permit the free download, distribution, and reuse, provided that the author and preprint are cited in any reuse.