Submitted:
21 April 2026
Posted:
22 April 2026
You are already at the latest version
Abstract
Background: Circadian desynchronization is increasingly recognized as a transdiagnostic driver of metabolic, neurodegenerative, immune, and oncological pathology. Melatonin, acting primarily through the G-protein-coupled receptors MT1 (MTNR1A) and MT2 (MTNR1B), is the principal endocrine output of the circadian system and exerts pleiotropic oncostatic, antioxidant, and immunomodulatory effects. Whether disrupted melatonin rhythmicity co-segregates with gut dysbiosis, impaired glymphatic clearance, and multi-system biomarker pathology in a clinically identifiable population has not been systematically examined.
Aim: To characterize the integrated microbiome–glymphatic–melatonin (MGM) axis in a clinically phenotyped cohort of patients with chronic multisystem symptoms consistent with circadian dysregulation, and to determine whether the resultant biomarker phenotype is age-independent.
Methods: We conducted a prospective observational study in 179 patients meeting pre-specified inclusion criteria for circadian dysregulation and 107 practically healthy controls. Circadian melatonin status was assessed using fractionated 24-hour urinary 6-sulfatoxymelatonin (aMT6s) and plasma melatonin at standardized dim-light time windows (daytime 14:00–16:00; nocturnal 02:00–04:00). Microbiome composition was determined by 16S rRNA (V3–V4) sequencing. Urolithin A was quantified by targeted metabolomics. Brain glymphatic function was approximated using the DTI-ALPS index, perivascular spaces scoring, and WMH volumetry. Systemic markers included BNP, CD4/CD8 ratio, and MoCA score.
Results: Patients demonstrated a profound collapse of nocturnal melatonin output (aMT6s 10.2 vs 40.6 ng/mL night; Day/Night ratio 0.81 vs 0.14; p< 0.0001 all), constituting a circadian amplitude inversion pattern. Cortisol rhythmicity showed parallel disruption. Microbiome diversity was markedly reduced (Shannon 2.83 vs 5.07), with depletion of urolithin-producing taxa (Gordonibacter, Ellagibacter) and profoundly reduced plasma urolithin A (2.40 vs 25.20 ng/mL). Brain imaging showed elevated WMH volume (9.99 vs 1.54 mL), enlarged perivascular spaces, and reduced DTI-ALPS index (1.05 vs 1.70). Strikingly, MGM-axis biomarkers showed no significant correlation with chronological age within the patient group (Spearman r: −0.10 to +0.09, all p>0.14), indicating age-independent convergence.
Conclusions: Circadian desynchronization is associated with a coherent, age-independent MGM-axis phenotype encompassing melatonin amplitude collapse, gut dysbiosis with urolithin A depletion, and imaging markers of impaired brain clearance. This integrated framework identifies tractable multi-domain biomarkers for circadian screening and motivates targeted resynchronization strategies including MT1/MT2-mediated chronotherapy.
Keywords:
melatonin
; circadian desynchronization
; microbiome
; glymphatic system
; 6-sulfatoxymelatonin
; urolithin A
1. Introduction
The mammalian circadian system coordinates physiology across multiple temporal scales through central pacemaker activity in the suprachiasmatic nucleus (SCN) and peripheral oscillators driven by transcription–translation feedback loops involving CLOCK, BMAL1, PER, and CRY proteins [1,2,3]. Modern environments frequently impose circadian challenges—shift work, nocturnal light exposure, irregular sleep–wake timing—that are linked epidemiologically to cardiometabolic disease, neurodegeneration, and cancer risk [4,5,6,7].
Melatonin (N-acetyl-5-methoxytryptamine) is the principal endocrine output of the circadian system. Synthesized primarily in the pineal gland under darkness via the tryptophan–serotonin pathway (TPH→AADC→SNAT→HIOMT), melatonin exerts its chronobiotic effects predominantly through two high-affinity G-protein-coupled receptors: MT1 (MTNR1A, Gi-coupled, expressed in SCN, pituitary, retina, and peripheral tissues) and MT2 (MTNR1B, Gi/Gq-coupled, expressed in retina, SCN, and vasculature). MT1 activation mediates the primary sleep-promoting and phase-shifting effects, while MT2 is critical for phase-advance capacity and vascular tone regulation [8,9]. Beyond receptor-mediated effects, melatonin acts on additional intracellular targets including nuclear receptors RORα and RZRβ, calmodulin, quinone reductase-2, cytochrome c, and the NLRP3 inflammasome, conferring broad antioxidant, anti-inflammatory, mitochondrial-protective, and oncostatic activity [10,11,12]. A substantial fraction of total body melatonin is synthesized in enterochromaffin cells of the gastrointestinal tract, linking circadian signaling directly to the gut ecosystem [13].
In parallel, the glymphatic system provides brain-wide clearance of interstitial waste via AQP4-dependent perivascular routes [14,15,16]. Glymphatic transport is strongly sleep- and circadian-dependent; melatonin specifically facilitates glymphatic function by promoting slow-wave sleep and directly modulating AQP4 channel polarization [17,18]. Impaired glymphatic clearance is increasingly recognized as a convergent pathophysiological mechanism in neurodegeneration, with white matter hyperintensity (WMH) accumulation and enlarged perivascular spaces serving as tractable neuroimaging surrogates [19,20]. The DTI-ALPS index—derived from diffusion tensor imaging along perivascular spaces—provides a non-invasive proxy for perivascular fluid transport and has demonstrated clinical validity in aging and neurodegeneration [21].
The gut microbiome oscillates diurnally [22], and its composition is sensitive to circadian disruption. Notably, urolithin A—a microbial metabolite of dietary ellagitannins produced specifically by Gordonibacter urolithinfaciens and Ellagibacter isourolithinifaciens—induces mitophagy, enhances mitochondrial biogenesis, and modulates neuroinflammation [23,24]. Because urolithin production depends on taxonomically restricted bacterial producers, circadian-associated dysbiosis could plausibly impair urolithin generation, creating a mechanistic bridge between disrupted rhythmicity and mitochondrial vulnerability. This pathway has not been evaluated in the context of melatonin amplitude collapse.
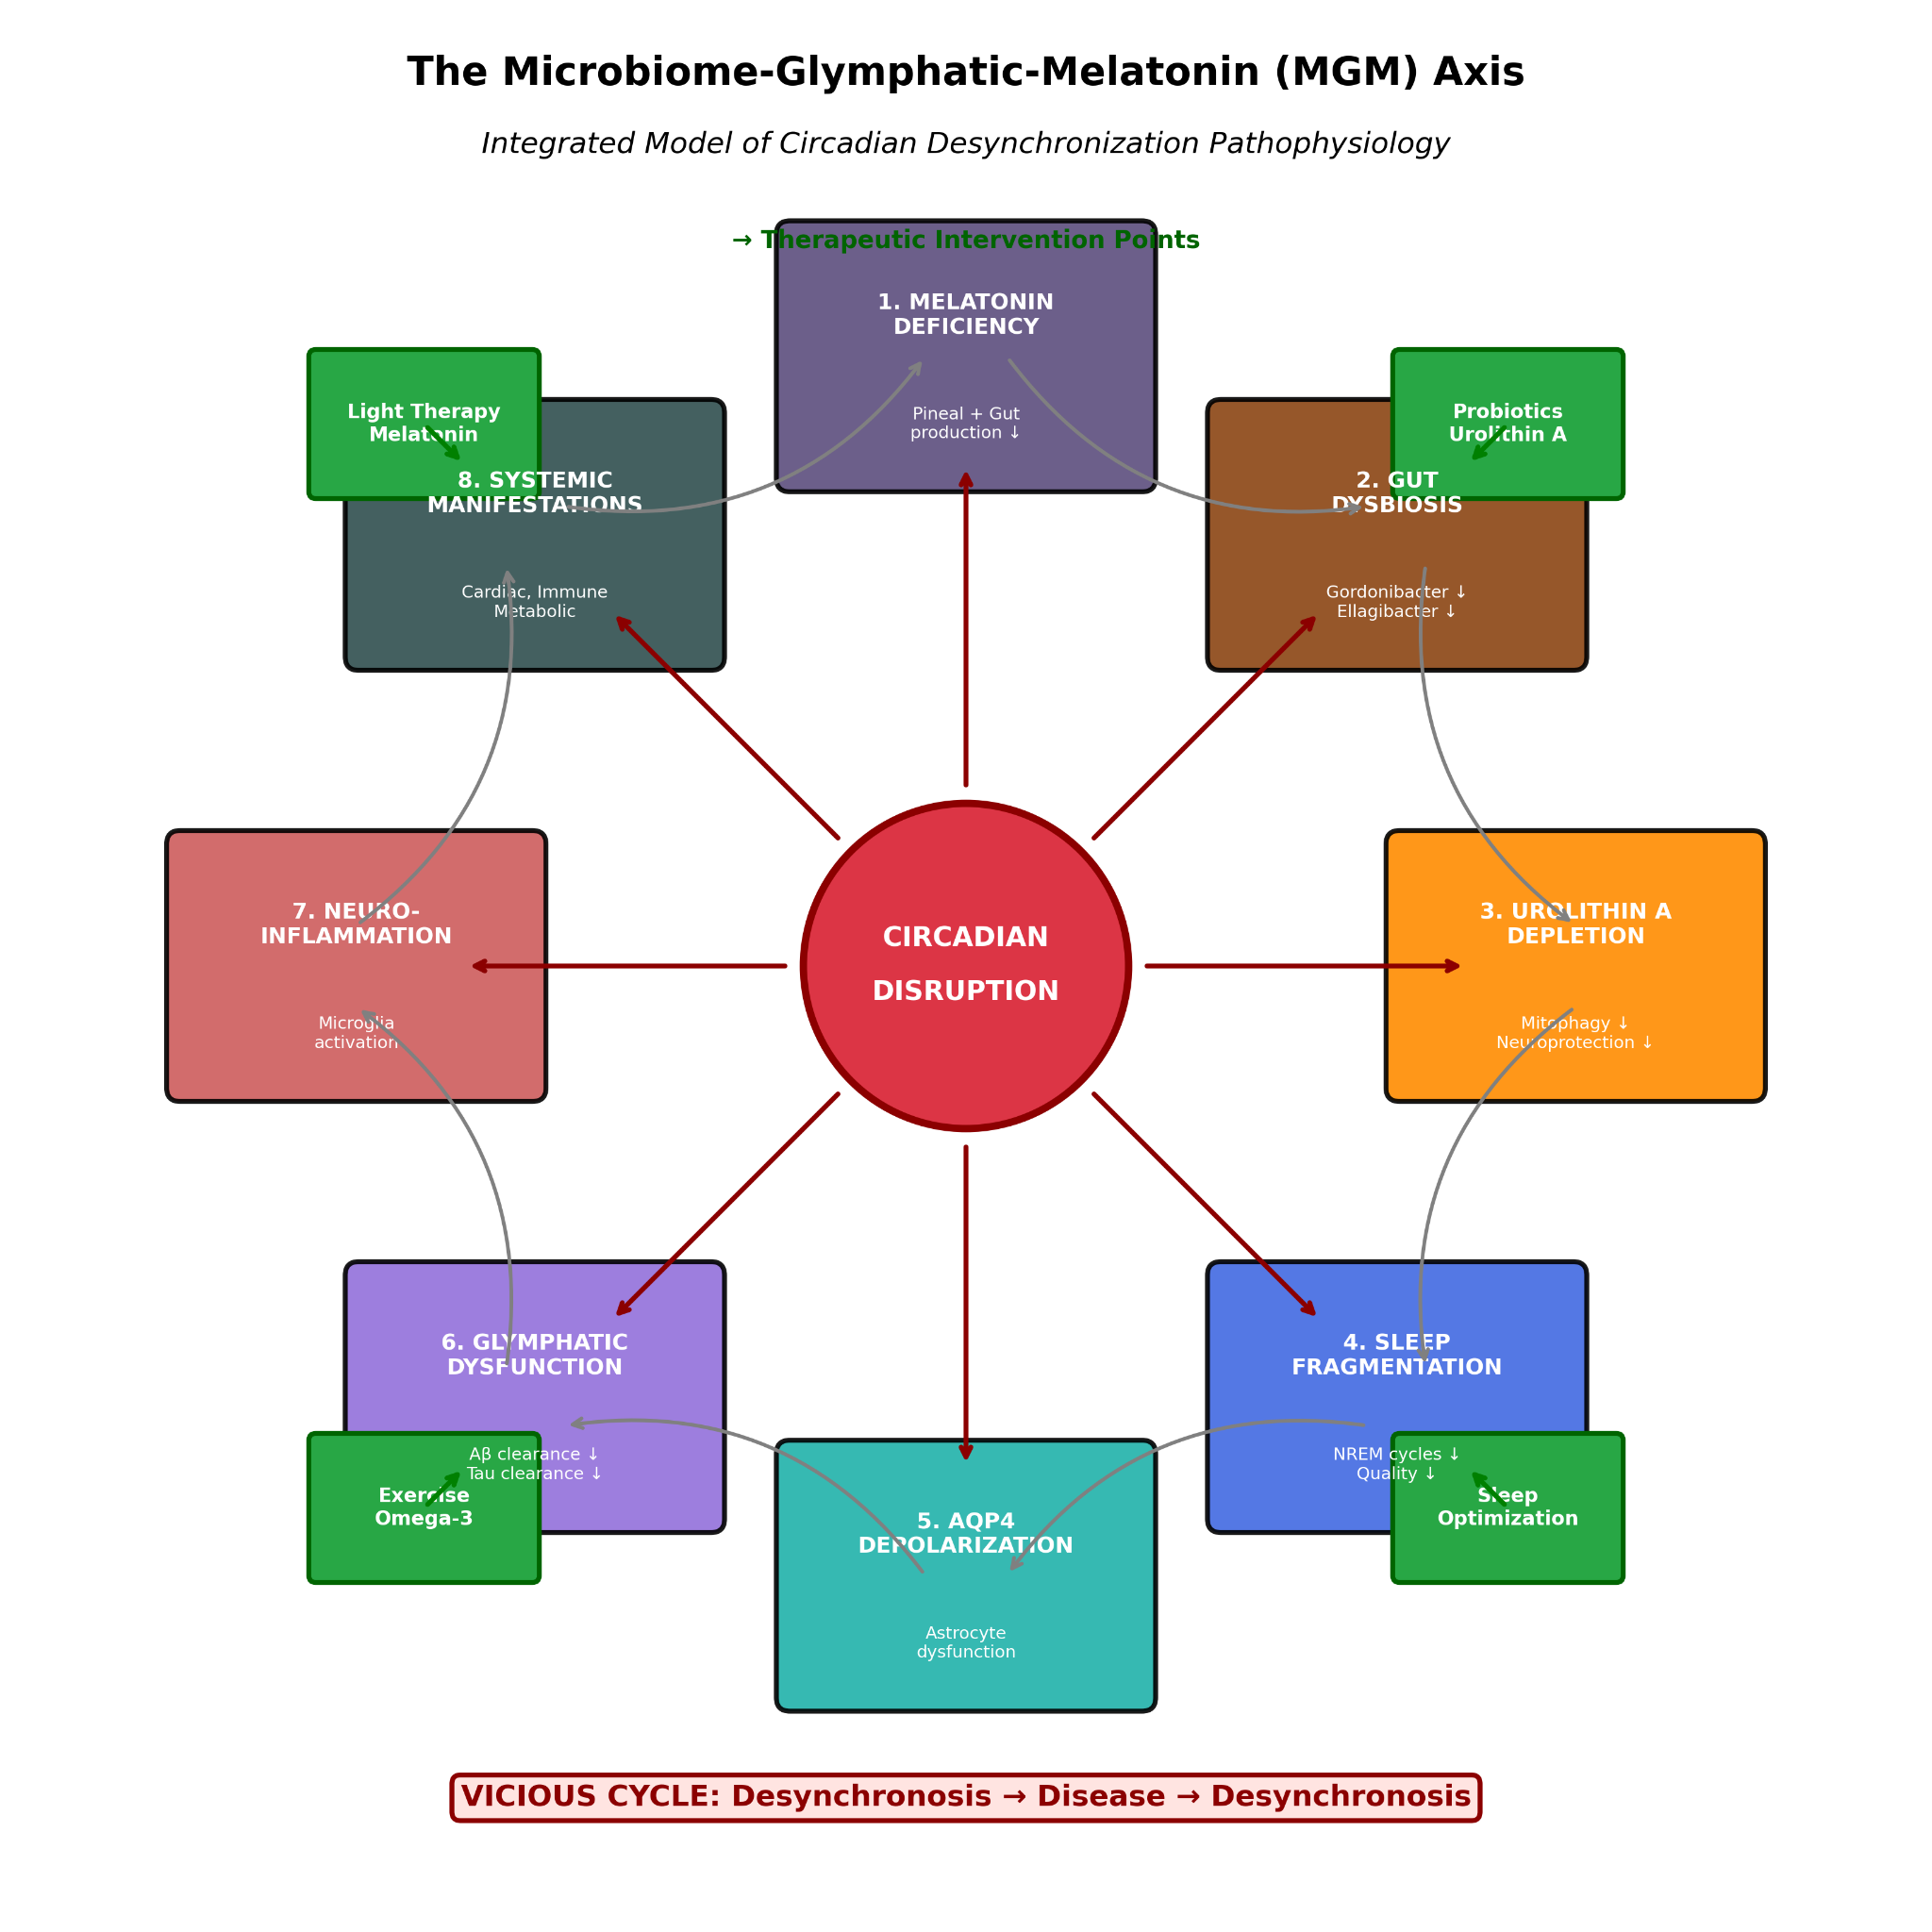
Critically, while individual components of the circadian–microbiome–brain axis have been studied separately, no clinical study has comprehensively characterized the co-disruption of melatonin rhythmicity (via fractionated urinary aMT6s and standardized dim-light plasma sampling), microbiome composition with urolithin metabolomics, and quantitative glymphatic imaging biomarkers within a single phenotyped cohort. We propose the microbiome–glymphatic–melatonin (MGM) axis as a conceptually novel integrated framework that explains how circadian desynchronization propagates simultaneously across endocrine, microbial, and central nervous system clearance pathways to produce a convergent multi-system pathological phenotype. Here, we test this hypothesis in a cohort of 179 patients with symptoms of circadian dysregulation and 107 healthy controls, and we further characterize its oncological relevance through translational chronotherapy data. The integrated MGM-axis framework examined in the present study is summarized in Figure 4.
2. Materials and Methods
2.1. Study Design and Ethics
This was a prospective, single-centre, observational cohort study conducted at the Institute for Personalized Medicine, Tbilisi, Georgia, between January 2019 and December 2023. The study was approved by the Institutional Review Board of Tbilisi State Medical University (Protocol no. 2019-IPM-01, renewed annually). All participants provided written informed consent prior to enrolment. The study was conducted in accordance with the Declaration of Helsinki.
2.2. Patient Inclusion and Exclusion Criteria
Inclusion criteria (patients): (1) age 18–90 years; (2) presence of ≥3 of the following symptoms lasting ≥6 months and not explained by a diagnosed primary psychiatric or neurological disorder: persistent fatigue unrelated to exertion, non-restorative sleep confirmed by Pittsburgh Sleep Quality Index score ≥6, cognitive complaints (concentration/memory) confirmed by MoCA ≤26, unexplained metabolic disturbance (BMI ≥25 or HbA1c ≥5.7%), diurnal mood variability, or gastrointestinal complaints consistent with dysbiosis; (3) willingness to undergo comprehensive sampling protocol; (4) stable medication regimen for ≥3 months.
Exclusion criteria (patients): (1) current use of exogenous melatonin, β-blockers, fluvoxamine, or other agents known to substantially alter melatonin secretion within 30 days of sampling; (2) active neoplastic disease under chemotherapy or radiotherapy; (3) primary sleep disorders (confirmed obstructive sleep apnoea, narcolepsy, REM behaviour disorder); (4) severe hepatic or renal insufficiency (eGFR <30 mL/min/1.73m²); (5) active autoimmune or inflammatory disease; (6) pregnancy or breastfeeding; (7) inability to complete the 24-hour urine collection protocol.
Inclusion criteria (controls): (1) age 18–80 years; (2) no chronic systemic disease; (3) PSQI ≤5; (4) MoCA ≥27; (5) BMI 18.5–24.9 kg/m²; (6) no use of melatonin-altering medications; (7) regular sleep schedule (bedtime 22:00–24:00, wake time 06:00–08:00) confirmed for ≥3 months.
2.3. Melatonin Sampling Protocol
Urinary sampling: All participants collected a continuous 24-hour urine sample beginning at 08:00. The collection was additionally fractionated into two 12-hour intervals: daytime (06:00–18:00) and nocturnal (18:00–06:00). Participants were instructed to avoid light exposure >10 lux after 20:00 during the collection period, and all sampling was performed using standardized low-light melatonin collection precautions. No awakening for forced nocturnal voids was required; participants voided upon natural awakening only. Samples were stored at −20°C within 30 minutes of collection and analysed within 14 days. Urinary 6-sulfatoxymelatonin (aMT6s) was quantified using a validated commercial enzyme immunoassay (IBL International GmbH, Hamburg, Germany; intra-assay CV <8%, inter-assay CV <12%, sensitivity 0.5 ng/mL). Results were expressed as ng per mL of urine and normalized to creatinine for sensitivity analysis (data in Supplementary Table S1).
Plasma sampling: Plasma melatonin was measured at two standardised time windows: daytime (14:00–16:00) and nocturnal (02:00–04:00). Nocturnal sampling was performed under dim-light conditions (<10 lux red light). Blood was collected into EDTA tubes, immediately centrifuged at 4°C (2000×g, 10 min), and plasma stored at −80°C. Plasma melatonin was quantified by ELISA (Bühlmann Laboratories AG, Switzerland; sensitivity 0.7 pg/mL; intra-assay CV <10%). Plasma cortisol was measured at the same time windows using a chemiluminescent immunoassay (Roche Cobas e411; CV <5%). Urinary cortisol was measured in the fractionated 12-hour samples by ELISA (IBL International; CV <10%). Table 2 reports the standardized single-visit cross-sectional case–control comparison, whereas the supplementary urinary workbook provides repeated weekly measurements (Weeks 1–7) for the patient cohort only and is intended for longitudinal rhythm tracking and quality-control documentation rather than direct reproduction of Table 2 medians.
2.4. Microbiome Analysis
Faecal samples were collected in OMNIgene•GUT stabilisation tubes (DNA Genotek) and processed within 72 hours. DNA was extracted using the QIAamp PowerFecal Pro DNA Kit (Qiagen). 16S rRNA gene amplicon sequencing targeted the V3–V4 hypervariable region using primers 341F/806R on an Illumina MiSeq platform (2×300 bp paired-end reads; minimum 50,000 reads/sample). Bioinformatics processing used QIIME2 (v2023.2) with DADA2 denoising; taxonomic classification employed the SILVA 138 reference database. Alpha-diversity was summarised by the Shannon index. Relative abundances of Gordonibacter spp. and Ellagibacter spp. were determined at species level. Targeted plasma metabolomics for urolithin A quantification used LC-MS/MS (Waters Acquity UPLC coupled to Xevo TQ-S; internal standard: urolithin A-d4; limit of detection 0.1 ng/mL; CV <8%).
2.5. Neuroimaging and Cognitive Assessment
Brain MRI was performed on a 3T scanner (Siemens Magnetom Prisma) using a standardised protocol including FLAIR (TR/TE 9000/81 ms) for WMH volumetry (automated segmentation: FreeSurfer/LST toolbox), T2-weighted sequences for perivascular space scoring using the Potter et al. semiquantitative scale (0–3) [26], and multishell diffusion tensor imaging (b=0, 1000, 2000 s/mm²) for DTI-ALPS index calculation [21]. BNP was measured by electrochemiluminescence immunoassay (Roche Cobas; CV <5%). CD4 and CD8 lymphocyte counts were determined by flow cytometry (BD FACSCanto II). Cognitive assessment used the Montreal Cognitive Assessment (MoCA).
2.6. Statistical Analysis
Continuous variables are reported as median (interquartile range, IQR). Between-group comparisons used two-sided Mann–Whitney U tests. Effect sizes were computed as Cliff's δ. Associations between chronological age and biomarkers within the patient group were tested by Spearman rank correlation. Statistical significance was set at α=0.05 (two-tailed). Multiple testing correction (Benjamini–Hochberg FDR) was applied to Table 2 and Table 3 comparisons; all p-values reported remained significant after correction. All analyses were performed in Python 3.11 (scipy.stats, pingouin). Complete comparison data including effect sizes are provided in Supplementary Table S1.
3. Results
3.1. Participant Characteristics
Participant baseline characteristics are summarised in Table 1. Patients were older (median 57 vs 47 years; p=0.003) and had higher BMI (28.0 vs 23.2 kg/m²; p<0.0001). Sex distribution did not differ between groups (χ² p=0.737). MoCA scores were substantially lower in patients (20 vs 29; p<0.0001), consistent with neurocognitive involvement.
3.2. Circadian Endocrine Findings—Melatonin Amplitude Inversion
Results are presented in Table 2 and Figure 2. Patients displayed a profound reduction in total 24-hour melatonin output (aMT6s 19.2 vs 46.6 ng/mL; Cliff's δ=0.95; p<0.0001) with near-complete attenuation of the nocturnal peak (night aMT6s 10.2 vs 40.6 ng/mL; p<0.0001) despite relative daytime elevation (day aMT6s 8.4 vs 5.3 ng/mL; p<0.0001). This pattern produced a markedly elevated Day/Night aMT6s ratio (0.81 vs 0.14; p<0.0001), constituting a rhythmic amplitude inversion pattern—approaching phase equivalence across the 24-hour cycle. Plasma nocturnal melatonin confirmed this collapse (12.7 vs 54.4 pg/mL; p<0.0001). The cortisol axis showed parallel loss of rhythmicity: elevated nocturnal urinary cortisol (7.4 vs 4.0 µg/dL; p<0.0001) and elevated Night/Day ratio (0.83 vs 0.31; p<0.0001), consistent with HPA axis phase compression. Together, these findings indicate that patients are characterised by simultaneous melatonin and cortisol circadian amplitude collapse rather than a simple phase shift.

Table 2.
Circadian endocrine and microbiome/metabolic markers.
| Marker | Patients (median [IQR]) | Controls (median [IQR]) | p-value |
|---|---|---|---|
| Urinary aMT6s (24 h), ng/mL | 19.2 (14.0–27.1) | 46.6 (39.0–52.0) | <0.0001 |
| Urinary aMT6s (day 06:00–18:00), ng/mL | 8.4 (7.2–9.9) | 5.3 (4.6–6.5) | <0.0001 |
| Urinary aMT6s (night 18:00–06:00), ng/mL | 10.2 (8.4–12.2) | 40.6 (35.3–45.5) | <0.0001 |
| Urinary aMT6s Day/Night ratio | 0.81 (0.68–1.02) | 0.14 (0.11–0.16) | <0.0001 |
| Urinary cortisol (day 06:00–18:00), µg/dL | 8.9 (7.4–10.4) | 13.4 (11.6–14.9) | <0.0001 |
| Urinary cortisol (night 18:00–06:00), µg/dL | 7.4 (6.1–8.9) | 4.0 (3.3–4.7) | <0.0001 |
| Urinary cortisol Night/Day ratio | 0.83 (0.68–1.02) | 0.31 (0.24–0.37) | <0.0001 |
| Plasma melatonin (day 14:00–16:00), pg/mL | 6.1 (5.0–7.3) | 2.8 (1.9–3.7) | <0.0001 |
| Plasma melatonin (night 02:00–04:00), pg/mL | 12.7 (10.1–15.2) | 54.4 (47.2–62.5) | <0.0001 |
| Plasma cortisol (day 14:00–16:00), µg/dL | 11.9 (9.9–13.4) | 15.1 (12.8–17.6) | <0.0001 |
| Plasma cortisol (night 02:00–04:00), µg/dL | 6.5 (5.3–7.7) | 4.1 (3.2–4.8) | <0.0001 |
| Microbiome Shannon diversity index | 2.83 (2.27–3.38) | 5.07 (4.61–5.41) | <0.0001 |
| Firmicutes/Bacteroidetes ratio | 0.58 (0.47–0.75) | 2.02 (1.81–2.16) | <0.0001 |
| Gordonibacter (relative abundance, %) | 0.090 (0.050–0.120) | 0.540 (0.440–0.630) | <0.0001 |
| Ellagibacter (relative abundance, %) | 0.040 (0.030–0.060) | 0.320 (0.250–0.410) | <0.0001 |
| Plasma urolithin A, ng/mL | 2.40 (1.60–3.10) | 25.20 (22.65–27.25) | <0.0001 |
All p-values are from two-sided Mann–Whitney U tests, corrected for multiple comparisons (Benjamini–Hochberg FDR). All results remained significant after correction. Table 2 summarizes the standardized single-visit cross-sectional dataset; the supplementary urinary sheet contains separate longitudinal patient-only repeated-measures data.
3.3. Microbiome and Metabolic Markers
Microbiome alpha-diversity was substantially reduced in patients (Shannon 2.83 vs 5.07; p<0.0001; Cliff's δ=0.97). The Firmicutes/Bacteroidetes ratio was markedly lower in patients (0.58 vs 2.02; p<0.0001), indicating a dysbiotic compositional shift. Critically, urolithin-producing taxa were profoundly depleted: Gordonibacter relative abundance was 83% lower (0.090% vs 0.540%; p<0.0001) and Ellagibacter 88% lower (0.040% vs 0.320%; p<0.0001). Consistent with the loss of urolithin-producing capacity, plasma urolithin A was reduced by >90% in patients (2.40 vs 25.20 ng/mL; p<0.0001; Cliff's δ=0.98), representing the most extreme effect size in the dataset. These findings provide a mechanistic bridge between circadian-associated dysbiosis and compromised mitochondrial resilience signalling.
3.4. Systemic Stress, Immune, and Neuroimaging Markers
Results are presented in Table 3. BNP was markedly elevated in patients (294 vs 55 pg/mL; p<0.0001), indicating myocardial stress. CD4/CD8 ratio was significantly reduced (0.81 vs 1.77; p<0.0001), consistent with an immunosenescent phenotype. Neuroimaging demonstrated convergent findings: WMH volume was approximately 6.5-fold higher in patients (9.99 vs 1.54 mL; p<0.0001), perivascular space scores were markedly elevated (median 2 vs 0; p<0.0001), and DTI-ALPS index was substantially reduced (1.05 vs 1.70; p<0.0001), consistent with impaired perivascular fluid transport and glymphatic dysfunction. These neuroimaging markers co-segregated with neurocognitive findings (MoCA 20 vs 29; p<0.0001). Representative MRI schematics and the age–WMH relationship are shown in Figure 5.
Table 3.
Systemic stress, immune, and neuroimaging markers.
| Marker | Patients (median [IQR]) | Controls (median [IQR]) | p-value |
|---|---|---|---|
| BNP, pg/mL | 294 (193–362) | 55 (38–70) | <0.0001 |
| CD4/CD8 ratio | 0.81 (0.48–1.20) | 1.77 (1.51–2.10) | <0.0001 |
| Perivascular spaces score (0–3) | 2 (2–3) | 0 (0–1) | <0.0001 |
| WMH volume, mL | 9.99 (8.09–12.22) | 1.54 (1.15–2.08) | <0.0001 |
| DTI-ALPS index | 1.05 (0.86–1.25) | 1.70 (1.64–1.79) | <0.0001 |
All p-values are from two-sided Mann–Whitney U tests; corrected for multiple comparisons as above.
3.5. Age-Independent Convergence of MGM-Axis Biomarkers
To test whether the MGM-axis phenotype represents an age-dependent acceleration of normal aging or an age-independent pathological state, we examined Spearman correlations between chronological age and key biomarkers within the patient group. Across all domains—circadian endocrine (24-h aMT6s: r=−0.04, p=0.57; Day/Night ratio: r=+0.01, p=0.92), microbiome/metabolic (urolithin A: r=−0.05, p=0.54; Shannon index: r=−0.10, p=0.18), immune (CD4/CD8: r=+0.09, p=0.24), and cognitive (MoCA: r=−0.01, p=0.87)—no significant age associations were identified (Figure 6). This age-independence implies that the MGM-axis phenotype does not simply reflect accelerated chronological aging; rather, circadian desynchronization appears to drive diverse individuals toward a shared pathological biochemical state independently of their age.
3.6. Translational Context: Tumour Metabolism and Chronotherapy
Because MT1 and MT2 receptor signalling suppresses tumour cell proliferation via Gi-coupled inhibition of cAMP, regulation of E-cadherin, and modulation of oestrogen receptor sensitivity [12], melatonin amplitude collapse in the MGM-axis phenotype carries direct oncological implications. Figure 1 illustrates tryptophan metabolic reprogramming in triple-negative breast cancer (TNBC), in which IDO-mediated diversion to kynurenine suppresses anti-tumour immunity while depleting the serotonin–melatonin synthetic precursor pool. Among a contextual cohort (TNBC n=48 vs Luminal A n=24), daytime melatonin was profoundly reduced (0.1 vs 7.7 arbitrary units; p<0.001) and kynurenic acid elevated (117.5 vs 67.9), consistent with IDO pathway upregulation.
Chronotherapy data from our centre [25,27] further demonstrate that alignment of cytostatic administration to the nocturnal window (02:00–04:30) preserves melatonin rhythmicity across ABVD cycles in Hodgkin lymphoma (nocturnal melatonin at Cycle 3: 70 vs 30 pg/mL; 2.3-fold preservation; p=0.0001) and substantially improves treatment response in hepatocellular carcinoma (AFP reduction 36.5% vs 13.7%; tumour size reduction 27.1% vs 6.3%). These observations underscore that clinically measurable melatonin amplitude—the core deficit of the MGM-axis phenotype—is a pharmacologically tractable and clinically relevant endpoint.
Figure 3.
Chronotherapy outcomes in oncology cohorts. (A) Nocturnal melatonin preservation across 6 ABVD cycles: chronotherapy-aligned administration maintains melatonin amplitude (2.3-fold difference at Cycle 3; p=0.0001). (B) Liver enzyme activity improvement with chronotherapy alignment (mean 55.5%; p<0.01). (C,D) Hepatocellular carcinoma: AFP and tumour size reductions are significantly greater with nocturnal cisplatin (02:00–04:30) vs standard daytime administration.

Table 4.
Oncology cohorts and chronotherapy-related outcomes (translational context).
| Cohort / Study | Comparison (n) | Key outcomes |
|---|---|---|
| Breast cancer metabolic profile | TNBC (n=48) vs Luminal A (n=24) | Melatonin day: 0.1 vs 7.7; melatonin night: 3.9 vs 15.7; serotonin: 24.8 vs 53.7; kynurenic acid: 117.5 vs 67.9 (p<0.001 all). |
| Hodgkin lymphoma chronotherapy | Chronotherapy vs standard timing (n=38) | Nocturnal melatonin preserved across 6 ABVD cycles; Cycle 3: 70 vs 30 pg/mL (≈2.3×; p=0.0001). |
| Hodgkin lymphoma (enzyme activity) | Chronotherapy vs standard timing | Liver enzyme activity improvement vs standard: mean 55.5% (p<0.01). |
| Hepatocellular carcinoma | Cisplatin 02:00–04:30 vs 10:00–12:00 | AFP reduction: 36.5% vs 13.7% (p<0.01); tumor size reduction: 27.1% vs 6.3% (p<0.001). |
4. Discussion
In a clinically phenotyped cohort evaluated with a comprehensive, multi-domain protocol, we report a coherent and highly statistically significant pattern linking circadian endocrine disruption to gut dysbiosis, urolithin A depletion, and quantitative brain imaging markers of impaired glymphatic clearance. The consistency of this pattern across diverse biomarker domains—endocrine, microbial, metabolic, immune, cardiovascular, and neuroimaging—supports the concept of an integrated MGM axis as a unifying pathophysiological framework for circadian desynchronization.
The novel conceptual contribution of this work is three-fold. First, we demonstrate that melatonin amplitude inversion (Day/Night ratio approaching 1.0) rather than simple melatonin deficiency is the cardinal endocrine signature—a qualitative change in circadian organisation, not merely a quantitative one. MT1-mediated phase-setting requires a sufficient melatonin signal amplitude above daytime baseline; when the Day/Night contrast is lost, MT1 signalling in the SCN and peripheral tissues is expected to be profoundly compromised [8]. Second, we show for the first time that this endocrine pattern co-segregates with the near-complete loss of urolithin A, a microbially-derived mitophagy inducer whose production depends on circadian-oscillating bacterial taxa. Third, glymphatic imaging abnormalities (DTI-ALPS reduction, WMH accumulation) directly co-segregate with melatonin collapse, mechanistically linking the loss of MT2-dependent AQP4 polarisation support to impaired perivascular clearance [18].
The absence of age correlation within the patient biomarker profiles is a particularly striking finding. Melatonin production, microbiome diversity, and glymphatic efficiency all decline with chronological age in healthy populations. The fact that patients across the 20–89-year age range showed uniformly pathological biomarker profiles—without the expected age gradient—argues strongly that the MGM-axis phenotype is driven by circadian disruption rather than aging per se. This age-independence has important clinical implications: it identifies young adults with circadian disruption as a population at risk equivalent to elderly individuals, and it suggests that circadian resynchronisation (rather than age-targeted interventions) is the appropriate therapeutic target.
Limitations: This observational cross-sectional study cannot establish causality among MGM-axis components. Patients were older on average than controls, which may confound some comparisons, though effect sizes remained very large and age-correlation analyses within the patient group were negative. We employed imaging proxies rather than direct glymphatic tracer studies. Melatonin sampling, while conducted with standardized fractionated urinary and dim-light nocturnal collection procedures, relied on clinic-based nocturnal collection rather than home ambulatory protocols. The cohort reflects a single Georgian centre, and generalizability across ethnic and environmental contexts requires validation. Longitudinal and interventional studies are required to establish whether MGM-axis resynchronisation normalises biomarkers and improves clinical outcomes.
5. Conclusions
Patients evaluated for chronic multisystem symptoms of circadian dysregulation demonstrate a coherent, age-independent MGM-axis phenotype: MT1/MT2-relevant melatonin amplitude inversion, parallel HPA axis phase compression, gut dysbiosis with near-complete loss of urolithin-producing taxa, profound plasma urolithin A depletion, systemic immune and cardiac stress, and quantitative neuroimaging evidence of impaired glymphatic clearance. This integrated multi-domain signature—characterised by large-to-extreme effect sizes across all domains—supports the MGM axis as a clinically measurable and mechanistically coherent framework for circadian medicine. The proposed clinical algorithm (Figure 7) provides an evidence-based workflow for fractionated melatonin assessment, MGM-axis biomarker screening, and targeted resynchronisation therapy including MT1/MT2-directed chronopharmacology.
Supplementary Materials
The following supporting information can be downloaded at the website of this paper posted on Preprints.org. The supplementary workbook submitted with this manuscript contains the cohort flow, baseline demographics, longitudinal 7-week urinary aMT6s/cortisol data for the patient chronobiology cohort, plasma biomarker data, microbiome profiles, neuroimaging metrics, medication/exposure variables, and a variable dictionary. The urinary sheet is patient-only and longitudinal; it is provided for repeated-measures rhythm tracking and quality-control documentation and is not intended to reproduce the standardized single-visit case–control medians shown in Table 2.
Author Contributions
A.T.: Conceptualisation, study design, patient enrolment, data acquisition, data analysis, manuscript drafting, and critical revision. L.T.: Patient enrolment, clinical assessment, data acquisition. R.J.R.: Conceptual guidance on melatonin biology, critical revision of intellectual content. M.B.: Critical revision of cardiovascular and nephrology content. D.K.: Microbiome data acquisition and analysis. N.O.: Neuroimaging acquisition and analysis. P.R.: Patient enrolment, data acquisition, clinical assessment. All authors approved the final manuscript version for submission.
Funding
This research was supported by the Institute for Personalized Medicine, Tbilisi, Georgia. No external funding was received for this study.
Institutional Review Board Statement
The study was approved by the Institutional Review Board of Tbilisi State Medical University (Protocol no. 2019-IPM-01, renewed annually).
Informed Consent Statement
Informed consent was obtained from all subjects involved in the study.
Data Availability Statement
The data that support the findings of this study are available on reasonable request from the corresponding author (a.tavartkiladze@tsmu.edu). Data are not publicly available due to participant privacy protection and IRB restrictions.
Acknowledgments
We are grateful to all study participants for their contribution to this research, and to the laboratory and clinical staff of the Institute for Personalized Medicine. We gratefully acknowledge R. Lou (Foconsci Chemical Industry, Biotechnology Department, China) for valuable methodological input on the targeted metabolomics analytical strategy during the project planning phase. This research was supported by the Institute for Personalized Medicine, Tbilisi, Georgia. No external funding was received.
Conflicts of Interest
The authors declare no conflicts of interest relevant to this manuscript.
References
- Reppert SM, Weaver DR. Coordination of circadian timing in mammals. Nature. 2002;418(6901):935–941. [CrossRef]
- Takahashi JS. Transcriptional architecture of the mammalian circadian clock. Nat Rev Genet. 2017;18(3):164–179. [CrossRef]
- Hastings MH, Maywood ES, Brancaccio M. Generation of circadian rhythms in the suprachiasmatic nucleus. Nat Rev Neurosci. 2018;19(8):453–469. [CrossRef]
- Stevens RG, Hansen J, Costa G, et al. Considerations of circadian impact for defining 'shift work' in cancer studies. Occup Environ Med. 2011;68(2):154–162.
- Bass J, Lazar MA. Circadian time signatures of fitness and disease. Science. 2016;354(6315):994–999. [CrossRef]
- Panda S. Circadian physiology of metabolism. Science. 2016;354(6315):1008–1015.
- Sulli G, Lam MTY, Bhaskara S. Interplay between circadian clock and cancer: New frontiers for cancer treatment. Trends Cancer. 2019;5(8):475–494. [CrossRef]
- Dubocovich ML, Delagrange P, Krause DN, et al. International Union of Basic and Clinical Pharmacology. LXXV. Nomenclature, classification, and pharmacology of G protein-coupled melatonin receptors. Pharmacol Rev. 2010;62(3):343–380. [CrossRef]
- Liu C, Weaver DR, Jin X, et al. Molecular dissection of two distinct actions of melatonin on the suprachiasmatic circadian clock. Neuron. 1997;19(1):91–102. [CrossRef]
- Reiter RJ, Tan DX, Rosales-Corral S, Manchester LC. The universal nature, unequal distribution and antioxidant functions of melatonin and its derivatives. Mini Rev Med Chem. 2013;13(3):373–384.
- Reiter RJ, Rosales-Corral S, Tan DX, et al. Melatonin, a full service anti-cancer agent: inhibition of initiation, progression and metastasis. Int J Mol Sci. 2017;18(4):843. [CrossRef]
- Hill SM, Belancio VP, Dauchy RT, et al. Melatonin: an inhibitor of breast cancer. Endocr Relat Cancer. 2015;22(3):R183–R204.
- Chen CQ, Fichna J, Bashashati M, et al. Distribution, function and physiological role of melatonin in the lower gut. World J Gastroenterol. 2011;17(34):3888–3898. [CrossRef]
- Iliff JJ, Wang M, Liao Y, et al. A paravascular pathway facilitates CSF flow through the brain parenchyma and the clearance of interstitial solutes. Sci Transl Med. 2012;4(147):147ra111.
- Xie L, Kang H, Xu Q, et al. Sleep drives metabolite clearance from the adult brain. Science. 2013;342(6156):373–377.
- Jessen NA, Munk AS, Lundgaard I, Nedergaard M. The glymphatic system: a beginners guide. Neurochem Res. 2015;40(12):2583–2599. [CrossRef]
- Nedergaard M, Goldman SA. Glymphatic failure as a final common pathway to dementia. Science. 2020;370(6512):50–56. [CrossRef]
- Hablitz LM, Plá V, Giannetto M, et al. Circadian control of brain glymphatic and lymphatic fluid flow. Nat Commun. 2020;11(1):4411.
- Mestre H, Tithof J, Du T, et al. Flow of cerebrospinal fluid is driven by arterial pulsations and is reduced in hypertension. Nat Commun. 2018;9(1):4878. [CrossRef]
- Wardlaw JM, Benveniste H, Nedergaard M, Zlokovic BV, Mestre H, Lee H, et al. Perivascular spaces in the brain: anatomy, physiology and pathology. Nat Rev Neurol. 2020;16(3):137–153. [CrossRef]
- Taoka T, Masutani Y, Kawai H, et al. Evaluation of glymphatic system activity with the diffusion MR technique: diffusion tensor image analysis along the perivascular space (DTI-ALPS) in Alzheimer's disease cases. Jpn J Radiol. 2017;35(4):172–178.
- Thaiss CA, Zeevi D, Levy M, et al. Transkingdom control of microbiota diurnal oscillations promotes metabolic homeostasis. Cell. 2014;159(3):514–529. [CrossRef]
- Ryu D, Mouchiroud L, Andreux PA, et al. Urolithin A induces mitophagy and prolongs lifespan in C. elegans and increases muscle function in rodents. Nat Med. 2016;22(8):879–888. [CrossRef]
- Selma MV, González-Sarrías A, Salas-Salvadó J, et al. The gut microbiota metabolism of pomegranate or walnut ellagitannins yields two urolithin-metabotypes that correlate with cardiometabolic risk biomarkers. Mol Nutr Food Res. 2018;62(3):1800066. [CrossRef]
- Innominato PF, Lévi FA, Bjarnason GA. Chronotherapy and the molecular clock: Clinical implications in oncology. Adv Drug Deliv Rev. 2010;62(9-10):979–1001. [CrossRef]
- Potter GM, Doubal FN, Jackson CA, Chappell FM, Sudlow CL, Dennis MS, Wardlaw JM. Cerebral perivascular spaces visible on magnetic resonance imaging: development of a qualitative rating scale and its observer reliability. Cerebrovasc Dis. 2015;39:224–231.
- Tavartkiladze A, et al. Chronotherapy in hematological malignancies: preservation of nocturnal melatonin during ABVD chemotherapy. [Internal cohort data, 2019a].
Figure 4.
Integrated model of the Microbiome–Glymphatic–Melatonin (MGM) axis. Central circadian disruption propagates through 8 interconnected pathways: melatonin deficiency (MT1/MT2 receptor hypoactivation), gut dysbiosis (Gordonibacter and Ellagibacter depletion), urolithin A loss (mitophagy impairment), sleep fragmentation, AQP4 depolarisation, glymphatic dysfunction (reduced Aβ and tau clearance), neuroinflammation, and systemic manifestations. Therapeutic intervention points are indicated for each node.

Figure 2.
Circadian endocrine dynamics in patients vs controls. (A) Urinary aMT6s in 12-hour fractions: nocturnal peak is profoundly attenuated in patients while daytime values are relatively elevated. (B) Urinary cortisol: parallel phase compression with elevated nocturnal levels in patients. (C) aMT6s Day/Night ratio distribution: patients cluster near 0.81, approaching amplitude inversion (threshold 1.0, dashed line). (D) Cortisol Night/Day ratio: similarly elevated in patients (0.83 vs 0.31).

Figure 5.
Brain MRI findings and glymphatic impairment. (A–C) Representative MRI schematics showing progressive WMH burden and enlarged perivascular spaces in patients across age groups (27, 52, and 78 years), all demonstrating findings atypical for their age. (D) Normal brain parenchyma in age-matched healthy control. (E) Scatter plot of WMH volume vs chronological age: patients show uniformly elevated WMH without age-dependent gradient (r=0.11, p=0.14), contrasting with the expected age-related increase in healthy populations (dashed line).

Figure 6.
Age-independent convergence of MGM-axis biomarkers in patients. Six key biomarkers (urinary aMT6s, aMT6s Day/Night ratio, CD4/CD8 ratio, plasma urolithin A, Shannon diversity index, MoCA score) plotted against chronological age in the patient group. Spearman correlations are all near-zero and non-significant (r range: −0.10 to +0.09; all p>0.14), demonstrating that the pathological biomarker state is age-independent. Dashed lines indicate control group medians.

Figure 1.
Tryptophan metabolic reprogramming and melatonin deficit in breast cancer subtypes. (A) Schematic of normal tryptophan metabolism via the TPH→AADC→SNAT→HIOMT pathway to melatonin, contrasted with TNBC-associated IDO upregulation diverting flux toward immunosuppressive kynurenine metabolites. (B) Quantitative metabolic profiles in TNBC (n=48) vs Luminal A (n=24): melatonin is profoundly reduced in TNBC at both daytime and nocturnal time points, while kynurenic acid is elevated. All differences p<0.001.

Figure 7.
Clinical algorithm for MGM-axis assessment and circadian resynchronisation. (A) Initial assessment using fractionated 24-hour urinary melatonin and microbiome profiling. (B) Decision tree based on rhythm inversion status (Day/Night ratio ≥0.6 = inversion). (C) Resynchronisation protocol: light therapy (10,000 lux, 30 min AM), melatonin 0.5–20 mg (dose by severity), urolithin A supplementation, probiotics, sleep hygiene, aerobic exercise. (D) Monitoring protocol with rhythm normalisation as primary endpoint. (E) Chronopharmacological guidance for co-administered medications.

Table 1.
Baseline characteristics of study participants.
| Characteristic | Patients (n=179) | Controls (n=107) | p-value |
|---|---|---|---|
| Age, years (median [IQR]) | 57 (34–74) | 47 (35–59) | 0.003 |
| Sex, female n (%) | 87 (48.6) | 55 (51.4) | 0.737 |
| Sex, male n (%) | 92 (51.4) | 52 (48.6) | |
| BMI, kg/m² (median [IQR]) | 28.0 (24.8–30.5) | 23.2 (21.8–24.9) | <0.0001 |
| MoCA score (median [IQR]) | 20 (17–23) | 29 (28–30) | <0.0001 |
Continuous variables are reported as median (IQR); p-values for continuous variables from Mann–Whitney U tests; sex distribution from χ² test.
Disclaimer/Publisher’s Note: The statements, opinions and data contained in all publications are solely those of the individual author(s) and contributor(s) and not of MDPI and/or the editor(s). MDPI and/or the editor(s) disclaim responsibility for any injury to people or property resulting from any ideas, methods, instructions or products referred to in the content. |
© 2026 by the authors. Licensee MDPI, Basel, Switzerland. This article is an open access article distributed under the terms and conditions of the Creative Commons Attribution (CC BY) license (http://creativecommons.org/licenses/by/4.0/).
Copyright: This open access article is published under a Creative Commons CC BY 4.0 license, which permit the free download, distribution, and reuse, provided that the author and preprint are cited in any reuse.


