Submitted:
17 April 2026
Posted:
22 April 2026
You are already at the latest version
Abstract
Groundwater is a major source of water supply in Diyala Governorate, Iraq. This study proposes an integrated framework for groundwater quality assessment and forecasting by combining the Entropy Weighted Water Quality Index (EWQI) with machine learning algorithms. A total of 855 groundwater samples were collected, of which 853 were retained after preprocessing. The EWQI was calculated using ten hydrochemical parameters for each sample, namely pH, total dissolved solids (TDS), K+, Na+, Mg2+, Ca2+, Cl−, SO42−, HCO3−, and NO3−. Based on the Iraqi Standard Drinking Water Limits (IQS), EWQI values were categorized into five water quality classes: Excellent, Good, Medium, Poor, and Extremely Poor. For predictive analysis, both regression and classification models were developed using support vector machine (SVM), random forest (RF), backpropagation multilayer perceptron (BP-MLP), and one-dimensional convolutional neural network (1D-CNN) algorithms under three feature scenarios: (1) hydrochemical variables only, (2) hydrochemical variables combined with well properties, and (3) hydrochemical variables, well properties, and spatial coordinates. Model hyperparameters were optimized using grid search with 10-fold cross-validation on the training set, and model performance was evaluated using an 80/20 stratified split. Among the tested models, SVM demonstrated the best performance for EWQI prediction in the first scenario (hydrochemical variables only), achieving RMSE = 4.14, MAE = 0.93, and R2 = 0.999. It also produced the highest classification performance, with an accuracy of 0.971 and a macro-F1 score of 0.973. Meanwhile, RF showed consistently strong and balanced classification performance across all scenarios, reaching a macro-F1 score of 0.961. These findings highlight the effectiveness of integrating EWQI with machine learning techniques for reliable groundwater quality assessment and prediction, thereby supporting sustainable water resource management in Diyala Governorate.
Keywords:
groundwater quality
; EntropyWeightedWater Quality Index (EWQI)
; Iraqi drinking water standards
; machine learning
; prediction
; classification
; feature importance
; Diyala Governorate
; Iraq
1. Introduction
Water is essential to life and represents one of the most valuable components of natural wealth on Earth. It is the foundation of all living organisms and a fundamental resource for environmental sustainability, human well-being, and economic development. In addition to its indispensable role in sustaining life, water is also a strategic resource for energy production and multiple developmental sectors. Accordingly, effective management, conservation, development, and rational utilization of water resources are critical for meeting present and future demands [1,2].
In Diyala Governorate, Iraq, groundwater constitutes an important water resource, particularly in areas located far from surface water bodies or in regions where topographic complexity and rugged terrain hinder water delivery. For this reason, hundreds of mechanical wells have been drilled by governmental, local, and foreign institutions to secure water for domestic, agricultural, and other purposes [3]. The importance of groundwater has increased substantially in recent years because of the growing scarcity of surface water resources. This situation has been exacerbated by upstream water storage and regulation practices affecting the Tigris and Euphrates rivers in neighboring countries, in addition to recurrent drought conditions across the region [4].
Under these circumstances, identifying groundwater resources and evaluating both their quantity and quality have become increasingly important. This need has led to the expansion of hydrogeological investigations aimed at characterizing groundwater-bearing geological formations and determining their suitability for various uses [5,6]. In particular, attention has been directed toward the main upper aquifer because of its significant role in compensating for the shortage of surface water supplies and supporting the increasing demand associated with population growth and expansion in service and economic sectors [7,8].
Hydrochemical analysis is one of the principal tools for assessing groundwater quality, as it provides valuable information on water composition, salinity, and suitability for different uses [9]. Based on hydrochemical records and analytical data collected from wells drilled across Diyala Governorate, it has been possible to evaluate groundwater quality within different geological formations, determine the spatial distribution of salinity, and assess the potential use of groundwater for drinking by humans and animals, irrigation, and industrial and construction activities [10,11].
Given the increasing scarcity of surface water resources and the corresponding rise in water demand for multiple purposes, greater attention must be directed toward groundwater as a strategic complementary resource [12]. Groundwater should therefore be considered within an integrated water resources management framework that promotes the conjunctive use of surface water and groundwater [13]. Such an approach can contribute to improving water allocation, ensuring more reliable supply, maintaining quality control, and protecting water resources from pollution sources [14].
Although groundwater quality indices such as the Water Quality Index (WQI) and the Entropy Weighted Water Quality Index (EWQI) are widely employed to evaluate water suitability, their conventional application remains largely descriptive. In most cases, these indices provide a static assessment of groundwater quality without offering predictive capability or effective support for timely decision-making. At the same time, existing studies that combine water quality indices with machine learning techniques often lack a unified and reproducible framework capable of simultaneously addressing both continuous index prediction and categorical water quality classification within a consistent evaluation protocol.
In addition, insufficient attention has been devoted to systematic feature selection, feature significance assessment, and model interpretability, despite the fact that these aspects are crucial for translating predictive performance into meaningful hydrochemical understanding. Therefore, there is a clear need for an integrated methodology that combines objective index construction, such as entropy-based weighting, with robust machine learning models for both regression and classification tasks. Such a framework would provide more accurate, interpretable, and practically useful support for groundwater quality monitoring, assessment, and management.
Accordingly, this study aims to develop a comprehensive framework for groundwater quality assessment and prediction in Diyala Governorate, Iraq, through the integration of the Entropy Weighted Water Quality Index (EWQI) and machine learning techniques. Specifically, the study calculates the EWQI for each well using hydrochemical parameters, including pH, TDS, K, Na, Mg, Ca, Cl, SO4, HCO3, and NO3, while deriving parameter weights objectively through the entropy method in order to minimize subjectivity in determining variable importance. The study also classifies wells into five qualitative groundwater categories, namely Excellent, Good, Medium, Poor, and Very Poor, based on EWQI values, and adopts the Iraqi drinking water standards (IQS) as reference limits to ensure that the assessment is aligned with the local regulatory and environmental context. Furthermore, machine learning models are developed for both EWQI prediction as a regression task and EWQI category prediction as a classification task using Support Vector Machine (SVM), Random Forest (RF), Backpropagation Multilayer Perceptron (BP-MLP), and Convolutional Neural Network (CNN), and their performance is compared under three feature scenarios: hydrochemical variables only, hydrochemical variables combined with well properties, and hydrochemical variables combined with well properties and spatial coordinates. Finally, the study identifies the variables that most strongly influence classification model decisions through feature importance analysis, including permutation importance and Gini importance, thereby improving model interpretability and clarifying the hydrochemical factors most closely associated with groundwater quality deterioration.
Overall, this study seeks to provide an accurate, reproducible, and interpretable framework that can support decision-making for well prioritization, monitoring, and treatment planning, with potential applicability to other regions through the incorporation of region-specific standards and additional explanatory variables.
2. Related Work
Recent studies have shown that integrating groundwater quality indices with machine learning can improve the assessment and prediction of groundwater suitability. The integration of EWQI with data-driven models has already demonstrated promising predictive capability in groundwater studies [15]. Multi-model comparison under different input scenarios has also confirmed that model performance is highly sensitive to feature composition and data structure [16]. Similar findings have been reported for groundwater quality assessment based on physicochemical and hydrochemical measurements, where machine learning models achieved acceptable predictive accuracy [17].
The literature further indicates that both continuous index prediction and categorical groundwater quality classification are relevant for practical applications. Some studies have explicitly addressed these two tasks within groundwater quality modeling frameworks [18]. Other investigations have focused on potable groundwater prediction and monitoring using multiple machine learning algorithms and different performance criteria [19]. In addition, the combination of groundwater quality indexing with health-related assessment has expanded the applied value of prediction frameworks beyond conventional classification [20]. More advanced approaches have also integrated EWQI with geohydrochemical analysis and clustering-based procedures to improve prediction and interpretation [21]. Spatially informed classification frameworks have likewise shown that machine learning can effectively distinguish groundwater quality classes in heterogeneous environments [22].
Despite these contributions, several gaps remain. First, previous studies have not consistently provided a unified framework that addresses both EWQI regression and categorical classification under the same evaluation protocol. Second, the contribution of different feature scenarios, particularly the incremental value of well characteristics and spatial coordinates, remains insufficiently examined. Third, interpretability is still limited in many studies, even though identifying the variables that drive model decisions is essential for hydrochemical understanding and practical groundwater management.
Accordingly, the present study is designed to address these limitations by developing a reproducible EWQI-based framework that jointly evaluates regression and classification tasks, compares three feature scenarios, and investigates feature importance while maintaining alignment with Iraqi drinking water standards.
3. Materials and Methods
3.1. Overall Methodological Framework
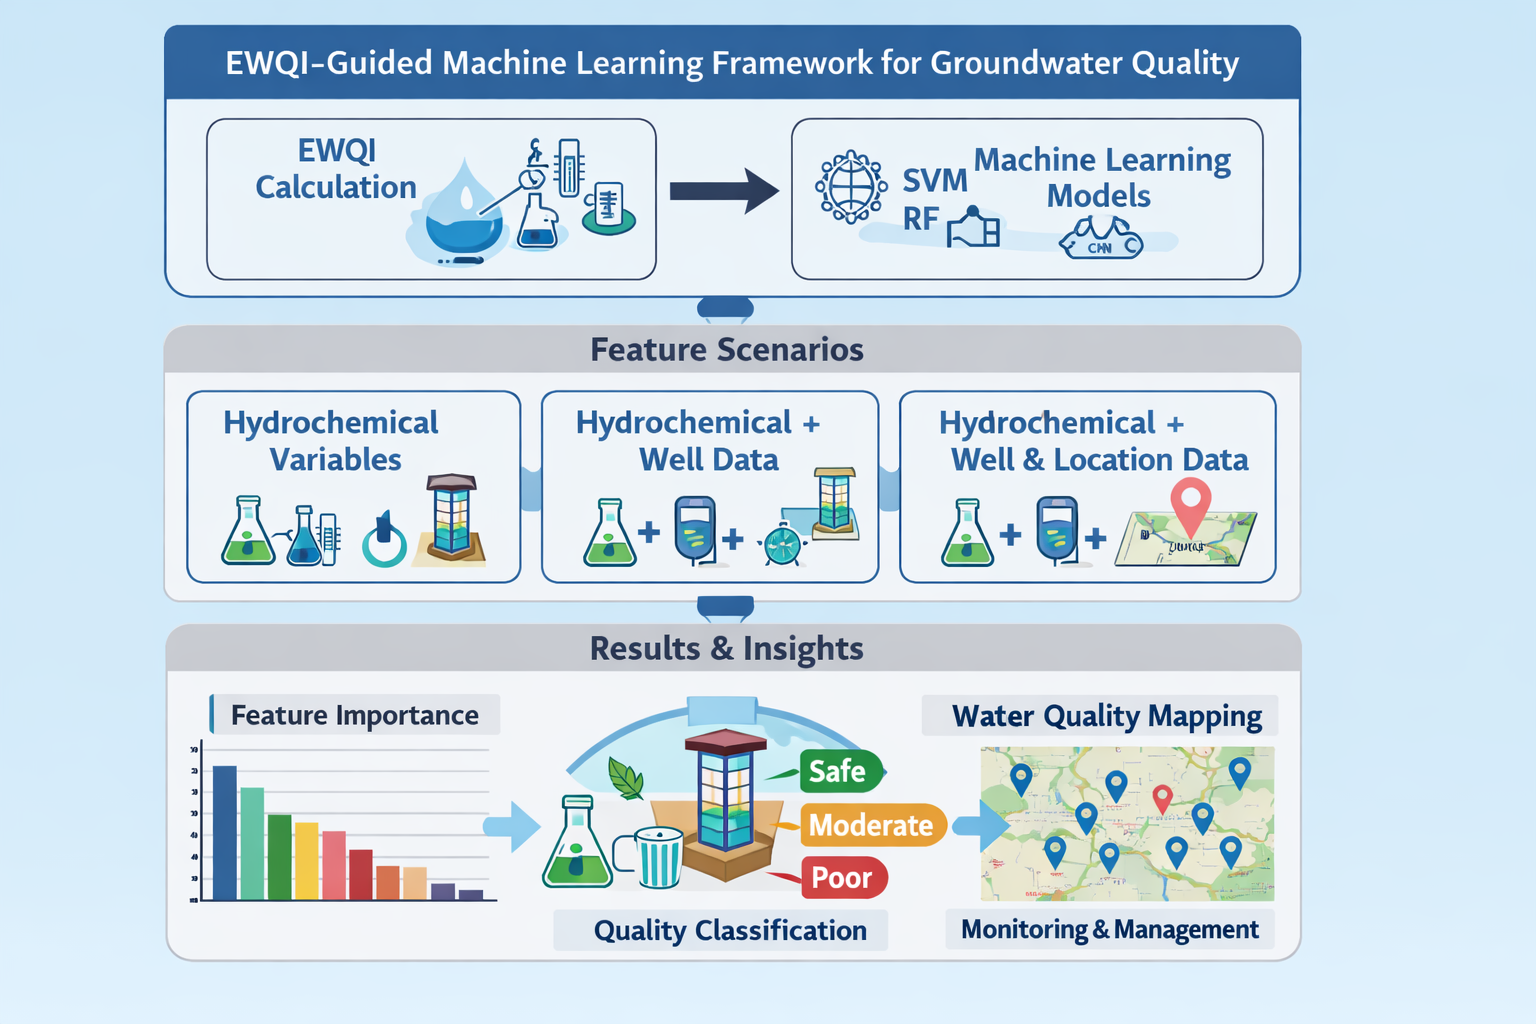
This study developed an integrated framework for groundwater quality assessment and prediction in Diyala Governorate, Iraq, by combining the Entropy-Weighted Water Quality Index (EWQI) with machine learning models. The framework was designed to achieve two complementary objectives: first, to quantify groundwater quality through an objective hydrochemical index, and second, to predict both the continuous EWQI value and the corresponding groundwater quality class using supervised learning.
The workflow began with the collection and preprocessing of groundwater well data, including data cleaning, type conversion, and missing-value treatment. The EWQI was then computed using entropy-derived parameter weights and Iraqi drinking water standards as regulatory thresholds. The resulting EWQI values were subsequently classified into five groundwater quality categories and used to define the target variables for regression and classification. To examine the effect of predictor composition on model performance, three feature scenarios were constructed: hydrochemical variables only, hydrochemical variables combined with well properties, and hydrochemical variables combined with well properties and spatial coordinates. The machine learning stage then included preprocessing, stratified data splitting, hyperparameter optimization by grid search with cross-validation, model training, performance evaluation, and interpretability analysis.
Figure 1 is included because the proposed framework combines several consecutive analytical stages, and a workflow diagram is necessary to clarify the logical sequence from raw groundwater records to EWQI calculation, predictive modeling, and feature-importance analysis. Its inclusion therefore strengthens methodological transparency and improves reproducibility.
3.2. Study Area and Data Source
Diyala Governorate, located northeast of Baghdad and bordering Iran, was selected as the study area because groundwater represents an important alternative water resource under increasing pressure on surface water availability [23]. The dataset used in this study consisted of 855 groundwater well records, each containing 31 variables. These variables included spatial information, such as geographic coordinates and projected coordinates; well characteristics, such as depth, drilling date, static water level, dynamic water level, and well productivity; and key hydrochemical indicators, including pH, EC, TDS, K, Na, Mg, Ca, Cl, SO4, HCO3, CO3, and NO3.
Figure 2 is essential because it establishes the geographic context of the investigation and shows the spatial distribution of the sampled wells across Diyala Governorate. This figure is important not only for orientation, but also because it demonstrates the areal coverage of the dataset and supports the spatial relevance of the groundwater quality assessment.
After preprocessing and quality control, 853 samples were retained for the final analysis.
3.3. Entropy-Weighted Water Quality Index (EWQI)
Groundwater quality was assessed using the Entropy-Weighted Water Quality Index (EWQI), which was calculated from ten hydrochemical parameters: pH, TDS, K, Na, Mg, Ca, Cl, SO4, HCO3, and NO3. These variables were selected because they represent the principal hydrochemical controls on groundwater salinity, mineralization, and drinking-water suitability. Iraqi drinking water standards were adopted as the regulatory reference limits [24].
3.3.1. Hydrochemical Matrix Construction and Normalization
Let the hydrochemical dataset be represented by the matrix:
where m is the number of groundwater samples and n is the number of hydrochemical parameters.
Because the hydrochemical variables are measured on different scales, normalization was required prior to entropy calculation. For the concentration-based variables, min–max normalization was applied as follows:
where the constant was added to avoid zero values in subsequent logarithmic calculations. This normalization is necessary because entropy weighting is sensitive to the relative spread of variable values across the dataset.
Since pH has an optimal value near neutrality rather than a simple monotonic relationship with water quality, it was treated separately using a deviation-based transformation:
This formulation is more appropriate for pH because both acidic and alkaline deviations from neutrality may reduce water suitability.
3.3.2. Ratio Matrix, Entropy, and Weight Calculation
After normalization, the proportional contribution of each parameter across all samples was computed as:
where is the normalized proportion of parameter j in sample i.
The entropy of each parameter was then calculated as:
where measures the information content of parameter j across the study dataset. Variables with greater variability contribute more information and therefore receive greater importance in the EWQI framework.
The entropy-derived weight of each parameter was obtained as:
where denotes the relative contribution of parameter j to the final index, with the sum of all weights equal to 1. The use of entropy weighting is important because it reduces subjective bias in assigning parameter importance and instead links the weighting system directly to the hydrochemical variability observed in the data.
3.3.3. Quality Rating and Final EWQI Calculation
For each hydrochemical parameter, a quality rating was calculated using the measured concentration and the corresponding Iraqi standard limit:
where is the measured concentration of parameter j in sample i, and is the Iraqi drinking water standard for that parameter.
The final EWQI value for each well was then calculated as:
where is the overall groundwater quality index for sample i. This equation provides a single quantitative value that integrates all selected hydrochemical variables while preserving their relative contribution.
3.3.4. EWQI Classification
For interpretation and subsequent classification modeling, the EWQI values were grouped into five groundwater quality classes, as shown in Table 1.
The class distribution is summarized in Table 2. This table is important because it reveals the imbalance among groundwater quality classes and therefore justifies the use of stratified data splitting and Macro-F1 as a key evaluation metric in the classification stage.
The descriptive statistics, exceedance rates, and entropy-derived weights of the hydrochemical parameters are reported in Table 3. This table is retained in the main manuscript because it provides the hydrochemical foundation of the entire analysis and supports the later conclusion that salinity-related parameters dominate groundwater quality variation in the study area.
3.4. Supervised Learning Design
The original dataset contained predictor variables only and did not include predefined response variables suitable for supervised learning. Therefore, the EWQI value was first calculated for each well and then used as the regression target, whereas the derived EWQI_Class variable was used as the classification target [21]. This design is methodologically important because it allows the same hydrochemical basis to support both quantitative prediction and qualitative groundwater quality categorization.
3.5. Machine Learning Models
Four machine learning models were adopted for groundwater quality prediction: Support Vector Machine (SVM), Random Forest (RF), Backpropagation Multilayer Perceptron (BP-MLP), and one-dimensional Convolutional Neural Network (1D-CNN). These models were selected because they represent different learning paradigms, including kernel-based learning, tree-based ensemble learning, and neural-network-based nonlinear modeling. Their joint evaluation therefore provides a more rigorous comparative framework than reliance on a single model family [25,26].
3.5.1. Feature Scenarios
To evaluate the effect of predictor composition on model performance, three feature scenarios were defined:
- Scenario 1 (hydrochemical): pH, TDS, K, Na, Mg, Ca, Cl, SO4, HCO3, and NO3.
- Scenario 2 (enhanced_hydro): Scenario 1 plus Depth, Static_WL, Dynamic_WL, and Well_productivity.
- Scenario 3 (enhanced_spatial): Scenario 2 plus Decimal_X and Decimal_Y.
This scenario-based design is central to the study because one of its main goals is to test whether hydrochemical variables alone are sufficient for robust prediction or whether additional hydrogeological and spatial information can improve model performance.
3.5.2. Preprocessing and Data Splitting
All selected variables were converted to numeric format. Values that could not be converted were treated as missing and imputed using median imputation within the modeling pipeline [27,28]. Standardization was applied to SVM, BP-MLP, and CNN because these models are sensitive to feature scale, whereas RF was trained without scaling.
The dataset was divided into training and testing subsets using an 80:20 split, with stratification based on EWQI_Class to preserve class proportions. Hyperparameter optimization was performed on the training set using grid search with 10-fold cross-validation, and the optimized models were then evaluated on the independent test set [29]. This protocol was adopted to improve fairness, reduce evaluation bias, and ensure that the reported performance reflects model generalization rather than overfitting to a single split.
3.5.3. Model Descriptions
Support Vector Machine (SVM)
SVM was used in two forms: Support Vector Regression (SVR) for EWQI prediction and Support Vector Classification (SVC) for EWQI_Class prediction. The radial basis function kernel was adopted because the relationship between hydrochemical variables and groundwater quality outcomes is expected to be nonlinear. Hyperparameters were optimized by grid search, including the regularization parameter C, the kernel parameter , and, for SVR, the insensitive loss parameter [30]. SVM was selected because it is well suited to structured datasets of moderate size and often performs strongly in nonlinear tabular prediction tasks.
Random Forest (RF)
RF was implemented as RandomForestRegressor for regression and RandomForestClassifier for classification. The model constructs an ensemble of decision trees using bootstrap resampling and random feature selection at each split, thereby improving robustness and reducing variance relative to a single tree [31]. For classification, the option class_weight = balanced was used to reduce the effect of class imbalance [32]. RF was chosen because it provides strong nonlinear modeling capacity, robust baseline performance, and an interpretable measure of feature importance.
Backpropagation Multilayer Perceptron (BP-MLP)
BP-MLP was used for both regression and classification. As a multilayer neural network, it is capable of approximating complex nonlinear relationships through hidden layers and backpropagation-based weight optimization. Standardization and early stopping were applied to reduce the risk of overfitting [33]. This model was included because it is a widely used neural baseline for tabular data and is suitable for capturing complex input–output relationships.
One-Dimensional Convolutional Neural Network (1D-CNN)
The 1D-CNN model was implemented as a simplified deep learning architecture for tabular input. Each sample was represented as a one-dimensional feature vector, which was then processed through Conv1D layers, a global pooling stage, and dense output layers. Linear output was used for regression, whereas Softmax output was used for classification. Early stopping was also adopted [34]. The model was included to test whether automated feature extraction through convolutional operations could improve groundwater quality prediction.
3.5.4. Evaluation Metrics
For the regression task, model performance was evaluated using RMSE, MAE, and [35]:
where is the observed EWQI value, is the predicted EWQI value, and is the mean observed EWQI.
Macro-F1 was emphasized because it is more informative than Accuracy alone in multiclass settings with class imbalance, as it assigns equal importance to each class regardless of sample frequency.
4. Results and Discussion
4.1. Regression Performance: Continuous EWQI Prediction
The regression performance of the four machine learning models across the three feature scenarios is reported in Table 4. The results show that SVM achieved the best overall regression performance in Scenario 1, with the lowest RMSE and the highest , indicating that the hydrochemical variables alone were sufficient to capture the dominant variation in EWQI. BP-MLP showed competitive performance in Scenario 2, whereas CNN consistently exhibited the weakest regression accuracy, particularly in Scenario 3.
Figure 3 is included because Table 4 provides exact numerical results, whereas the figure gives a direct comparative view of how model performance changed across scenarios. This visual summary makes the ablation pattern easier to interpret and clearly shows that the addition of well and spatial variables did not consistently improve regression accuracy.
4.2. Classification Performance: EWQI_Class Prediction
The classification results are presented in Table 5. The highest overall Macro-F1 was achieved by SVM in Scenario 1, confirming that hydrochemical variables alone also provided the strongest basis for EWQI class prediction. When additional well and spatial variables were introduced in Scenarios 2 and 3, RF became the most stable classifier and produced the strongest Macro-F1 values under those settings. BP-MLP showed the weakest classification performance across the three scenarios.
Figure 4 is retained because it complements Table 5 by presenting the inter-scenario comparison in a compact visual form. This is particularly useful for highlighting the contrast between the superior SVM performance in Scenario 1 and the greater stability of RF when additional variables were incorporated.
4.3. Scenario Comparison and Ablation Insight
A direct comparison of the three feature scenarios shows that Scenario 1, based solely on hydrochemical variables, was sufficient to achieve the best overall results in both regression and classification, particularly with the SVM model. This finding is important because it demonstrates that the variables used to construct the EWQI also preserve strong predictive value when used directly as model inputs.
The addition of well characteristics in Scenario 2 and spatial coordinates in Scenario 3 did not lead to consistent performance gains. Although BP-MLP showed some relative improvement in regression under the expanded scenarios, these gains were not sufficient to surpass the best hydrochemical-only result. Similarly, RF demonstrated stronger stability in the classification task when additional variables were introduced, but the best overall classification result still remained associated with Scenario 1. These findings suggest that the dominant groundwater quality signal in the present dataset is primarily hydrochemical rather than hydrogeological or spatial.
4.4. Model Interpretability
To strengthen interpretability, feature importance was analyzed using permutation importance and RF Gini importance. Across Scenario 1, both methods consistently identified TDS and Cl as the most influential variables, followed by K, Na, and SO4. This agreement between two independent importance measures strengthens the robustness of the conclusion that salinity- and mineralization-related parameters dominate model decisions.
In Scenario 2, Well_productivity appeared as an additional influential feature, although its contribution remained secondary to the major hydrochemical parameters. In Scenario 3, the hydrochemical variables continued to dominate, while the contribution of spatial coordinates remained limited. This indicates that the inclusion of geographic position did not substantially alter the underlying determinants of model behavior.
Figure 5 is especially important because it consolidates the interpretability results of all three scenarios into a single comparative view. Unlike separate scenario-specific importance plots, this combined figure directly supports the central conclusion that the dominant predictors remain largely unchanged even when auxiliary well and spatial variables are added.
Overall, the interpretability analysis confirms that groundwater quality variation in the study area is controlled primarily by salinity-related hydrochemical variables, whereas auxiliary well and spatial variables contribute comparatively less to predictive performance.
5. Conclusions
This study proposed an integrated framework for groundwater quality assessment and prediction in Diyala Governorate, Iraq, by combining the Entropy-Weighted Water Quality Index (EWQI) with machine learning models. After preprocessing, 853 groundwater samples were retained for analysis. The EWQI was calculated from ten major hydrochemical parameters using entropy-derived weights and Iraqi drinking water standards as the regulatory basis.
The hydrochemical analysis revealed substantial variation in groundwater quality across the study area, with a considerable proportion of wells falling within the median to extremely poor quality classes. The descriptive statistics, exceedance rates, and entropy-derived weights collectively indicated that salinity- and mineralization-related parameters, particularly TDS, Cl, Na, K, and SO4, play a dominant role in groundwater quality deterioration.
From the machine learning perspective, SVM achieved the best overall performance in the hydrochemical-only scenario for both continuous EWQI prediction and categorical EWQI class prediction. RF also demonstrated strong and stable performance, particularly when additional well and spatial variables were included. However, the overall results consistently showed that the hydrochemical-only scenario was sufficient to achieve the best predictive performance, indicating that the principal signal required for groundwater quality modeling is already contained within the hydrochemical profile of the wells.
The feature-importance analysis further reinforced this conclusion by showing that the same salinity-related variables dominated model decisions across all feature scenarios. This strengthens the scientific consistency of the study by linking hydrochemical interpretation and machine learning behavior within a unified analytical framework.
Overall, the integration of EWQI with machine learning provides a robust, interpretable, and practically useful framework for rapid groundwater quality screening, well prioritization, and monitoring support in Diyala Governorate. Future work may extend this framework by incorporating temporal observations, additional hydrogeological and environmental variables, remote sensing data, and external validation in neighboring regions to improve generalizability and long-term operational applicability.
Author Contributions
Conceptualization, A.Q.K.; methodology, A.Q.K.; software, A.Q.K.; formal analysis, A.Q.K.; investigation, A.Q.K. and Q.K.N.A.; resources, Q.K.N.A.; data curation, A.Q.K. and Q.K.N.A.; writing—original draft preparation, A.Q.K.; writing—review and editing, A.L.S.A.-K., R.Y. and H.M.; visualization, A.Q.K. and A.L.S.A.-K.; supervision, R.Y. and H.M. All authors have read and agreed to the published version of the manuscript.
Funding
This research received no external funding.
Institutional Review Board Statement
Not applicable.
Informed Consent Statement
Not applicable.
Data Availability Statement
The original contributions presented in this study are included in the article. Further inquiries can be directed to the corresponding author.
Conflicts of Interest
Author Ahmed Lateef Salih Al-Karawi is employed by Defne Telekomünikasyon A.Ş. The remaining authors declare that the research was conducted in the absence of any commercial or financial relationships that could be construed as a potential conflict of interest.
Abbreviations
The following abbreviations are used in this manuscript:
| EWQI | Entropy-Weighted Water Quality Index |
| WQI | Water Quality Index |
| GWQI | Groundwater Quality Index |
| IQS | Iraqi Standards for Drinking Water |
| ML | Machine learning |
| SVM | Support Vector Machine |
| SVR | Support Vector Regression |
| SVC | Support Vector Classification |
| RF | Random Forest |
| BP-MLP | Backpropagation Multilayer Perceptron |
| CNN | Convolutional Neural Network |
| 1D-CNN | One-Dimensional Convolutional Neural Network |
| RMSE | Root Mean Square Error |
| MAE | Mean Absolute Error |
| EC | Electrical Conductivity |
| TDS | Total Dissolved Solids |
| WL | Water Level |
| RBF | Radial Basis Function |
| ROC | Receiver Operating Characteristic |
| AUC | Area Under the Curve |
References
- Henry, M. Water and the Origin of Life. Water 2024, 16, 2854. [Google Scholar] [CrossRef]
- Makanda, K.; Nzama, S.; Kanyerere, T. Assessing the Role of Water Resources Protection Practice for Sustainable Water Resources Management: A Review. Water 2022, 14, 3153. [Google Scholar] [CrossRef]
- Al-Zubedi, A.S. Groundwater in Iraq; Araa Publication: Baghdad, Iraq, 2022; Available online: https://isbniraq.org/product/groundwater-in-iraq/.
- Yaseen, Z.M.; Sulaiman, S.O.; Sharif, A. The Nature of Tigris–Euphrates Rivers Flow: Current Status and Future Prospective. In Tigris and Euphrates Rivers: Their Environment from Headwaters to Mouth; 2021; pp. 229–242. [Google Scholar] [CrossRef]
- Jalut, Q.H.; Abbas, N.L.; Mohammad, A.T. Management of Groundwater Resources in the Al-Mansourieh Zone in the Diyala River Basin in Eastern Iraq. Groundw. Sustain. Dev. 2018, 6, 79–86. [Google Scholar] [CrossRef]
- Al-Sudani, H.I.Z. Groundwater Utilization and Water Quality in Khanaqin District, Diyala Governorate, Northeast of Iraq. Resour. Environ. Inf. Eng. 2024, 6, 305–312. Available online: https://www.syncsci.com/journal/REIE/article/view/REIE.2024.03.005. [CrossRef]
- Mahmood, M.A.; Abdullah, M.A.; Baider, A.A. Hydraulic Characteristics of Groundwater of Khanaqin Sub-Basin, Diyala Governorate, Northeast of Iraq. Iraqi Natl. J. Earth Sci. 2025, 25, 102–122. [Google Scholar] [CrossRef]
- Huseen, M.R.; Abed, B.S. Groundwater Simulation and Wells Distribution at Qazaniyah City in Diyala Governorate. J. Eng. 2020, 26, 95–113. [Google Scholar] [CrossRef]
- Akilabi, J.A.H.; Alkhlidy, Q.K.N.; Khaleefa, N.H. Water Quality Evaluation of Selected Springs in Qazania Area, Diala Governorate, East Iraq. Iraqi Geol. J. 2021, 54, 112–121. [Google Scholar] [CrossRef]
- Hashim, N.S.; Mutashar, N.S.; Jameel, H.T.; Mahmood, S.M. A Comparative Study to Analyze the Validity of Well Water for Some Areas of Eastern and Western Diyala Governorate 10.21070/acopen.9.2024.9848. Academia Open 2024, 9. [Google Scholar] [CrossRef]
- Aswad, A.H.; Rashed, M.A.; Mahdi, L.E.; Al-Dainey, M.T.; Fahmi, A.H. Assessment of Ground Water Suitability for Different Purpose in Some Wells Diyala. Ann. Rom. Soc. Cell Biol. 2021, 25, 577–585. Available online: https://www.annalsofrscb.ro/index.php/journal/article/view/1117.
- Abbas, N.; Wasimi, S.A.; Al-Ansari, N. Impacts of Climate Change on Water Resources in Diyala River Basin, Iraq. J. Civ. Eng. Archit. 2016, 10, 1059–1074. [Google Scholar] [CrossRef]
- Al-Ansari, N.; Saleh, S.; Abdullah, T.; Abed, S.A. Quality of Surface Water and Groundwater in Iraq. Earth Sci. Geotech. Eng. 2021, 11, 161–199. [Google Scholar] [CrossRef]
- Abdulameer, L.; Nama, A.H.; Al-Shammari, M.M.A.; Al Maimuri, N.M.L.; Rashid, F.L.; Al-Dujaili, A.N. Sustaining Iraq’s Hidden Resource: A Review of the Strategies for Effective Groundwater Management. Water Conserv. Manag. 2025, 9, 120–131. [Google Scholar] [CrossRef]
- Huang, X.; Yao, R.; Zhang, Y.; Li, X.; Yu, Z.; Guo, H. Data-Driven Prediction Modeling of Groundwater Quality Using Integrated Machine Learning in Pinggu Basin, China. J. Hydrol. Reg. Stud. 2025, 62, 102812. [Google Scholar] [CrossRef]
- Niazkar, M.; Piraei, R.; Goodarzi, M.R.; Abedi, M.J. Comparative Assessment of Machine Learning Models for Groundwater Quality Prediction Using Various Parameters. Environ. Processes 2025, 12, 10. [Google Scholar] [CrossRef]
- Sarker, M.A.R.; Chowdhury, M.A.H.; Haque, M.T.; Rahman, M.M.; Meftaul, I.M.; Jubayer, M.F. From Data to Decision: Leveraging Machine Learning and Water Quality Index for Groundwater Quality Evaluation. Sustain. Water Resour. Manag. 2025, 11, 102. [Google Scholar] [CrossRef]
- Krishnamoorthy, L.; Lakshmanan, V.R. Groundwater Quality Assessment Using Machine Learning Models: A Comprehensive Study on the Industrial Corridor of a Semi-Arid Region. Environ. Sci. Pollut. Res. 2025, 32, 28319–28342. [Google Scholar] [CrossRef]
- Karunanidhi, D.; Raj, M.R.H.; Roy, P.D.; Subramani, T. Integrated Machine Learning Based Groundwater Quality Prediction through Groundwater Quality Index for Drinking Purposes in a Semi-Arid River Basin of South India. Environ. Geochem. Health 2025, 47, 119. [Google Scholar] [CrossRef]
- Maleky, S.; Faraji, M.; Hashemi, M.; Esfandyari, A. Investigation of Groundwater Quality Indices and Health Risk Assessment of Water Resources of Jiroft City, Iran, by Machine Learning Algorithms. Appl. Water Sci. 2025, 15, 43. [Google Scholar] [CrossRef]
- Xie, Z.; Liu, W.; Chen, S.; Yao, R.; Yang, C.; Zhang, X.; Li, J.; Wang, Y.; Zhang, Y. Machine Learning Approaches to Identify Hydrochemical Processes and Predict Drinking Water Quality for Groundwater Environment in a Metropolis. J. Hydrol. Reg. Stud. 2025, 58, 102227. [Google Scholar] [CrossRef]
- Sahour, S.; Khanbeyki, M.; Gholami, V.; Sahour, H.; Kahvazade, I.; Karimi, H. Evaluation of Machine Learning Algorithms for Groundwater Quality Modeling. Environ. Sci. Pollut. Res. 2023, 30, 46004–46021. [Google Scholar] [CrossRef]
- Mahdi, L.M.J.; Abood, M.H.; Mohammed, Z.T. Statistical Analysis of the Correlation between Land Surface Temperature and Terrain Elements in Diyala Governorate Using Remote Sensing Techniques. In IOP Conference Series: Earth and Environmental Science; IOP Publishing, 2025; Vol. 1545, p. 012127. [Google Scholar] [CrossRef]
- Abdullah, I.; Awadh, S. Quality Assessment and Hydrochemical Facies of Groundwater in Al-Qarma District, West of Baghdad, Iraq: Implications for Drinking and Irrigation. Iraqi Geol. J. 2025, 58, 139–154. [Google Scholar] [CrossRef]
- Bedolla-Rivera, H.I.; del Carmen González-Rosillo, M. Developing a Groundwater Quality Assessment in Mexico: A GWQI-Machine Learning Model. Hydrology 2025, 12, 285. [Google Scholar] [CrossRef]
- Tian, J.; Yang, J.; Liu, W.; Zhang, M.; Daskalopoulou, K.; Zou, Y.; Xu, N.; Liao, Z.; Huo, Y.; Zhu, Y. Assessing Groundwater Quality for Drinking and Irrigation Using Hydrogeochemistry and Machine Learning in Northern China. Agric. Water Manag. 2025, 322, 109975. [Google Scholar] [CrossRef]
- Koukaras, P.; Tjortjis, C. Data Preprocessing and Feature Engineering for Data Mining: Techniques, Tools, and Best Practices. AI 2025, 6, 257. [Google Scholar] [CrossRef]
- Joel, L.O.; Doorsamy, W.; Paul, B.S. A Comparative Study of Imputation Techniques for Missing Values in Healthcare Diagnostic Datasets. Int. J. Data Sci. Anal. 2025, 20, 6357–6373. [Google Scholar] [CrossRef]
- Malakouti, S.M.; Menhaj, M.B.; Suratgar, A.A. The Usage of 10-Fold Cross-Validation and Grid Search to Enhance ML Methods Performance in Solar Farm Power Generation Prediction. Clean. Eng. Technol. 2023, 15, 100664. [Google Scholar] [CrossRef]
- Aytekin, M.; Ediş, S.; Kaya, İ. A Hybrid PCA-TOPSIS and Machine Learning Approach to Basin Prioritization for Sustainable Land and Water Management. Water 2026, 18, 5. [Google Scholar] [CrossRef]
- Lokman, A.; Ismail, W.Z.W.; Aziz, N.A.A. A Review of Water Quality Forecasting and Classification Using Machine Learning Models and Statistical Analysis. Water 2025, 17, 2243. [Google Scholar] [CrossRef]
- Wolak, W.; Plichta, A.; Orlicki, H. Interpretable Ensemble Learning for Tumor-Type Prediction with a SHAP-Based Evaluation of CatBoost and Voting Classifiers. Sci. Rep. 2026, 16, 1401. [Google Scholar] [CrossRef] [PubMed]
- Martínez-García, J.; Montaño, J.J.; Jiménez, R.; Gervilla, E.; Cajal, B.; Núñez, A.; Leguizamo, F.; Sesé, A. Decoding Artificial Intelligence: A Tutorial on Neural Networks in Behavioral Research. Clin. Health 2025, 36, 77–95. [Google Scholar] [CrossRef]
- Hussain, M.Z.; Hanapi, Z.M.; Abdullah, A.; Hussin, M.; Ninggal, M.I.H. Hybrid-CNNTree: A Convolutional Neural Network and Decision Tree Fusion Model for Wormhole Attack Detection. IEEE Access 2025, 13, 186811–186833. [Google Scholar] [CrossRef]
- Rahman, A.; Ali, M.H.; Malik, A.W.; Mahmood, M.A.; Liou, F. Physics-Based Machine Learning Framework for Predicting Structure–Property Relationships in DED-Fabricated Low-Alloy Steels. Metals 2025, 15, 965. [Google Scholar] [CrossRef]
- Kassem, A.; Sefelnasr, A.; Ebraheem, A.A.; Ali, L.; Baig, F.; Sherif, M. Machine Learning-Based Prediction and Classification of Seawater Intrusion in the Hyper-Arid Coastal Aquifer of Fujairah, UAE. J. Hydrol. Reg. Stud. 2025, 61, 102664. [Google Scholar] [CrossRef]
Figure 1.
Integrated methodological workflow for EWQI-based groundwater quality modeling.

Figure 2.
Study area and spatial distribution of groundwater wells in Diyala Governorate, Iraq.

Figure 3.
Comparison of regression performance of machine learning models across the three feature scenarios based on RMSE.
Figure 3.
Comparison of regression performance of machine learning models across the three feature scenarios based on RMSE.

Figure 4.
Comparison of classification performance of machine learning models across the three feature scenarios based on Macro-F1.
Figure 4.
Comparison of classification performance of machine learning models across the three feature scenarios based on Macro-F1.

Figure 5.
Comparison of feature importance across the three feature scenarios based on permutation importance and RF Gini importance.
Figure 5.
Comparison of feature importance across the three feature scenarios based on permutation importance and RF Gini importance.


Table 1.
Groundwater quality classification based on EWQI.
| Rank | EWQI Range | Classification |
|---|---|---|
| I | Excellent quality water | |
| II | 50–100 | Good quality water |
| III | 100–150 | Median quality water |
| IV | 150–200 | Poor quality water |
| V | Extremely poor quality water |
Table 2.
Distribution of samples across EWQI classes.
| No. | EWQI_Class | Count |
|---|---|---|
| 1 | Good | 247 |
| 2 | Excellent | 225 |
| 3 | Extremely Poor | 192 |
| 4 | Median | 132 |
| 5 | Poor | 57 |
Table 3.
Descriptive statistics of groundwater quality parameters, Iraqi standard limits, exceedance rates, and entropy-derived weights.
Table 3.
Descriptive statistics of groundwater quality parameters, Iraqi standard limits, exceedance rates, and entropy-derived weights.
| Parameter | Min | Max | Mean | Std | Limit () | Out of Limit (%) | Weight () |
|---|---|---|---|---|---|---|---|
| pH | 7.09 | 7.90 | 7.2078 | 0.0643 | 6.5–8.5 | 0.00 | 0.209779 |
| TDS (ppm) | 260 | 15584 | 2406.7960 | 2361.3240 | 1000 | 68.58148 | 0.098124 |
| K (ppm) | 0.1 | 320 | 27.1508 | 45.8696 | 12 | 28.48769 | 0.077403 |
| Na (ppm) | 31 | 2162 | 357.0469 | 356.1764 | 200 | 53.34115 | 0.118096 |
| Mg (ppm) | 10 | 1194 | 143.7315 | 149.8041 | 100 | 45.25205 | 0.062903 |
| Ca (ppm) | 25 | 1492 | 232.7327 | 221.4152 | 150 | 50.99648 | 0.094106 |
| Cl (ppm) | 60 | 3223 | 515.2345 | 499.0093 | 250 | 56.74091 | 0.105907 |
| SO4 (ppm) | 10 | 4593 | 797.9918 | 769.5791 | 400 | 69.16764 | 0.127304 |
| HCO3 (ppm) | 6 | 2501 | 291.5006 | 347.5571 | 250 | 33.29426 | 0.075755 |
| NO3 (ppm) | 0 | 9 | 1.0341 | 0.7761 | 50 | 0.00 | 0.030624 |
Table 4.
Regression performance of machine learning models across the three feature scenarios.
| Scenario | Model | RMSE | MAE | |
|---|---|---|---|---|
| S1 | SVM | 4.1386 | 0.9297 | 0.9991 |
| S1 | BP-MLP | 5.0328 | 3.3509 | 0.9987 |
| S1 | RF | 8.1241 | 3.2019 | 0.9966 |
| S1 | CNN | 9.8056 | 5.6141 | 0.9951 |
| S2 | BP-MLP | 5.0520 | 3.5053 | 0.9987 |
| S2 | SVM | 6.1633 | 1.7722 | 0.9981 |
| S2 | RF | 8.2142 | 3.2709 | 0.9965 |
| S2 | CNN | 11.9060 | 8.3256 | 0.9927 |
| S3 | BP-MLP | 6.0866 | 4.1269 | 0.9981 |
| S3 | SVM | 7.5198 | 2.2760 | 0.9971 |
| S3 | RF | 8.2551 | 3.3523 | 0.9965 |
| S3 | CNN | 17.8854 | 12.0662 | 0.9836 |
Table 5.
Classification performance of machine learning models across the three feature scenarios.
| Scenario | Model | Accuracy | Macro-F1 |
|---|---|---|---|
| S1 | SVM | 0.9708 | 0.9728 |
| S1 | CNN | 0.9708 | 0.9649 |
| S1 | RF | 0.9649 | 0.9609 |
| S1 | BP-MLP | 0.9240 | 0.8585 |
| S2 | RF | 0.9591 | 0.9551 |
| S2 | SVM | 0.9357 | 0.9452 |
| S2 | CNN | 0.8947 | 0.8494 |
| S2 | BP-MLP | 0.8772 | 0.8225 |
| S3 | RF | 0.9649 | 0.9609 |
| S3 | SVM | 0.9357 | 0.9336 |
| S3 | CNN | 0.9357 | 0.8742 |
| S3 | BP-MLP | 0.8889 | 0.8557 |
Disclaimer/Publisher’s Note: The statements, opinions and data contained in all publications are solely those of the individual author(s) and contributor(s) and not of MDPI and/or the editor(s). MDPI and/or the editor(s) disclaim responsibility for any injury to people or property resulting from any ideas, methods, instructions or products referred to in the content. |
© 2026 by the authors. Licensee MDPI, Basel, Switzerland. This article is an open access article distributed under the terms and conditions of the Creative Commons Attribution (CC BY) license (http://creativecommons.org/licenses/by/4.0/).
Copyright: This open access article is published under a Creative Commons CC BY 4.0 license, which permit the free download, distribution, and reuse, provided that the author and preprint are cited in any reuse.


