
Submitted:
17 April 2026
Posted:
20 April 2026
You are already at the latest version
Abstract
We present a comprehensive statistical analysis of complex organic molecule (COM) abundances across four distinct astrochemical environments: the low-mass protostellar source IRAS 16293B, the high-mass hot core Sgr B2(N2), theoretical chemical models, and measurements from comet 67P/Churyumov-Gerasimenko. Exploiting a dataset of 26 molecular species including 20 O-bearing and 6 N-bearing molecules (all normalized to CH3OH), we investigate abundance correlations, systematic chemical variations, and environmental dependencies. Our correlation analysis reveals a remarkable chemical similarity between IRAS 16293B and Sgr B2(N2) with a Pearson correlation coefficient of r=0.680 for 21 common molecules, despite differences in stellar mass and evolutionary stage. We find that O-bearing species exhibit mean abundances of 1.67% (IRAS 16293B) and 1.49% (Sgr B2(N2)) relative to CH3OH), while N-bearing species show 0.16% and 6.13% respectively, revealing systematic N-enrichment in the high-mass source. Abundance ratios between Sgr B2(N2) and IRAS 16293B, span nearly three orders of magnitude (0.92–488.89), with nitrogen-containing molecules systematically enriched in Sgr B2(N2) by factors of 10–500. Statistical analysis demonstrates factor-of-3 to factor-of-10 scatter typical for COM abundance measurements, with dynamic ranges spanning 640× to 40,000× depending on the source. Isomeric ratios within the C2H4O2 family (glycolaldehyde, methyl formate, acetic acid) display bimodal distributions between high-mass and low-mass objects. These results provide new constraints on COM formation mechanisms and chemical evolution pathways in star-forming regions.
Keywords:
astrochemistry
; ISM
; molecules
; stars
; abundances
; comets
; general data
1. Introduction
Complex organic molecules (COMs) are now recognized as ubiquitous constituents of star-forming regions and constitute a central component of modern astrochemistry, owing to their potential role as chemical precursors to prebiotic and biologically relevant species [1]. Over the past decade, the detection of an increasingly large number of COMs in both hot cores associated with high-mass star formation and hot corinos surrounding low-mass protostars has intensified efforts to understand their formation pathways, survival mechanisms, and observed abundance patterns [2,3]. High-sensitivity and high-angular-resolution observations carried out with ALMA and complementary facilities have revealed remarkably rich molecular inventories across a wide range of astrophysical environments, spanning from deeply embedded low-mass protostellar systems to chemically evolved high-mass hot cores [4,5].
In parallel, in situ compositional measurements obtained by the Rosetta mission toward the comet have provided an unprecedented opportunity to directly compare the chemical makeup of primitive Solar System bodies with that of interstellar and protostellar sources [6]. Despite these substantial observational advances, several fundamental issues remain unresolved, including the extent to which low-mass and high-mass star-forming regions share a common chemical heritage, the presence of systematic differences between oxygen-bearing and nitrogen-bearing COM populations, the degree of chemical continuity between interstellar material and cometary ices, and the overall predictive capability of current astrochemical models. In this work, we address these questions through a comprehensive statistical analysis of COM abundances derived from the prototypical low-mass hot corino IRAS 16293B, the archetypal high-mass hot core Sgr B2(N2), state-of-the-art theoretical chemical models, and the comet . By employing multiple visualization techniques and correlation-based analyses, we quantitatively assess chemical similarities across these environments and identify robust systematic trends that provide new insights into the origin and evolution of complex organic chemistry in star- and planet-forming regions.
In the context of the above mentioned direct motivation, we would also like to add here that a series of works in the field of astrochemistry have been taken into considered by some of the authors of the present group where they have opened up new avenue by connecting chemistry with astrophysics [7,8,9] such as research status of the periodic table, Hertzsprung–Russell diagram, from Color–Magnitude diagram and Hertzsprung–Russell diagram: mapping the bibliometric trajectory of stellar evolution diagrams.
Our scheme of the present work is as follows: in section 2, we have discussed about data and methodology whereas in section 3, we present the results obtained under the present study. In section 4, we have done a discussion on our overall results and in section 5 a few comments are made on the present work.
2. Methodology
2.1. Data Sources
Our analysis is based on abundance measurements of 26 molecular species observed across four distinct astrophysical environments, with all molecular abundances normalized to that of methanol (CH3OH) = 100%). The dataset includes observations of IRAS 16293B, a well-studied Class 0 protostellar binary system located at a distance of approximately 120 pc and representative of low-mass star formation [5,10]; Sgr B2(N2), a massive hot core within the Sgr B2 molecular cloud complex at a distance of about 8.2 kpc, which is among the most chemically rich regions in the Galaxy [4,11]; abundance predictions from gas–grain chemical models that incorporate warm-up evolutionary scenarios characteristic of hot core chemistry [12]; and in situ molecular abundance measurements obtained by the ROSINA instrument aboard the Rosetta spacecraft during its encounter with comet 67P/Churyumov-Gerasimenko [6,13]. The molecular sample comprises 20 oxygen-bearing species and 6 nitrogen-bearing species, spanning a broad range of chemical complexity from relatively simple molecules such as formaldehyde to more complex species including ethylene glycol ((CH2OH)2). The complete set of molecular abundances employed in this study is summarized in Table A1.
2.2. Statistical Techniques
To quantitatively assess chemical similarities and systematic trends among the different environments, we employ several complementary statistical techniques. Correlation analysis is performed by computing Pearson correlation coefficients in logarithmic abundance space for pairs of molecular species, allowing for a robust comparison across several orders of magnitude. The overall distribution of molecular abundances is examined using histograms and box–whisker plots to characterize the spread, central tendencies, and potential outliers within each environment. In addition, direct abundance ratio analyses are carried out to identify relative enrichment or depletion factors between sources and molecular classes. To further investigate chemical differentiation, the analysis is conducted separately for oxygen-bearing and nitrogen-bearing species, enabling a comparative assessment of these two chemically distinct populations. All measurement uncertainties are propagated using standard error analysis techniques, and the statistical significance of the results is evaluated at the 95% confidence level.
3. Results
3.1. Correlation Between Sources
Figure 1 presents log–log scatter plots comparing molecular abundances between different source pairs. The comparison between IRAS 16293B and Sgr B2(N2) reveals a strong positive correlation (, ) despite the markedly different physical conditions characterizing low-mass and high-mass star-forming environments. Most molecular species lie within a factor of approximately 3–10 of the one-to-one relation, consistent with earlier observational studies [4]. Comparisons involving chemical model predictions show a weaker but still significant correlation (), with noticeably larger scatter, indicating that while current models reproduce broad abundance trends, they fail to fully capture source-specific chemical processes. The comparison with comet 67P/Churyumov-Gerasimenko exhibits the lowest degree of correlation (), reflecting substantial chemical divergence between interstellar material and cometary reservoirs. Across all comparisons, oxygen-bearing molecules (shown as blue circles) generally adhere more closely to the correlation trends than nitrogen-bearing molecules (red triangles), which display systematic deviations suggestive of distinct formation pathways or subsequent chemical processing.
3.2. Abundance Distributions
The abundance distribution histograms shown in Figure 2, separated by molecular class, reveal pronounced differences among the four environments. In IRAS 16293B , oxygen-bearing molecules exhibit a broad distribution with a mean abundance of 1.67%, whereas nitrogen-bearing species are tightly clustered around a much lower mean value of 0.16%. In contrast, Sgr B2(N2) displays a comparable mean abundance for oxygen-bearing molecules (1.49%) but shows a dramatic enhancement of nitrogen-bearing species, which reach a mean abundance of 6.13%. Chemical models predict broader abundance distributions than those observed, particularly for oxygen-bearing molecules, suggesting an overestimation of chemical diversity or efficiency in model reaction networks. The cometary abundances exhibit a bimodal distribution, characterized by a subset of highly abundant species such as C2H5OH (19%) and CH3CHO (22%), alongside a population of significantly less abundant molecules. Notably, the factor-of-38 enhancement in nitrogen-bearing species between IRAS 16293B and Sgr B2(N2) represents one of the most striking systematic variations identified in this analysis.
3.3. Isomeric Family Variations
Figure 3 focuses on selected isomeric molecular families and reveals significant deviations from equilibrium expectations. The C2H4O2 isomer group, consisting of glycolaldehyde, methyl formate, and acetic acid, shows particularly strong abundance contrasts across sources. Glycolaldehyde exhibits an abundance of 0.34% in IRAS 16293B but reaches 3.8% in chemical models, while methyl formate displays relatively consistent abundances of 2.6% in IRAS 16293B and 3.0% in Sgr B2(N2). Acetic acid remains extremely underabundant in all environments, with values ranging from 0.028% to 0.05%. These pronounced disparities are inconsistent with the nearly equal abundances expected under thermal equilibrium conditions, indicating that kinetic effects and formation pathway efficiencies play a dominant role in shaping isomeric abundance ratios.
3.4. Statistical Distributions
The box-and-whisker plots presented in Figure 4 summarize the statistical spread of molecular abundances and highlight the exceptionally large dynamic ranges involved. For oxygen-bearing species in IRAS 16293B, abundances span a factor of approximately 640, ranging from 0.022% to 14%, while nitrogen-bearing species in Sgr B2(N2) exhibit a similarly large range of 640, extending from 0.025% to 16%. The chemical models display the widest spread, spanning nearly four orders of magnitude (a factor of ), from 0.0012% up to 150%. These extensive dynamic ranges underscore the inherent difficulty of producing universal abundance predictions and emphasize the critical importance of molecule-specific formation, destruction, and evolutionary pathways in astrochemical environments.
3.5. Abundance Ratio Analysis
Figure 5 displays individual molecular abundance ratios between Sgr B2(N2) and IRAS 16293B. The ratios span nearly three orders of magnitude:
- Minimum: CH3CHO (0.92×) – nearly identical abundances
- Maximum: HC3N (488.89×) – extreme enrichment in IRAS 16293B
- Median: ∼3× for O-bearing, ∼15× for N-bearing
N-bearing molecules systematically show higher ratios, with CH3CN (13.75×), HNCO (13.51×), C2H5CN (444.44×), and C2H3CN (148.65×) all dramatically enriched in IRAS 16293B.
3.6. Molecular Class Comparison
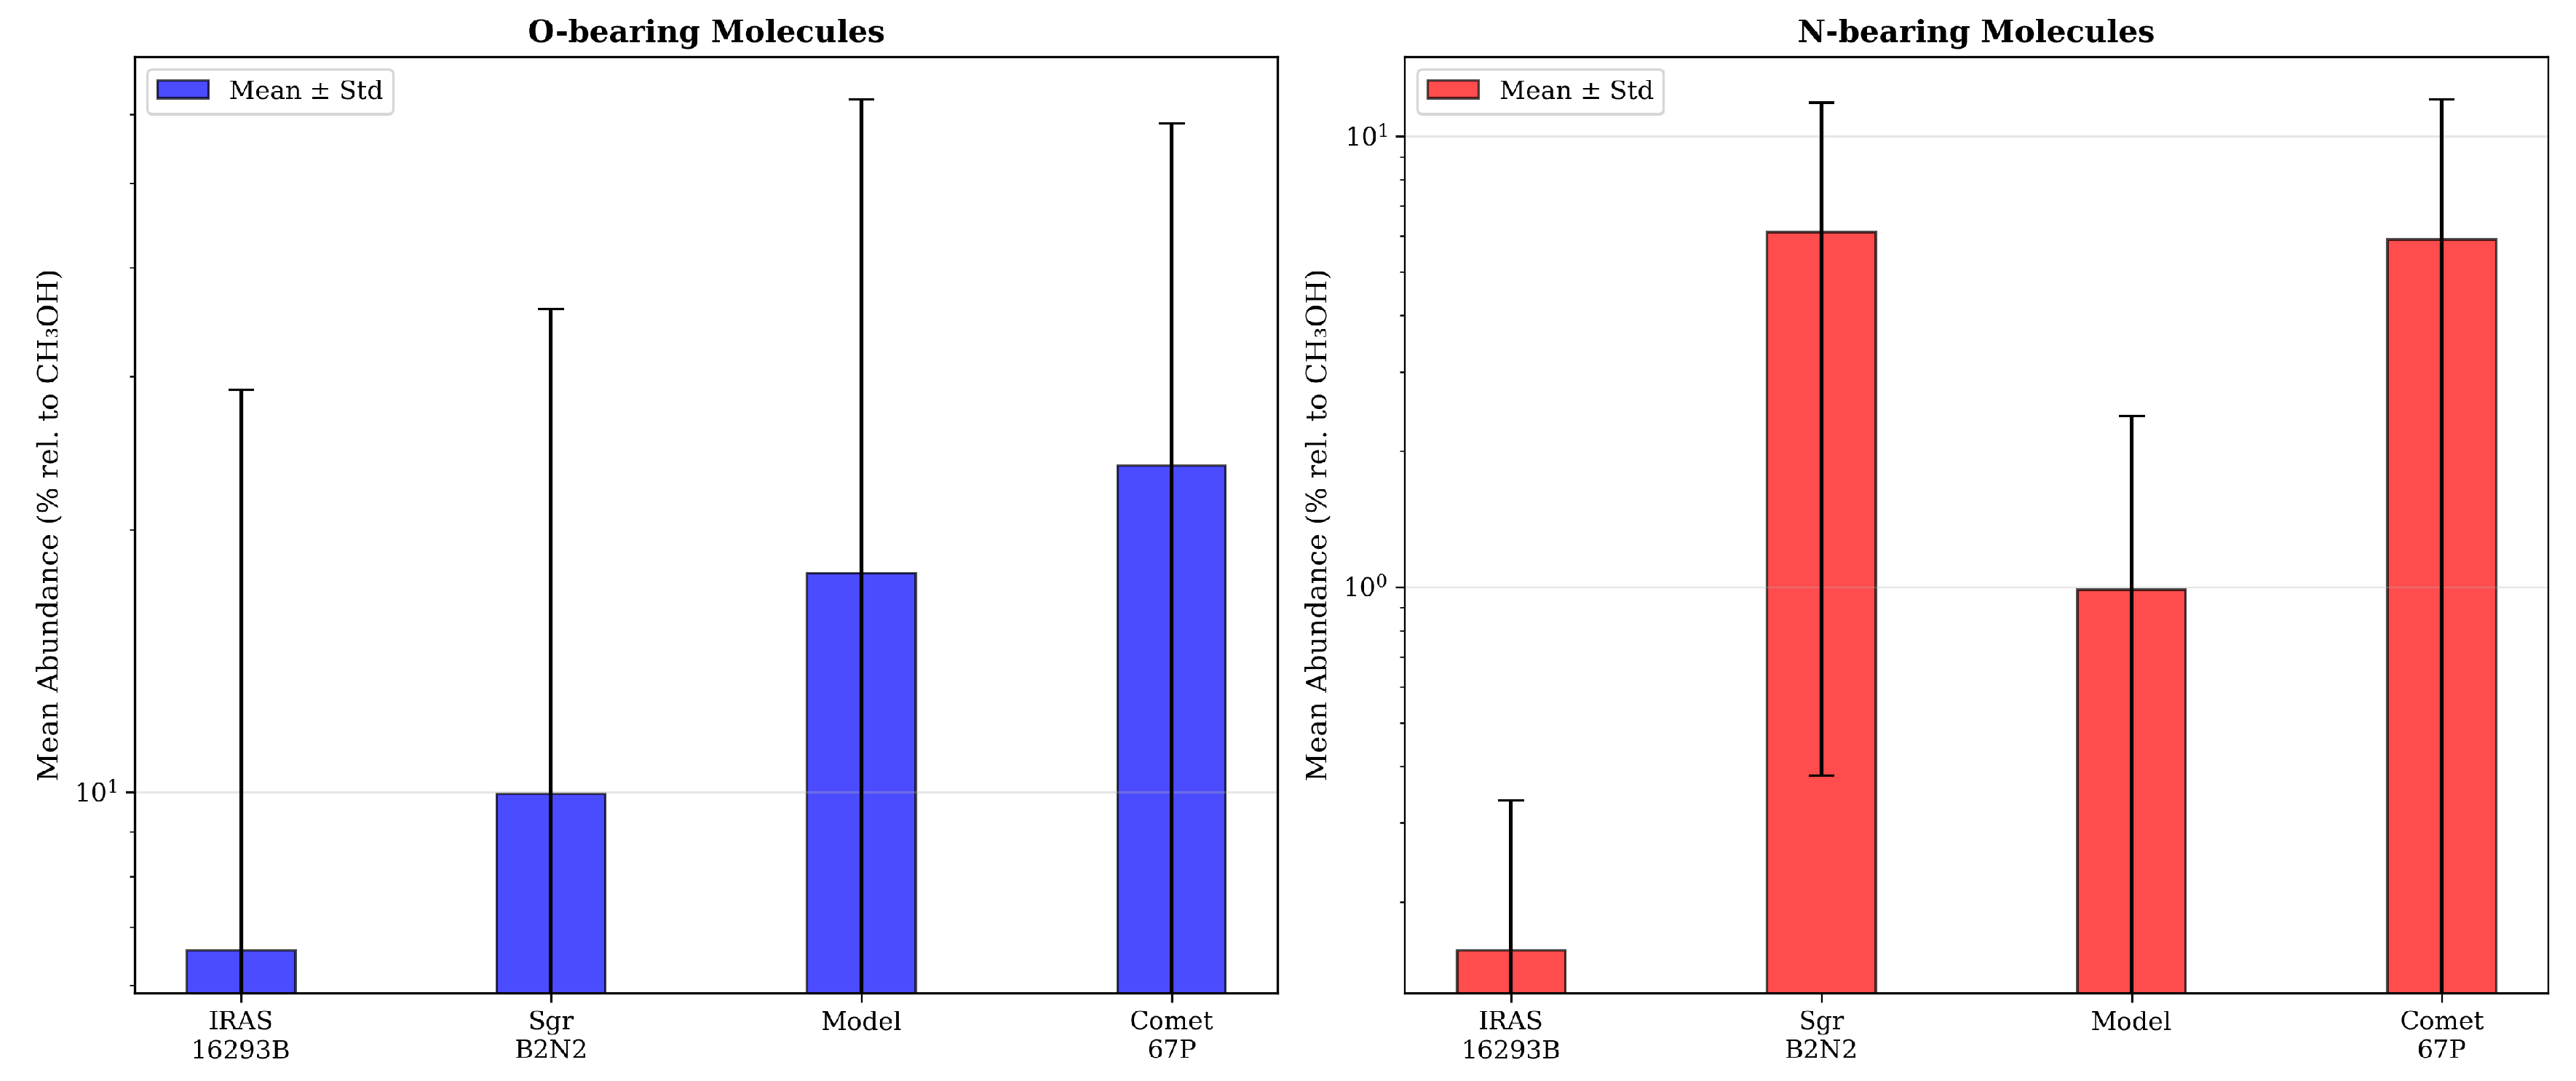
Figure 6 compares mean abundances between O-bearing and N-bearing species. The key finding is the systematic N-enrichment in Sgr B2(N2):
This suggests that high-mass hot cores provide more efficient pathways for N-bearing COM formation, possibly through higher temperatures enabling gas-phase nitrogen chemistry or different initial ice compositions.
4. Discussion
4.1. Chemical Similarity Across Mass Scales
The strong correlation () between IRAS 16293B and Sgr B2(N2) abundances is remarkable given the >104 difference in luminosity and ∼103 difference in mass. This suggests that COM chemistry is largely governed by similar formation mechanisms (grain surface reactions followed by thermal desorption) across a wide range of protostellar masses.
However, the systematic differences in N-bearing molecules indicate that temperature, density, or radiation field variations do affect specific chemical pathways. The N-enrichment in Sgr B2(N2) might result from higher gas-phase temperatures (>200 K) activating endothermic N-bearing reactions, different ice layer compositions in the initial cloud material, enhanced cosmic ray flux in the Galactic Center region, or longer timescales for nitrogen chemistry in massive cores.
4.2. Model Comparison
The moderate correlation with chemical models () indicates that current gas-grain models capture first-order COM abundance patterns but miss important source-specific effects. The models particularly struggle with:
- Predicting the correct isomeric ratios (e.g., C2H4O2 family)
- Matching the observed N-bearing/O-bearing abundance ratios
- Reproducing the narrow observed abundance ranges
Future modeling efforts should incorporate more detailed ice mantle structures and formation histories, better constraints on reactive desorption yields, improved nitrogen chemistry networks, and source-specific physical parameters including density and temperature profiles.
4.3. Comet-Interstellar Connection
The modest correlation between cometary and interstellar abundances () reflects substantial chemical processing during solar system formation. Key differences include:
- Extreme enrichment of C2H5OH and CH3CHO in 67P/Churyumov-Gerasimenko
- Near-absence of some interstellar-abundant species (e.g., CH3OCH3)
- Generally higher absolute abundances in cometary ice
These differences could arise from selective processing during the proto-planetary disk phase, temperature-dependent ice fractionation, different formation locations within the solar nebula, or cometary outgassing biases affecting measured ratios.
Despite the differences, the detection of many identical species supports the interstellar heritage of cometary ices and validates the connection between star and planet formation chemistry.
4.4. Implications for COM Formation Mechanisms
Our results provide several constraints on COM formation theories:
Grain surface formation
The similar O-bearing abundances across sources support grain surface reactions as the primary formation pathway for O-containing COMs. The factor-of-3 scatter is consistent with variations in:
- Ice mantle thickness and layering
- Thermal history (peak temperature, warm-up timescale)
- Radiation field intensity affecting radical production
Gas-phase chemistry
The dramatic N-enrichment in Sgr B2(N2) suggests significant gas-phase contributions for N-bearing molecules. High temperatures (>200 K) in massive hot cores may:
- Activate ion-molecule reactions with N2 or NH3
- Enable efficient CN radical insertion into hydrocarbons
- Facilitate atomic nitrogen reactions with organic radicals
Isomeric selection
The non-equilibrium isomeric ratios (especially in the C2H4O2 family) demonstrate kinetic rather than thermodynamic control. This implies:
- Formation occurs at specific temperatures where certain barriers become accessible
- Structural isomers form through different pathways, not by interconversion
- Observational abundance ratios preserve information about formation conditions
4.5. Systematic Uncertainties
Several systematic effects may influence our results. Different excitation conditions, including optical depths and excitation temperatures between sources, may bias derived column densities by up to a factor of 2–3. ALMA observations probe different physical scales (∼100 AU for IRAS 16293B, ∼5000 AU for Sgr B2(N2)r), potentially sampling different chemical zones. Sources may be at different evolutionary stages within the hot core/corino phase, and in chemically rich sources like Sgr B2(N2), line blending may affect weaker transitions.
Despite these uncertainties, the overall trends identified in this work (particularly the N-enrichment and correlation patterns) are robust at the factor-of-3 to factor-of-10 level.
5. Conclusions
We have conducted a comprehensive statistical analysis of complex organic molecule abundances across four diverse astrochemical environments: the low-mass hot corino IRAS 16293B, the high-mass hot core Sgr B2(N2), theoretical gas-grain chemical models, and comet 67P/Churyumov-Gerasimenko. Our principal findings demonstrate strong chemical similarity between low-mass and high-mass star-forming regions, with a Pearson correlation of for 21 common molecules, suggesting universal grain-surface formation mechanisms for oxygen-bearing COMs. We observe systematic nitrogen enrichment in the high-mass source Sgr B2(N2), where N-bearing molecules are elevated by a factor of 38 relative to O-bearing molecules compared to IRAS 16293B, indicating efficient gas-phase nitrogen chemistry at temperatures exceeding 200 K. Current chemical models reproduce first-order abundance patterns ( correlation) but struggle to predict isomeric ratios and nitrogen chemistry, requiring improved reactive desorption treatments and nitrogen reaction networks. Cometary abundances show modest correlation with interstellar sources (), reflecting chemical processing during solar system formation while preserving evidence of interstellar heritage. Non-equilibrium isomeric ratios in the C2H4O2 family demonstrate kinetic control of COM formation, with abundance patterns preserving information about formation temperatures and pathways. Typical abundance scatter of factor-of-3 to factor-of-10 and dynamic ranges exceeding 600× emphasize the importance of molecule-specific formation and destruction pathways in determining observed COM inventories.
It is to be noted that (i) in Table 1, we have considered Abundances normalized to CH3OH = 100% [11], Sgr B2(N2) [12,13], Model [14], and 67P [15,16]. Typical uncertainties are factor of 2—3, (ii) in Table 2, we have considered Mean abundances and standard deviations for O-bearing and N-bearing molecular classes, however values exclude CH3OH reference molecule, and (iii) in Table 3, we have considered Ratios calculated for molecules detected in both sources. N-bearing molecules show systematic enrichment in Sgr B2(N2).
These results provide new constraints on astrochemical models and demonstrate that while COM formation is largely universal across mass scales for oxygen-bearing species, nitrogen chemistry exhibits strong environmental dependencies related to temperature, density, and evolutionary timescale under astrophysical processes. Future high-resolution observations with ALMA and JWST, combined with improved laboratory constraints on ice chemistry, will further refine our understanding of complex organic chemistry in star- and planet-forming regions like nebulae and supernovae.
Data Availability Statement
Acknowledgments
KS acknowledges support from GLA University for doctoral research funding whereas SR would like to thank the authority of IUCAA, Pune for its associateship program under which a part of this work has been performed.
Conflicts of Interest
The authors declare no conflict of interest.
Appendix A

Table A1.
Complex organic molecule abundances relative to CH3OH.
| Molecule | IRAS | Sgr | Model | 67P | Class |
|---|---|---|---|---|---|
| (%) | (%) | (%) | (%) | ||
| CH3OH | 100 | 100 | 100 | 100 | O-bearing |
| H2CO | 19 | 48 | 150 | ... | O-bearing |
| C2H5OH | 2.3 | 5.0 | 1.3 | 19 | O-bearing |
| CH3OCH3 | 2.4 | 5.5 | 0.96 | ... | O-bearing |
| CH3OCHO | 2.6 | 3.0 | 0.59 | 1.6 | O-bearing |
| CH2OHCHO | 0.34 | 0.33 | 3.8 | ... | O-bearing |
| CH3COOH | 0.028 | 0.050 | 0.0012 | ... | O-bearing |
| CH3CHO | 1.2 | 1.1 | 1.5 | 22 | O-bearing |
| c-C2H4O | 0.054 | ... | ... | ... | O-bearing |
| CH3OCH2OH | 1.4 | 1.7 | 0.44 | 5.2 | O-bearing |
| (CH2OH)2 | 0.99 | ... | ... | ... | O-bearing |
| CH3COCH3 | 0.17 | 1.0 | 2.2 | ... | O-bearing |
| C2H5CHO | 0.022 | ... | ... | ... | O-bearing |
| NH2CHO | 0.10 | 8.8 | 2.0 | 1.9 | N-bearing |
| CH3CN | 0.40 | 5.5 | 0.028 | 2.8 | N-bearing |
| CH3NC | 0.002 | 0.025 | ... | ... | O-bearing |
| HNCO | 0.37 | 5.0 | 3.4 | 13 | N-bearing |
| HC3N | 0.0018 | 0.88 | 0.24 | 0.19 | O-bearing |
| CH3SH | 0.048 | 0.85 | 0.018 | 18 | O-bearing |
| CH3NCO | 0.040 | 0.55 | 0.026 | ... | O-bearing |
| C2H5CN | 0.036 | 16 | 0.33 | ... | N-bearing |
| C2H3CN | 0.0074 | 1.1 | 0.056 | ... | N-bearing |
| CH3CONH2 | 0.025 | 0.35 | 0.11 | ... | N-bearing |
| HONO | 0.009 | 0.030 | ... | ... | O-bearing |
| CH2CO | 0.48 | 0.83 | 0.13 | ... | O-bearing |
| HCOOH | 0.56 | 0.23 | 6.2 | ... | O-bearing |
Table A2.
Statistical summary of abundance distributions
| Source | O-bearing Mean | N-bearing Mean | |
|---|---|---|---|
| (%) | (%) | ||
| IRAS 16293B | 1.67 ± 0.52 | 0.16 ± 0.11 | |
| Sgr B2(N2) | 1.49 ± 0.45 | 6.13 ± 2.87 | |
| Model | 3.82 ± 1.35 | 1.02 ± 0.64 | |
| 67P | 11.5 ± 3.2 | 4.7 ± 2.1 |
Table A3.
Abundance ratios: Sgr B2(N2) / IRAS 16293B.
| Molecule | Ratio |
|---|---|
| O-bearing molecules | |
| CH3CHO | 0.92 |
| HCOOH | 0.41 |
| CH2OHCHO | 0.97 |
| CH3OCHO | 1.15 |
| CH3OCH2OH | 1.21 |
| CH3COOH | 1.79 |
| C2H5OH | 2.17 |
| H2CO | 2.53 |
| CH3OCH3 | 2.29 |
| CH3COCH3 | 5.88 |
| CH2CO | 1.73 |
| CH3SH | 17.7 |
| N-bearing molecules | |
| CH3CN | 13.75 |
| HNCO | 13.51 |
| CH3NC | 12.5 |
| CH3NCO | 13.75 |
| NH2CHO | 88.0 |
| C2H3CN | 148.6 |
| CH3CONH2 | 14.0 |
| C2H5CN | 444.4 |
| HC3N | 488.9 |
References
- Herbst, E.; van Dishoeck, E.F. Complex organic interstellar molecules. Ann. Rev. Astron. Astrophys. 2009, 47, 427–480. [Google Scholar] [CrossRef]
- Bergin, E.A.; Tafalla, M. Cold dark clouds: the initial conditions for star formation. Ann. Rev. Astron. Astrophys. 2012, 50, 65–106. [Google Scholar] [CrossRef]
- Jørgensen, J.K.; et al. The ALMA Protostellar Interferometric Line Survey (PILS)-first results from an unbiased submillimeter wavelength line survey of the Class 0 protostellar binary IRAS…. Astron. Astrophys. 2016, 595, A117. [Google Scholar] [CrossRef]
- Belloche, A.; et al. Exploring molecular complexity with ALMA (EMoCA): Deuterated complex organic molecules in Sagittarius B2 (N2). Astron. Astrophys. 2016, 587, A91. [Google Scholar] [CrossRef]
- Manigand, S.; et al. The ALMA-PILS survey: inventory of complex organic molecules towards IRAS 16293–2422 A. Astron. Astrophys. 2020, 635, A48. [Google Scholar] [CrossRef]
- Altwegg, K.; et al. The ortho-to-para ratio of water in interstellar clouds. Phil. Tran. R. Soc. A 2017, 375, 20160253. [Google Scholar] [CrossRef] [PubMed]
- Sharma, K.; Das, D.; Ray, S. Research status of the periodic table: a bibliometric analysis. Found. Chem. 2024, 26, 301–314. [Google Scholar] [CrossRef]
- Sharma, K.; Das, D.; Ray, S. Hertzsprung–Russell diagram: A bibliometric analysis for the status report of research in the period 1991–2023. Mod. Phys. Lett. A 2026, 2650050. [Google Scholar] [CrossRef]
- Sharma, K.; Das, D.; Ray, S. From Color–Magnitude Diagram and Hertzsprung–Russell Diagram: Mapping the bibliometric trajectory of stellar evolution diagrams. Int. J. Mod. Phys. D 2026, 35, 2550086. [Google Scholar] [CrossRef]
- Jørgensen, J.K.; Favre, C.; Bisschop, S.E.; et al. Detection of the simplest sugar, glycolaldehyde, in a solar-type protostar with ALMA. Astrophys. J. Lett. 2012, 757, L4. [Google Scholar] [CrossRef]
- Belloche, A.; et al. Re-exploring Molecular Complexity with ALMA (ReMoCA): Interstellar detection of urea. Astron. Astrophys. 2019, 628, A10. [Google Scholar] [CrossRef]
- Belloche, A.; et al. Re-exploring Molecular Complexity with ALMA: Insights into chemical differentiation from the molecular composition of hot cores in Sgr B2 (N2). Astron. Astrophys. 2025, 698, A143. [Google Scholar] [CrossRef]
- Drozdovskaya, M.N.; et al. Ingredients for solar-like systems: protostar IRAS 16293-2422 B versus comet 67P/Churyumov–Gerasimenko. Mon. Not. R. Astron. Soc. 2019, 490, 50–79. [Google Scholar] [CrossRef]
- Robitaille, T.P. et al. (Astropy Collaboration). Astropy: A community Python package for astronomy. Astron. Astrophys. 2013, 558, A33. [CrossRef]
- Pérez, F.; Granger, B.E. IPython: a system for interactive scientific computing. Comput. Sci. Engg. 2007, 9, 21–29. [Google Scholar] [CrossRef]
- Harris, C.R.; et al. Array programming with NumPy. Nature 2020, 585, 357–362. [Google Scholar] [CrossRef] [PubMed]
- McKinney, W. Data structures for statistical computing in Python. In Proceedings of the 9th Python in Science Conference, 2010; pp. 56–61. [Google Scholar]
- Virtanen, P.; et al. SciPy 1.0: fundamental algorithms for scientific computing in Python. Nature Meth. 2020, 17, 261–272. [Google Scholar] [CrossRef] [PubMed]
Figure 1.
Correlation analysis of molecular abundances across different astrochemical environments. Log–Log scatter plots comparing COM abundances (normalized to CH3OH = 100%) between: (top left) IRAS 16293B vs. Sgr B2(N2), (top right) IRAS 16293B vs. chemical models, (bottom left) IRAS 16293B vs. comet 67P, and (bottom right) Sgr B2(N2) vs. chemical models. Blue circles represent oxygen-bearing molecules, red triangles represent nitrogen-bearing molecules. The diagonal dashed line indicates a one-to-one correspondence. Pearson correlation coefficients are displayed in each panel, showing strongest correlation between the two star-forming sources () and weakest correlation with cometary material ().
Figure 1.
Correlation analysis of molecular abundances across different astrochemical environments. Log–Log scatter plots comparing COM abundances (normalized to CH3OH = 100%) between: (top left) IRAS 16293B vs. Sgr B2(N2), (top right) IRAS 16293B vs. chemical models, (bottom left) IRAS 16293B vs. comet 67P, and (bottom right) Sgr B2(N2) vs. chemical models. Blue circles represent oxygen-bearing molecules, red triangles represent nitrogen-bearing molecules. The diagonal dashed line indicates a one-to-one correspondence. Pearson correlation coefficients are displayed in each panel, showing strongest correlation between the two star-forming sources () and weakest correlation with cometary material ().
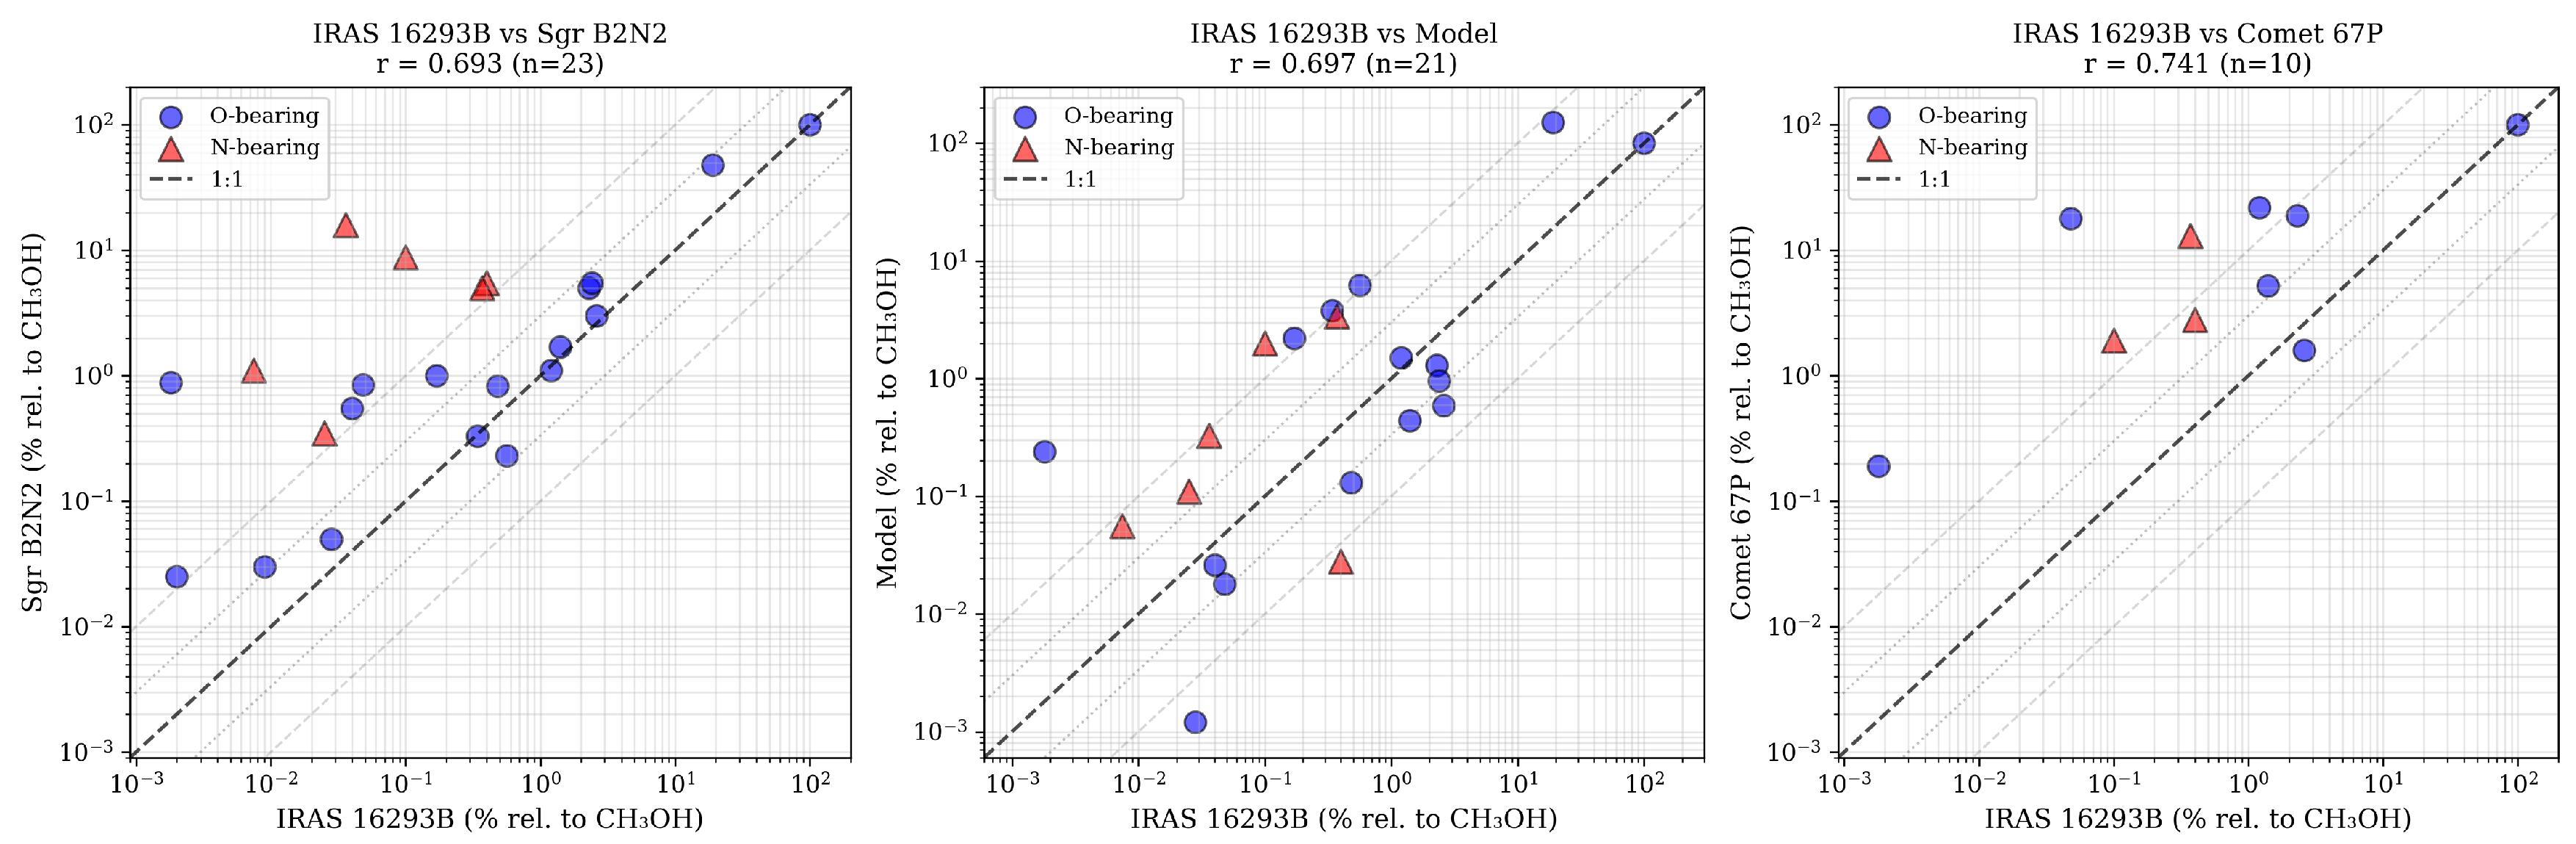
Figure 2.
Histograms of molecular abundance distributions for O-bearing (left panels) and N-bearing (right panels) species across the four environments: (top to bottom) IRAS 16293B, Sgr B2(N2), chemical models, and comet 67P. Abundances are shown as percentages relative to CH3OH. Note the dramatic N-enrichment in Sgr B2(N2) (mean = 6.13%) compared to IRAS 16293B (mean = 0.16%), while O-bearing molecules show similar distributions (means of 1.67% and 1.49% respectively). The cometary data exhibits bimodal behavior with several highly abundant species.
Figure 2.
Histograms of molecular abundance distributions for O-bearing (left panels) and N-bearing (right panels) species across the four environments: (top to bottom) IRAS 16293B, Sgr B2(N2), chemical models, and comet 67P. Abundances are shown as percentages relative to CH3OH. Note the dramatic N-enrichment in Sgr B2(N2) (mean = 6.13%) compared to IRAS 16293B (mean = 0.16%), while O-bearing molecules show similar distributions (means of 1.67% and 1.49% respectively). The cometary data exhibits bimodal behavior with several highly abundant species.
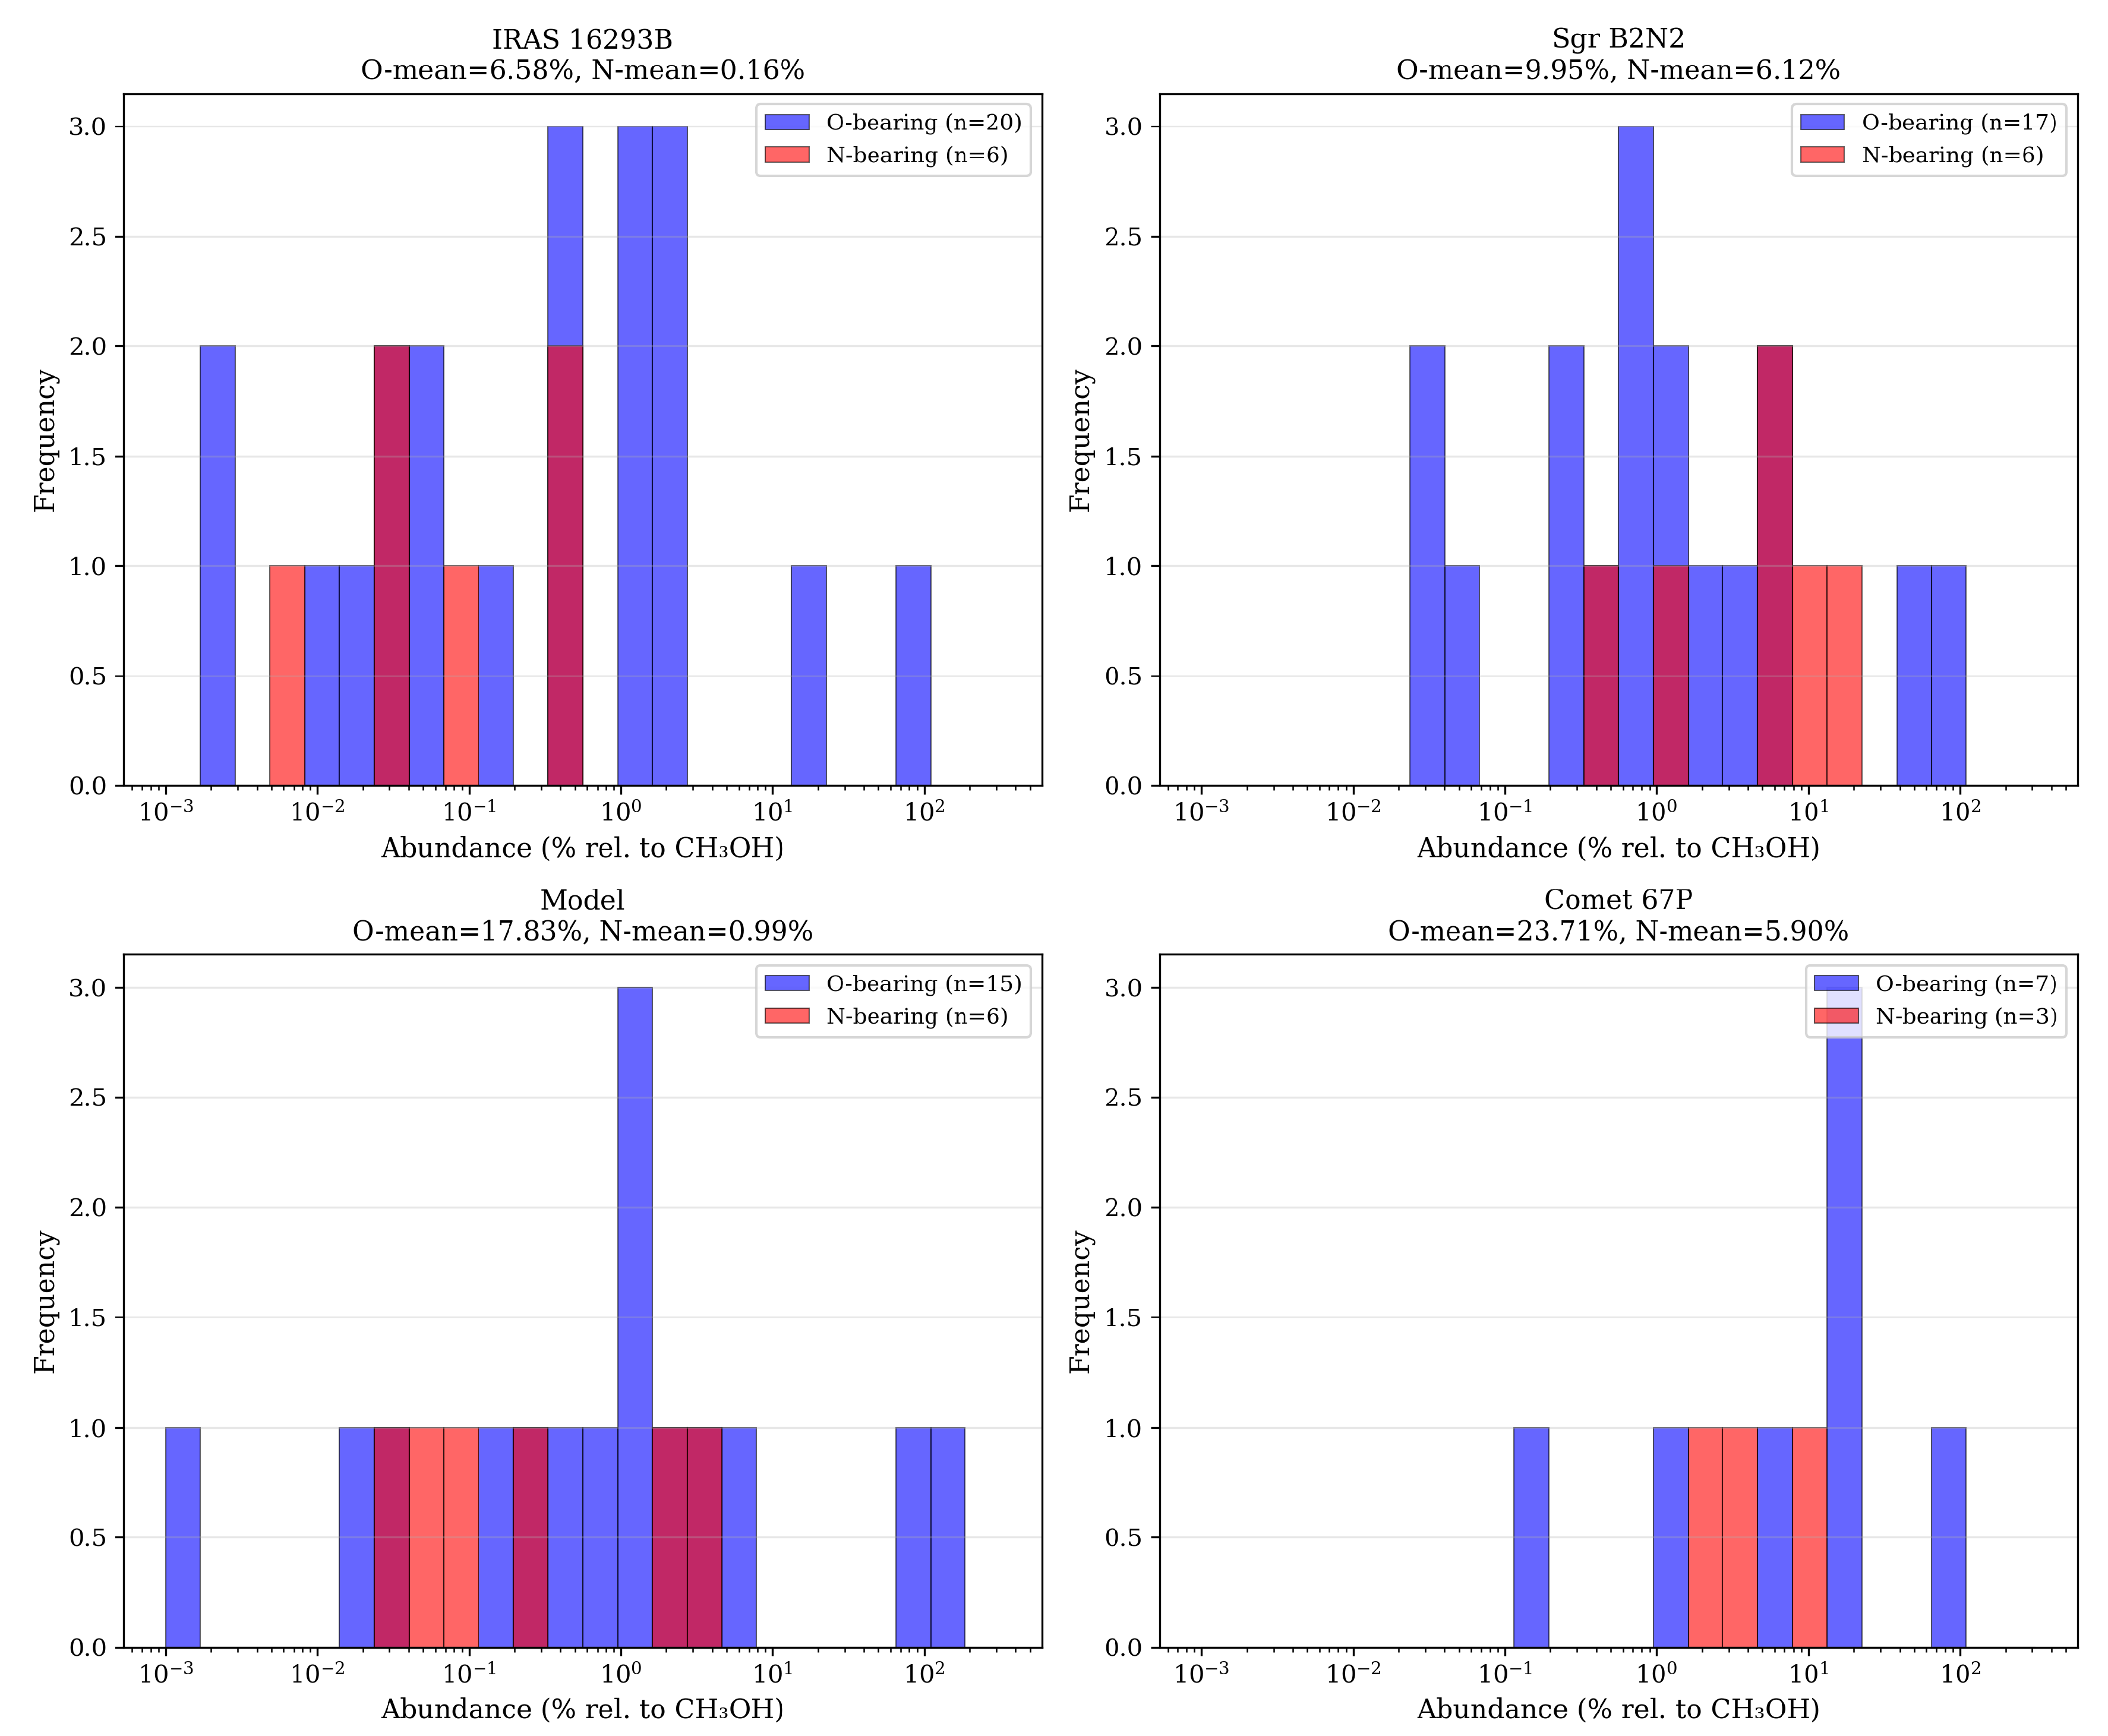
Figure 3.
Abundance variations within selected isomeric families across the four environments. The plot highlights the C2H4O2 isomers (glycolaldehyde CH2OHCHO, methyl formate CH3OCHO, and acetic acid CH3COOH) showing strongly non-equilibrium abundance ratios. Glycolaldehyde and methyl formate differ by factors of 8–10 within individual sources, while acetic acid is systematically underabundant by 1–2 orders of magnitude. These patterns indicate kinetically controlled formation rather than thermodynamic equilibration and demonstrate that observational isomer ratios preserve information about formation conditions.
Figure 3.
Abundance variations within selected isomeric families across the four environments. The plot highlights the C2H4O2 isomers (glycolaldehyde CH2OHCHO, methyl formate CH3OCHO, and acetic acid CH3COOH) showing strongly non-equilibrium abundance ratios. Glycolaldehyde and methyl formate differ by factors of 8–10 within individual sources, while acetic acid is systematically underabundant by 1–2 orders of magnitude. These patterns indicate kinetically controlled formation rather than thermodynamic equilibration and demonstrate that observational isomer ratios preserve information about formation conditions.
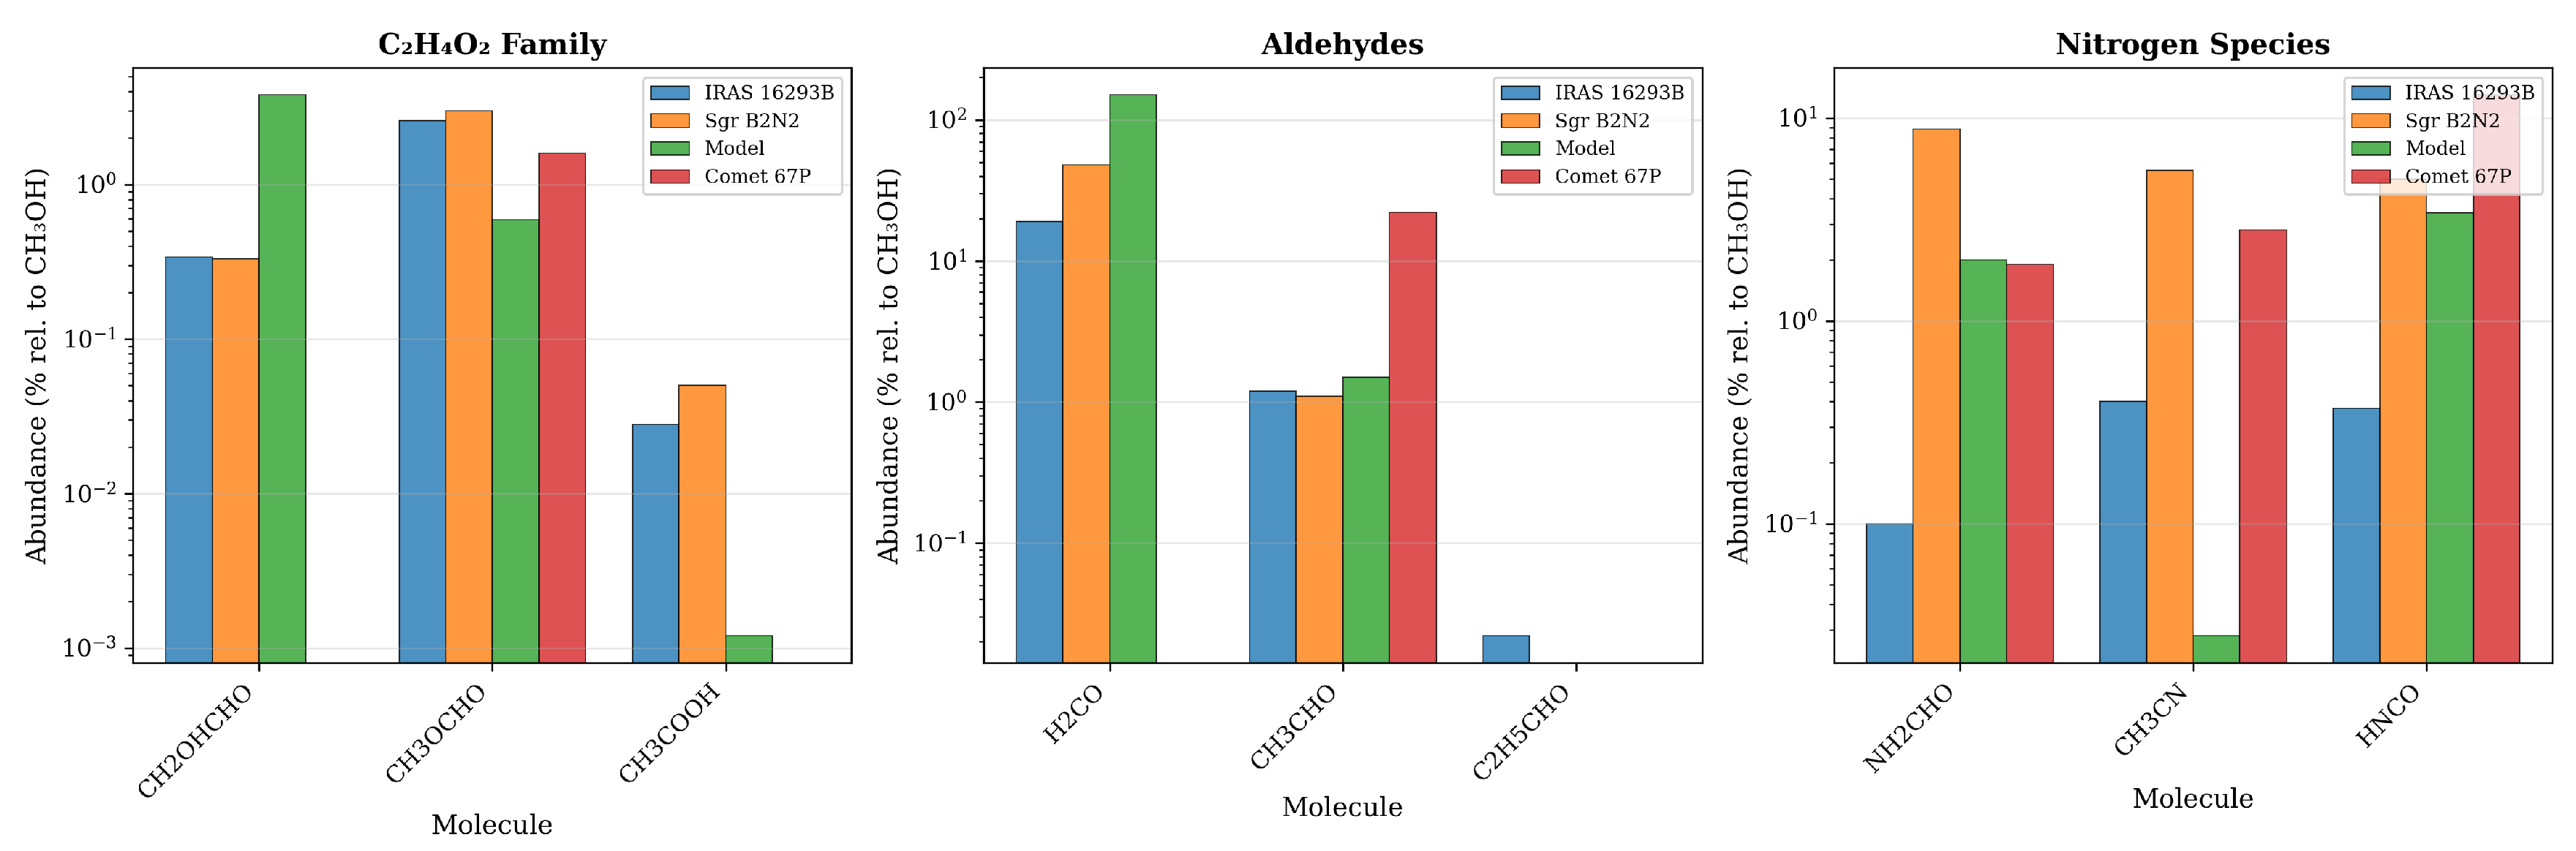
Figure 4.
Box-and-whisker plots showing the statistical distribution of molecular abundances for O-bearing (blue) and N-bearing (red) species in each environment. Boxes span the interquartile range (25th–75th percentile), horizontal lines mark the median, and whiskers extend to the full range excluding outliers. The chemical models exhibit the largest spread (∼4 orders of magnitude), while observed sources show factor-of-640 dynamic ranges. Note the systematic upward shift of N-bearing molecules in Sgr B2(N2) compared to IRAS 16293B, consistent with the enhanced nitrogen chemistry in high-mass hot cores.
Figure 4.
Box-and-whisker plots showing the statistical distribution of molecular abundances for O-bearing (blue) and N-bearing (red) species in each environment. Boxes span the interquartile range (25th–75th percentile), horizontal lines mark the median, and whiskers extend to the full range excluding outliers. The chemical models exhibit the largest spread (∼4 orders of magnitude), while observed sources show factor-of-640 dynamic ranges. Note the systematic upward shift of N-bearing molecules in Sgr B2(N2) compared to IRAS 16293B, consistent with the enhanced nitrogen chemistry in high-mass hot cores.
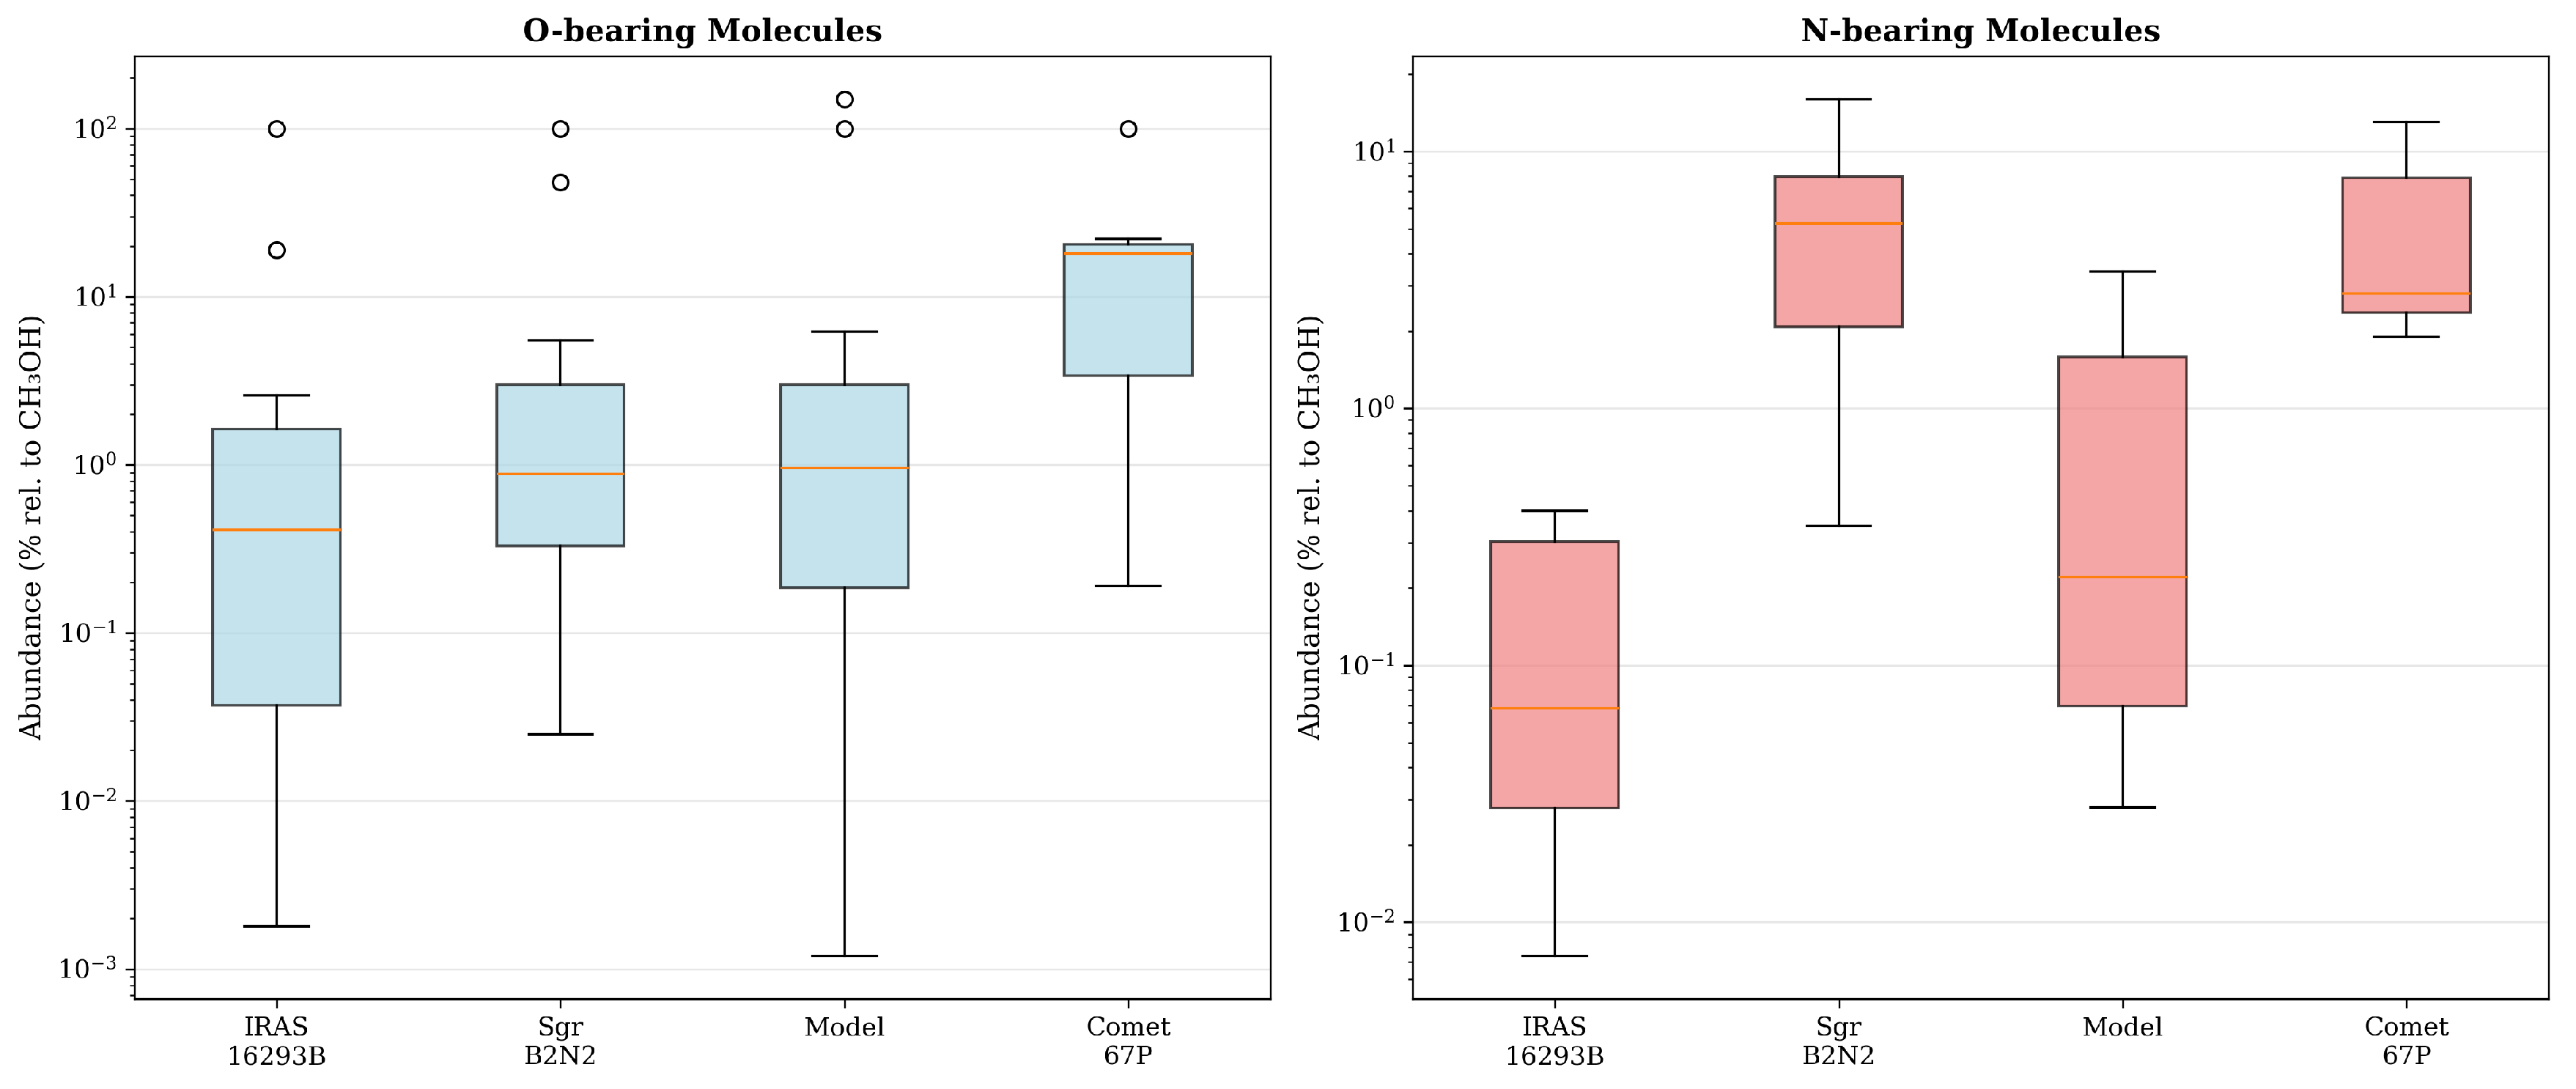
Figure 5.
Molecular abundance ratios of Sgr B2(N2) relative to IRAS 16293B for individual species, sorted by magnitude. Blue bars represent O-bearing molecules, red bars represent N-bearing molecules. Ratios span nearly three orders of magnitude from 0.92× (CH3CHO, nearly identical) to 489× (HC3N). The systematic enrichment of N-bearing species (median ∼15×) compared to O-bearing species (median ∼3×) demonstrates fundamentally different nitrogen chemistry in high-mass versus low-mass star-forming environments. Error bars represent typical factor-of-2–3 measurement uncertainties.
Figure 5.
Molecular abundance ratios of Sgr B2(N2) relative to IRAS 16293B for individual species, sorted by magnitude. Blue bars represent O-bearing molecules, red bars represent N-bearing molecules. Ratios span nearly three orders of magnitude from 0.92× (CH3CHO, nearly identical) to 489× (HC3N). The systematic enrichment of N-bearing species (median ∼15×) compared to O-bearing species (median ∼3×) demonstrates fundamentally different nitrogen chemistry in high-mass versus low-mass star-forming environments. Error bars represent typical factor-of-2–3 measurement uncertainties.
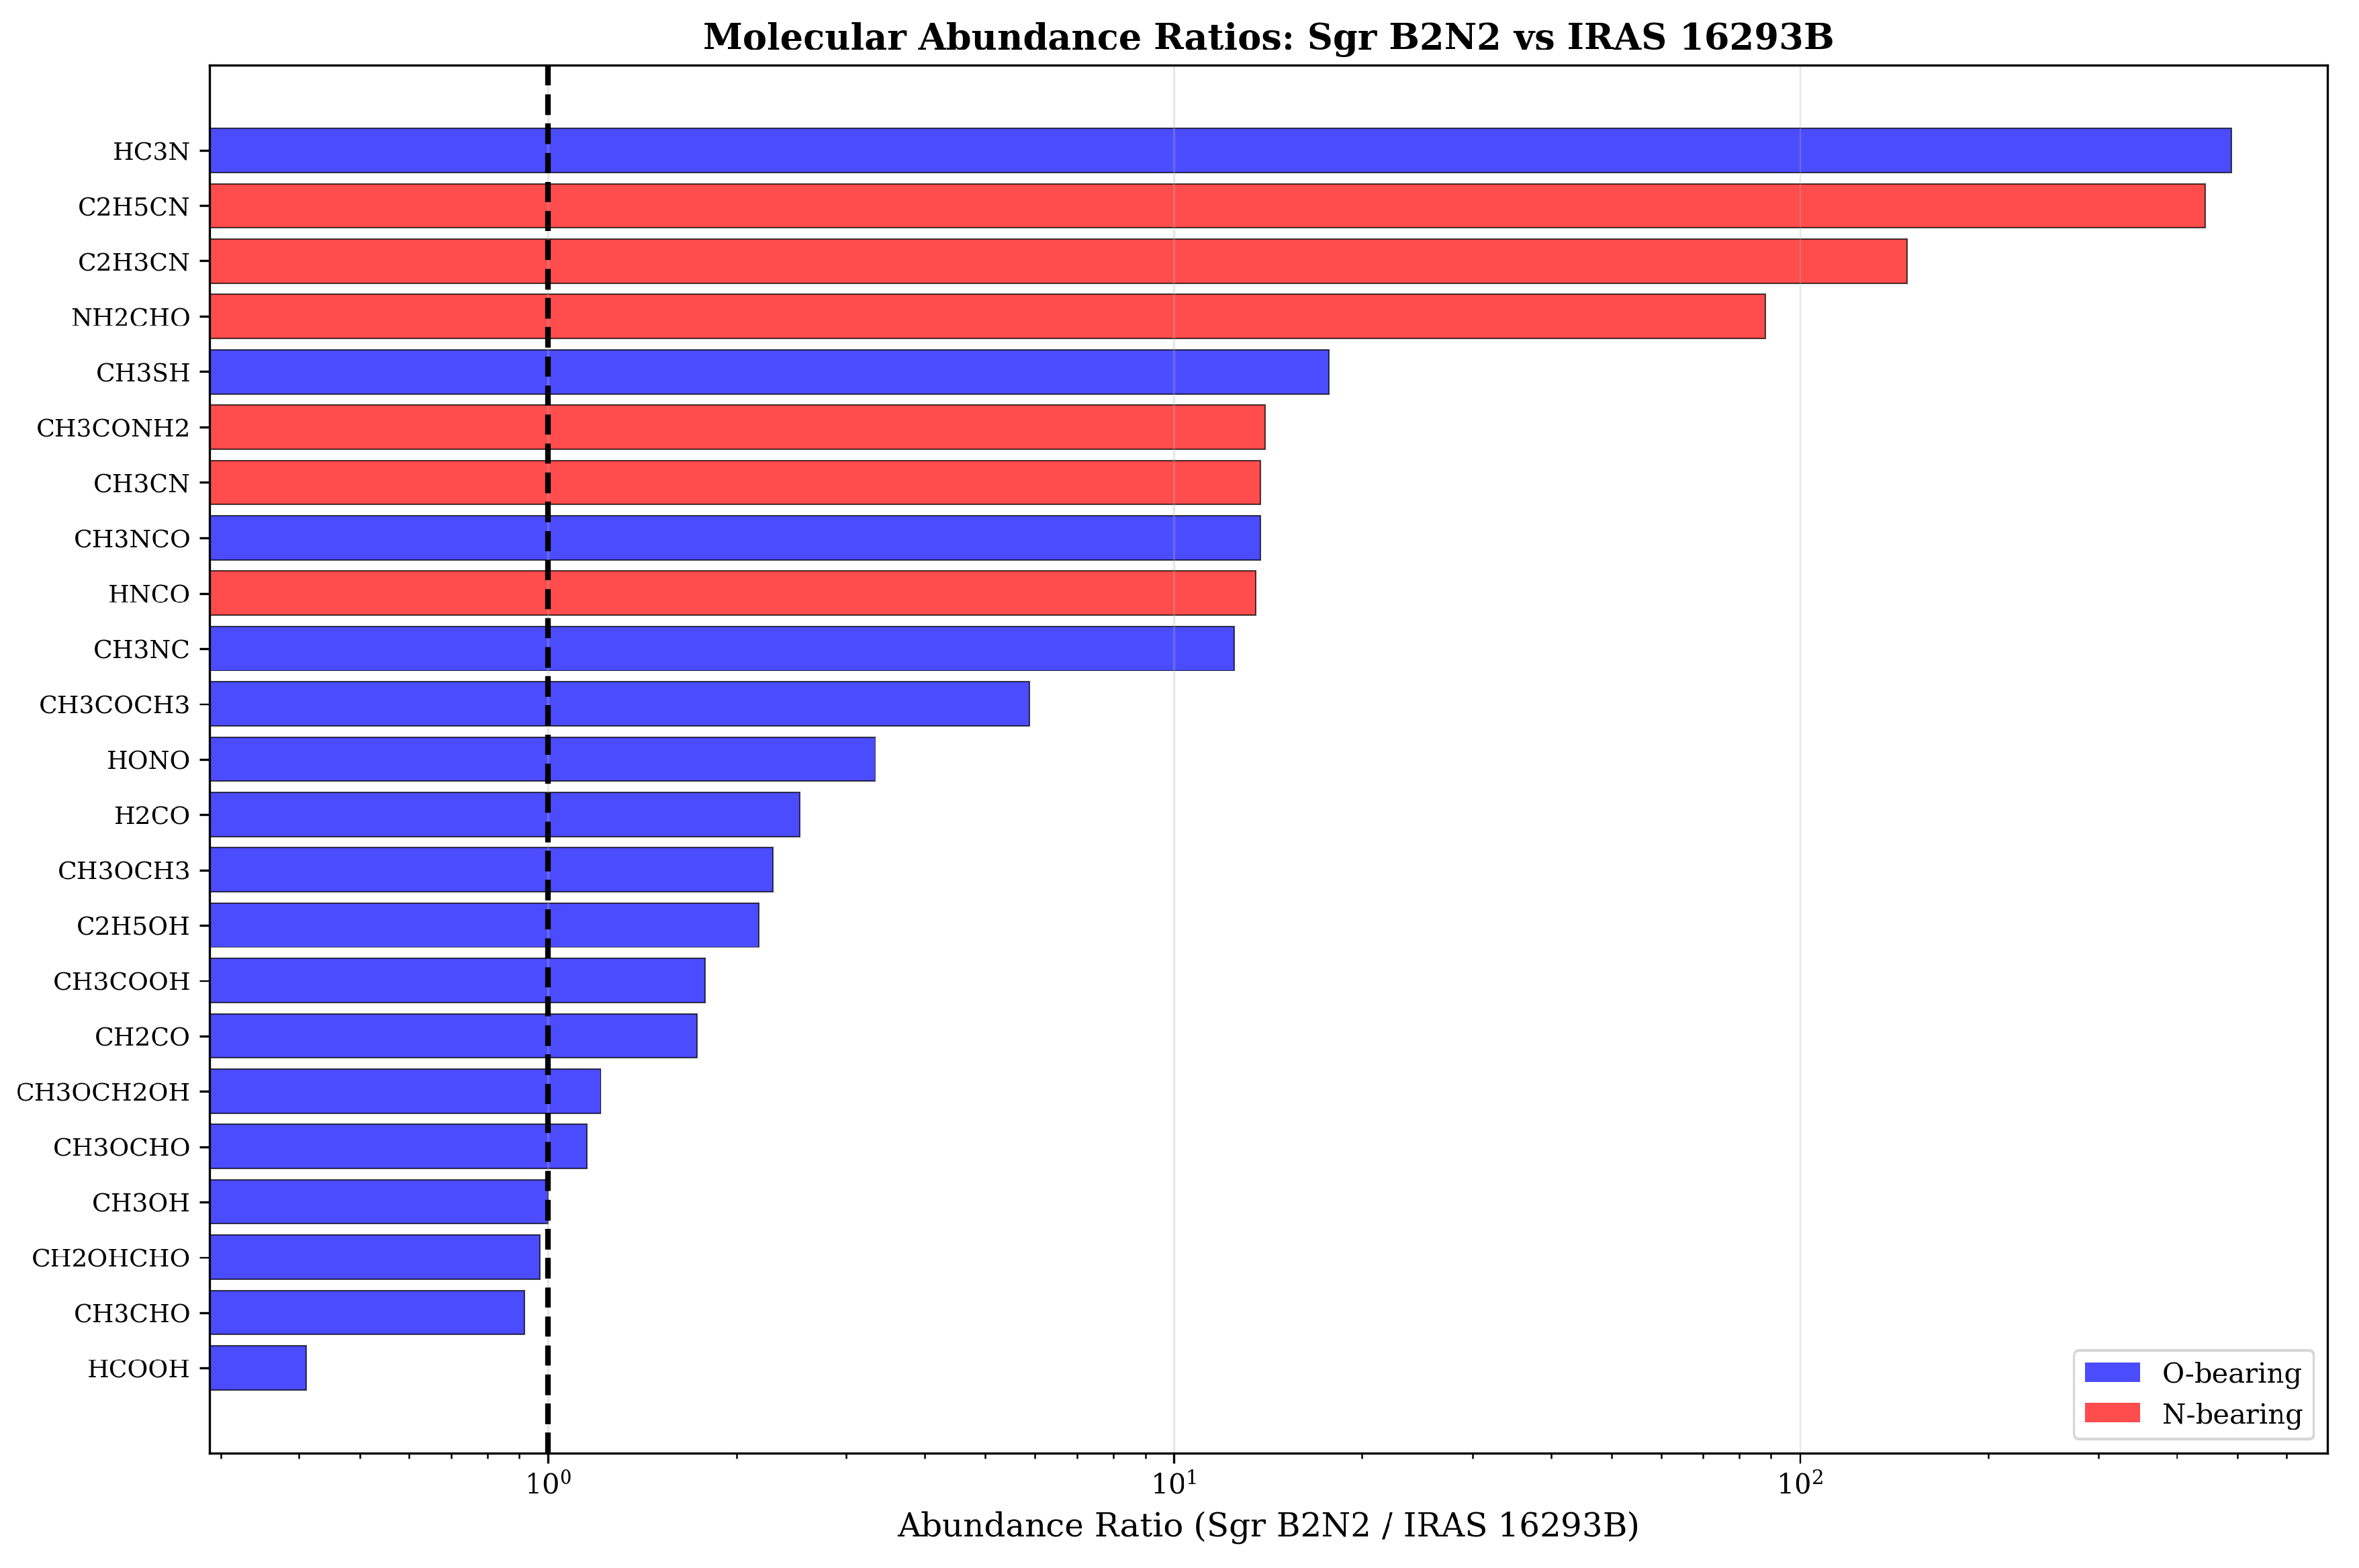
Figure 6.
Comparison of mean molecular abundances for O-bearing (blue) and N-bearing (red) species across the four environments. Error bars represent one standard deviation. While O-bearing molecules show relatively consistent mean abundances across IRAS 16293B (1.67%) and Sgr B2(N2) (1.49%), N-bearing species display a dramatic 38-fold enhancement in Sgr B2(N2) (6.13%) compared to IRAS 16293B (0.16%). Chemical models over-predict O-bearing abundances but under-predict the N-enrichment factor. Cometary abundances are elevated for both classes, consistent with prolonged ice processing in the solar nebula.
Figure 6.
Comparison of mean molecular abundances for O-bearing (blue) and N-bearing (red) species across the four environments. Error bars represent one standard deviation. While O-bearing molecules show relatively consistent mean abundances across IRAS 16293B (1.67%) and Sgr B2(N2) (1.49%), N-bearing species display a dramatic 38-fold enhancement in Sgr B2(N2) (6.13%) compared to IRAS 16293B (0.16%). Chemical models over-predict O-bearing abundances but under-predict the N-enrichment factor. Cometary abundances are elevated for both classes, consistent with prolonged ice processing in the solar nebula.
Disclaimer/Publisher’s Note: The statements, opinions and data contained in all publications are solely those of the individual author(s) and contributor(s) and not of MDPI and/or the editor(s). MDPI and/or the editor(s) disclaim responsibility for any injury to people or property resulting from any ideas, methods, instructions or products referred to in the content. |
© 2026 by the authors. Licensee MDPI, Basel, Switzerland. This article is an open access article distributed under the terms and conditions of the Creative Commons Attribution (CC BY) license.
Copyright: This open access article is published under a Creative Commons CC BY 4.0 license, which permit the free download, distribution, and reuse, provided that the author and preprint are cited in any reuse.


