

Submitted:
17 April 2026
Posted:
20 April 2026
You are already at the latest version
Abstract
In southern Brazil, a large proportion of farmers maintain their fields under fallow conditions during the transition period between summer and winter crops. During this interval, mechanical practices such as chiseling or the introduction of cover crop spe-cies may contribute to improving soil management and conservation in no-tillage sys-tems. Therefore, this study aimed to investigate the effects of mechanical soil chiseling and production system intensification on soil physical–hydric properties and soybean performance. The experiment was conducted in São José do Ouro, Rio Grande do Sul, Brazil, from September 2023 to April 2025. The experimental design consisted of three factors: soil chiseling (spring 2023, autumn 2024, and no-till), post-maize cover (millet and fallow conditions), and winter cover crops (black oat, white oat, vetch, and radish) grown either as monocultures or in mixtures. A randomized block design with split plots and three replicates was used. The evaluated variables included dry biomass of winter cover crops, soil bulk density, total porosity, microporosity, macroporosity, soil water content at field capacity, soil penetration resistance, plant gas exchange, leaf area index, thousand-grain weight, and soybean grain yield. The results indicated that soil chiseling altered soil physical properties by reducing soil bulk density, penetration resistance, microporosity, and field capacity, while increasing total porosity and macroporosity. Soil chiseling promoted short-term increases in thousand-grain weight and soybean grain yield. Production system intensification, through the use of cover crops and millet, did not affect grain yield but increased stomatal conductance and soybean leaf area index.
Keywords:
soil compaction
; Glycine max
; cover crops
1. Introduction
After decades of adoption of the no-tillage system in Brazil, the implementation of conservation practices such as crop rotation and maintenance of soil cover remains insufficient to maintain or improve the soil physical quality and production system performance. Crop diversification within production systems promotes energy gains and reduces climatic variability [1]. In this context, the current inefficiency of no-tillage has contributed to soil compaction, one of the main soil physical problems often observed in these areas, typically at depths between 7 and 20 cm [2].
Soil compaction reduces water infiltration, leading to increased runoff and erosion [3,4]. Soils with physical constraints limit root growth, causing roots to concentrate mainly in the surface layer [5], which consequently reduces water [6] and nutrient uptake [7]. Additionally, total soil porosity decreases, impairing gas exchange and affecting soil air dynamics [3,8,9]. Insufficient oxygen availability, resulting from reduced energy production through anaerobic respiration, limits the energy available for essential root functions, particularly nutrient absorption [10,11].
In areas with severe soil compaction, mechanical chiseling may be required, as it can reduce soil bulk density [12], decrease soil penetration resistance [13], and increase macroporosity, thereby improving permeability and water infiltration while reducing surface runoff [13]. However, the effects of this practice are usually short-lived [14,15], and it is often applied without proper technical criteria.
An alternative strategy to mitigate compaction is the intensification of the no-tillage system through the use of cover crops or green manures. When used as a monoculture or in mixtures, these crops play a conservation role by protecting the soil from erosion, producing high biomass, and improving soil physical properties through diverse root systems [14,16,17,18], promoting biological decompaction [19]. Soil properties vary depending on the species used in crop rotation [20], although the effects are less evident in the short term [21]. Improvements in soil chemical, physical, and biological conditions require long-term adoption of these practices [22,23].
In this context, proper plant growth and development are intrinsically related to soil physical, chemical, and biological properties [24], as well as their interaction with crop ecophysiology. This relationship directly influences essential physiological processes, such as photosynthesis [25], and growth parameters, such as leaf area index (LAI), which indicate the capacity for solar radiation interception and its conversion into grain yield [26].
The combined use of occasional mechanical soil chiseling and cover crops as a strategy for production system intensification may contribute to improving soil quality, ecophysiological aspects, and crop yield components. Therefore, this study aimed to investigate the effects of mechanical soil chiseling and production system intensification, through the use of cover crops, on soil physical–hydric properties and soybean performance.
2. Materials and Methods
The study was conducted in São José do Ouro, Rio Grande do Sul, Brazil (27°45′36″ S, 51°34′42″ W; 769 m altitude). The soil is classified as a typical aluminoferric Red Oxisol with clayey texture and gently undulating relief [27]. According to the Köppen-Geiger classification, the climate is Cfb (humid subtropical), with no defined dry season and mild summers [28].
Meteorological data were obtained from an automatic weather station composed of two units located approximately 1 km from the experimental area (Figure 1).
The experiment was arranged in a randomized complete block design with split plots and three replications. The first evaluated factor comprised two chiseling times: the first was September 2023 (spring 2023 chiseling) and the second was June 2024 (autumn 2024 chiseling); there was also a no-till control. The second factor consisted of millet as cover crop or fallow after the summer crop. Finally, the third factor included four winter cover crops: black oat, white oat, radish, and vetch. A total of 72 plots were established, each measuring 2.5 m in width × 3.25 m in length (8.1 m2).
Spring 2023 chiseling was performed over a vetch crop five days after a 10 mm rainfall event. Autumn 2024 chiseling was conducted over millet five days after a 30 mm rainfall event, prior to winter cover crop sowing. In both cases, operations were carried out under friable soil conditions.
The soil exhibited slight compaction, with physical properties (soil bulk density, penetration resistance, and macroporosity) near critical thresholds. Chiseling was performed using a Status (Genius) implement equipped with cutting discs and seven shanks spaced 50 cm apart, operating at a depth of 35 cm, followed by a roller compactor.
Millet was sown on March 14, 2024, following maize harvest. The hybrid used was ADRf Valente millet, characterized by high biomass production and regrowth capacity, which enables post-harvest grazing and improves soil cover. Sowing was performed by broadcasting, followed by light seed covering and incorporation using a leveling harrow.
Winter cover crops were sown on July 2, 2024, using a Seminea plot seeder with nine rows spaced 0.20 m apart (1.80 m width × 7 m length). The treatments consisted of 80 kg ha-1 of GMX Bagual black oat monoculture, 30 kg ha-1 of GMX Bagual black oat + 50 kg ha-1 of URS Taura white oat + 5 kg ha-1 IPR 116 radish, 30 kg ha-1 of GMX Bagual black oat + 50 kg ha-1 of URS Taura white oat + 30 kg ha-1 of common vetch, and 30 kg ha-1 of GMX Bagual black oat + 50 kg ha-1 URS Taura white oat + 30 kg ha-1 of common vetch + 5 kg ha-1 of IPR 116 radish.
Soybean was sown on November 26, 2024, using a Kuhn mechanical seeder with five rows spaced 0.50 m apart. The cultivar used was Brasmax Vênus (relative maturity group 5.7), at a density of 240,000 plants ha⁻¹. Fertilization consisted of 325 kg ha-1 of N–P2O5–K2O (03–21–21) at sowing and 100 kg ha-1 of potassium chloride (0–0–58), broadcast before winter cover crop sowing. Fertilization was based on soil analysis and expected yield. Weed, insect, and disease management followed standard monitoring criteria, with chemical control applied as needed.
Soil physical-hydric properties were analyzed by collecting soil samples using stainless steel cylinders (~5 cm diameter × 5 cm height), with one sample per plot. Samples were collected on April 29, 2025, after soybean harvest, approximately 20 months after spring 2023 chiseling and 10 months after autumn 2024 chiseling. Samples were stratified every 5 cm at a 0–20 cm depth and 10 cm at a 20–30 cm depth, totaling five subsamples per plot.
The following variables were determined: soil bulk density (g cm-3), total porosity (cm3 cm-3), microporosity (cm3 cm-3), macroporosity (cm3 cm-3), and water content at field capacity (cm3 cm-3). Analyses were conducted at the Soil Water Physics Laboratory at the University of Passo Fundo (UPF). Soil bulk density was determined as the ratio of oven-dried sample mass at 105 °C for 48 h and cylinder volume [30]. Total porosity was calculated from saturated volumetric water content. Microporosity and field capacity corresponded to water content after applying tensions of 10 kPa and 6 kPa, respectively, using porous plate funnels. Macroporosity was calculated as the difference between total porosity and microporosity [29,30].
Soil penetration resistance (PR) was measured using an automatic hydraulic penetrometer (Falker PLG1020) coupled to an all-terrain vehicle with a 40 cm measuring depth. Measurements were performed on April 17, 2025, at one point per plot, after a mean rainfall of 53 mm (April 12–15, 2025).
Dry biomass (DB) of winter cover crops was collected at 111 days after sowing (DAS), corresponding to peak biomass accumulation. Samples were randomly collected from a 0.25 m² area (0.5 × 0.5 m) per plot. Biomass was dried at 72 °C until constant weight.
Physiological variables of soybean were measured at 49 DAS, corresponding to the R1 growth stage [31]. Measurements were taken using an Infrared Gas Analyzer (IRGA, LCA PRO; Analytical Development Co. Ltd., Hoddesdon, UK) between 8 a.m. and 11 a.m., under air temperatures ranging from 22 to 29 °C in one plant per plot. The evaluated variables were photosynthetic rate (µmol m⁻² s⁻¹), transpiration rate (mol H₂O m⁻² s⁻¹), internal CO₂ concentration (µmol mol⁻¹), stomatal conductance (mol m⁻² s⁻¹), water use efficiency (WUE; mol CO₂ mol H₂O⁻¹), and carboxylation efficiency (CE; mol CO₂ m⁻² s⁻¹). CE and WUE were calculated as A/Ci and A/E, respectively. Measurements were taken from the penultimate fully expanded leaf, specifically the central leaflet of the trifoliate leaf, following [32].
Plant height and LAI were measured at 49 DAS in one plant per plot. The measurements taken were length (L) and width (W) of all central leaflets of trifoliate leaves of each plant. LAI is defined as the ratio between leaf area (LA) and the ground area occupied by plants. The LA was calculated using the equation LA = 2.0185 × (L × W) [33]. Plant height was measured from the hypocotyl base (soil level) to the apex of the last trifoliate leaf.
Soybean was harvested on March 31, 2025, using a Zürn 150 plot harvester. The harvested area comprised three central rows (1.5 m in width × 3.25 m in length = 4.87 m² of harvested area). Grain weight and moisture were recorded automatically. Thousand-grain weight (TGW) was determined using a representative sample from each treatment and measured with a digital scale. Grain moisture was standardized to 13% for both variables.
Data were analyzed using R Studio [34]. The analysis considered the three experimental factors (chiseling, millet, and winter cover crops). Data were subjected to analysis of variance (ANOVA). When assumptions were violated, Box–Cox transformation was applied. Tukey’s test was conducted at a 5% probability level.
3. Results and Discussion
No interaction was observed among soil chiseling, millet, and winter cover crops, and no significant differences were detected when the factors were analyzed individually for the variables of photosynthetic rate, leaf transpiration, internal CO₂ concentration, CO₂ assimilation rate, and carboxylation efficiency. However, a triple interaction was observed for stomatal conductance.
Mean CE values across all treatments were 0.07 mol CO₂ m⁻² s⁻¹ (Table 1), consistent with [32], who reported values of 0.056 mol CO₂ m⁻² s⁻¹ for the control and 0.07 mol CO₂ m⁻² s⁻¹ following monoammonium phosphate (MAP) applications at soybean growth stages V4, V6, R1, and R3 over two growing seasons.
Leaf transpiration showed mean values of 2.72 mol H₂O m⁻² s⁻¹ across all treatments (Table 1), similar to those reported by [35], who observed values ranging from 1.25 to 2.5 mol H₂O m⁻² s⁻¹ at the V6 stage under soil water tension of −0.004 MPa.
Internal CO₂ concentration averaged 358.55 µmol mol⁻¹ across treatments, which was higher than those reported by [32], who found values ranging from 194 to 205 µmol mol⁻¹. This difference may be attributed to the sampling stage, as measurements in the present study were taken at R1, whereas [32] evaluated plants at the R4 stage.
Stomatal conductance (gs) showed a significant triple interaction among factors. Mean gs values exceeded 0.24 mol H₂O m⁻² s⁻¹, indicating the absence of water stress [36]. In controlled environments, Gilbert et al. [37] reported even higher values, ranging from 0.40 to 0.65 mol m⁻² s⁻¹.
Although the 2024/25 growing season was influenced by La Niña conditions, few drought periods occurred. Measurements were taken on January 14, 2025, following approximately 70 mm of rainfall in the preceding week.
No significant differences in gs were observed under pearl millet treatments (Figure 2a). However, under fallow conditions, higher gs values were observed for chiseling performed in spring 2023 compared to autumn 2024 when black oat was used as a winter cover crop (Figure 2b). When additional cover crop species were included, this difference disappeared, highlighting the importance of plant species diversification for improving system performance.
Under post-maize fallow and autumn 2024 chiseling, the mixture of black oat + white oat + vetch (BO + WO + VE) showed higher gs compared to black oat monoculture (Figure 3a), indicating that species mixtures can mitigate reductions in stomatal conductance. In periods of drought, gs decreases, and high vapor pressure deficit conditions negatively affect photosynthesis [37].
Cover crops contributed to soil moisture conservation, reducing water stress. Lower gs values indicate higher plant stress, reinforcing the importance of millet cultivation after maize, particularly when soil disturbance occurs before establishing black oat as cover crop.
In no-till treatments, no differences were observed among management systems after maize and winter cover crops (Figure 3b). For spring 2023 chiseling, the absence of millet resulted in a 25% reduction in gs under the BO + WO + RA system (Figure 3c). A 33% reduction in gs may reduce photosynthesis by 14% under irrigated and high vapor pressure deficit conditions, with potentially greater impacts under rainfed conditions [37].
Considering spring 2023 chiseling, black oat grown after post-maize fallow showed higher plant stress than under BO + WO + RA conditions. Conversely, the post-maize millet crop showed greater stomatal closure for the BO + WO + VE mixture [38] than BO + WO + RA, with mean values of 0.26 mol m-1 s-1 and 0.34 mol m-1 s-1, respectively (Figure 3c). The presence of radish releases large amounts of nutrients and improves water infiltration and soil structure [39], which may explain these results.
An interaction was observed between chiseling and winter cover crops for DB production. Overall, chiseling did not affect DB production, except for autumn 2024 chiseling under the BO + WO + RA treatment, which resulted in lower biomass compared to the control (Table 2). This suggests that soil disturbance close to cover crop sowing may impair crop establishment and requires careful management.
Similarly [40], reported higher millet biomass under no-tillage compared to chiseling at 30 cm depth. Regarding sunn hemp and millet DB under different decompaction, chiseling, and subsoiling systems at 30–50 cm, no differences were observed for millet among soil management systems; however, subsoiling at 30–50 cm increased the DB of sunn hemp.
The winter cover crops under BO + WO + VE + RA mixture in autumn 2024 chiseling produced 12,694 kg ha⁻¹ of DB, significantly higher than BO (9,736 kg ha⁻¹) (Table 2). This indicates that species mixtures enhance biomass production when chiseling is performed near sowing.
For no-till and spring 2023 chiseling treatments, DB values increased, especially when radish was included in the mixtures. Gimenez et al. [41] performed an assessment at 105 DAS, and found higher DB accumulation in systems including rye and radish, as well as black oat, rye, and radish. In addition to high DB production, radish accumulates large amounts of nutrients and improves soil physical properties [39].
Soybean grain yield (GY) was higher in autumn 2024 chiseling, reaching 5,009 kg ha⁻¹ (Figure 4), indicating immediate improvements in soil structure and soybean yield [42]. According [43], in fields with low and medium yield potential, soil management involving chiseling, gypsum application, and cover crop cultivation increases GY.
When considering the effect of spring 2023 chiseling, no difference was observed compared to the control after 18 months, with yields around 4,715 kg ha⁻¹ (Figure 4). This indicates that the benefits of chiseling are not persistent over the long term [42]. Similarly [25,44,45] did not observe increases in soybean GY under soil chiseling.
Moreover, a marked reduction in soybean yield is associated with severe soil compaction levels that restrict root growth, combined with water deficit and irregular rainfall distribution throughout the crop cycle [46]. Thus, this management strategy for mitigating soil compaction should be adopted based on technical criteria and according to local edaphoclimatic characteristics.
A simple effect of post-maize management was observed for the variable of LAI. Soybean LAI was higher with post-maize millet, being approximately 11% higher than in fallow conditions (Table 3). In a study with two sowing dates [33], reported LAI values ranging from 2 to 5 at 50 DAS for 11 cultivars. Millet cultivation after the summer crop provided higher LAI, indicating greater capacity for solar radiation interception and, consequently, higher photosynthetic potential of soybean [27]. However, increased LAI does not necessarily result in higher GY values [47].
Regarding plant height, no interaction or differences were observed among the evaluated factors (Table 3). One possible explanation is the agronomic characteristic of the cultivar Brasmax Vênus, which is relatively short. Described [47] average plant heights of 65.5 cm at the R1 stage in experiments conducted in Rio Grande do Sul with sowing on November 15, which is considerably higher than the mean height observed in this study (30.2 cm).
For TGW, a triple interaction among the factors was observed. Chiseling times under the influence of post-maize millet showed differences among cover crops BO + WO + VE and BO + WO + VE + RA (Figure 5a). For the mixture BO + WO + VE, the no-till system increased TGW compared to spring 2023 chiseling. For BO + WO + VE + RA, autumn 2024 chiseling differed from spring 2023, demonstrating a relationship between chiseling timing and cover crop use. No differences were observed among chiseling times and cover crops under fallow conditions (Figure 5b).
For autumn 2024 chiseling, the cultivation of BO + WO + VE + RA following millet increased TGW compared to fallow after the summer crop (Figure 6a). Similarly, in the no-till system, post-maize fallow reduced TGW in the BO + WO + VE system compared to millet (Figure 6b). Among winter cover crops in the no-till system, the BO + WO + VE mixture increased TGW compared to black oat monoculture.
Conversely [19], evaluating three cover crop systems (black oat monoculture, black oat + radish mixture, and black oat + white oat + radish + rye + lupine + common vetch mixture), found no differences in soybean TGW. However, for bean, mixtures with more than two species increased TGW. These results indicate the importance of cover crops after the summer crop for increasing TGW, depending on the species used in succession and the interaction among winter cover crops under soybean TGW (Figure 6).
Soil bulk density was reduced by both autumn 2024 and spring 2023 chiseling for the 0–5, 5–10, and 10–15 cm layers (Table 4), corroborating results reported [43]. Overall, mean values were below the critical threshold for plant growth established (1.36 g cm⁻³) [48] and (1.33 g cm⁻³) [22]. Analyzed [25] lower soil bulk density in the 0–10 cm layer under soil chiseling compared to the no-tillage system.
For the 15–20 cm layer, an effect was observed only for autumn 2024 chiseling, reducing soil bulk density to 1.15 g cm⁻³, while no differences were found for the 20–30 cm layer (Table 4). These results indicate that the effect of spring 2023 chiseling persisted for the 0–5, 5–10, and 10–15 cm layers for up to 20 months. Reported [49] that chiseling effects did not persist after 18 and 24 months in a Rhodic Nitisol. However [50], observed persistence of soil bulk density, total porosity, and penetration resistance for at least 18 months in a Planosol.
Microporosity showed a similar trend, decreasing with autumn 2024 chiseling for the 0–5, 5–10, and 15–20 cm layers compared to the no-till system. Also reported [48] lower microporosity in the 0–20 cm layer under chiseling compared to no-tillage. Spring chiseling differed from the control only in the 10–15 cm layer. Publisched [50] did not find an effect for chiseling in the 10–20 cm layer after 18 months.
Macroporosity increased due to autumn 2024 chiseling for the 0–5, 5–10, 10–15, and 15–20 cm layers (Table 5). Soil management with chiseling alters macropore distribution, increasing macroporosity in the 0–20 cm layer [25]. Reported [14] increased macroporosity in the 0–30 cm layer. Similarly, spring 2023 chiseling increased macroporosity in the 0–5, 5–10, and 10–15 cm layers for up to 20 months. The no-till system in the 5–10, 10–15, 15–20, and 20–30 cm layers and spring 2023 chiseling in 15–20 and 20–30 cm layers showed critical values for plant growth (<0.10 m³ m⁻³) [48].
The 15–20 cm layer showed interaction between post-maize management and winter cover crops (Table 6). Post-maize fallow after BO + WO + VE cover crops indicated higher macroporosity than millet. This result may be explained by variations associated with wet and dry periods after maize cultivation and during winter cover crop sowing [14].
Total porosity showed a simple effect for chiseling and an interaction between winter cover crops and post-maize management (Table 7). Spring 2023 chiseling showed differences compared to the no-till system, with effects persisting for 20 months in the 0–5, 5–10, and 10–15 cm layers. Observed [50] persistence of total porosity for 18 months in the 10–20 cm layer, depending on the cover crop species. Autumn 2024 chiseling resulted in higher total porosity in the 5–10 and 10–15 cm layers compared to no-tillage. Reported [48] higher total porosity only in the 5–10 cm layer when comparing no-tillage of six years and chiseling.
Total soil porosity in the 15–20 cm layer presented interaction for BO + WO + RA cover crops after millet, which increased total porosity compared to fallow conditions (Table 8). This result may be explained by the effects of cover crops and their roots, which, combined with wet–dry cycles, improve soil physical properties under different compaction levels [14].
Soil penetration resistance (PR) was evaluated in the 0–40 cm layers, showing differences at 5–10, 10–15, 15–20, and 20–25 cm depths (Figure 7). Moraes et al. [25] observed reductions in PR down to approximately 23 cm one year after chiseling. Analyzed [12] differences only in the 25–30 cm layer under subsoiling conditions. Spring 2023 chiseling showed persistence of effects for 20 months in the 10–15, 15–20, and 20–25 cm layers compared to the no-till system. Autumn 2024 chiseling showed differences in 5 to 25 cm layers compared to the control. However, PR values in the no-till system were below 2500 kPa, within the 2,000–3,500 kPa range for an aluminoferric Red Oxisol [48], which does not restrict plant growth.
Field capacity showed a double interaction between post-maize management and chiseling in the 0–5 cm layer (Figure 8). However, the 5–10, 10–15, 15–20, and 20–30 cm layers presented only a simple effect for chiseling (Figure 9). Post-maize millet increased soil water content at field capacity (cm3 cm-3) in the surface layer (0–5 cm) compared to fallow, likely due to its fibrous root system improving soil structure. Cover crops improve water uptake through soil protection and deeper root systems. Soil physical properties also change, increasing structural stability, reducing PR and soil bulk density, increasing aerial space and field-saturated hydraulic conductivity [16,20,21].
Overall, chiseling reduced soil water content compared to no-tillage [51]. Water content at field capacity is one of the soil’s physical properties that most correlates to grain yield [52]. For the 0–20 cm layer, autumn 2024 chiseling resulted in lower field capacity compared to the no-till system. At 15–20 cm depth, autumn 2024 chiseling reduced field capacity compared to spring 2023 chiseling. For the 5–10 and 10–15 cm layers, spring 2023 chiseling showed a similar value of 0.42 cm3 cm-3, which is lower than the 0.45 cm3 cm-3 of the no-till system, indicating long-term effects of this practice (18 months) (Figure 10).
4. Conclusions
Soil chiseling reduced soil bulk density and penetration resistance and increased total porosity and macroporosity across different soil layers. Chiseling increased thousand-grain weight and soybean grain yield; however, these effects were limited to the short term. In contrast, reductions in microporosity and field capacity in the 0–20 cm layer may negatively affect water availability for plants.
Production system intensification using millet and cover crops did not increase soybean grain yield, but it did increase stomatal conductance and leaf area index.
Author Contributions
Conceptualization, E.S.N.S and M.P.B.; methodology, E.S.N.S., L.G., R.G.M and M.P.B.; software, E.S.N.S and M.P.B.; validation, E.S.N.S., L.G., R.G.M, J.K. and M.P.B.; formal analysis, E.S.N.S., L.G., R.G.M, J.K. and M.P.B.; investigation, E.S.N.S. and M.P.B.; resources, L.G and M.P.B.; data curation, E.S.N.S and M.P.B.; writing—original draft preparation, E.S.N.S. and M.P.B.; writing—review and editing, E.S.N.S., L.G., R.G.M, J.K. and M.P.B.; visualization, E.S.N.S., L.G., R.G.M, J.K. and M.P.B; supervision, M.P.B.; project administration, M.P.B.; funding acquisition, M.P.B. All authors have read and agreed to the published version of the manuscript.
Funding
This study was partly funded by the Coordination for the Improvement of Higher Education Personnel (CAPES), under Finance Code 001.
Institutional Review Board Statement
Not applicable.
Informed Consent Statement
Not applicable.
Data Availability Statement
The raw data supporting the conclusions of this article will be made available by the authors on request.
Acknowledgments
To University of Passo Fundo, and CAPES for granting scholarship.
Conflicts of Interest
Not applicable.
References
- Tagliapietra, E.L.; Streck, N.A.; Tura, E.F.; Alves, A.F.; Silva, M.R.; Soares, M.F.; Winck, J.E.M.; Porta, F.S.D.; Arce, M.S.Z.; Uliana, G.F.; Zanuz, J.S.; Zanon, A.J.; Ribas, G.G. Assessing yield and risks in cropping systems of southern Brazil. Journal of Agronomy and Crop Science 2025, 211, e70125. [Google Scholar] [CrossRef]
- Nunes, M.R.; Denardin, J.E.; Faganello, A.; Pauletto, E.A.; Pinto, L.F.S. Efeito de semeadora com haste sulcadora para ação profunda em solo manejado com plantio direto. Revista Brasileira de Ciência do Solo 2014, 38, 627–638. [Google Scholar] [CrossRef]
- Keller, T.; Colombi, T.; Ruiz, S.; Manalili, M.P.; Rek, J.; Stadelmann, V.; Wunderli, H.; Breitenstein, D.; Reister, R.; Oberholzer, H.; Schymanski, S.; Ruiz, A.R.; Linde, N.; Weisskopf, P.; Walter, A.; Or, D. Long-term soil structure observatory for monitoring post-compaction evolution of soil structure. Vadose Zone Journal 2017, 16, 1–16. [Google Scholar] [CrossRef]
- Bortoluzzi, E.C.; Bortoluzzi, M.P.; Chiomento, J.L.T.; Cassel, J.L.; Werner, H.A.; Petry, C. Improving water infiltration in croplands mitigates the effects of extreme rainfall events. Environmental Earth Sciences 2025, 84, 124. [Google Scholar] [CrossRef]
- Mulazzani, R.P.; Boeno, D.; Ribeiro, B.S.M.R.; Alves, A.F.; Zanon, A.J.; Gubiani, P.I. Chemical constraints are the major limiting factor of root deepening southern Brazil soils. Geoderma Regional 2024, 38, e00825. [Google Scholar] [CrossRef]
- Nosalewicz, A.; Lipiec, J. The effect of compacted soil layers on vertical root distribution and water uptake by wheat. Plant Soil 2014, 375, 229–240. [Google Scholar] [CrossRef]
- Schnepf, A.; Leitner, D.; Klepsch, S. Modeling phosphorus uptake by a growing and exuding root system. Vadose Zone Journal 2012, 11, 318–327. [Google Scholar] [CrossRef]
- Chen, G.; Weil, R.R.; Hill, R.L. Effects of compaction and cover crops on soil least limiting water range and air permeability. Soil and Tillage Research 2014, 136, 61–69. [Google Scholar] [CrossRef]
- Kuncoro, P.H.; Koga, K.; Satta, N.; Muto, Y. Effect of compaction on soil gas and water transport properties. Soil and Tillage Research 2014, 143, 172–179. [Google Scholar] [CrossRef]
- Bailey-Serres, J.; Lee, S.C.; Brinton, E. Waterproofing crops: flooding survival strategies. Plant Physiology 2012, 160, 1698–1709. [Google Scholar] [CrossRef]
- Kozlowski, T.T. Soil compaction and growth of woody plants. Scandinavian Journal of Forest Research 1999, 14, 596–619. [Google Scholar] [CrossRef]
- Becker, R.K.; Barbosa, E.A.A.; Giarola, N.F.B.; Kochinski, E.G.; Povh, F.P.; Paula, A.L.; Cherubin, M.R. Mechanical intervention in compacted no-till soil. Agronomy 2022, 12, 2281. [Google Scholar] [CrossRef]
- Santos, E.L.; Debiasi, H.; Franchini, J.C.; Vieira, M.J.V.; Balbinot Junior, A.A. Chiseling and gypsum application effects. Revista Ciência Agronômica 2019, 50, 536–542. [Google Scholar] [CrossRef]
- Bertollo, A.M.; Moraes, M.T.; Franchini, J.C.; Soltangheisi, A.; Balbinot, J.A.A.; Levien, R.; Debiasi, H. Precrops alleviate soil physical limitations. Soil and Tillage Research 2021, 206, 104820. [Google Scholar] [CrossRef]
- Drescher, M.S.; Reinert, D.J.; Denardin, J.E.; Gubiani, P.I.; Faganello, A.; Drescher, G.L. Duration of chiseling effects. Pesquisa Agropecuária Brasileira 2016, 51, 159–168. [Google Scholar] [CrossRef]
- Alvarez, R.; Steinbach, H.S.; De Paepe, J.L. Cover crop effects. Soil and Tillage Research 2017, 170, 53–65. [Google Scholar] [CrossRef]
- Franczilkowski, M.A.; Seidel, E.P.; Fey, E.; Anschau, K.A.; Mottin, M.C. Soil physical properties in cover crops. Engenharia Agrícola 2019, 27, 556–564. [Google Scholar] [CrossRef]
- Rampim, L.; Pott, C.A.; Volanin, A.J.D.; et al. Influence of green manure. Research, Society and Development 2020, 9, e173953258. [Google Scholar] [CrossRef]
- Bertollo, A.M.; et al. (mesma referência já citada).
- Pott, C.A.; Conrado, P.M.; Rampim, L.; Umburanas, R.C.; Conrado, M.A.C.; Outeiro, V.H.; Muller, M.M.L. Mixture of winter cover crops improves soil properties. Soil and Tillage Research 2023, 234, 105854. [Google Scholar] [CrossRef]
- Krupek, F.S.; Redferan, D.; Eskridge, K.M.; Basche, A. Ecological intensification with soil health practices demonstrates positive impacts on multiple soil properties: A large-scale farmer-led experiment. Geoderma 2022, 409, 115594. [Google Scholar] [CrossRef]
- Moraes, M.T.; Debiasi, H.; Carlesso, R.; Franchini, J.C.; Silva, V.R.; Luz, F.B. Soil physical quality after decades. Soil and Tillage Research 2016, 155, 351–362. [Google Scholar] [CrossRef]
- Ashworth, A.J.; Owens, P.R.; Allen, F.L. Cropping systems and soil strength. Geoderma 2020, 361, 114062. [Google Scholar] [CrossRef]
- Blanco-Canqui, H.; Ruis, S.J. No-tillage and soil environment. Geoderma 2018, 326, 164–200. [Google Scholar] [CrossRef]
- Moraes, M.T.; Debiasi, H.; Franchini, J.C.; et al. Soil compaction impacts soybean root growth. Soil and Tillage Research 2020, 200, 104611. [Google Scholar] [CrossRef]
- Long, S.P.; Bernacchi, C.J. Gas exchange measurements. Journal of Experimental Botany 2003, 54, 2393–2401. [Google Scholar] [CrossRef]
- Zanon, A.J.; Streck, N.A.; Richter, G.L.; et al. Leaf area index evolution. Bragantia 2015, 74, 279–290. [Google Scholar] [CrossRef]
- Streck, E.V.; et al. Solos do Rio Grande do Sul; Emater: Porto Alegre, 2018. [Google Scholar]
- Alvares, C.A.; Stape, J.L.; Sentelhas, P.C.; Gonçalves, J.D.M.; Sparovek, G. Köppen climate classification. Meteorologische Zeitschrift 2013, 22, 711–728. [Google Scholar] [CrossRef]
- Almeida, B.G.; et al. Manual de Métodos de Análise de Solo; Embrapa, 2017. [Google Scholar]
- Fehr, W.R.; Caviness, C.E. Stages of Soybean Development; 1977. [Google Scholar]
- Rodrigues, V.A.; et al. Enhancing soybean physiology. Agronomy 2025, 15, 818. [Google Scholar] [CrossRef]
- Richter, G.L.; et al. Leaf area estimation. Bragantia 2014, 73, 416–425. [Google Scholar] [CrossRef]
- R Core Team. R: A language and environment for statistical computing. 2018. [Google Scholar]
- Chavarria, G.; et al. Soybean photosynthetic restriction. Ciência Rural 2015, 45, 1387–1393. [Google Scholar] [CrossRef]
- Flexas, J.; Bota, J.; Loreto, F.; Cornic, G.; Sharkey, T.D. Diffusive and metabolic limitations to photosynthesis. Plant Biology 2004, 6, 269–279. [Google Scholar] [CrossRef] [PubMed]
- Gilbert, M.E.; Zwieniecki, M.A.; Holbrook, M. Water use efficiency. Journal of Experimental Botany 2011, 62, 2875–2887. [Google Scholar] [CrossRef] [PubMed]
- Franks, P.J.; Farquhar, G.D. Stomatal mechanics. Plant Physiology 2001, 125, 935–942. [Google Scholar] [CrossRef]
- Hansen, P.H.; et al. Forage turnip. Research, Society and Development 2023, 12, e11612239863. [Google Scholar] [CrossRef]
- Torres, J.L.R.; et al. Soil decompaction. Agronomy 2022, 12, 2310. [Google Scholar] [CrossRef]
- Gimenez, G.S.; et al. Cover crop biomass. Research, Society and Development 2021, 10, e3310413797. [Google Scholar] [CrossRef]
- Calonego, J.; et al. Soil compaction and soybean yields. European Journal of Agronomy 2017, 85, 31–37. [Google Scholar] [CrossRef]
- Pott, L.P.; et al. Soil compaction mitigation. European Journal of Soil Science 2019, 71, 1157–1172. [Google Scholar] [CrossRef]
- Inagaki, T.M.; et al. Mechanical and biological chiseling. Soil and Tillage Research 2021, 211, 104993. [Google Scholar] [CrossRef]
- Silva, G.F.D.; et al. Mechanical chiseling vs bio-tillage. Agronomy 2025, 15, 1249. [Google Scholar]
- Mulazzani, R.P.; et al. Soil compaction and yield simulation. Agricultural Systems 2022, 203, 103523. [Google Scholar] [CrossRef]
- Peter, M.; et al. Ecophysiology of soybean. Research, Society and Development 2023, 12, e24212541765. [Google Scholar] [CrossRef]
- Suzuki, L.E.A.S.; et al. Critical limits for root growth. Sustainability 2022, 14, 2958. [Google Scholar]
- Nunes, M.R.; et al. Persistence of chiseling effects. Pesquisa Agropecuária Brasileira 2014, 49, 531–539. [Google Scholar] [CrossRef]
- Fin, S.S.; et al. Duration of chiseling effects. Pesquisa Agropecuária Brasileira 2018, 53, 1230–1238. [Google Scholar] [CrossRef]
- Suzuki, L.E.A.S.; et al. Soil physical properties and yield. Sustainability 2022, 14, 9717. [Google Scholar] [CrossRef]
- Peixoto, D.S.; et al. Soil compaction diagnosis. Agrosystems Geosciences and Environment 2019, 2, 1–14. [Google Scholar] [CrossRef]
Figure 1.
Rainfall (mm), mean air temperature (°C), and relative humidity (%) between soybean sowing and harvesting.
Figure 1.
Rainfall (mm), mean air temperature (°C), and relative humidity (%) between soybean sowing and harvesting.
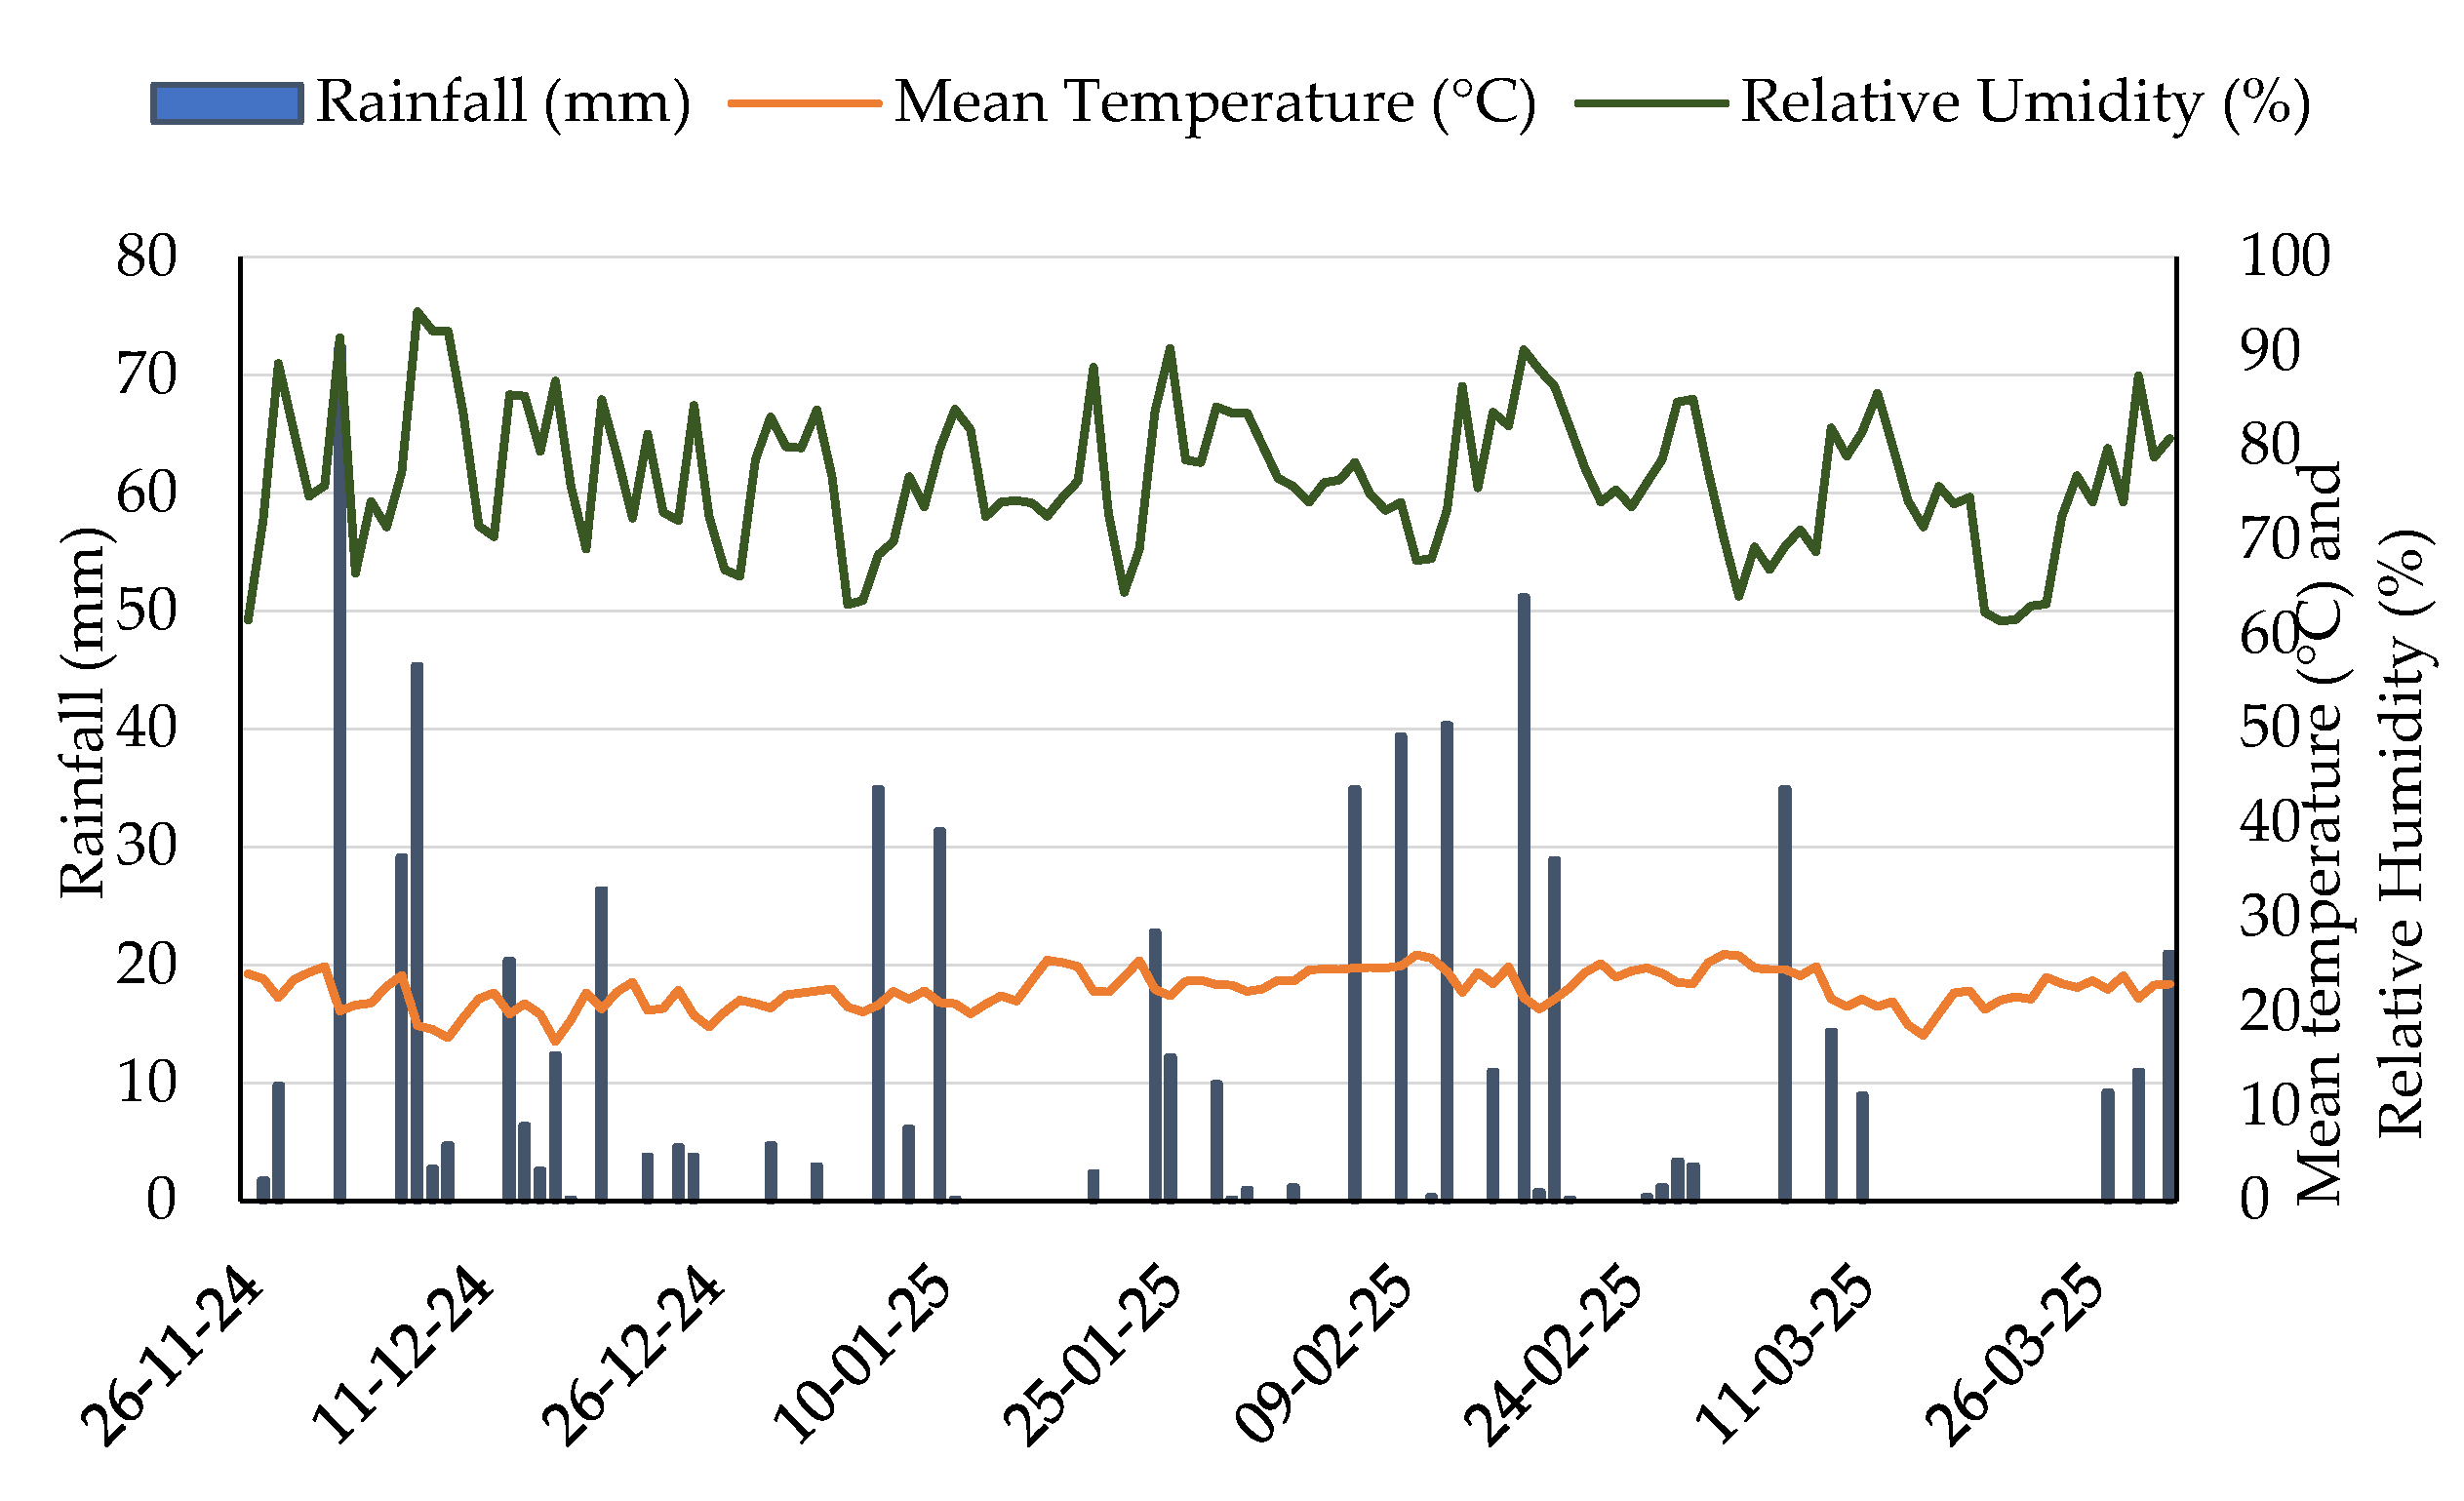
Figure 2.
Soybean stomatal conductance under post-maize millet (a) and fallow (b) treatments for autumn 2024 chiseling, spring 2023 chiseling, and no-till control, as well as for winter cover crops of black oat (BO), white oat (WO), radish (RA), and vetch (VE) as monocultures or in mixtures; 2024/25 growing season, São José do Ouro, RS, Brazil. Different letters indicate differences among soil chiseling methods for each cover crop, according to Tukey’s test (p ≤ 0.05). ns: not significant. Source: Author (2025).
Figure 2.
Soybean stomatal conductance under post-maize millet (a) and fallow (b) treatments for autumn 2024 chiseling, spring 2023 chiseling, and no-till control, as well as for winter cover crops of black oat (BO), white oat (WO), radish (RA), and vetch (VE) as monocultures or in mixtures; 2024/25 growing season, São José do Ouro, RS, Brazil. Different letters indicate differences among soil chiseling methods for each cover crop, according to Tukey’s test (p ≤ 0.05). ns: not significant. Source: Author (2025).
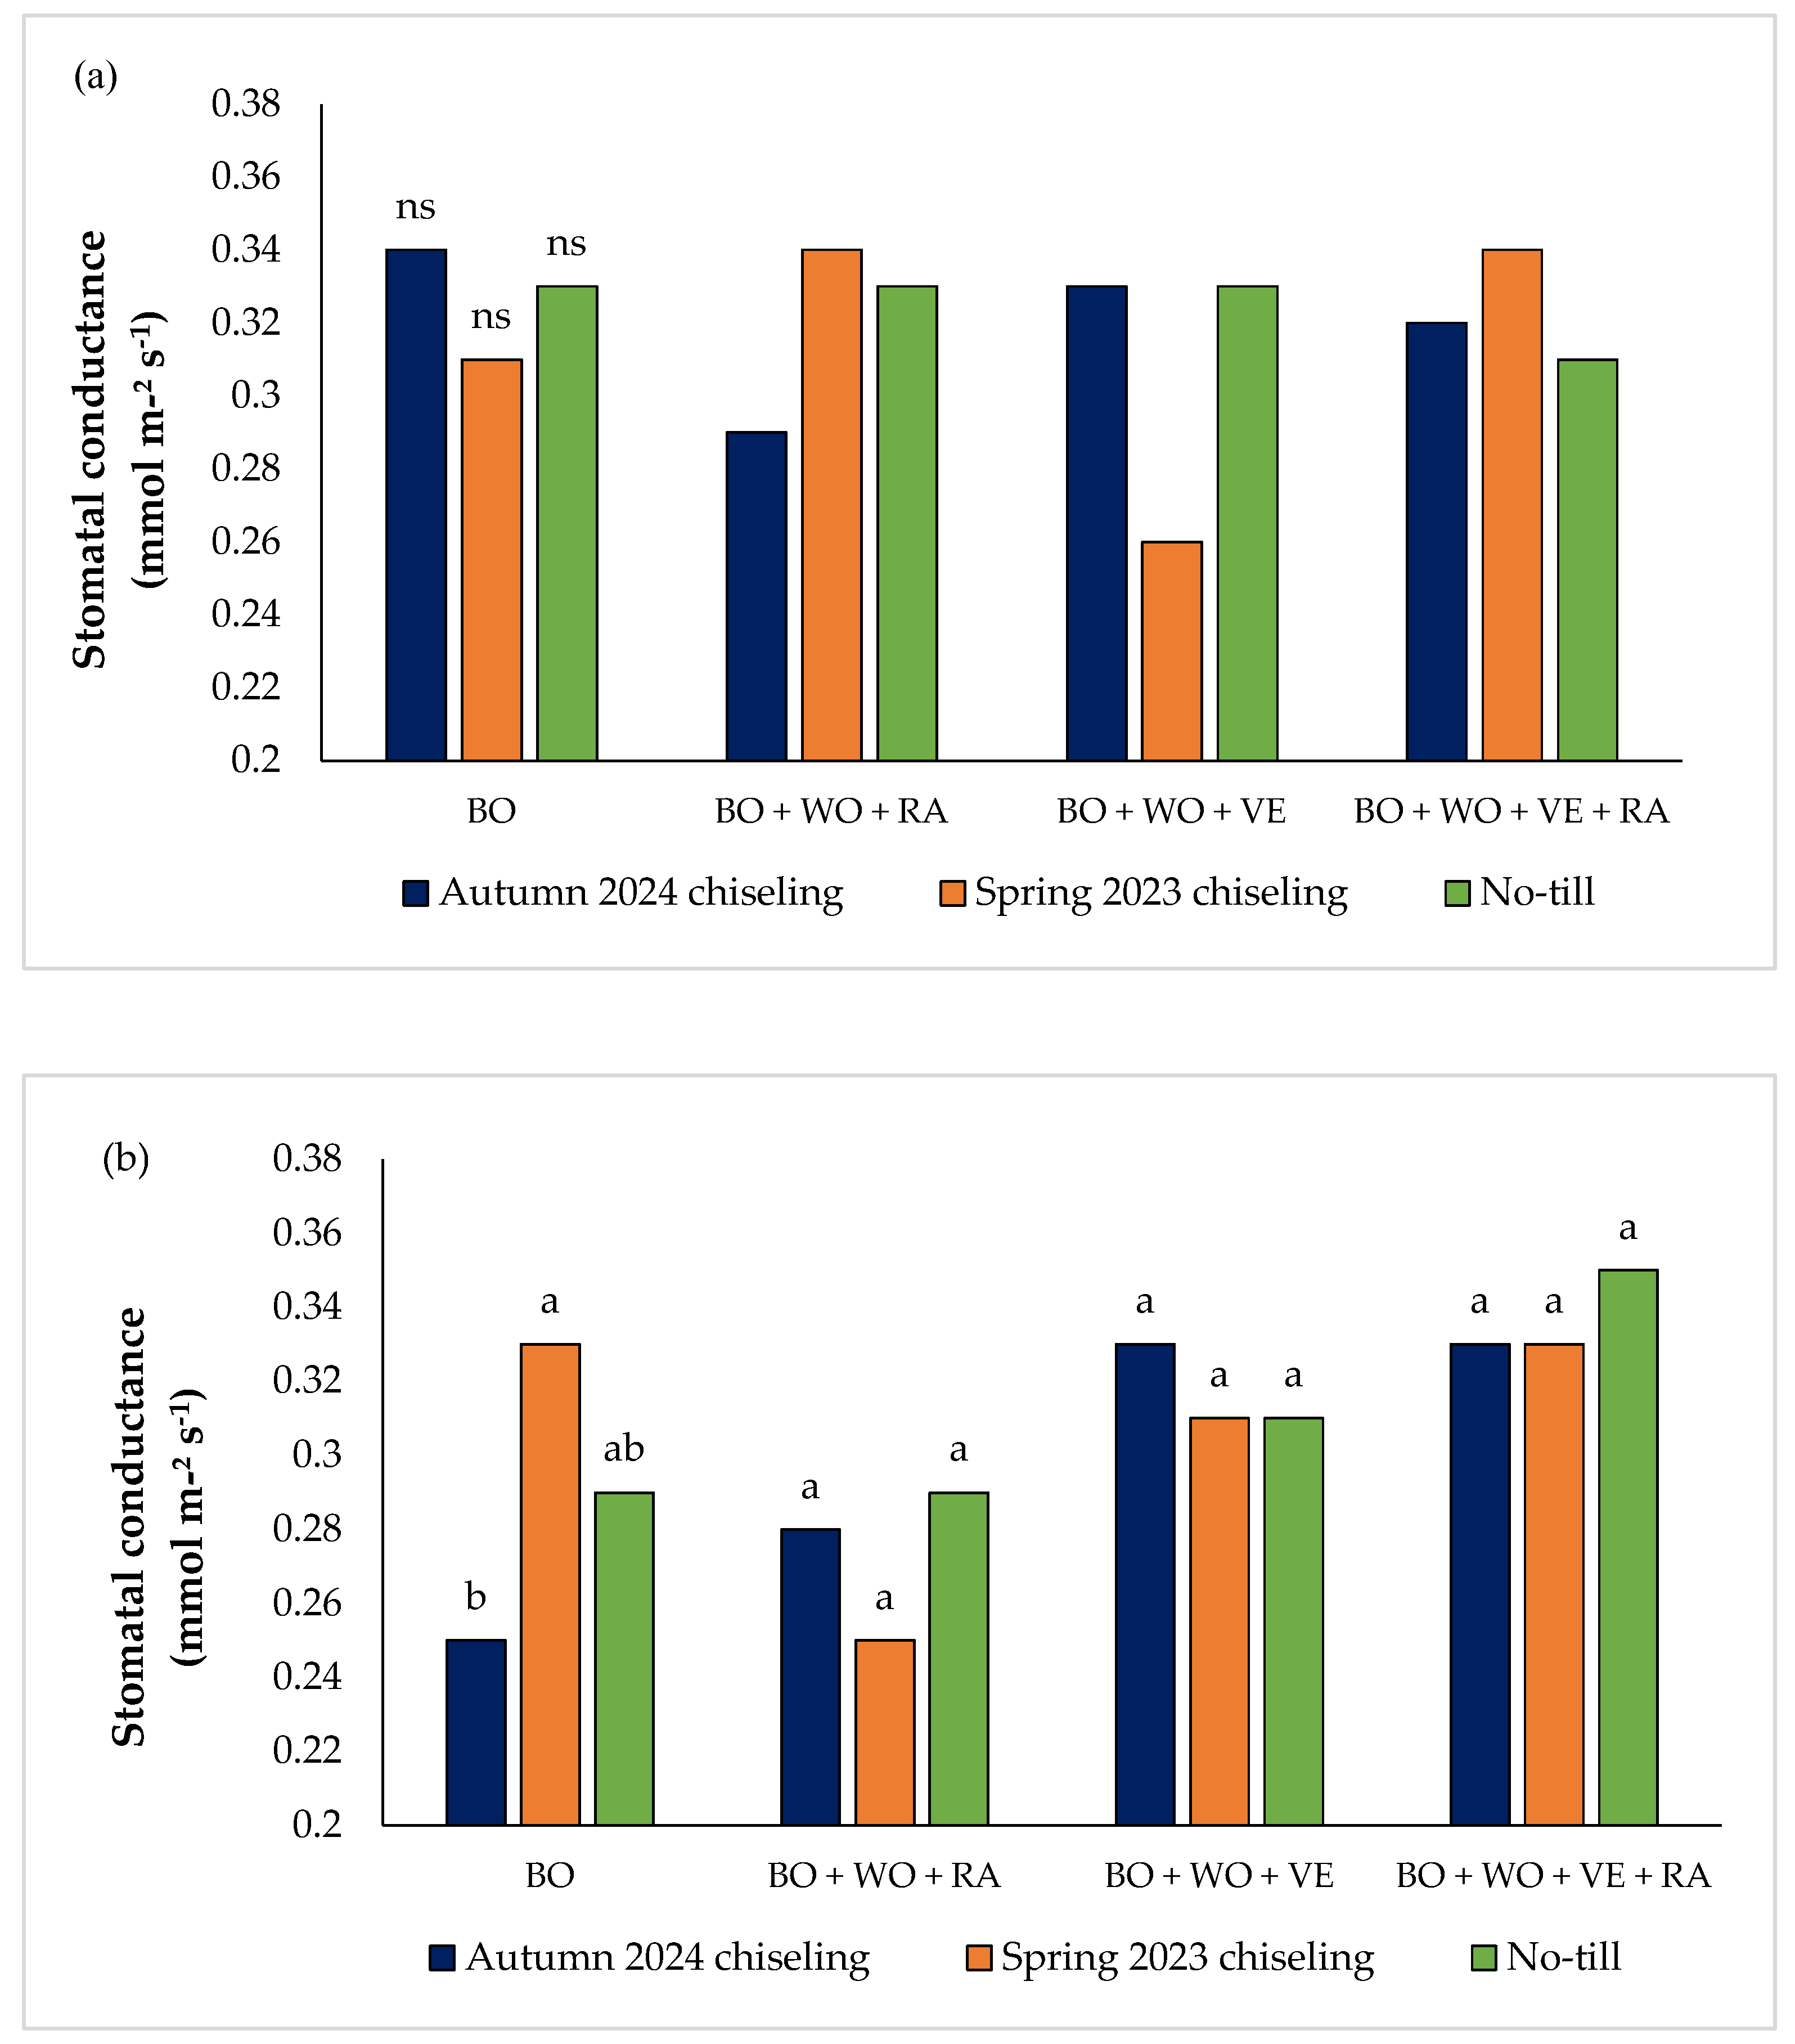
Figure 3.
Figure 3. Soybean stomatal conductance under autumn 2024 chiseling (a), no-till control (b), and spring 2023 chiseling (c) for post-maize millet or fallow and winter cover crops of black oat (BO), white oat (WO), radish (RA), and vetch (VE) as monocultures or in mixtures; 2024/25 growing season, São José do Ouro, RS, Brazil. Different uppercase letters compare post-maize cover crop, and lowercase letters compare the cover crops according to Tukey’s test (p ≤ 0.05). ns: not significant. Source: Author (2025).
Figure 3.
Figure 3. Soybean stomatal conductance under autumn 2024 chiseling (a), no-till control (b), and spring 2023 chiseling (c) for post-maize millet or fallow and winter cover crops of black oat (BO), white oat (WO), radish (RA), and vetch (VE) as monocultures or in mixtures; 2024/25 growing season, São José do Ouro, RS, Brazil. Different uppercase letters compare post-maize cover crop, and lowercase letters compare the cover crops according to Tukey’s test (p ≤ 0.05). ns: not significant. Source: Author (2025).
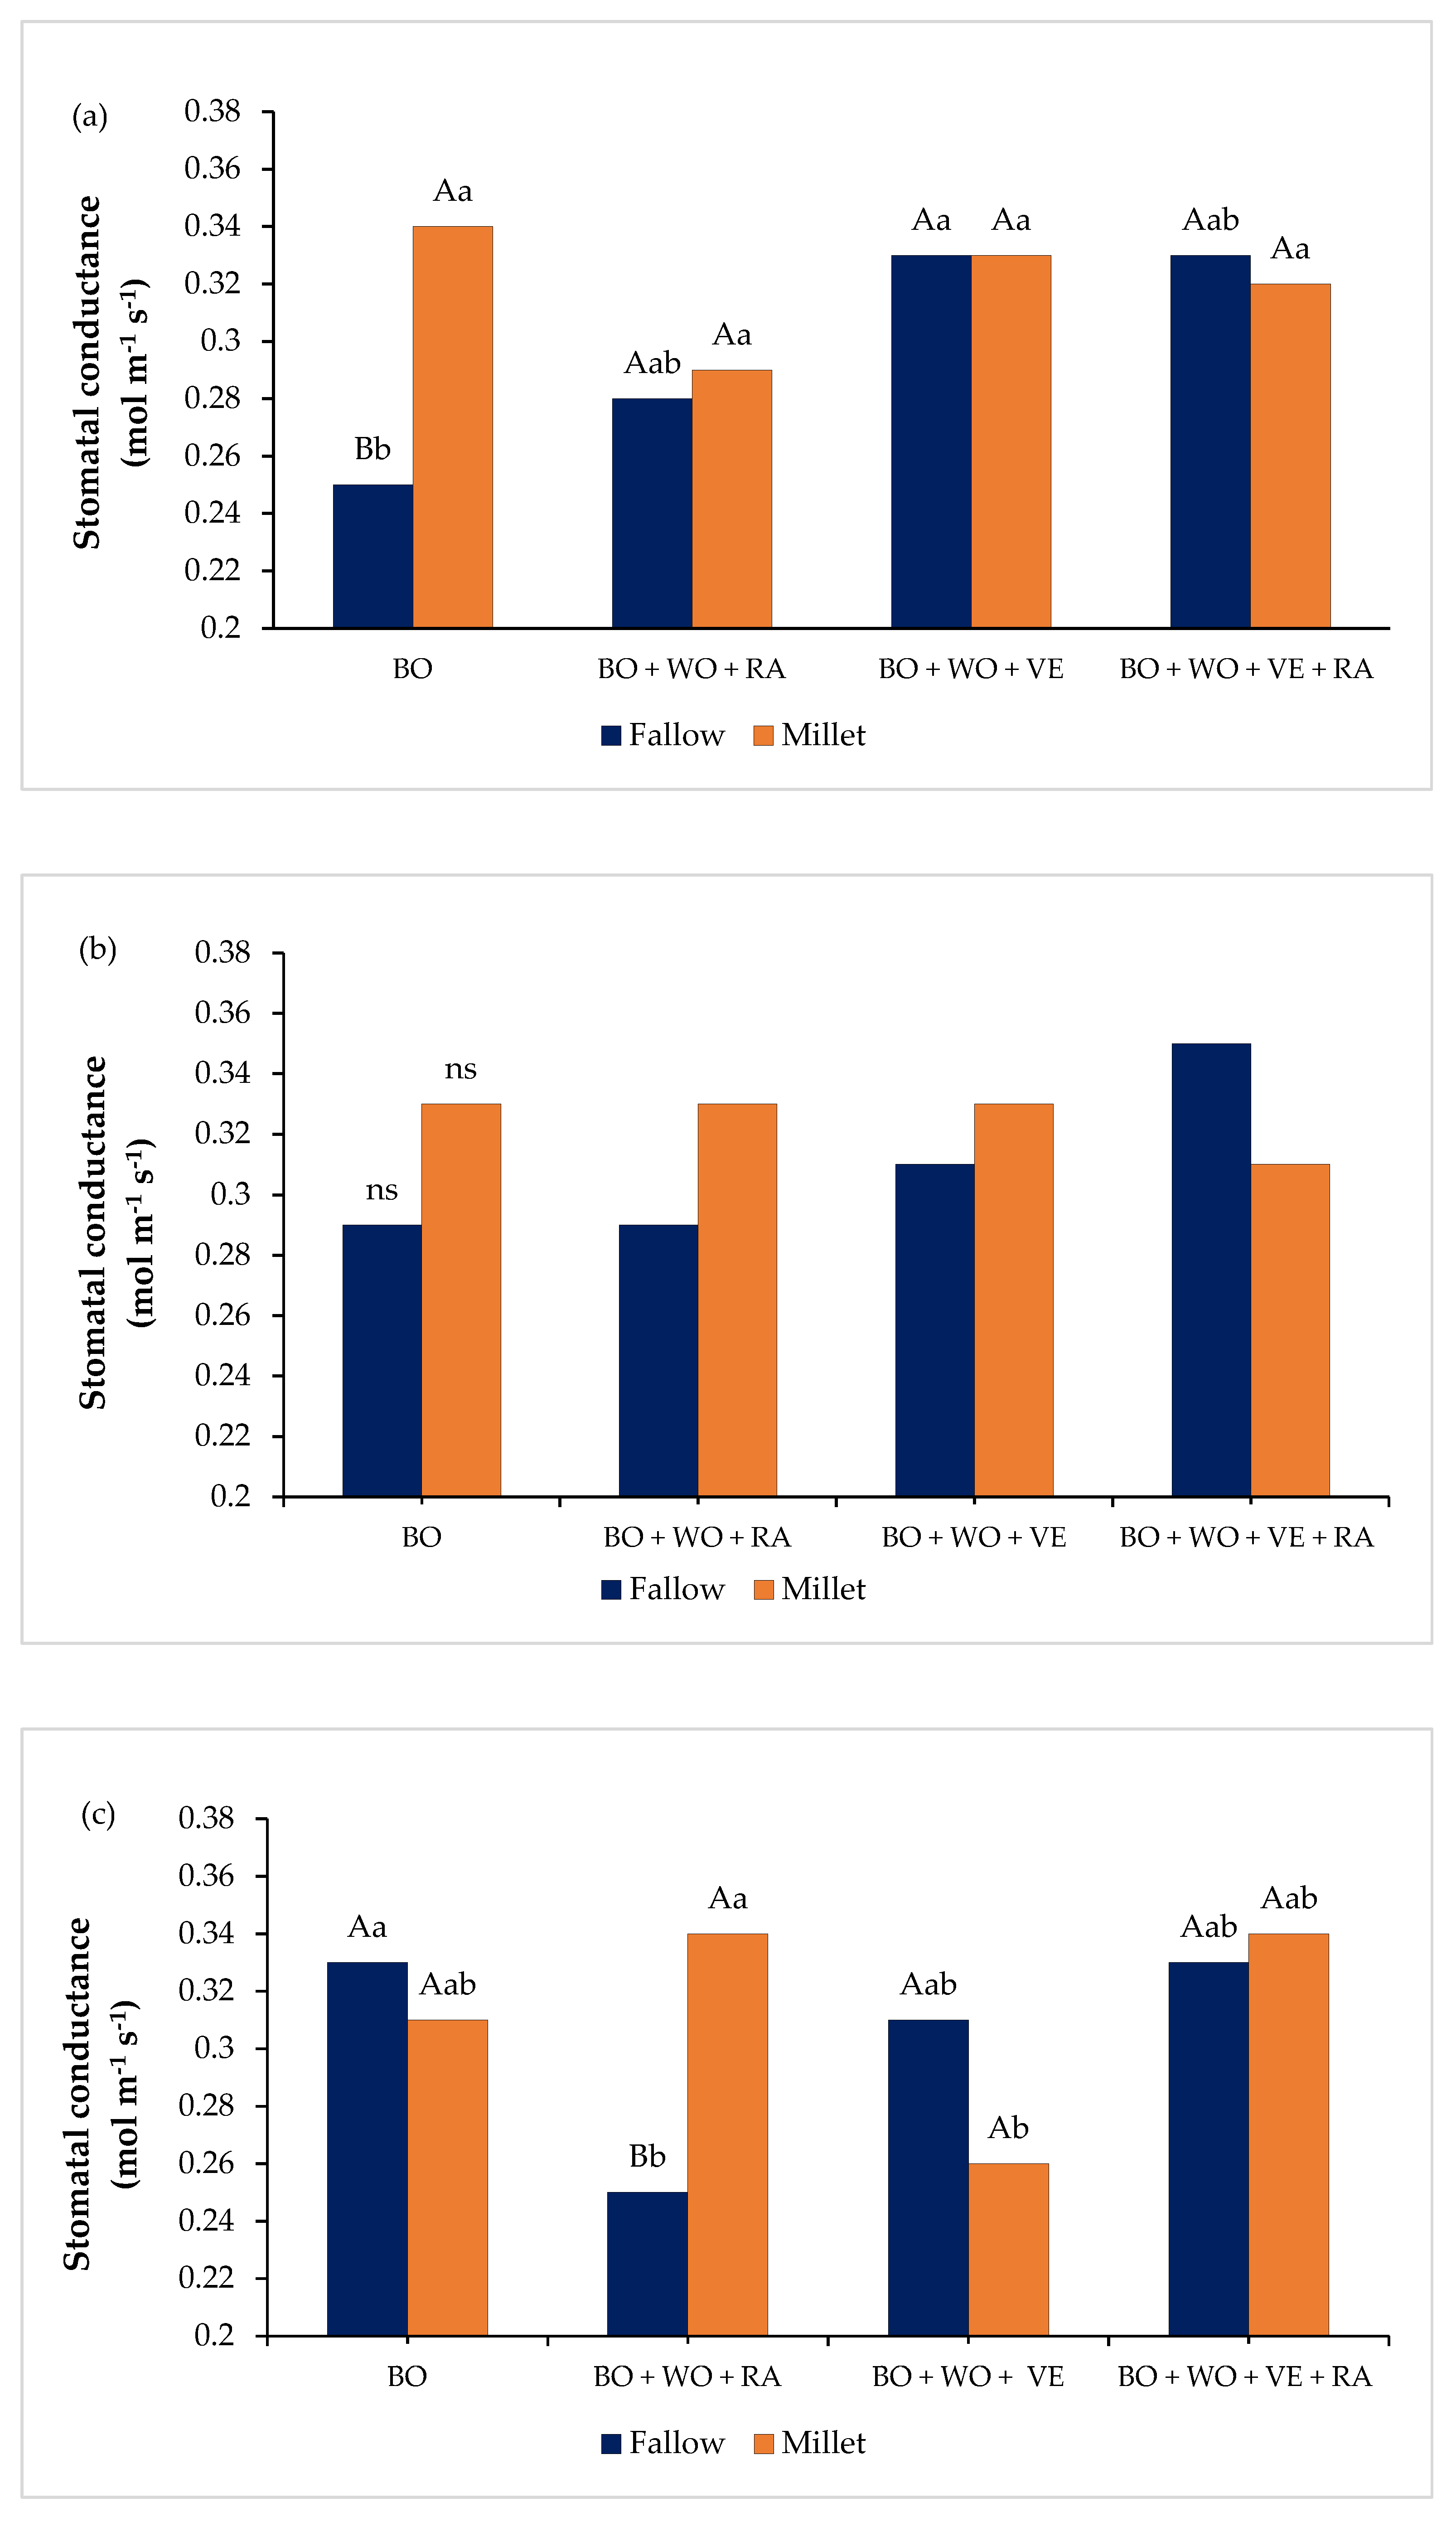
Figure 4.
Soybean grain yield (kg ha-1) in the 2024/25 growing season according to different soil chiseling times. Different letters indicate differences among soil chiseling methods according to Tukey’s test (p ≤ 0.05). ns: not significant. Source: Author (2025).
Figure 4.
Soybean grain yield (kg ha-1) in the 2024/25 growing season according to different soil chiseling times. Different letters indicate differences among soil chiseling methods according to Tukey’s test (p ≤ 0.05). ns: not significant. Source: Author (2025).
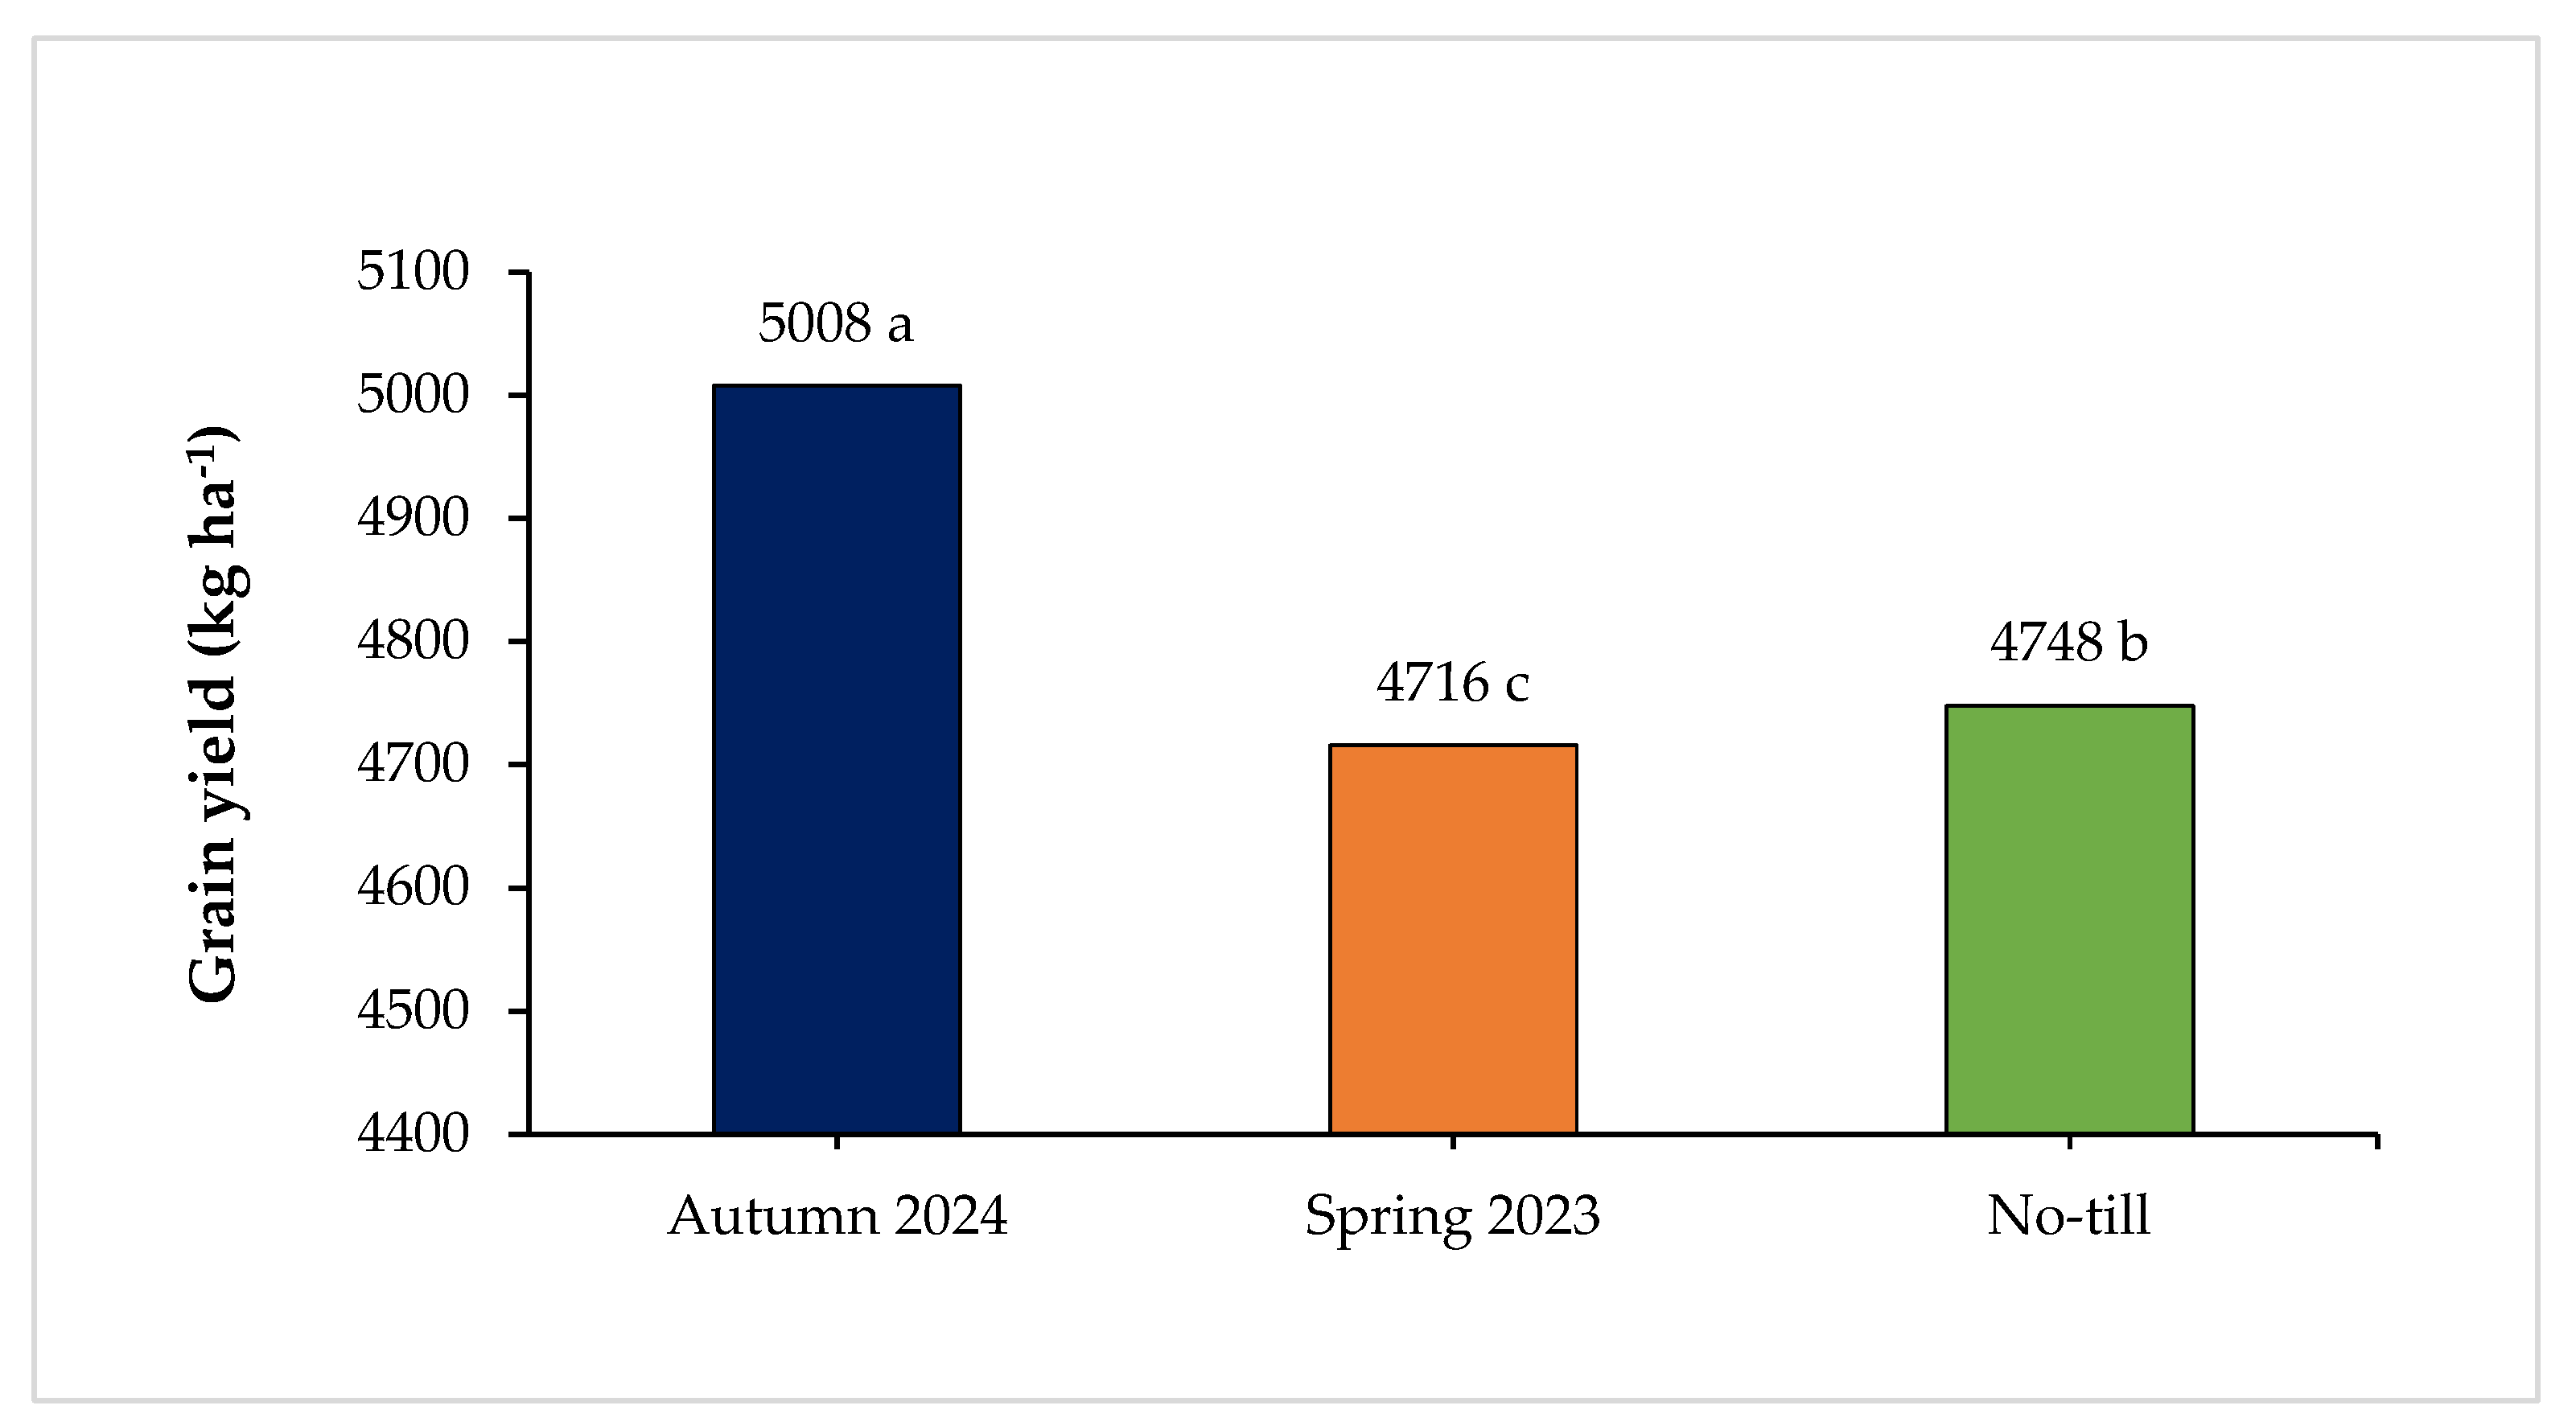
Figure 5.
Thousand-grain weight (TGW) under millet (a) and fallow (b) treatments in autumn and spring chiseling systems and no-till control, as well as winter cover crops of black oat (BO), white oat (WO), radish (RA), and vetch (VE) as monocultures or in mixtures in the 2024/25 growing season, São José do Ouro, RS, Brazil. Different letters indicate differences among soil chiseling methods for each cover crop, according to Tukey’s test (p ≤ 0.05). ns: not significant. Source: Author (2025).
Figure 5.
Thousand-grain weight (TGW) under millet (a) and fallow (b) treatments in autumn and spring chiseling systems and no-till control, as well as winter cover crops of black oat (BO), white oat (WO), radish (RA), and vetch (VE) as monocultures or in mixtures in the 2024/25 growing season, São José do Ouro, RS, Brazil. Different letters indicate differences among soil chiseling methods for each cover crop, according to Tukey’s test (p ≤ 0.05). ns: not significant. Source: Author (2025).
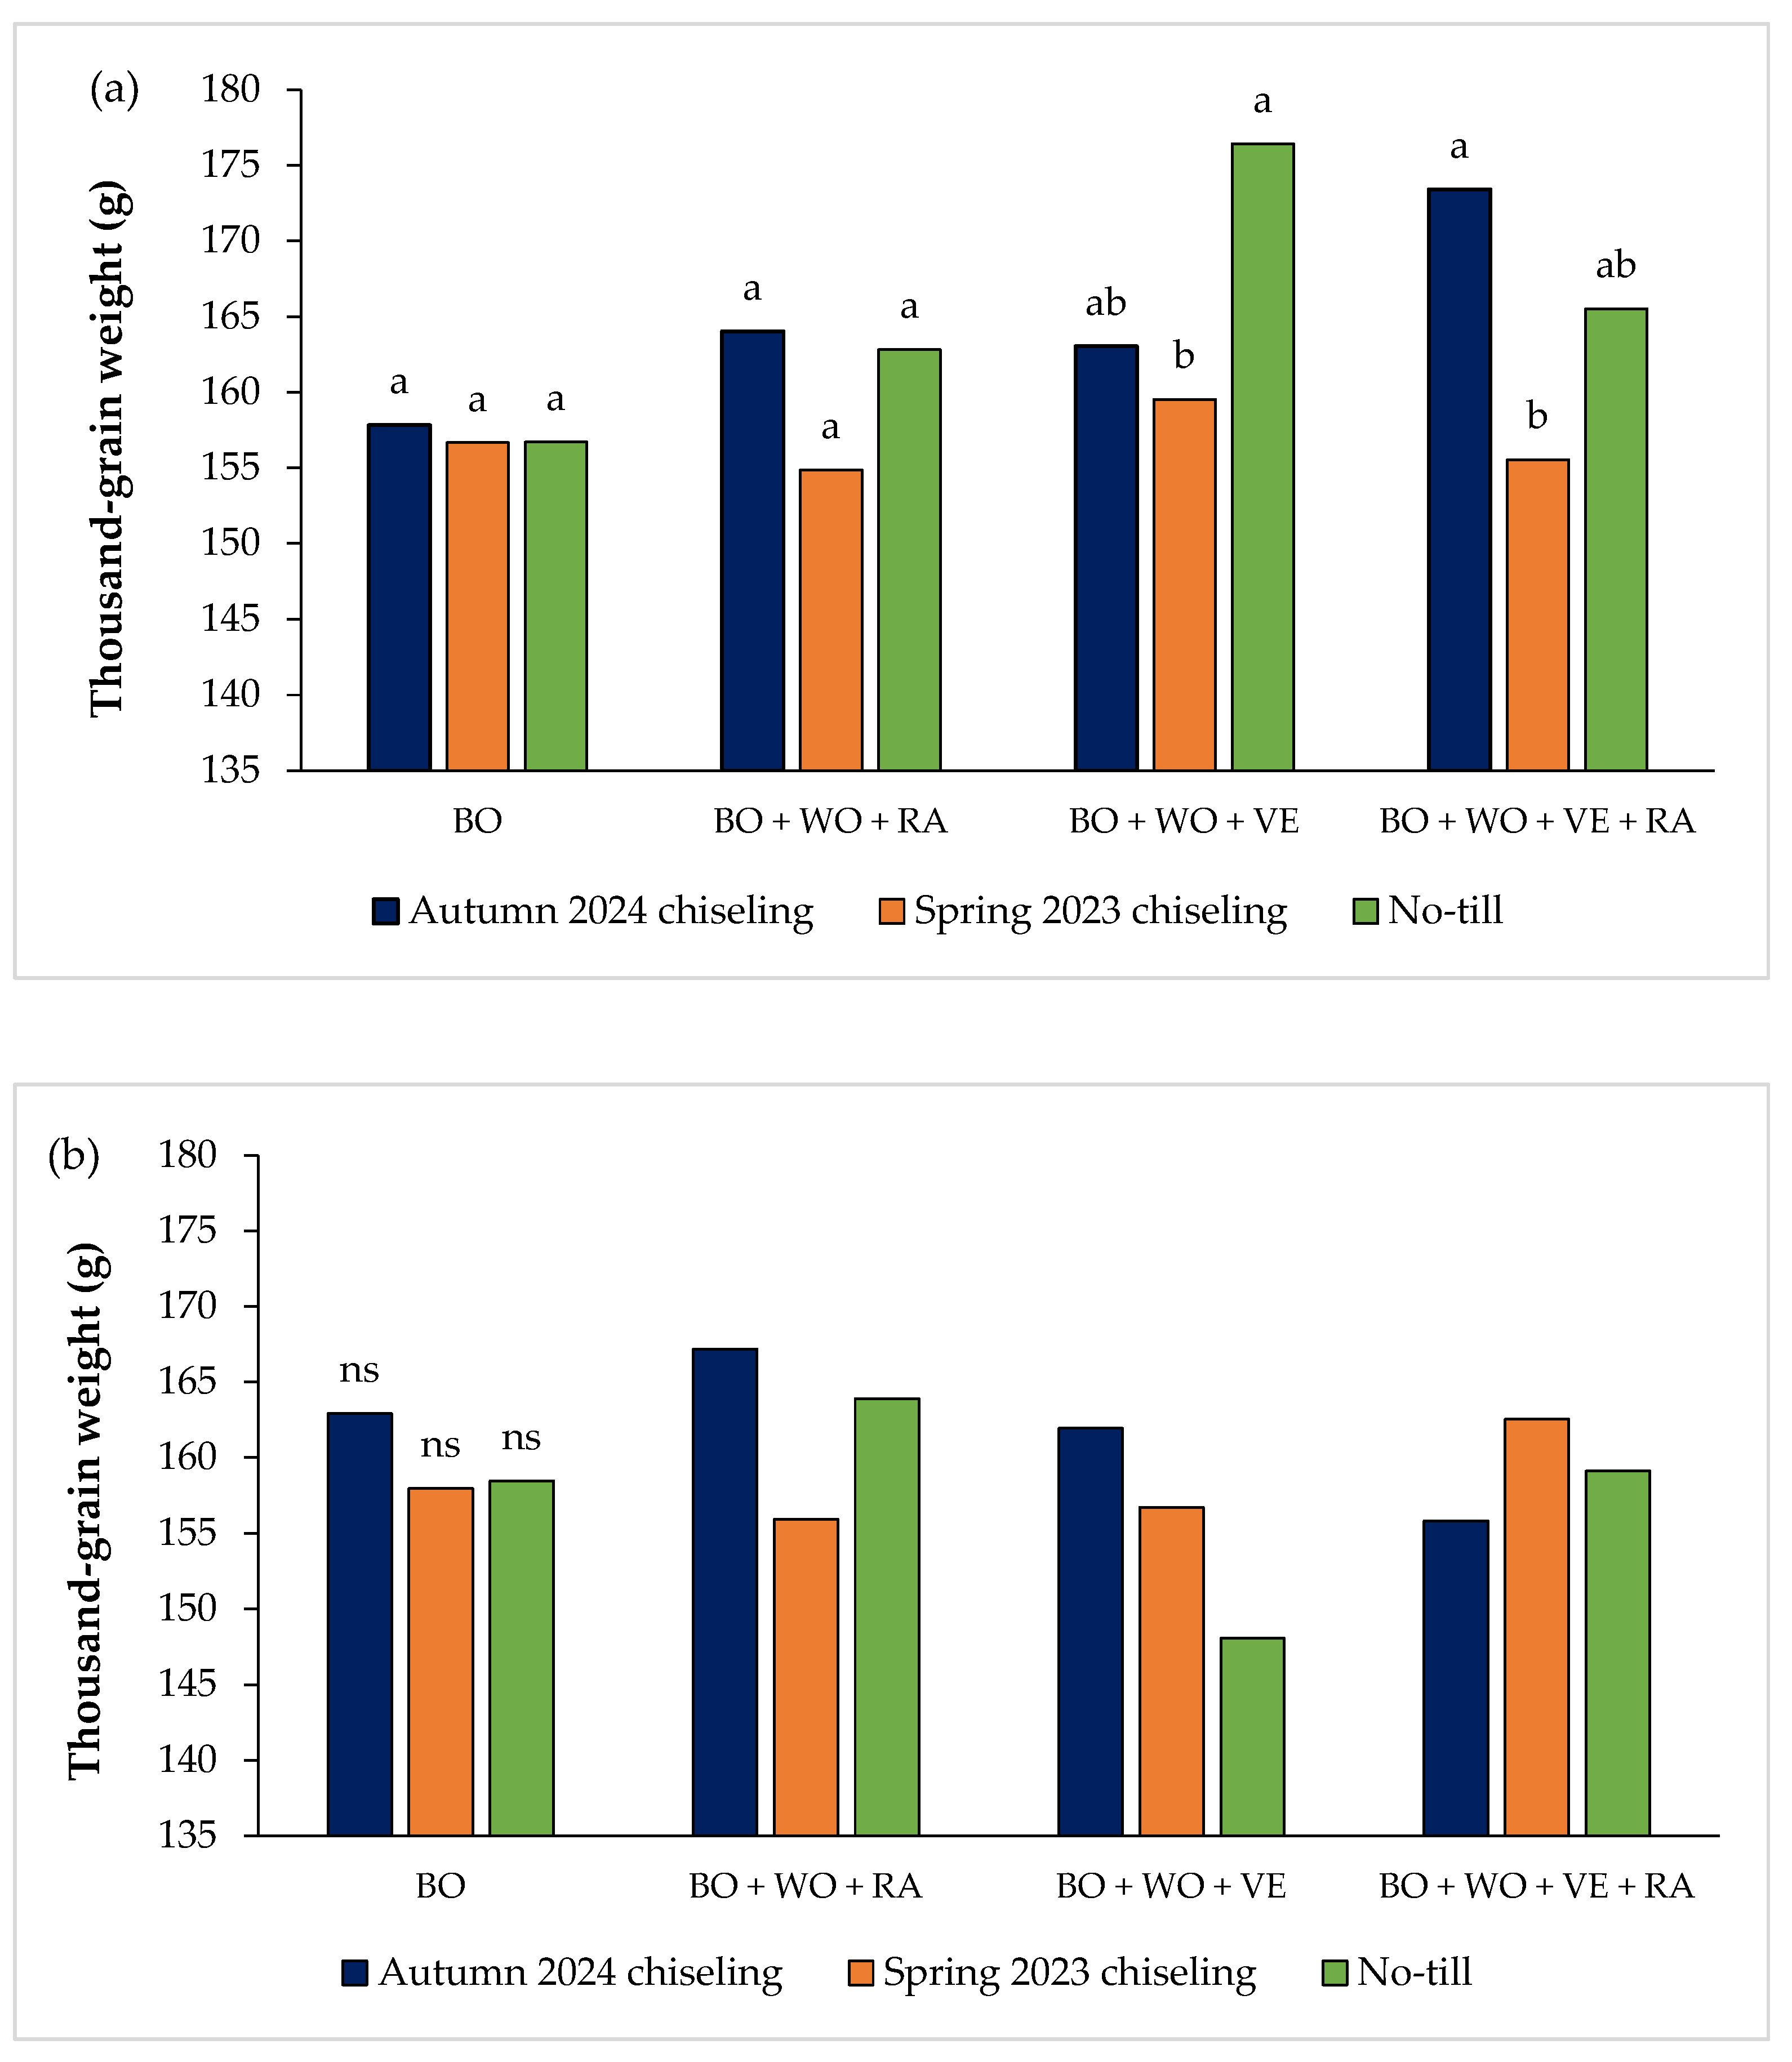
Figure 6.
Thousand-grain weight (TGW) under autumn 2024 chiseling (a), no-till control (b) and spring 2023 chiseling (c) treatments for post-maize management with or without millet, as well as winter cover crops of black oat (BO), white oat (WO), radish (RA), and vetch (VE) as a monoculture or in mixture; 2024/25 growing season, São José do Ouro, RS, Brazil. Different uppercase letters compare post-maize management and lowercase letters compare cover crops according to Tukey’s test (p ≤ 0.05). ns: not significant. Source: Author (2025).
Figure 6.
Thousand-grain weight (TGW) under autumn 2024 chiseling (a), no-till control (b) and spring 2023 chiseling (c) treatments for post-maize management with or without millet, as well as winter cover crops of black oat (BO), white oat (WO), radish (RA), and vetch (VE) as a monoculture or in mixture; 2024/25 growing season, São José do Ouro, RS, Brazil. Different uppercase letters compare post-maize management and lowercase letters compare cover crops according to Tukey’s test (p ≤ 0.05). ns: not significant. Source: Author (2025).
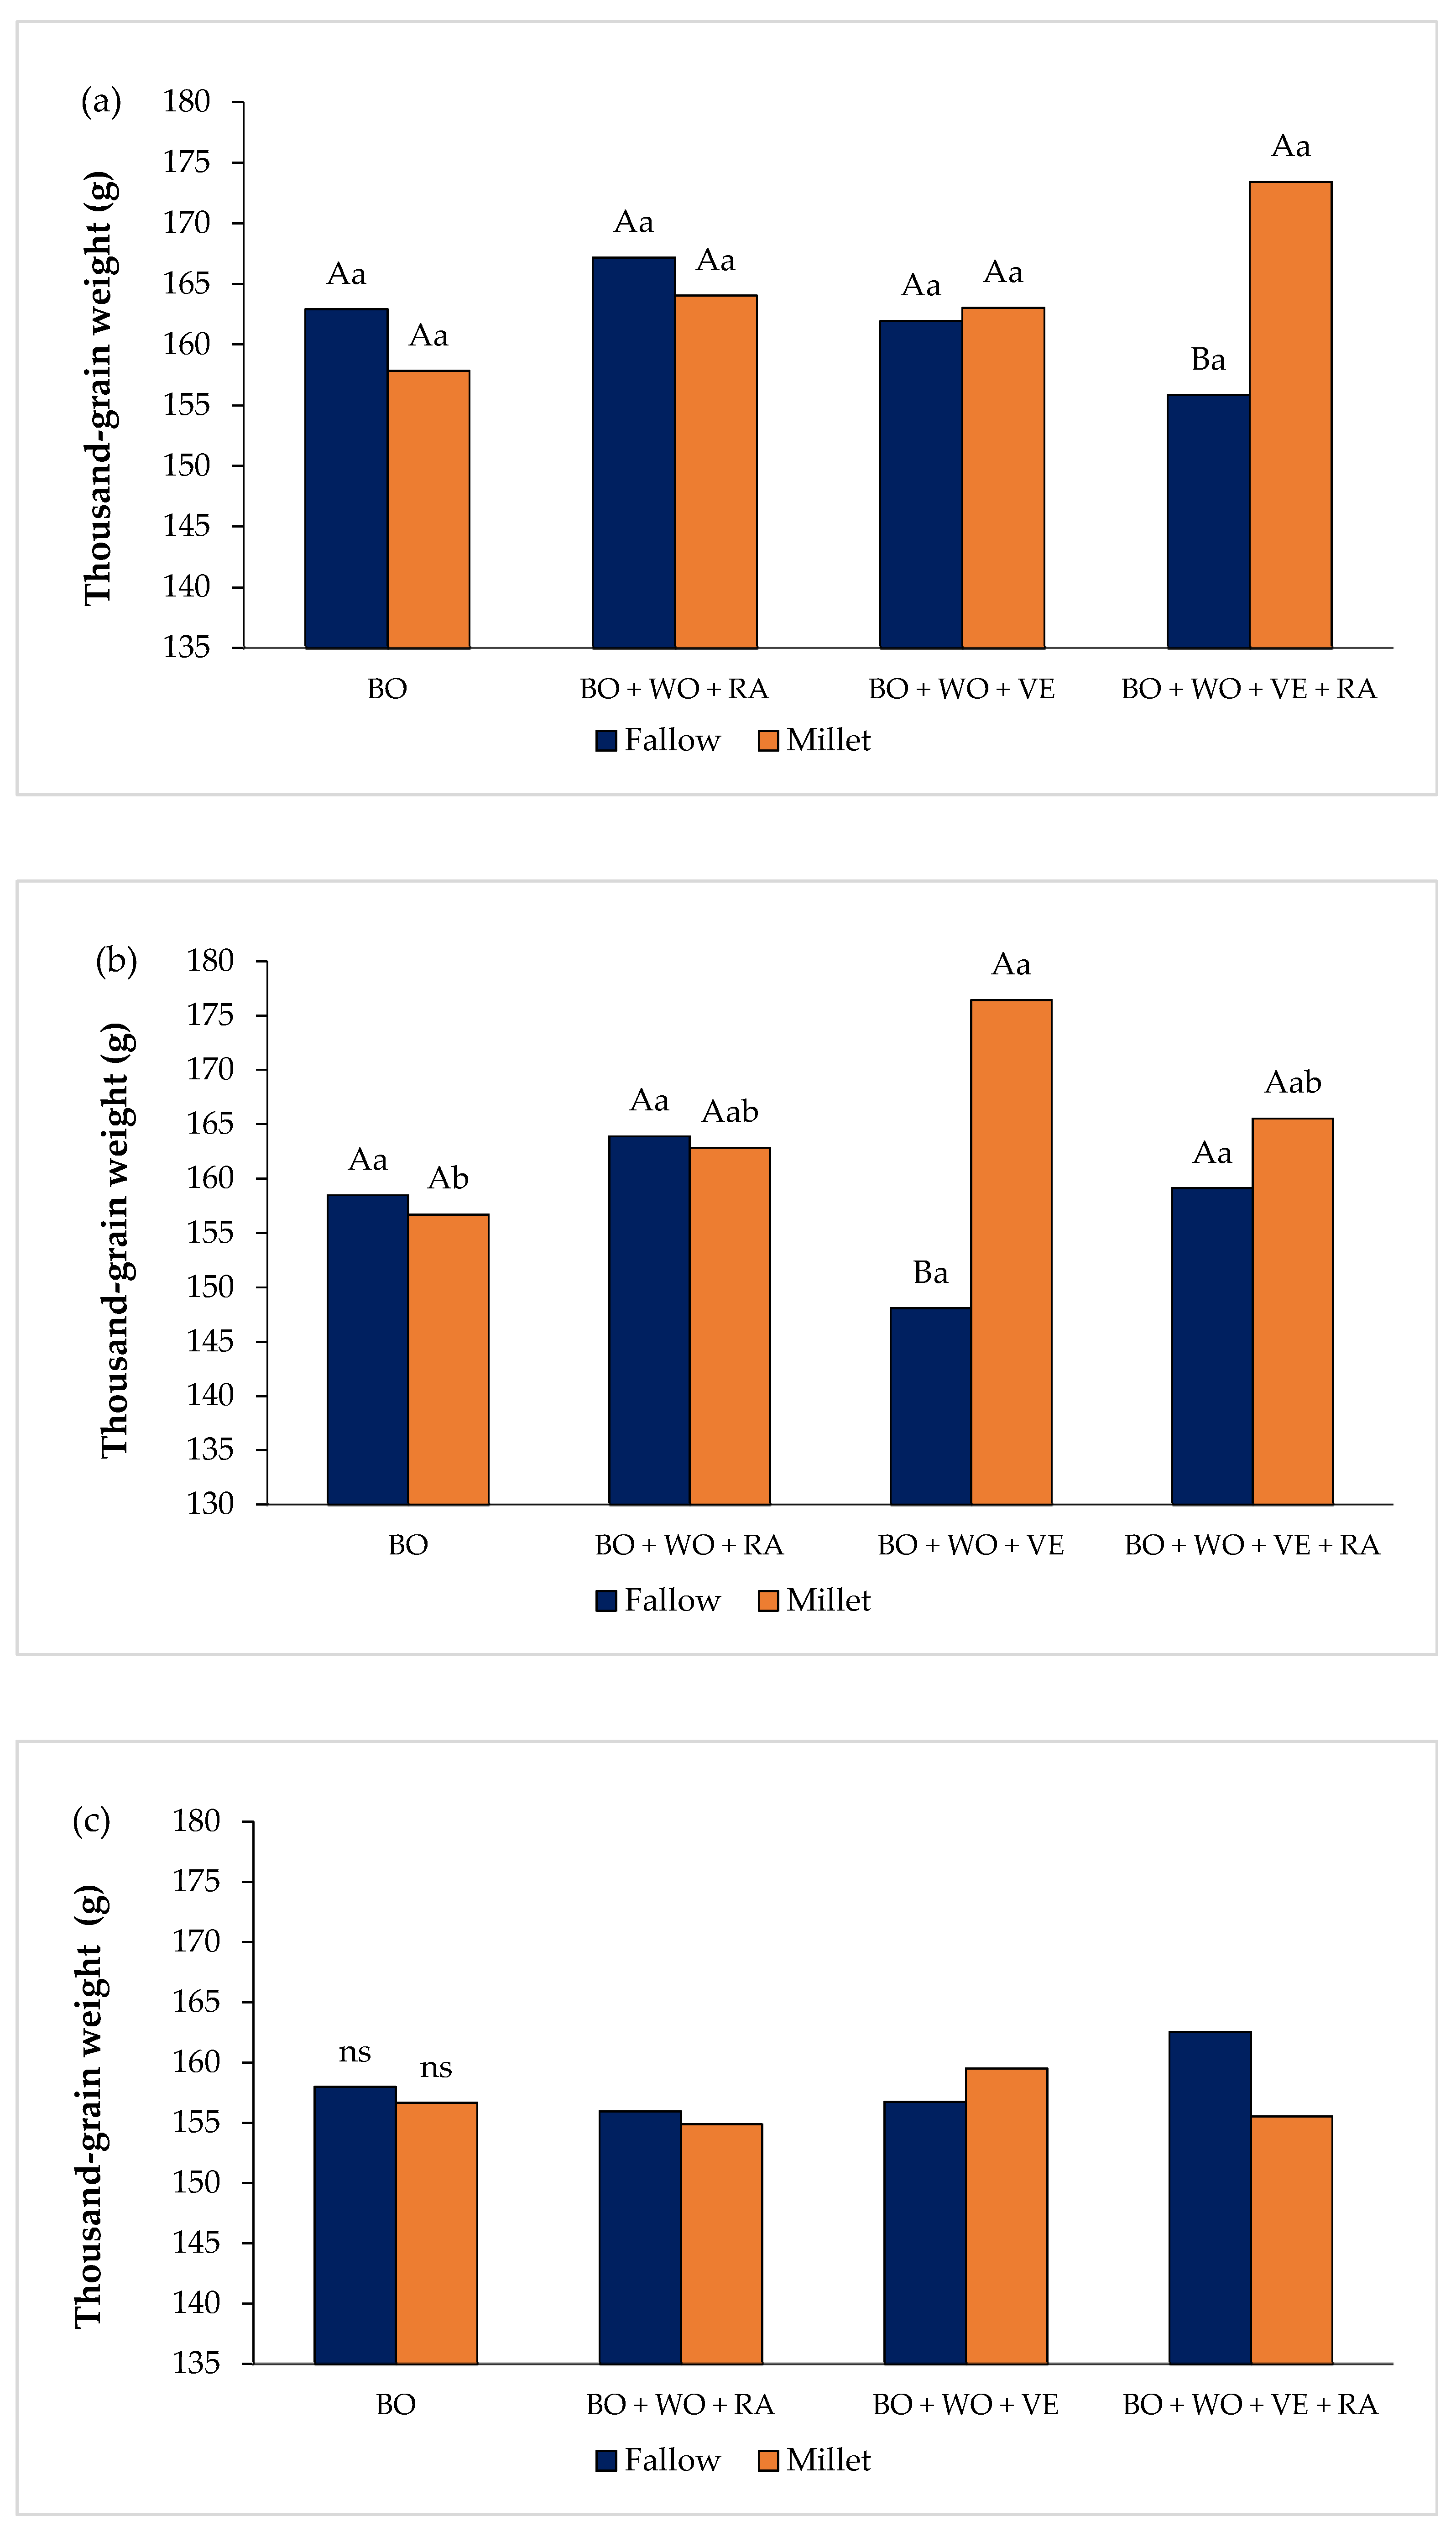
Figure 7.
Soil penetration resistance (PR, kPa) in 0–5, 5–10, 10–15, 15–20, 20–25, 25–30, 30–35, and 35–40 cm layers, according to spring 2023 chiseling, autumn 2024 chiseling, and no-till control. Different letters in the layers statistically differ according to Tukey’s test (p ≤ 0.05). ns: not significant. Source: Author (2025).
Figure 7.
Soil penetration resistance (PR, kPa) in 0–5, 5–10, 10–15, 15–20, 20–25, 25–30, 30–35, and 35–40 cm layers, according to spring 2023 chiseling, autumn 2024 chiseling, and no-till control. Different letters in the layers statistically differ according to Tukey’s test (p ≤ 0.05). ns: not significant. Source: Author (2025).
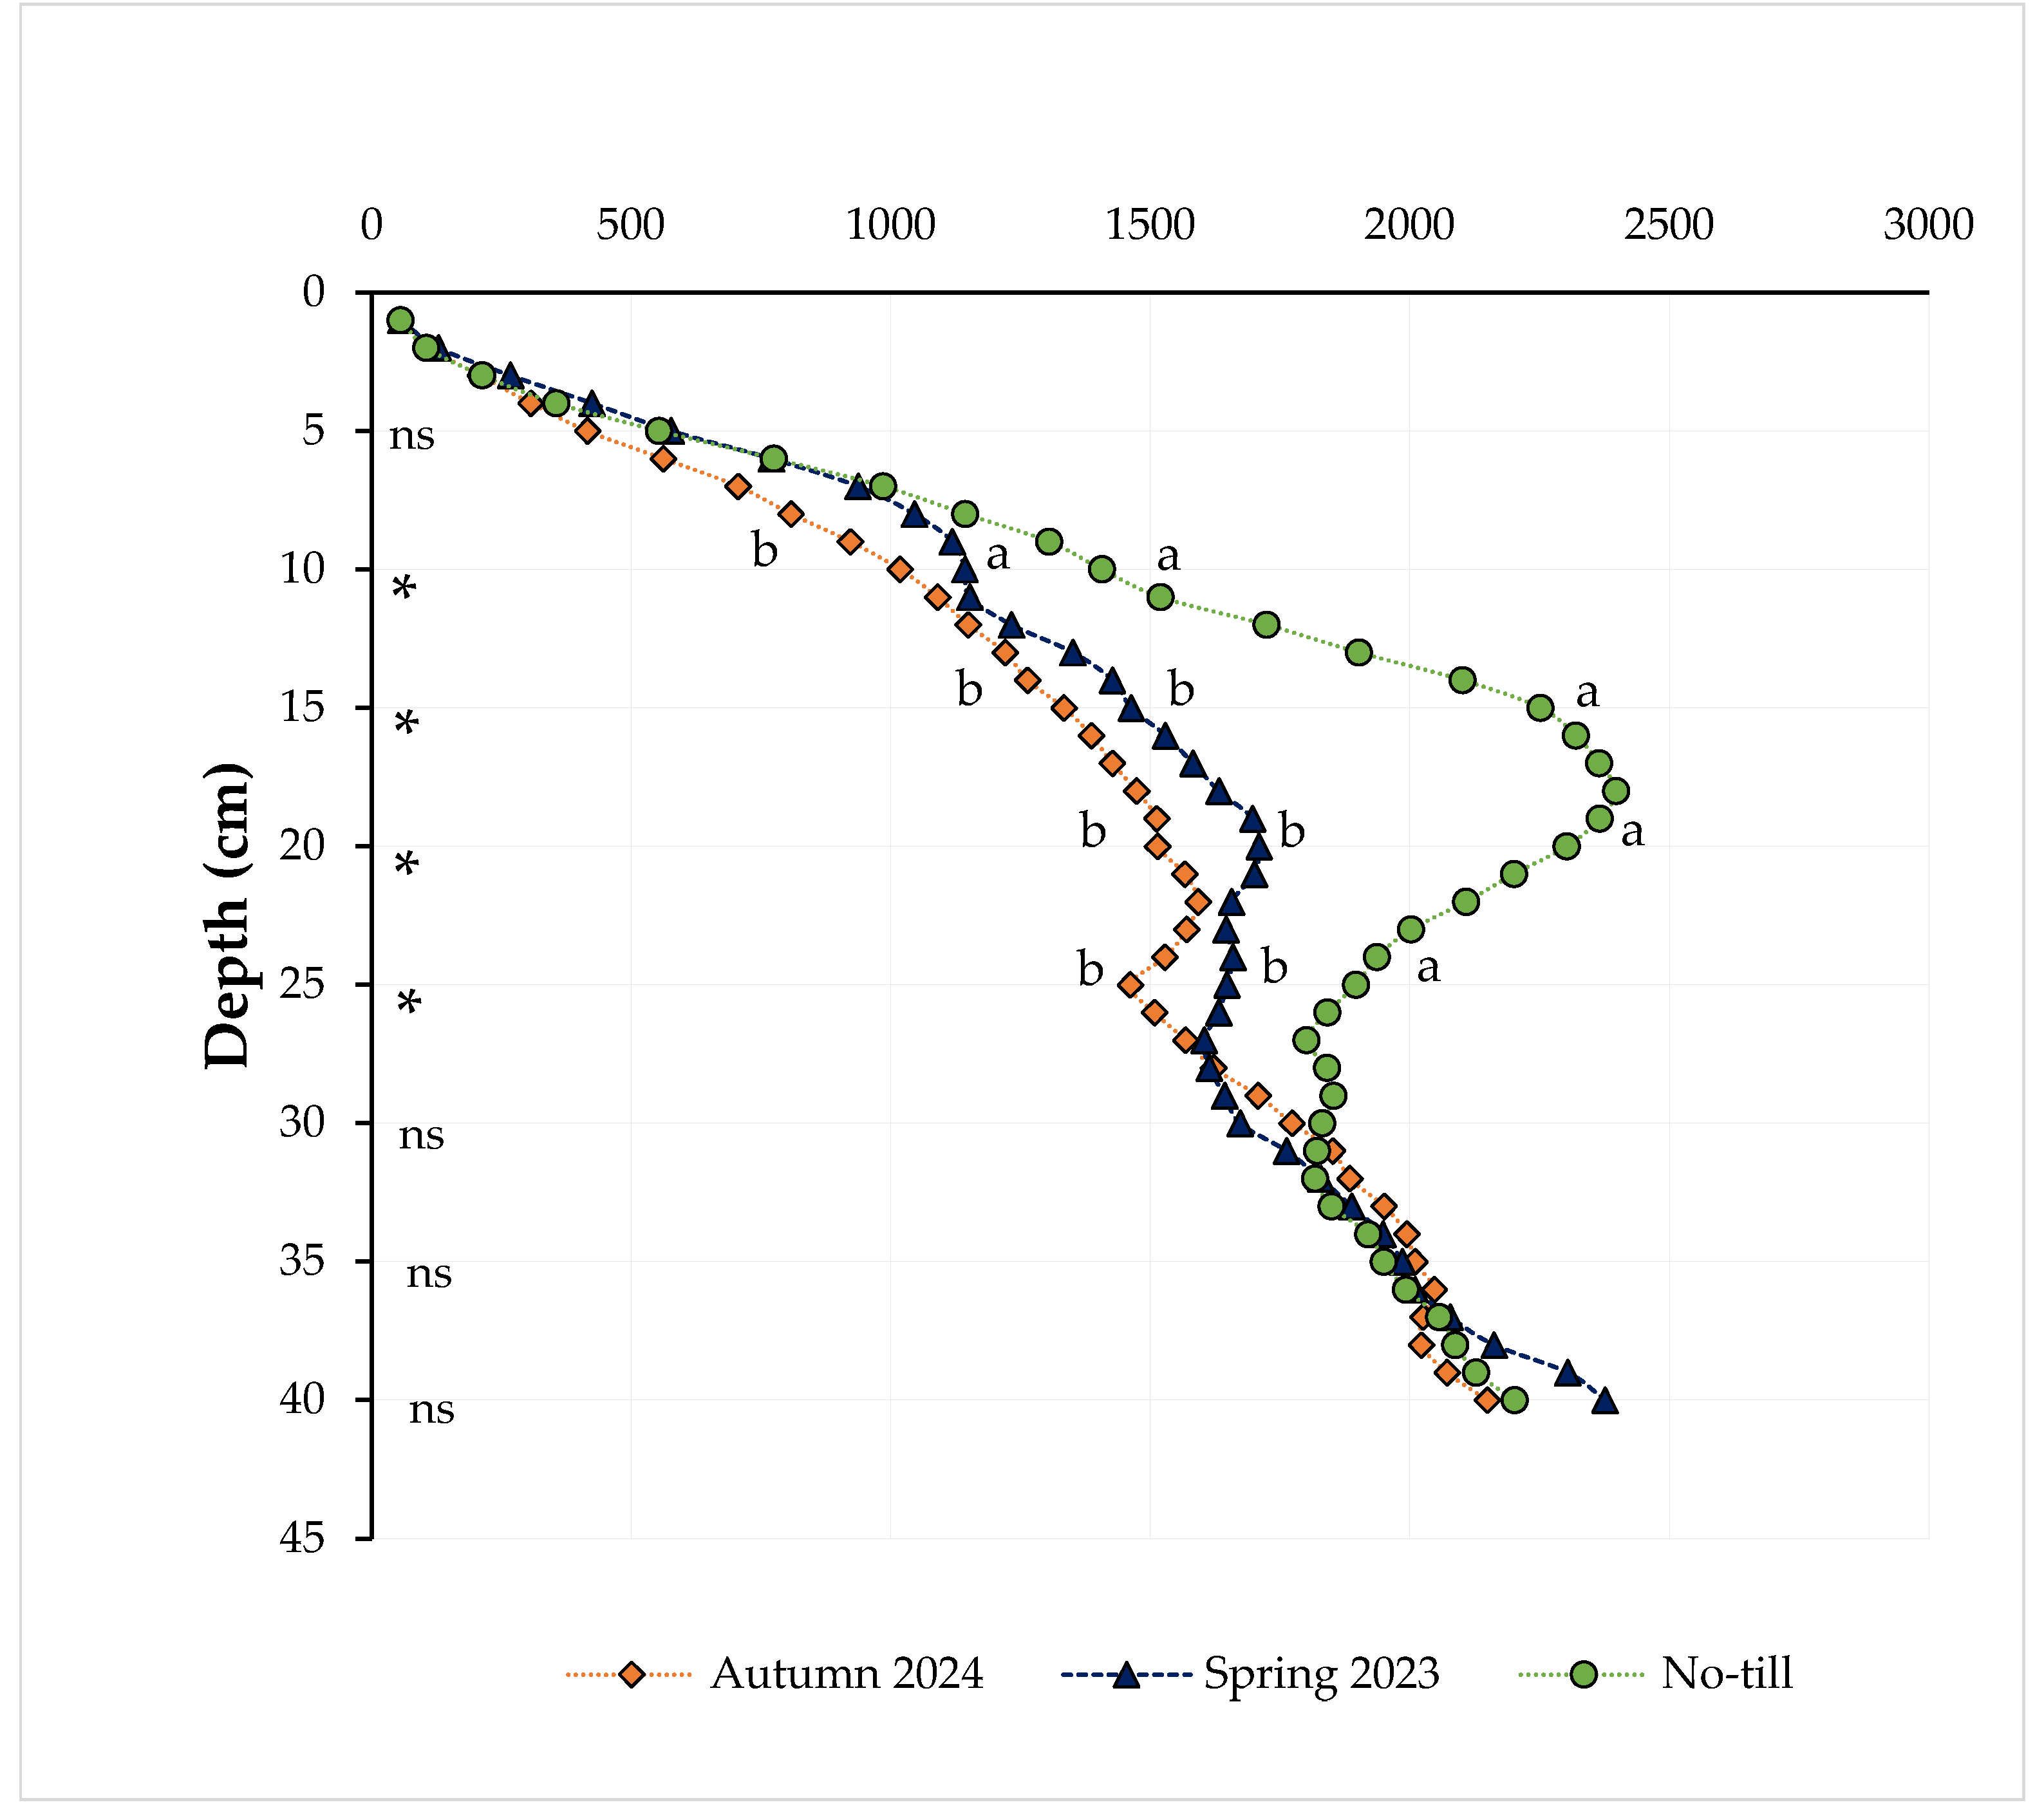
Figure 9.
Water content at field capacity (cm3 cm-3) in the 0–5 cm layer according to post-maize management. Different letters in the columns statistically differ according to Tukey’s test (p ≤ 0.05). ns: not significant. Source: Author (2025).
Figure 9.
Water content at field capacity (cm3 cm-3) in the 0–5 cm layer according to post-maize management. Different letters in the columns statistically differ according to Tukey’s test (p ≤ 0.05). ns: not significant. Source: Author (2025).
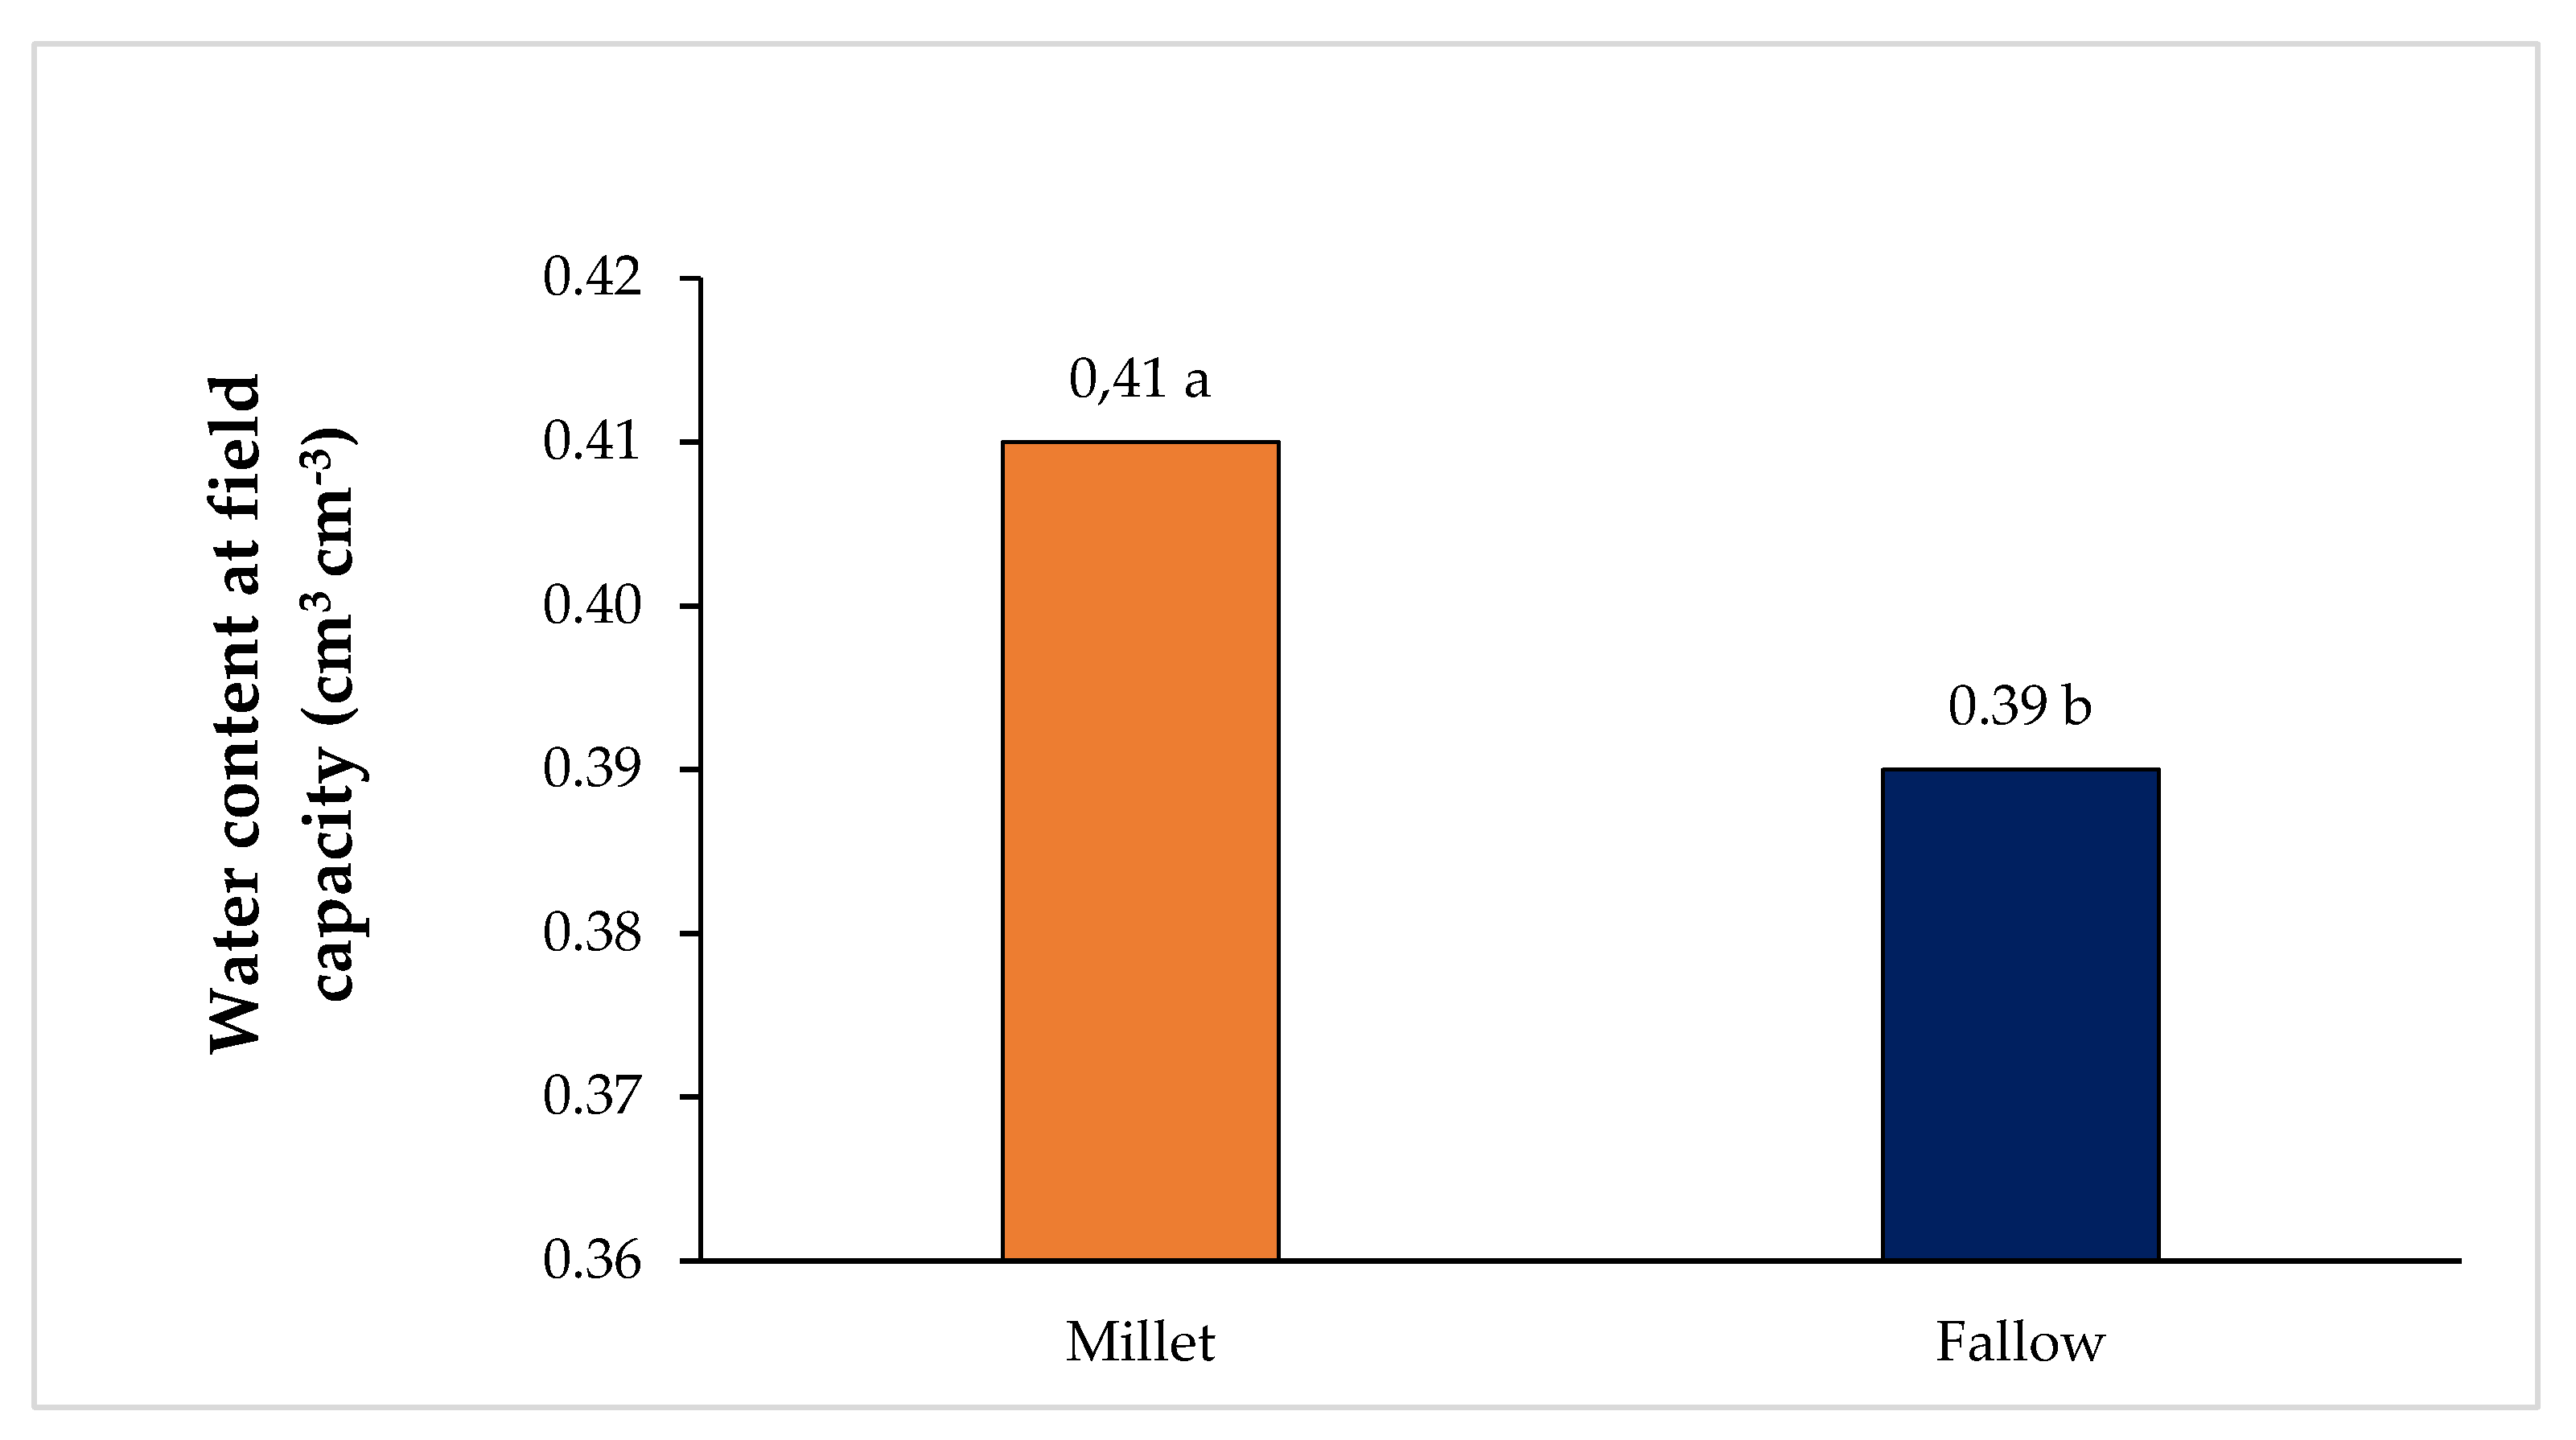
Figure 10.
Water content at field capacity (cm3 cm-3) in the 0–5, 5–10, 10–15, 15–20, and 20–30 cm layers according to spring 2023 chiseling, autumn 2024 chiseling, and no-till control. Different letters in the layers statistically differ according to Tukey’s test (p ≤ 0.05). ns: not significant. Source: Author (2025).
Figure 10.
Water content at field capacity (cm3 cm-3) in the 0–5, 5–10, 10–15, 15–20, and 20–30 cm layers according to spring 2023 chiseling, autumn 2024 chiseling, and no-till control. Different letters in the layers statistically differ according to Tukey’s test (p ≤ 0.05). ns: not significant. Source: Author (2025).
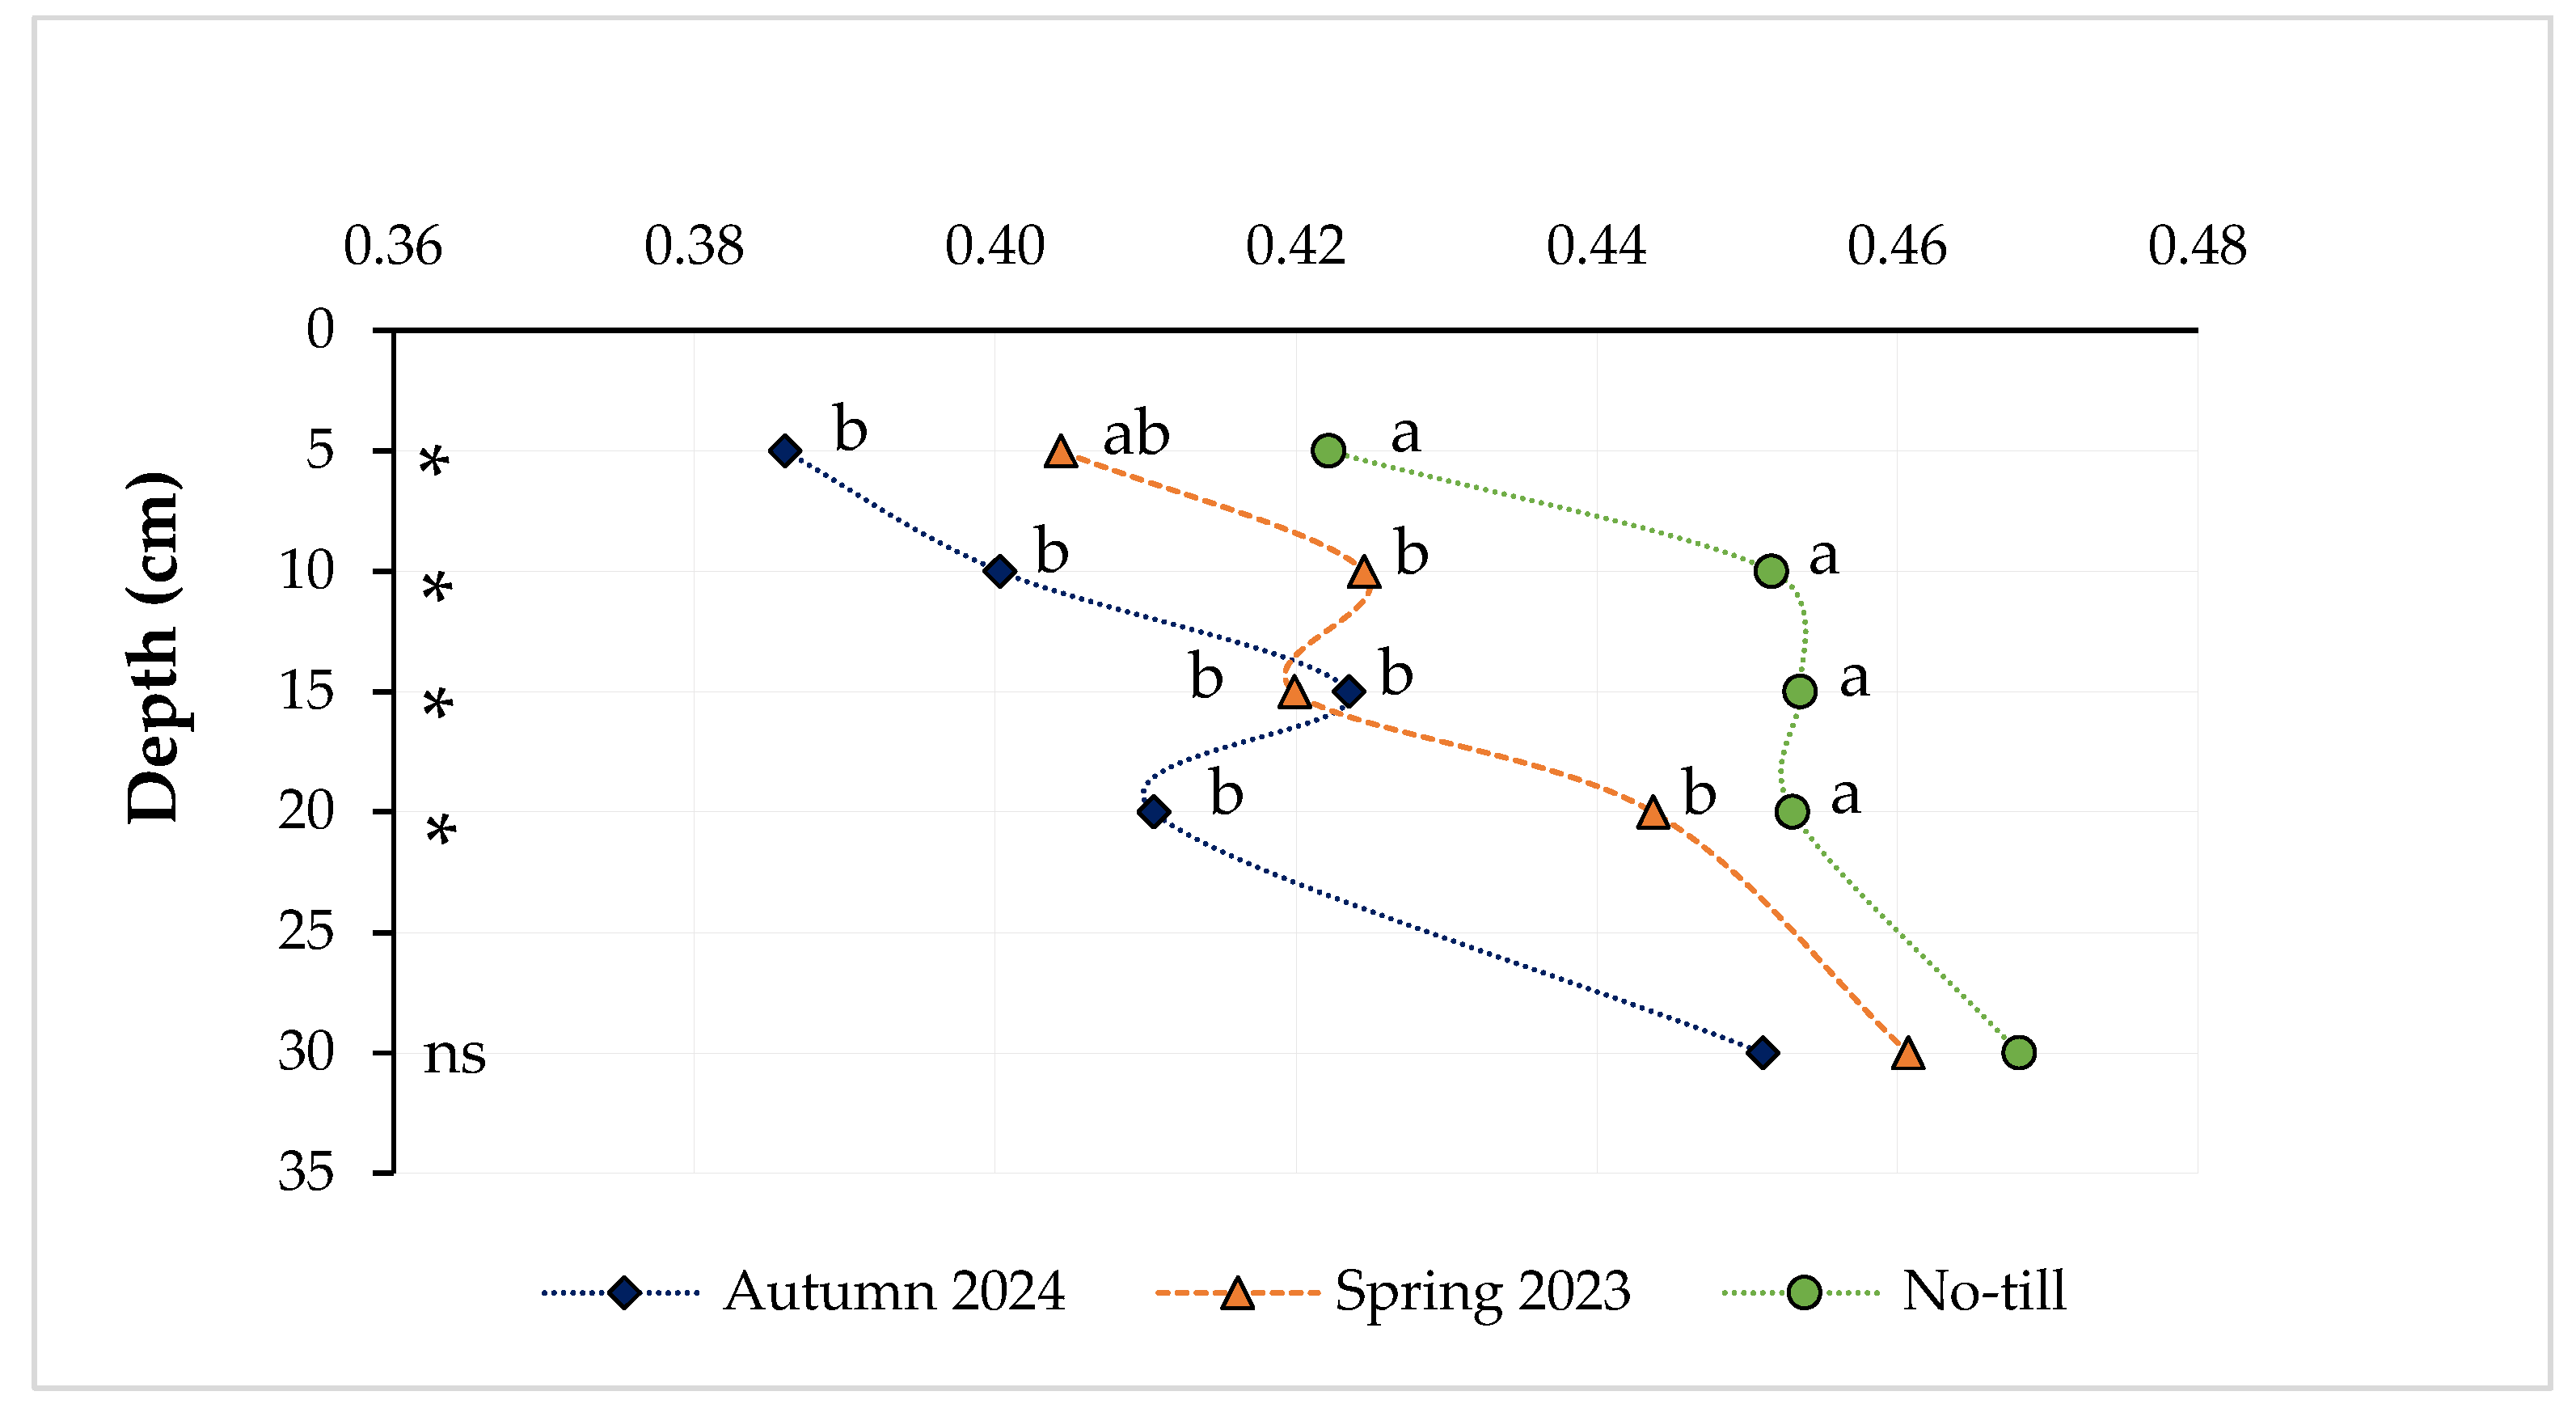

Table 1.
Mean values of photosynthetic rate (µmol m-2 s-1), leaf transpiration (mol H2O m-2 s-1), internal CO2 concentration (µmol m-1), CO2 assimilation rate (µmol m-2 s-1), and carboxylation efficiency (mol CO2 m-2 s-1) according to soil chiseling, millet, and winter cover crops.
Table 1.
Mean values of photosynthetic rate (µmol m-2 s-1), leaf transpiration (mol H2O m-2 s-1), internal CO2 concentration (µmol m-1), CO2 assimilation rate (µmol m-2 s-1), and carboxylation efficiency (mol CO2 m-2 s-1) according to soil chiseling, millet, and winter cover crops.
| Source of variation | Photosynthetic rate | Leaf transpiration | Internal CO2 concentration | CO2 assimilation rate | Carboxylation efficiency | |
| Soil chiseling | ||||||
| Autumn 2024 | 27.67 ns | 2.66 ns | 354.16 ns | 85.75 ns | 0.08 ns | |
| Spring 2023 | 27.48 | 2.78 | 357.33 | 85.16 | 0.07 | |
| Control | 26.89 | 2.73 | 364.16 | 83.33 | 0.07 | |
| Post-maize management | ||||||
| Millet | 27.95 ns | 2.74 ns | 358.00 ns | 86.61 ns | 0.08 ns | |
| Fallow | 26.74 | 2.70 | 359.11 | 82.88 | 0.07 | |
| Winter cover crops | ||||||
| BO | 28.06 ns | 2.82 ns | 350.33 ns | 87.11 ns | 0.08 ns | |
| BO + WO + VE | 26.46 | 2.71 | 367.33 | 82.00 | 0.07 | |
| BO + WO + VE + RA | 27.21 | 2.69 | 367.27 | 84.27 | 0.07 | |
| BO + WO + RA | 27.66 | 2.68 | 349.27 | 85.61 | 0.08 | |
| Mean | 27.34 | 2.72 | 358.55 | 84.74 | 0.07 | |
| CV | 10.14 | 11.61 | 11.07 | 9.25 | 28.9 | |
BO: black oat; WO: white oat; VE: vetch; RA: radish. *Significance level (p ≤ 0.05). ns: not significant. CV: coefficient of variation. Source: Author (2025).
Table 2.
Mean values of dry biomass (kg ha-1) of winter cover crops, black oat (BO), black oat + white oat + radish (BO + WO + RA), black oat + white oat + vetch (BO + WO + VE), and black oat + white oat + vetch + radish (BO + WO + VE + RA), according to different chiseling times.
Table 2.
Mean values of dry biomass (kg ha-1) of winter cover crops, black oat (BO), black oat + white oat + radish (BO + WO + RA), black oat + white oat + vetch (BO + WO + VE), and black oat + white oat + vetch + radish (BO + WO + VE + RA), according to different chiseling times.
| Chiseling | Dry biomass (kg ha-1) | |||
| BO | BO + WO + RA | BO + WO + VE | BO + WO + VE + RA | |
| Autumn 2024 | 9736 Ab | 10808 Bab | 11565 Aab | 12694 Aa |
| Spring 2023 | 9890 Ab | 12276 ABa | 11127 Aab | 12456 Aa |
| No-till | 8840 Ac | 14280 Aa | 11321 Ab | 14225 Aa |
| Mean | 9488 | 12454 | 11337 | 13125 |
| CV (%) | 12.61 | |||
Different uppercase letters for the chiseling factor and lowercase letters for the cover crop factor statistically differ according to Tukey’s test (p ≤ 0.05). ns: not significant. Source: Author (2025).
Table 3.
Mean values of soybean leaf area index (LAI) and plant height (cm) in the 2024/25 growing season according to different chiseling times, post-maize management, and winter cover crops.
Table 3.
Mean values of soybean leaf area index (LAI) and plant height (cm) in the 2024/25 growing season according to different chiseling times, post-maize management, and winter cover crops.
| Interference factor | LAI | Height (cm) |
| Soil chiseling | ||
| Autumn 2024 | 4.49 ns | 30.66 ns |
| Spring 2023 | 4.84 | 29.28 |
| No-till | 4.44 | 30.66 |
| Post-maize management | ||
| Millet | 4.83 a | 29.69 ns |
| Fallow | 4.35 b | 30.71 |
| Winter cover crop | ||
| BO | 4.50 ns | 30.77 ns |
| BO + WO + VE | 4.27 | 30.12 |
| BO + WO + VE + RA | 4.65 | 29.53 |
| BO + WO + RA | 4.90 | 30.37 |
| Mean | 4.58 | 30.19 |
| CV | 16.16 | 9.09 |
BO: black oat; WO: white oat; VE: vetch; RA: radish. Means followed by the same letter do not statistically differ according to Tukey’s test (p ≤ 0.05) ns: not significant. CV: coefficient of variation. Source: Author (2025).
Table 4.
Mean values of soil bulk density (g cm3) and microporosity (cm3 cm-3) in the 0–5, 5–10, 10–15, 15–20, and 20–30 cm layers.
Table 4.
Mean values of soil bulk density (g cm3) and microporosity (cm3 cm-3) in the 0–5, 5–10, 10–15, 15–20, and 20–30 cm layers.
| Soil bulk density | |||||
| Chiseling | 0–5 cm | 5–10 cm | 10–15 cm | 15–20 cm | 20–30 cm |
| Autumn 2024 | 1.06 b | 1.15 b | 1.19 b | 1.15 b | 1.17 ns |
| Spring 2023 | 1.07 b | 1.16 b | 1.18 b | 1.23 a | 1.19 |
| No-till | 1.15 a | 1.25 a | 1.31 a | 1.29 a | 1.22 |
| Mean | 1.09 | 1.17 | 1.22 | 1.22 | 1.19 |
| CV (%) | 9.85 | 8.62 | 9.02 | 8.3 | 6.77 |
| Microporosity | |||||
| Autumn 2024 | 0.40 b | 0.41 b | 0.43 ab | 0.41 b | 0.46 ns |
| Spring 2023 | 0.41 ab | 0.43 ab | 0.42 b | 0.45 a | 0.46 |
| No-till | 0.44 a | 0.46 a | 0.46 a | 0.45 a | 0.47 |
| Mean | 0.41 | 0.43 | 0.43 | 0.43 | 0.46 |
| CV (%) | 9.7 | 8.24 | 9.06 | 7.26 | 7.77 |
Means followed by the same letter do not statistically differ according to Tukey’s test (p ≤ 0.05). ns: not significant. CV: coefficient of variation. Source: Author (2025).
Table 5.
Mean values for soil macroporosity (cm3 cm-3) in 0–5, 5–10, 10–15, 15–20, and 20–30 cm layers.
Table 5.
Mean values for soil macroporosity (cm3 cm-3) in 0–5, 5–10, 10–15, 15–20, and 20–30 cm layers.
| Macroporosity | |||||
| Interference factor | 0–5 cm | 5–10 cm | 10–15 cm | 15–20 cm | 20–30 cm |
| Soil chiseling | |||||
| Autumn 2024 | 0.17 a | 0.15 a | 0.11 a | 0.12 a | 0.07 ns |
| Spring 2023 | 0.17 a | 0.13 a | 0.11 a | 0.08 b | 0.08 |
| No-till | 0.12 b | 0.07 b | 0.05 b | 0.06 b | 0.06 |
| Post-maize management | |||||
| Millet | 0.14 ns | 0.12 ns | 0.09 ns | 0.08 | 0.06 ns |
| Fallow | 0.16 | 0.12 | 0.10 | 0.09* | 0.07 |
| Winter cover crop | |||||
| BO | 0.14 ns | 0.11 ns | 0.08 ns | 0.07 ns | 0.07 ns |
| BO + WO + VE | 0.14 | 0.10 | 0.08 | 0.09 | 0.06 |
| BO + WO + VE + RA | 0.16 | 0.13 | 0.10 | 0.10 | 0.07 |
| BO + WO + RA | 0.16 | 0.13 | 0.11 | 0.10 | 0.08 |
| Mean | 0.15 | 0.11 | 0.09 | 0.09 | 0.07 |
| CV (%) | 36.54 | 44.44 | 56.32 | 56.21 | 61.38 |
Means followed by the same letter do not statistically differ according to Tukey’s test (p ≤ 0.05). ns: not significant. CV: coefficient of variation. Source: Author (2025).
Table 6.
Mean values for soil macroporosity (cm3 cm-3) in the 15–20 cm layer according to post-maize management and winter cover crops.
Table 6.
Mean values for soil macroporosity (cm3 cm-3) in the 15–20 cm layer according to post-maize management and winter cover crops.
| Macroporosity | ||||
| Post-maize management | BO | BO + WO + RA | BO + WO + VE | BO + WO + VE + RA |
| Millet | 0.06 ns | 0.12 ns | 0.06 a | 0.09 ns |
| Fallow | 0.07 | 0.07 | 0.12 b | 0.10 |
| Mean | 0.06 | 0.09 | 0.09 | 0.09 |
| CV | 56.21 | |||
BO: black oat; WO: white oat; VE: vetch; RA: radish. *Probability level (p ≤ 0.05). ns: not significant. CV: coefficient of variation. Source: Author (2025).
Table 7.
Mean values of total soil porosity (cm3 cm-3) in 0–5, 5–10, 10–15, 15–20, and 20–30 cm layers.
Table 7.
Mean values of total soil porosity (cm3 cm-3) in 0–5, 5–10, 10–15, 15–20, and 20–30 cm layers.
| Total porosity | |||||
| Interference factor | 0–5 cm | 5–10 cm | 10–15 cm | 15–20 cm | 20–30 cm |
| Soil chiseling | |||||
| Autumn 2024 | 0.57 ab | 0.56 a | 0.54 a | 0.54 ns | 0.53 ns |
| Spring 2023 | 0.59 a | 0.56 a | 0.54 a | 0.53 | 0.54 |
| No-till | 0.56 b | 0.53 b | 0.51 b | 0.52 | 0.53 |
| Post-maize management | |||||
| Millet | 0.57 ns | 0.55 ns | 0.53 ns | 0.53* | 0.53 ns |
| Fallow | 0.57 | 0.55 | 0.54 | 0.53 | 0.54 |
| Winter cover crops | |||||
| BO | 0.56 ns | 0.54 ns | 0.53 ns | 0.52 ns | 0.54 ns |
| BO + WO + VE | 0.57 | 0.55 | 0.52 | 0.53 | 0.54 |
| BO + WO + VE + RA | 0.58 | 0.56 | 0.54 | 0.54 | 0.54 |
| BO + WO + RA | 0.57 | 0.56 | 0.54 | 0.53 | 0.53 |
| Mean | 0.57 | 0.55 | 0.53 | 0.53 | 0.53 |
| CV (%) | 5.46 | 5.89 | 6.45 | 7.38 | 5.25 |
Means followed by the same letter do not statistically differ according to Tukey’s test (p ≤ 0.05). ns: not significant. CV: coefficient of variation. Source: Author (2025).
Table 8.
Mean values of total soil porosity (cm3 cm-3) for the 15–20 cm layer in post-maize management and winter cover crops.
Table 8.
Mean values of total soil porosity (cm3 cm-3) for the 15–20 cm layer in post-maize management and winter cover crops.
| Total porosity | ||||
| Post-maize management | BO | BO + WO + RA | BO + WO + VE | BO + WO + VE + RA |
| Millet | 0.51 ns | 0.56 a | 0.52 ns | 0.53 ns |
| Fallow | 0.52 | 0.51 b | 0.55 | 0.55 |
| Mean | 0.51 | 0.53 | 0.53 | 0.54 |
| CV (%) | 7.36 | |||
BO: black oat; WO: white oat; VE: vetch; RA: radish. *Significance level (p ≤ 0.05). ns: not significant. CV: coefficient of variation. Source: Author (2025).
Disclaimer/Publisher’s Note: The statements, opinions and data contained in all publications are solely those of the individual author(s) and contributor(s) and not of MDPI and/or the editor(s). MDPI and/or the editor(s) disclaim responsibility for any injury to people or property resulting from any ideas, methods, instructions or products referred to in the content. |
© 2026 by the authors. Licensee MDPI, Basel, Switzerland. This article is an open access article distributed under the terms and conditions of the Creative Commons Attribution (CC BY) license (http://creativecommons.org/licenses/by/4.0/).
Copyright: This open access article is published under a Creative Commons CC BY 4.0 license, which permit the free download, distribution, and reuse, provided that the author and preprint are cited in any reuse.


