

Submitted:
17 April 2026
Posted:
20 April 2026
You are already at the latest version
Abstract
The purpose of this study was to evaluate the repeatability and inter-device agreement of higher order aberration (HOA) measurements in scleral lenses (SLs) obtained with two Hartmann-Shack (HS) metrology systems with substantially different spatial sampling resolution. Sixteen SLs (4 symmetric spherical, 4 spherical with toric periphery, 4 symmetric aspherical, 4 aspherical with toric periphery) were measured three times each using the SHSOphthalmic Cito (54×54 lenslet array) and SHSInspect Prio (157×157 lenslet array). Sphere (D) and Zernike coefficients from 3rd to 5th radial orders were extracted for three different aperture diameters (3.00 mm, 5.00 mm and 7.00 mm). Root-mean-square (RMS) values were calculated for each radial order and aperture. Within-device repeatability was assessed using coefficients of variation (CV%) and intraclass correlation coefficients (ICC) and inter-device agreement was evaluated using Bland-Altman analysis and (ICC). Both devices demonstrated excellent within-device repeatability for sphere, RMS4 and Total HOA RMS (ICC: 0.994–1.000, CV ≤4%). RMS3 and RMS5 showed moderate repeatability (ICC: 0.591–0.964), attributable to their small absolute magnitudes rather than instrument instability. Inter-device agreement was excellent at 5.00 mm and 7.00 mm (ICC: 0.950–1.000, mean bias <0.006 μm), with a significant difference only for RMS3 at 7.00 mm aperture (p = 0.034). At 3.00 mm, significant systematic bias was detected for RMS4 (bias = −0.00102 μm, p<0.001) and Total HOA RMS (bias = −0.00092 μm, p<0.001), with the Cito underestimating values relative to the Prio. FSE design did not significantly influence inter-device differences. HS spatial sampling density influences HOA measurement accuracy in SLs. The 8.45-fold difference in sampling points (24,649 vs. 2,916) resulted in clinically relevant inter-device discrepancies at 3.00 mm, whereas agreement was excellent at 5.00 and 7.00 mm. As specialty contact lens designs increasingly incorporate wavefront-guided (WFG) corrections, standardised high-resolution metrology protocols are essential to ensure accurate HOA characterisation, particularly at smaller apertures where reduced lenslet sampling density has been shown to compromise inter-device agreement.
Keywords:
optical metrology
; scleral lenses
; higher-order aberrations
; Hartmann-Shack wavefront sensor
; Zernike polynomials
; RMS
1. Introduction
Recent technological advances in scleral lenses (SLs) have led to increasingly sophisticated geometries (freeform designs) [1,2,3] and complex optics [3,4,5,6,7,8], offering unparalleled comfort and optical clarity even in the most challenging cases [3,6,7]. Among the most clinically relevant advances in SL technology is the incorporation of wavefront-guided (WFG) optics for the correction of higher-order aberrations (HOAs) [3,4,5,6,7,8].
SLs are large-diameter rigid-gas permeable (RGP) contact lenses (CLs) designed to completely vault the cornea and limbus while resting entirely on the conjunctiva overlying the sclera [9]. SL are most commonly prescribed for visual rehabilitation in eyes with irregular corneas, with keratoconus (KC) representing the most frequent clinical indication [10]. SLs optically mask corneal irregularity through two complementary optical mechanisms: creating a smooth, regular anterior refracting surface and partially neutralizing anterior corneal aberrations via refractive index matching between the post-lens fluid reservoir (n≈1.336) and corneal tissue (n≈1.376). Their large diameter promotes enhanced on-eye stability compared with smaller-diameter CLs [11], reducing translational decentration and rotational instability during blinking and eye movements, thereby providing a consistent and stable optical platform for successful HOA compensation [9,11]. Previous studies have reported that conventional SL neutralize approximately 60-65% of HOAs, however, residual HOAs often persist and may lead to visual symptoms such as ghosting, halos and glare [6]. These residual HOAs are thought to arise primarily from posterior corneal optics, internal ocular structures and lenticular aberrations, which remain unmasked by the tear reservoir [12].
Two principal strategies have been proposed to reduce residual HOAs in SLs: front surface eccentricity (FSE) optimisation and WFGSLs designs. FSE involves the introduction of controlled anterior surface eccentricity, generating progressive asphericity that partially compensates for spherical aberration induced by the irregular cornea. Clinical studies have shown that FSE values of 0.60-0.80 can reduce spherical aberration and coma in eyes with moderate to severe KC [13,14,15,16,17]. A retrospective analysis of 178 keratoconic eyes found that 0.60 FSE value was the most dispensed (53%), followed by 0.80 FSE (31%), demonstrating clinical preference based on visual outcomes [17]. However, FSE-based designs primarily address lower-order components of HOA structure and may be insufficient to fully compensate complex aberration patterns associated with highly irregular corneas. WFGSLs provide a fully customized optical correction strategy by targeting the unique residual aberration profile of each eye. Unlike FSE designs, which introduce a generalized aspherical modification, WFGSLs aim to correct the full residual HOA structure present in eyes with irregular corneas. Clinical evidence has reported reductions in total RMS HOAs of up to 56%, accompanied by improvement in high contrast visual acuity (HCVA) of approximately one to two lines [5,8]. The effectiveness of WFGSL designs critically depends on accurate and repeatable wavefront measurement, as well as precise manufacturing and on-eye alignment of the customised optical profile.
While both FSE and WFGSL approaches have demonstrated clinical efficacy, their successful implementation depends on micrometer-level manufacturing precision. Consequently, accurate in vitro optical verification is essential to ensure that the prescribed SLs are faithfully reproduced. Hartmann-Shack (HS)-based optical metrology systems have therefore become essential quality control tools, offering rapid and non-invasive characterization of CLs optical performance. However, commercially available HS devices vary substantially in technical specifications, particularly lenslet array spatial sampling density, which may influence measurement accuracy when assessing such complex optical surfaces. Furthermore, uncertainty remains regarding the interchangeability of measurements obtained from different HS metrology platforms, especially given the likelihood that multiple systems will continue to coexist across manufacturing and research settings Therefore, the purpose of this study was to evaluate the within-device repeatability and inter-device agreement of two HS-based optical metrology systems with substantially different spatial sampling densities in the measurement of SLs incorporating FSE designs across multiple aperture diameters.
2. Materials and Methods
2.1. Instrumentation
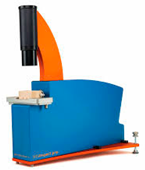
Two optical metrology devices manufactured by Optocraft GmbH (Erlangen, Germany) were employed in this study. Both instruments utilise the HS principle18 for wavefront sensing but differ substantially in spatial resolution. The SHSOphthalmic Cito (Cito) is equipped with a 54x54 lenslet array providing 2,916 sampling points, while the SHSInspect Prio (Prio) features a 157x157 lenslet array providing 24,649 sampling points, representing an 8.45-fold difference in spatial sampling density. Technical specifications of both instruments are summarised in Table 1.
Both instruments use identical Zernike fitting approaches: the wavefront emerging from the contact lens is sampled by the microlens array, and the displacement of focal spots on the CCD sensor is used to calculate local wavefront slopes, from which Zernike coefficients are reconstructed (Figure 1). The accompanying SHSWorks software reconstructs the complete wavefront through numerical integration, fits it to Zernike polynomials using the OSA standard convention19 and calculates refractive parameters including back vertex power in air.
2.2. Sample Lenses
Sixteen SLs (SLC Conica, Medlac, Avellino, Italy) were custom manufactured in Roflufocon D material (Contamac, Saffron Walden, UK). The material refractive index was 1.433 and an oxygen permeability (Dk) of 100 Fatt units. All lenses shared common specifications: total diameter (TD) of 16.80 mm, central thickness (CT) of 220 µm and back optical zone diameter (BOZD) of 8.00 mm. The lens set was organized into four back optical zone radius (BOZR) configurations, each associated with a specific sagittal depth and nominal back vertex power, representing the spectrum typically required for fitting irregular corneas with varying degrees of steepness and elevation (Table 2).
Specifically, four design categories were evaluated: symmetric spherical (SS), symmetric aspheric with FSE = 0.70 (AS), symmetric spherical with 100 μm peripheral toricity (ST) and aspheric with FSE = 0.70 and 100 μm peripheral toricity (AT). Each design category included four lenses corresponding to the four back optical zone radius configurations (Table 2). The eccentricity value of 0.70 was based on clinical evidence from previous studies [13,14,15,16,17], all suggesting that FSE values in the range of 0.6-0.8 provide optimal visual performance and HOA reduction in irregular corneas. The peripheral toricity of 100 μm denotes a toric haptic design characterized by a sagittal height difference of 100 μm between the two principal meridians: flat (0°–180°) and steep (90°–270°).
2.3. Measurement Protocol
After manufacturing, all SLs were cleaned using Boston Laboratory Lens Cleaner (Bausch & Lomb, Rochester, NY, USA) to remove manufacturing residues and surface contaminants. Lenses were then visually inspected for manufacturing defects under optical microscope and central thickness was measured using a thickness gauge. All measurements were performed by a single experienced operator. The order of lens measurements and instrument use was randomised to minimise systematic bias. Measurements were conducted in air, in accordance with standard optical metrology procedures for RGP contact lenses. For each acquisition, the lens was positioned on the instrument’s lens holder designed for RGP lenses, ensuring stable positioning without deformation. Lens parameters were entered into the software, including material refractive index, BOZR, TD and CT. The sensor capture area was set to 8.00 mm diameter consistently between instruments with auto edge detection enabled. Live view mode was used to verify proper lens centration before data acquisition, with alignment tolerance less than 0.1 mm decentration. Three independent measurements were acquired per instrument, and Zernike coefficients were subsequently rescaled to analysis apertures of 3.00, 5.00 and 7.00 mm. For each of the three independent measurements acquired per instrument, the lens was removed from the holder between consecutive acquisitions, cleaned with a lint-free optical wipe, and repositioned with realignment verification. This removal-repositioning protocol ensured truly independent measurements and assessed the combined variability of lens positioning and instrument measurement. Half of the lenses were measured first on Cito then on Prio, while the remaining lenses were measured first on Prio then on Cito. For each measurement, sphere and HOAs from 3rd to 5th radial order were calculated. HOAs were analysed as root-mean-square (RMS) by radial order (RMS3, RMS4, RMS5) and as total HOA RMS (3rd-5th order combined).
2.4. Statistical Analysis
All data were analysed using SPSS Statistics v.27 (IBM Corp., Armonk, NY, USA). The Shapiro-Wilk test assessed normality of continuous variables. Within-instrument repeatability was evaluated using within-subject standard deviation (Sw), coefficient of variation (CV%), repeatability coefficient (2.77 × Sw) and intraclass correlation coefficient (ICC). Inter-instrument agreement was assessed using Bland-Altman analysis (bias and 95% limits of agreement), ICC and paired t-tests or Wilcoxon signed-rank tests depending on data distribution. Analyses were stratified by measurement aperture (3mm, 5mm, 7mm). Two-way ANOVA examined the effects of front surface eccentricity (spherical vs aspheric) and peripheral design (symmetric vs toric) on inter-instrument differences at each aperture, with Bonferroni-corrected post-hoc test when significant. Statistical significance was set at α = 0.05.
3. Results
Within-device repeatability results are summarised in Table 3 for each device and each aperture. For Sphere, both metrology systems demonstrated excellent repeatability across all apertures, with ICC ≥ 0.9999 and Sw ranging from 0.001 to 0.008 D. The Prio showed consistently lower Sw at 3.00 mm (0.0026 D vs. 0.0080 D for the Cito), indicating improved positional stability at small apertures. For fourth order RMS (RMS4) and Total HOA RMS, repeatability was excellent for both devices (ICC 0.994–1.000, CV% < 4% at all apertures). In contrast, third-order RMS (RMS3) showed moderate repeatability (ICC 0.808–0.942), with higher relative variability (CV% 11–18%), particularly at smaller apertures. Repeatability coefficients remained below 0.018 μm across all apertures. Fifth-order RMS (RMS5) exhibited greater variability (ICC 0.591–0.964, CV% 7–21%).
Inter-device agreement results are summarised in Table 4:
At the 5.00 mm and 7.00 mm analysis apertures, agreement between instruments was generally good with ICC values ≥0.950 for all metrics. A statistically significant mean difference was observed only for RMS3 at 7.00 mm (bias = −0.00185 μm, p = 0.034, ICC = 0.964), while all other metrics showed no significant mean differences (p > 0.034).
In contrast, at 3.00 mm, a statistically significant systematic bias was identified for RMS4 (bias = −0.00102 μm, 95% LoA [−0.002, −0.00003], p < 0.001, ICC = 0.991) and Total HOA RMS (bias = −0.00092 μm, 95% LoA [−0.002, +0.000], p < 0.001, ICC = 0.991), with the Cito consistently underestimating values relative to the Prio at this aperture (Fig. 1.3). Bland-Altman plots further revealed a significant proportional bias for Sphere at all apertures (r = 0.682–0.927, all p < 0.04), indicating that inter-device differences in back vertex power increased with the magnitude of the measured value (Fig. 2.1, 3.1, 4.1).
Effect of lens design on inter-device differences was evaluated by two-way ANOVA (Table 5).
Lens design factors did not significantly influence inter-device differences. Neither front-surface eccentricity (FSE) nor peripheral toricity (PT) showed a significant effect on measurement agreement at the 3.00-mm or 5.00-mm apertures for any analysed metric.
At the 7.00 mm aperture, a borderline effect of FSE on fifth-order RMS differences was observed (p = 0.050), while no significant effects were detected for any other parameter. No significant interaction between FSE and peripheral toricity was found at any aperture.
4. Discussion
Both devices demonstrated excellent repeatability for Sphere, RMS4 and Total HOA RMS (ICC > 0.994, CV% < 4%), confirming their suitability for routine SL quality control. Moderate repeatability for RMS3 (ICC 0.808–0.942) and variable repeatability for RMS5 (ICC 0.591–0.964) reflect the small absolute magnitude of these terms in the lens sample rather than instrument instability. The Prio showed lower Sw for Sphere at 3.00 mm (0.0026 vs. 0.0080 D), which may be attributable to its finer lenslet pitch improving centroid localisation during repeated positioning, though no consistent repeatability advantage was observed for RMS4 or Total HOA RMS at any aperture.
Taken together, these findings indicate that within-device repeatability is primarily influenced by aberration magnitude and analysis aperture rather than intrinsic instrument instability, with both instruments showing improved repeatability at larger apertures for higher-order RMS metrics. Inter-device agreement was excellent at 5.00 mm and 7.00 mm (ICC > 0.950, mean bias < 0.006 μm for all metrics), supporting practical interchangeability at these apertures. At 3.00 mm, a statistically significant systematic bias was identified for RMS4 and Total HOA RMS, with the Cito consistently underestimating values relative to the Prio. This directional bias is consistent with the Cito’s lower spatial sampling density (54×54 vs. 157×157 lenslets), which captures fewer independent wavefront points within a 3.00 mm aperture, limiting reconstruction of higher spatial frequency Zernike components. The reduced agreement observed at smaller apertures may reflect the limited capability of lower-density HS sampling grids to resolve higher spatial frequency wavefront components, particularly when the effective number of lenslets contributing to the reconstruction becomes restricted. A significant proportional bias was additionally identified for Sphere at all apertures (r = 0.682–0.927, p < 0.04), indicating that inter-device differences in back vertex power scale with measurement magnitude. Neither FSE nor TP significantly influenced inter-device differences, indicating that discrepancies are instrument-dependent rather than geometry-dependent. A preliminary analysis by our group using the same lenses and measurement protocol performed at a single aperture of 8.00 mm, was recently presented and concluded full interchangeability of the two devices [20].
The overall similarity of outcomes between the two devices was to some extent anticipated, given that the SLs evaluated in this study present smooth, rotationally symmetric or mildly aspherical optical surfaces. On such surfaces, the wavefront reconstructed from a coarser lenslet array (54×54, Cito) and that from a denser array (157×157, Prio) are expected to converge, as the spatial frequency content of the wavefront is low and well within the sampling capacity of both sensors. In contrast, it would be expected that the higher lenslet density of the Prio would provide a more accurate wavefront reconstruction for optical surfaces with rapidly varying power profiles or discrete power transitions, such as bifocal or multifocal contact lenses with alternating power ring designs, where the coarser sampling of the Cito may undersample steep local wavefront gradients. Mean RMS4 increased 28-fold from 3.00 mm to 7.00 mm (0.015 to 0.417 μm), highlighting the critical aperture dependence of HOA measurements. The present stratified analysis reveals that this conclusion holds at 5.00 and 7.00 mm but not at 3.00 mm, where the systematic bias was masked by the dominant contribution of large-aperture aberrations to total RMS. This underscores the necessity of reporting measurement aperture as a mandatory parameter in contact lens metrology. The present findings are consistent with those reported by Domínguez-Vicent et al. [21], who characterised the power profiles and optical quality of SLs across five nominal powers using the NIMO TR-1504 optical system at 3.00 and 6.00 mm apertures, reporting Total HOA RMS values below 0.05 μm at 3.00 mm and below 0.08 μm at 6.00 mm regardless of lens power or design, confirming the optically smooth nature of scleral lens surfaces and the inherently low aberration content at smaller apertures. Despite statistically significant differences in RMS among lens powers, near-diffraction-limited MTFs and visual Strehl ratios approaching unity at 3.00 mm, closely mirroring the present findings where inter-device differences at 3.00 mm were statistically significant but clinically negligible. Importantly, differences became more apparent at 6.00 mm, where MTFs distanced from the diffraction-limited curve and visual Strehl ratios declined, reinforcing the interpretation that metrological discrepancies are more detectable at larger apertures where aberration magnitudes are inherently greater. Regarding power accuracy, deviations from nominal power of up to 0.50 D were reported, consistent with the significant sphere bias observed in the present study and suggesting that systematic power offsets are a characteristic of SL manufacturing rather than a device-specific measurement artefact.
The inter-device discrepancies observed at 3.00 mm, while statistically significant, should be interpreted in the context of the inherently low HOA magnitudes at small apertures. Salmon and van de Pol [22] reported a mean Total HOA RMS of 0.045 μm at 3.00 mm in normal healthy adult eyes, rising to 0.100 μm at 4.00 mm and 0.327 μm at 6.00 mm, demonstrating the strong non-linear dependence of HOA magnitude on aperture. Van den Berg et al. [23,24] further demonstrated that even in highly aberrated corneas such as keratoconus and post-radial keratotomy, restricting aperture to 1.6 mm reduces HOAs to levels approaching those of normal eyes. Inter-device differences of the order of 0.001 μm at 3.00 mm, as observed in the present study, are therefore unlikely to carry clinical relevance.
Lens design characteristics, specifically FSE and peripheral toric geometry, did not significantly influence inter-device agreement across most aperture-metric combinations, which is an expected finding given that peripheral geometric features are not designed to alter the optical zone aberration profile. The borderline significant effect of FSE on RMS5 at 7.00 mm (p = 0.050) was unexpected, as FSE primarily targets spherical aberration (Z4⁰) rather than fifth-order terms. At 7.00 mm the analysis aperture approaches the boundary of the optical zone, where the transition between the central aspherical surface and the peripheral geometry may introduce local wavefront irregularities detectable by the higher-resolution sensor, artifactually amplifying fifth-order terms in a design-dependent manner. This result warrants further investigation with a larger sample size and a wider range of front surface eccentricities.
Several limitations of this study should be acknowledged. The lens sample comprised 16 lenses from a single manufacturer representing four design categories, which, while methodologically controlled, limits the generalisability of the findings to other lens materials with varying refractive indices, geometries, or manufacturers. All measurements were performed in air by a single experienced operator, consistent with standard metrology protocols but not representative of the in vivo measurement environment, where tear film dynamics, on-eye fitting, and lens flexure introduce additional sources of variability.
Future studies should investigate whether the inter-device discrepancies observed at 3.00 mm persist across a broader range of HOA magnitudes, including WFGSLs with intentionally large HOA amplitudes, and whether the bias is consistent across different lens materials. Extension of this methodology to in vivo HS aberrometry represents a logical next step for validating the clinical translation of in vitro metrology findings.
These findings have direct implications for the manufacturing and validation of WFGSLs, where accurate reproduction of complex high-spatial-frequency optical features is essential to achieve the intended visual correction. Authors should discuss the results and how they can be interpreted from the perspective of previous studies and of the working hypotheses. The findings and their implications should be discussed in the broadest context possible. Future research directions may also be highlighted.
5. Conclusions
Both metrology systems demonstrated excellent within-device repeatability for Sphere, RMS4 and Total HOA RMS across all apertures, supporting their use in routine SL quality control assessment. Inter-device agreement was excellent at 5.00 mm and 7.00 mm, indicating practical interchangeability of the two instruments at clinically relevant apertures. At 3.00 mm, a small but statistically significant systematic bias was observed for RMS4 and Total HOA RMS, with the lower-resolution system consistently underestimating aberration magnitude relative to the higher-resolution device though the absolute magnitude of these differences is unlikely to carry clinical relevance. Lens design characteristics, including FSE and peripheral toricity, did not significantly influence inter-device agreement. These findings underscore the critical influence of analysis aperture and spatial sampling density in HOA metrology of SLs and highlight the need for standardised protocols with explicit reporting of measurement conditions when comparing optical performance across different instruments.
Author Contributions
Conceptualization, F.V., J.M.G. and R.M.A.; methodology, F.V. and M.I.; formal analysis, J.M.G., F.V. and M.I..; investigation, F.V. J.M.G; data curation, F.V.; writing—original draft preparation, F.V.; writing—review and editing, R.M.A. and J.G.M.; supervision, R.M.A and J.M.G. authors have read and agreed to the published version of the manuscript.
Data Availability Statement
The data presented in this study are available on request from the corresponding author.
Conflicts of Interest
The authors declare no conflicts of interest.
References
- Nguyen, M.T.B.; Thakrar, V.; Chan, C.C. EyePrintPRO therapeutic scleral contact lens: indications and outcomes. Can. J. Ophthalmol. 2018, 53, 66–70. [Google Scholar] [CrossRef] [PubMed]
- Yoon, H.; Harthan, J.S.; Skoog, W.; Fogt, J.S.; Nau, A.; Nau, C.B.; Schornack, M.; Shorter, E. Process and outcomes of fitting corneoscleral profilometry-driven scleral lenses for patients with ocular surface disease. Eye Contact Lens 2024, 50, 132–137. [Google Scholar] [CrossRef]
- Gelles, J.D.; Cheung, B.; Akilov, S.; Krisa, S.; Trieu, G.; Greenstein, S.A.; Chung, D.; Hersh, P.S. Ocular impression-based scleral lens with wavefront-guided optics for visual improvement in keratoconus. Eye Contact Lens 2022, 48, 485–488. [Google Scholar] [CrossRef]
- Marsack, J.D.; Ravikumar, A.; Nguyen, C.; Ticak, A.; Koenig, D.E.; Elswick, J.D.; Applegate, R.A. Wavefront-guided scleral lens correction in keratoconus. Optom. Vis. Sci. 2014, 91, 1221–1230. [Google Scholar] [CrossRef]
- Hastings, G.D.; Applegate, R.A.; Nguyen, L.C.; Kauffman, M.J.; Hemmati, R.T.; Marsack, J.D. Comparison of wavefront-guided and best conventional scleral lenses after habituation in eyes with corneal ectasia. Optom. Vis. Sci. 2019, 96, 238–247. [Google Scholar] [CrossRef]
- Nguyen, L.C.; Kauffman, M.J.; Hastings, G.D.; Applegate, R.A.; Marsack, J.D. Case report: What are we doing for our "20/20 unhappy" scleral lens patients? Optom. Vis. Sci. 2020, 97, 826–830. [Google Scholar] [CrossRef] [PubMed]
- Hastings, G.D.; Nguyen, L.C.; Kauffman, M.J.; Hemmati, R.T.; Marsack, J.D.; Applegate, R.A. Avoiding penetrating keratoplasty in severe keratoconus using a wavefront-guided scleral lens. Clin. Exp. Optom. 2022, 105, 86–88. [Google Scholar] [CrossRef]
- Gelles, J.D.; Su, B.; Kelly, D.; Brown, N.; Wong, J.; Yoon, G.; Pfeifer, T.; Erdman, C.; Hersh, P.S.; Greenstein, S.A. Visual improvement with wavefront-guided scleral lenses for irregular corneal astigmatism. Eye Contact Lens 2025, 51, 58–64. [Google Scholar] [CrossRef]
- van der Worp, E.; Bornman, D.; Ferreira, D.L.; Faria-Ribeiro, M.; Garcia-Porta, N.; González-Meijome, J.M. Modern scleral contact lenses: a review. Cont. Lens Anterior Eye 2014, 37, 240–250. [Google Scholar] [CrossRef] [PubMed]
- Schornack, M.M.; Fogt, J.; Nau, A.; Nau, C.B.; Harthan, J.S.; Cao, D.; Shorter, E. Scleral lens prescription and management practices: emerging consensus. Cont. Lens Anterior Eye 2023, 46, 101501. [Google Scholar] [CrossRef]
- Ticak, A.; Marsack, J.D.; Koenig, D.E.; Ravikumar, A.; Shi, Y.; Nguyen, L.C.; Applegate, R.A. A comparison of three methods to increase scleral contact lens on-eye stability. Eye Contact Lens 2015, 41, 386–390. [Google Scholar] [CrossRef]
- Chen, M.; Yoon, G. Posterior corneal aberrations and their compensation effects on anterior corneal aberrations in keratoconic eyes. Invest. Ophthalmol. Vis. Sci. 2008, 49, 5645–5652. [Google Scholar] [CrossRef]
- Jagadeesh, D.; Mahadevan, R. Visual performance with changes in eccentricity in PROSE device: a case report. J. Optom. 2014, 7, 108–110. [Google Scholar] [CrossRef] [PubMed]
- Gumus, K.; Gire, A.; Pflugfelder, S.C. The impact of the Boston ocular surface prosthesis on wavefront higher-order aberrations. Am. J. Ophthalmol. 2011, 151, 682–690. [Google Scholar] [CrossRef] [PubMed]
- Hussoin, T.; Le, H.G.; Carrasquillo, K.G.; Johns, L.; Rosenthal, P.; Jacobs, D.S. The effect of optic asphericity on visual rehabilitation of corneal ectasia with a prosthetic device. Eye Contact Lens 2012, 38, 300–305. [Google Scholar] [CrossRef] [PubMed]
- Badrinarayanan, A.; Balakrishnan, A.C.; Dutta, R.; Kumar, R.M.; Iqbal, A. Impact of scleral lens front surface eccentricity on visual acuity, contrast sensitivity, and higher-order aberrations in eyes with keratoconus. Eye Contact Lens 2023, 49, 374–378. [Google Scholar] [CrossRef]
- Kumar, P.; Mohamed, A.; Bhombal, F.; Dumpati, S.; Vaddavalli, P.K. Prosthetic replacement of the ocular surface ecosystem for corneal irregularity: visual improvement and optical device characteristics. Cont. Lens Anterior Eye 2019, 42, 526–532. [Google Scholar] [CrossRef]
- Thibos, L.N. Principles of Hartmann-Shack aberrometry. J. Refract. Surg. 2000, 16, S563–S565. [Google Scholar] [CrossRef]
- Thibos, L.N.; Applegate, R.A.; Schwiegerling, J.T.; Webb, R.; VSIA Standards Taskforce Members. Standards for reporting the optical aberrations of eyes. J. Refract. Surg. 2002, 18, S652–S660. [Google Scholar] [CrossRef]
- Viviano, F.; Iovino, M.; Macedo-de-Araújo, R.J.; González-Méijome, J.M. Repetibilidad y concordancia de dos dispositivos ópticos comerciales basados en el sensor de frente de onda Hartmann-Shack para mediciones de aberraciones de alto orden en lentes esclerales. Poster presented at III Congreso Asociación Española de Contactología y Superficie Ocular (AECSO) 2025, Valladolid, Spain, 2025. [Google Scholar]
- Domínguez-Vicent, A.; Esteve-Taboada, J.J.; Recchioni, A.; Brautaset, R. Power profiles and in vitro optical quality of scleral contact lenses: effect of the aperture and power. Eye Contact Lens 2018, 44, 149–158. [Google Scholar] [CrossRef]
- Salmon, T.O.; van de Pol, C. Normal-eye Zernike coefficients and root-mean-square wavefront errors. J. Cataract Refract. Surg. 2006, 32, 2064–2074. [Google Scholar] [CrossRef] [PubMed]
- van den Berg, R.M.; van den Berg, A.B.; Maia Rocha, K.; Fetrin de Barros, M.; Dodhia, M.; Shahid, M.; Klyce, S.D. Prediction of the small aperture intraocular lens on visual acuity in patients with keratoconus. J. Cataract Refract. Surg. 2024, 50, 930–935. [Google Scholar] [CrossRef] [PubMed]
- van den Berg, R.M.; DeVaro, S.; Rocha, K.M.; Fetrin de Barros, M.; Klyce, S.D. Predicted visual impact of a small aperture intraocular lens in reducing higher order aberrations in post-radial keratotomy patients. Vision 2025, 9, 46. [Google Scholar] [CrossRef] [PubMed]
Figure 1.
Schematic representation of the HS wavefront sensor measurement principle as implemented in the SHSOphthalmic Cito and SHSInspect Prio instruments. Adapted from Pfund, J. Contact lens measurement: beyond refractive data. GlobalCONTACT 2020, 3, 24–27.
Figure 1.
Schematic representation of the HS wavefront sensor measurement principle as implemented in the SHSOphthalmic Cito and SHSInspect Prio instruments. Adapted from Pfund, J. Contact lens measurement: beyond refractive data. GlobalCONTACT 2020, 3, 24–27.
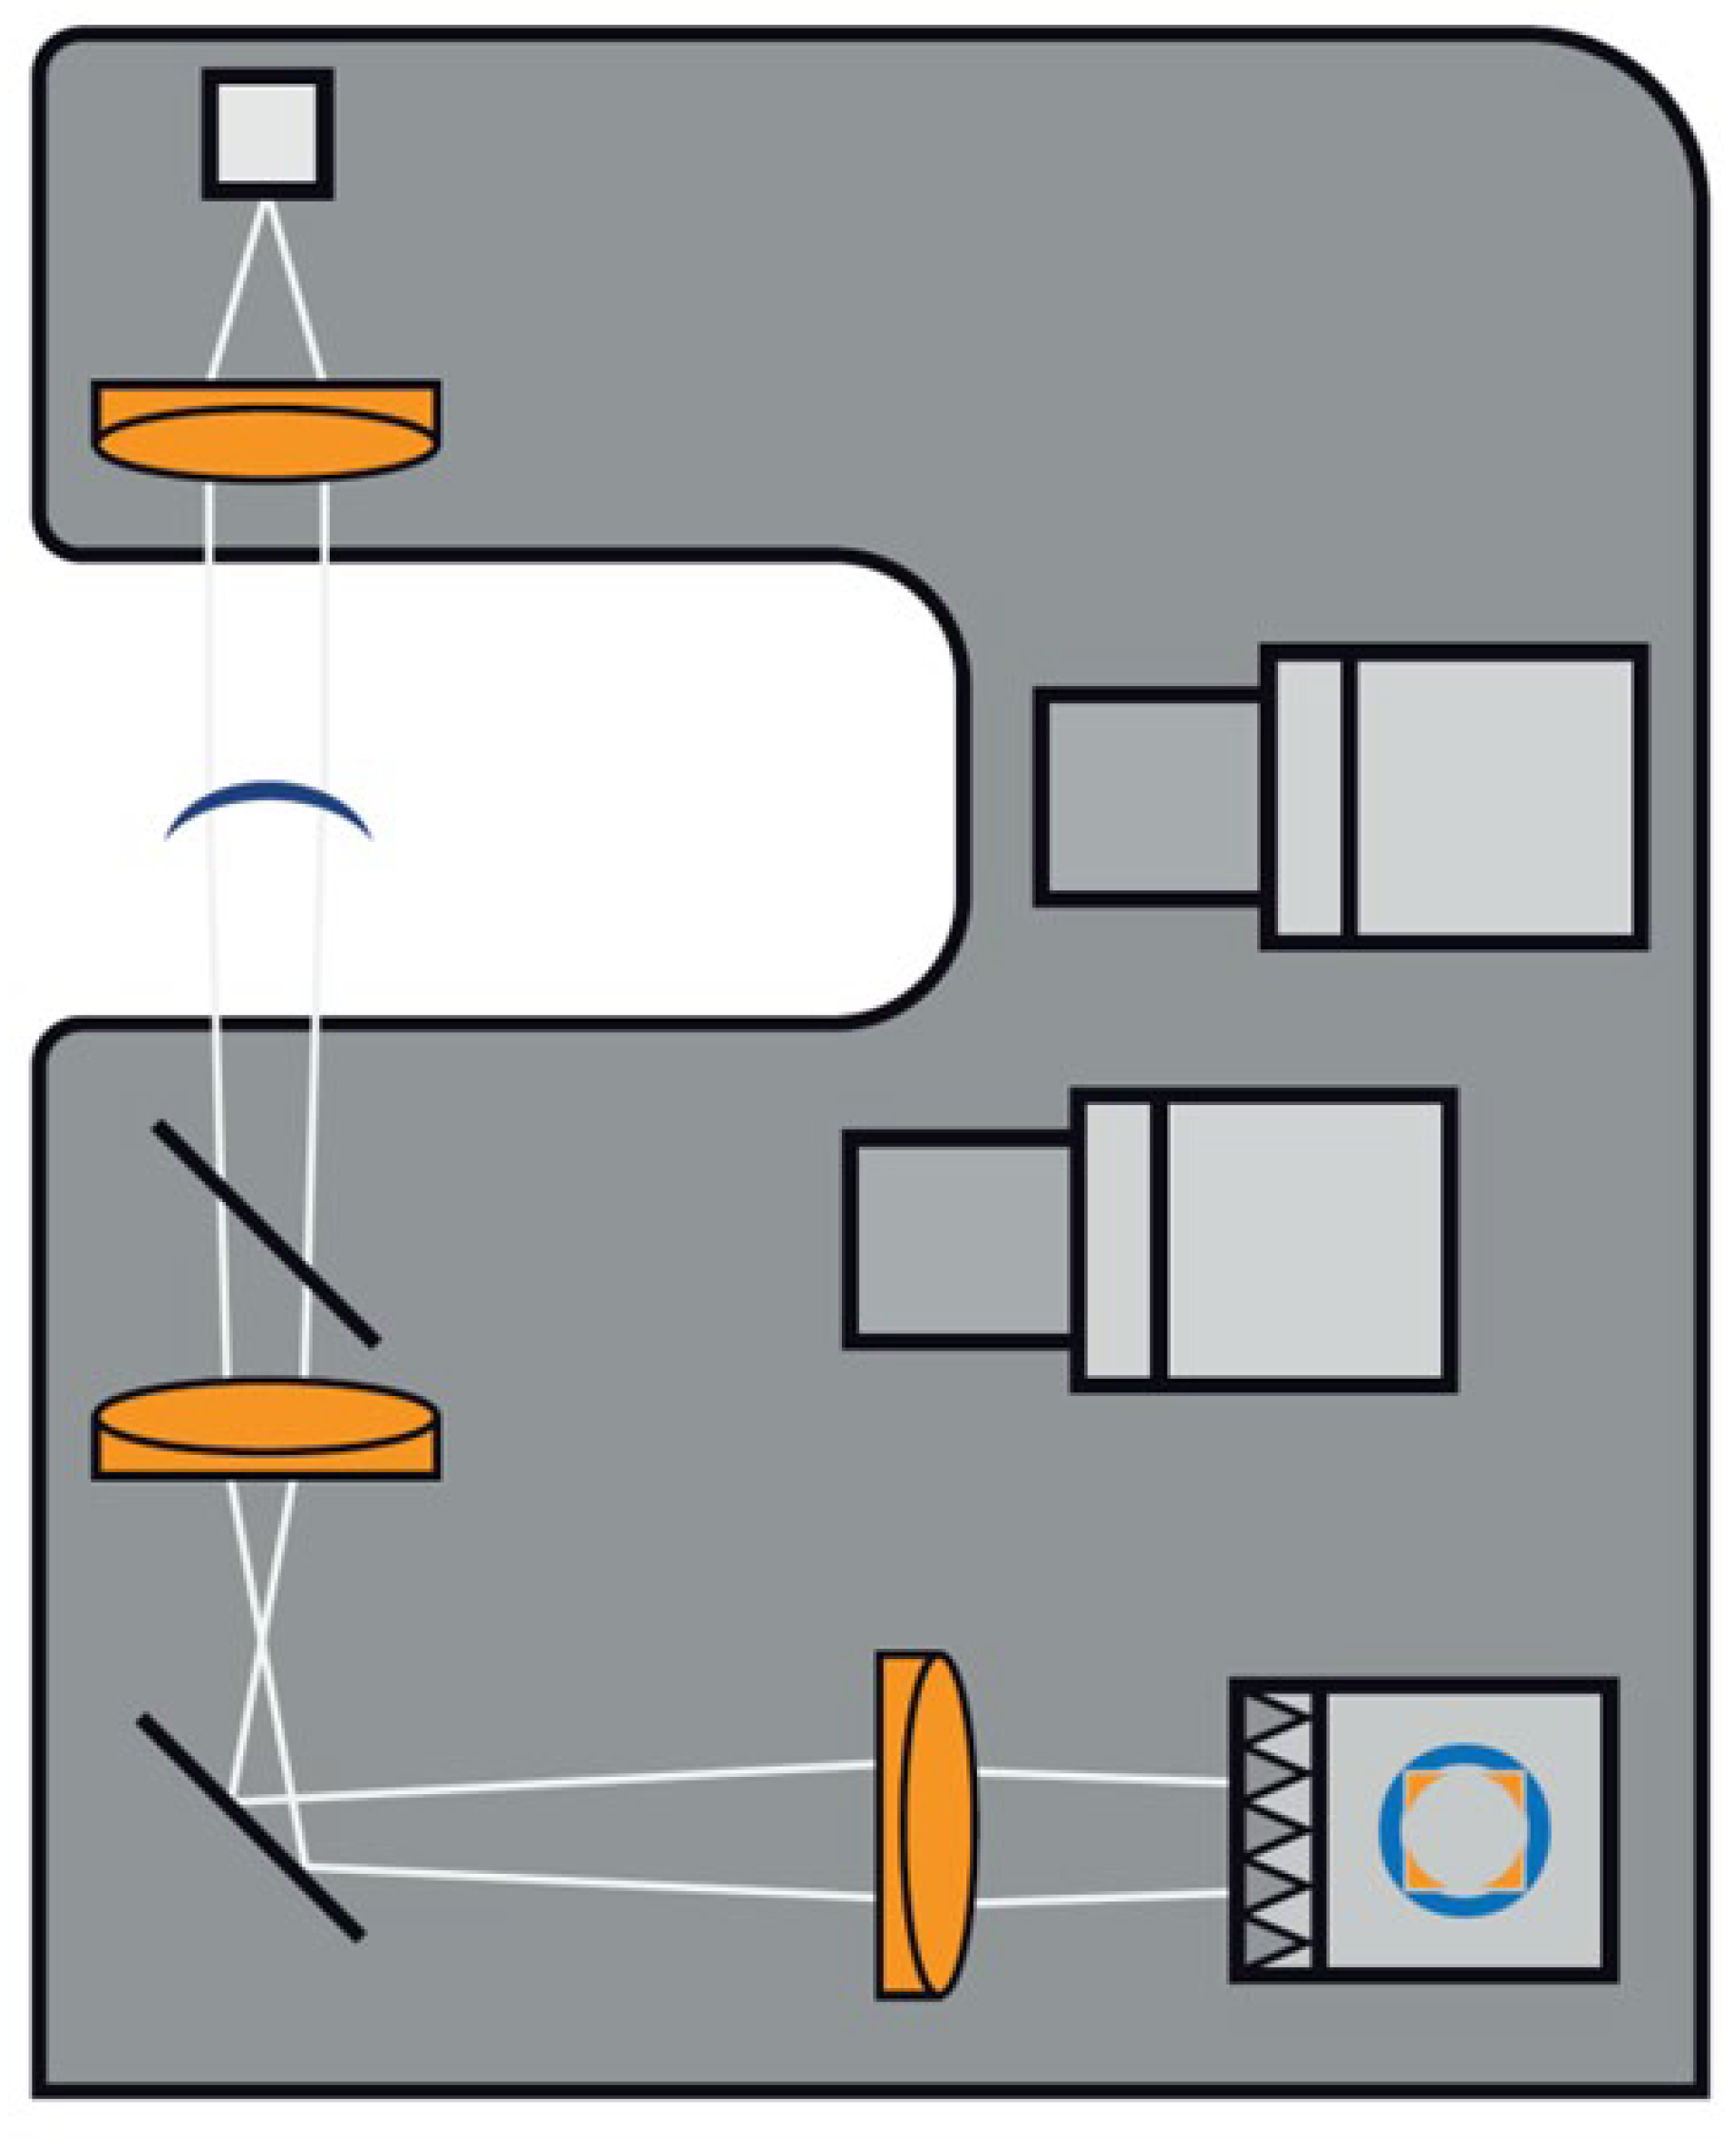
Figure 2.
Bland-Altman plots for inter-device agreement (SHSOphthalmic Cito − SHSInspect Prio) at 3.00 mm analysis aperture. Fig. 2.1: Sphere (D); Fig. 2.2: 3rd/4th/5th HOA RMS (μm); Fig. 2.3: Total HOA RMS (μm). Solid red line: mean bias; dashed red lines: 95% limits of agreement (±1.96 SD). Point colour and shape indicate lens design (SS: spherical symmetric; ST: spherical toric; AS: aspherical symmetric; AT: aspherical toric). n = 16 lenses.
Figure 2.
Bland-Altman plots for inter-device agreement (SHSOphthalmic Cito − SHSInspect Prio) at 3.00 mm analysis aperture. Fig. 2.1: Sphere (D); Fig. 2.2: 3rd/4th/5th HOA RMS (μm); Fig. 2.3: Total HOA RMS (μm). Solid red line: mean bias; dashed red lines: 95% limits of agreement (±1.96 SD). Point colour and shape indicate lens design (SS: spherical symmetric; ST: spherical toric; AS: aspherical symmetric; AT: aspherical toric). n = 16 lenses.
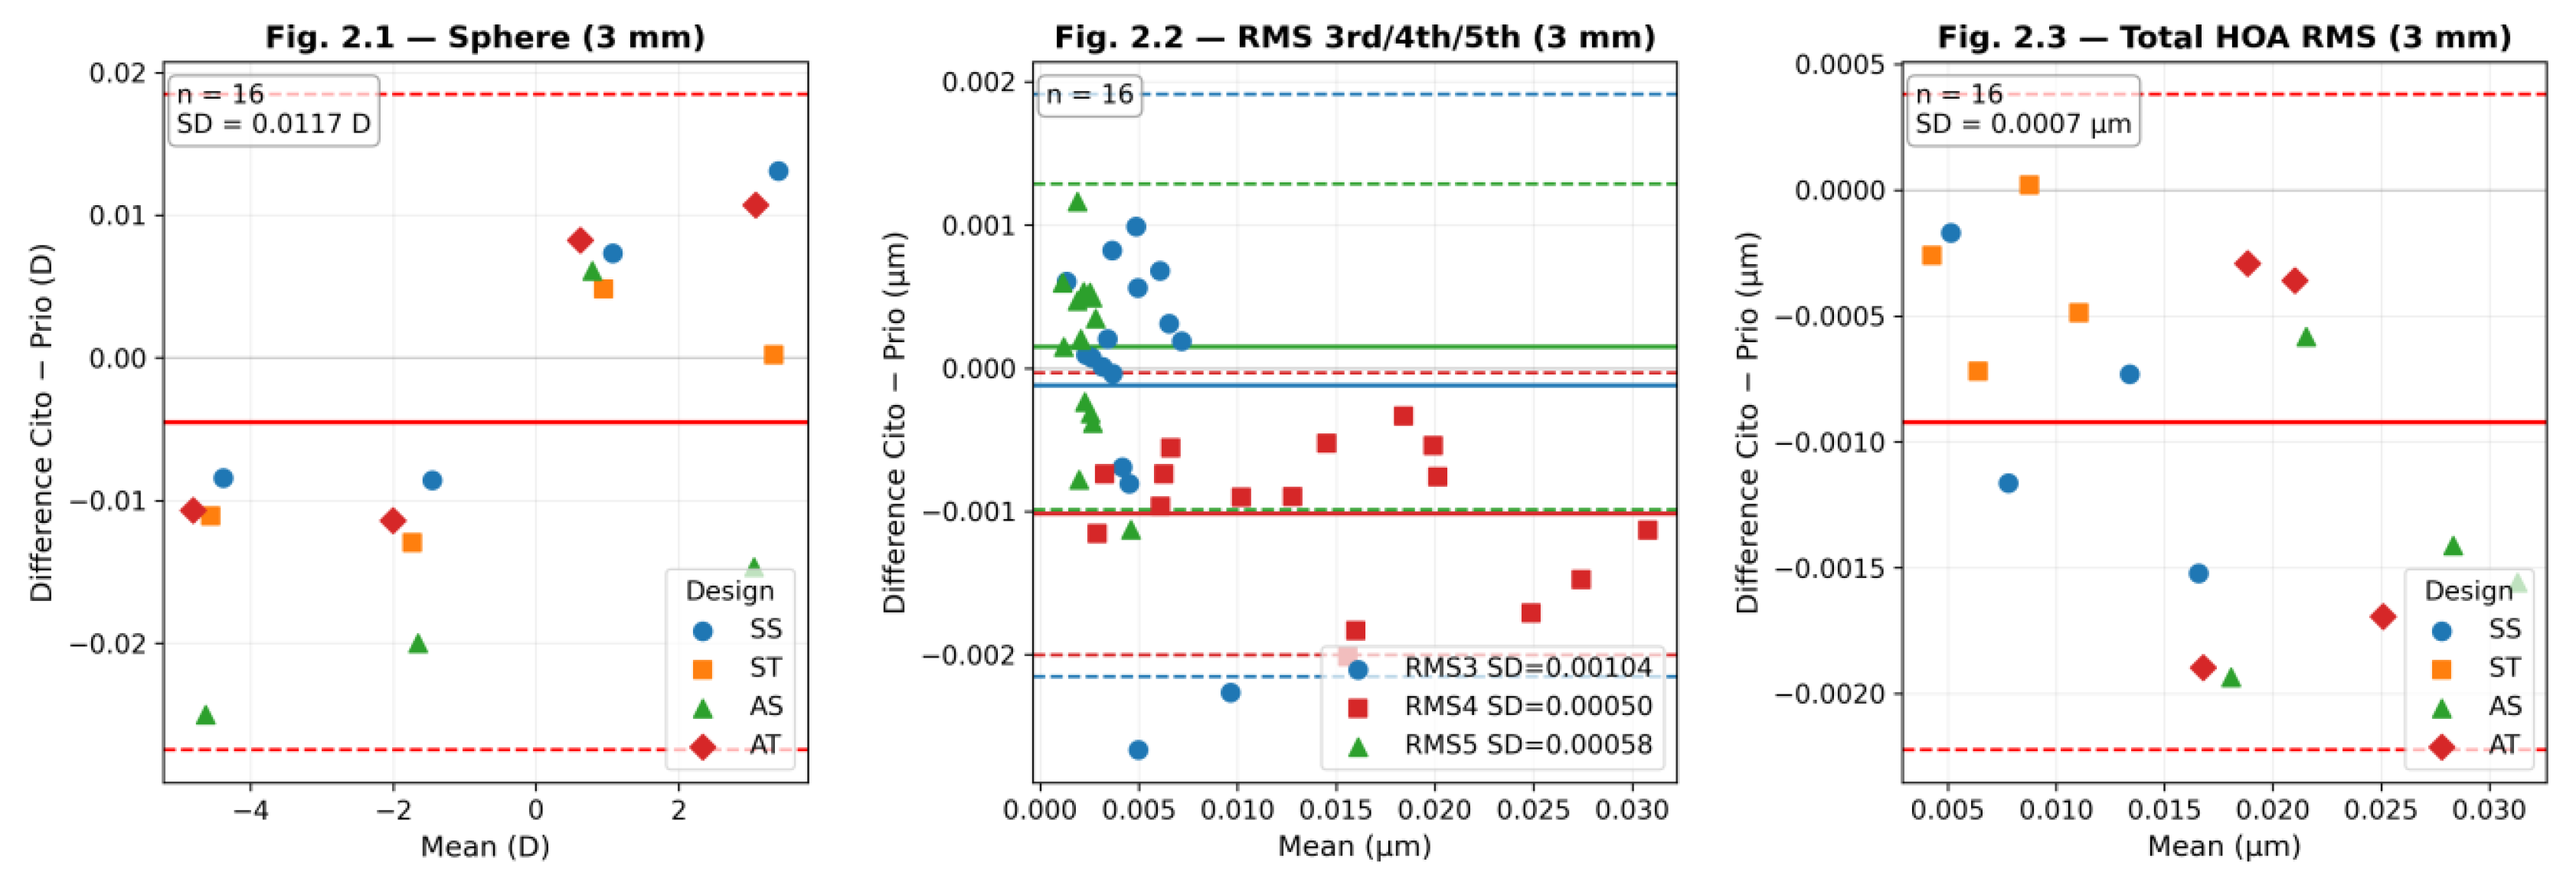
Figure 3.
Bland-Altman plots for inter-device agreement (SHSOphthalmic Cito − SHSInspect Prio) at 5.00 mm analysis aperture. Fig. 3.1: Sphere (D); Fig. 3.2: 3rd/4th/5th HOA RMS (μm); Fig. 3.3: Total HOA RMS (μm). See Figure 1 for legend details.
Figure 3.
Bland-Altman plots for inter-device agreement (SHSOphthalmic Cito − SHSInspect Prio) at 5.00 mm analysis aperture. Fig. 3.1: Sphere (D); Fig. 3.2: 3rd/4th/5th HOA RMS (μm); Fig. 3.3: Total HOA RMS (μm). See Figure 1 for legend details.
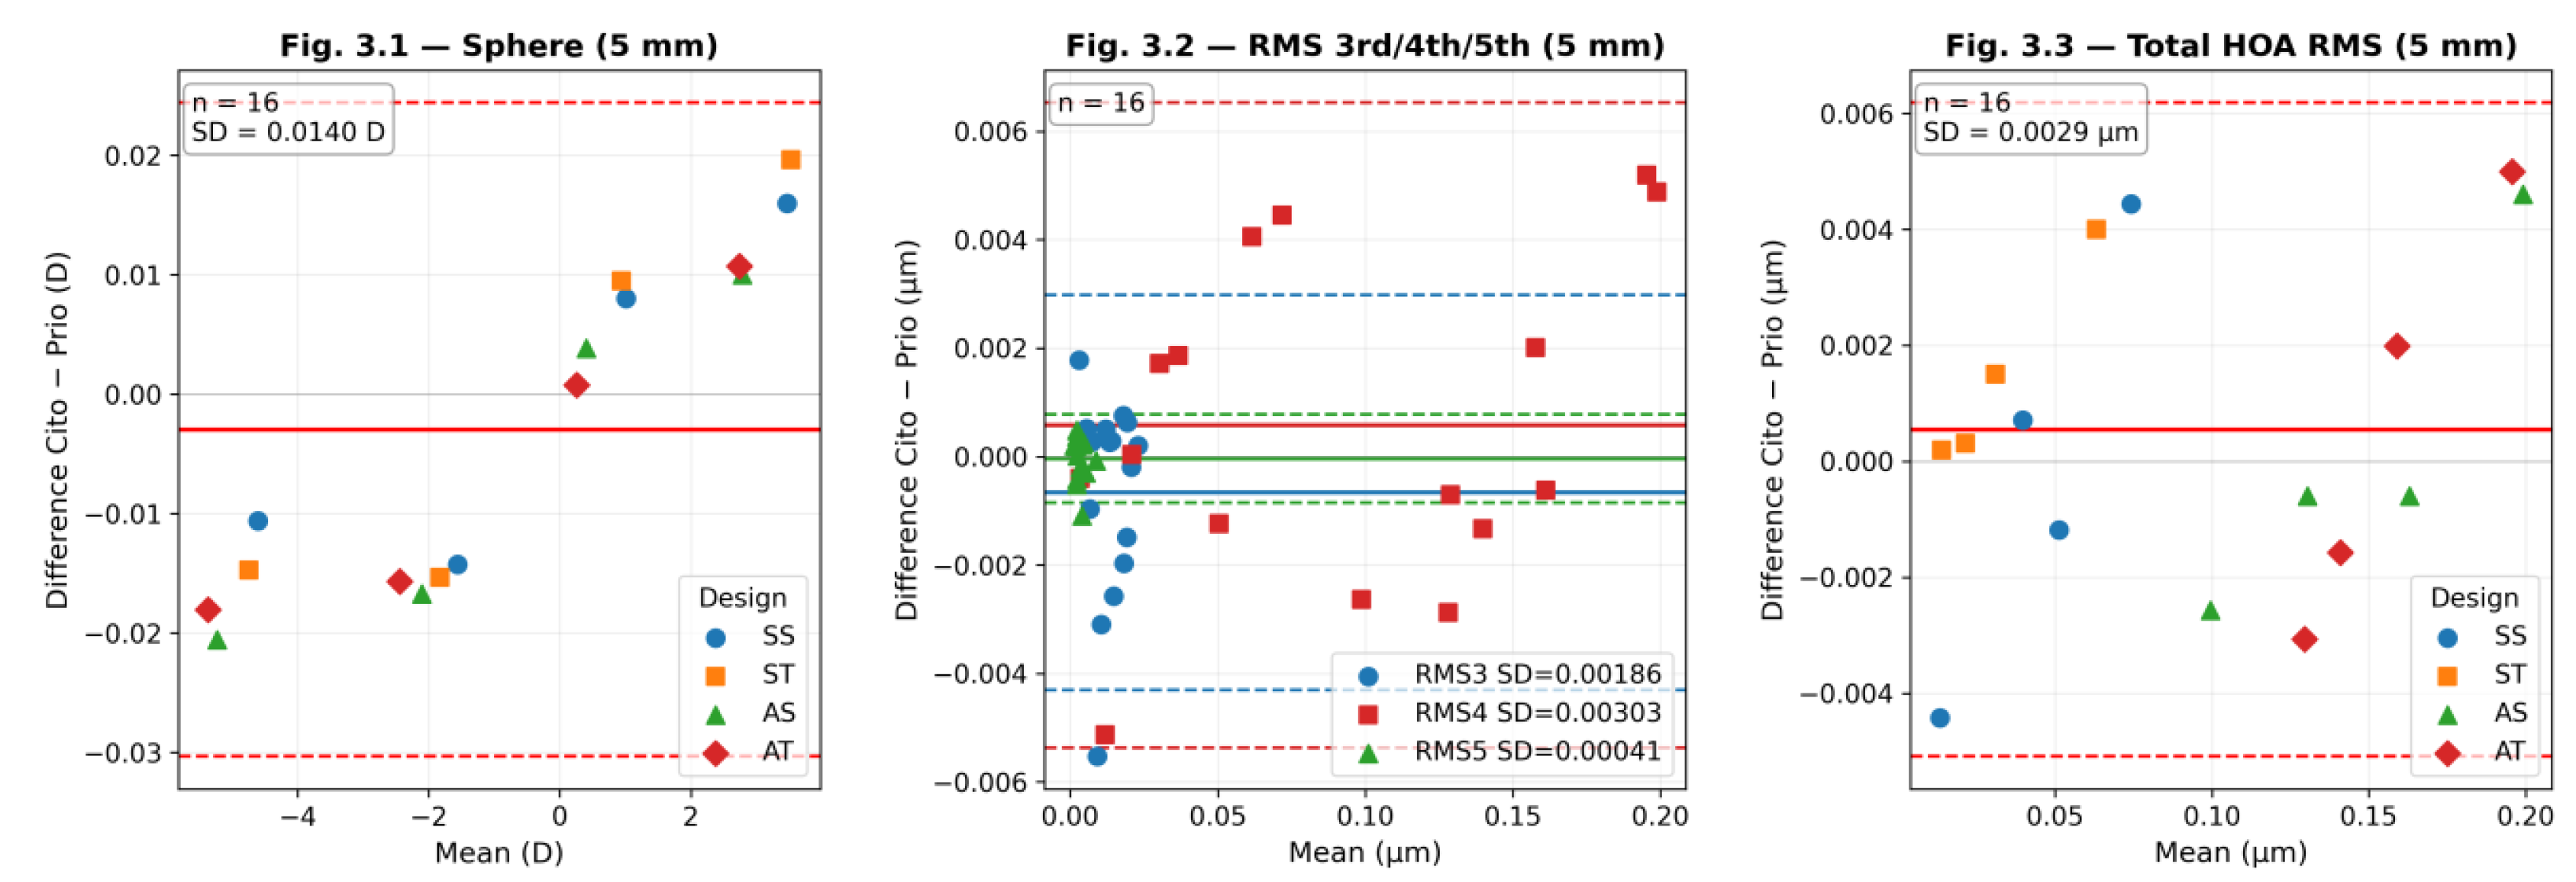
Figure 4.
Bland-Altman plots for inter-device agreement (SHSOphthalmic Cito − SHSInspect Prio) at 7.00 mm analysis aperture. Fig. 4.1: Sphere (D); Fig. 4.2: 3rd/4th/5th HOA RMS (μm); Fig. 4.3: Total HOA RMS (μm). See Figure 1 for legend details.
Figure 4.
Bland-Altman plots for inter-device agreement (SHSOphthalmic Cito − SHSInspect Prio) at 7.00 mm analysis aperture. Fig. 4.1: Sphere (D); Fig. 4.2: 3rd/4th/5th HOA RMS (μm); Fig. 4.3: Total HOA RMS (μm). See Figure 1 for legend details.
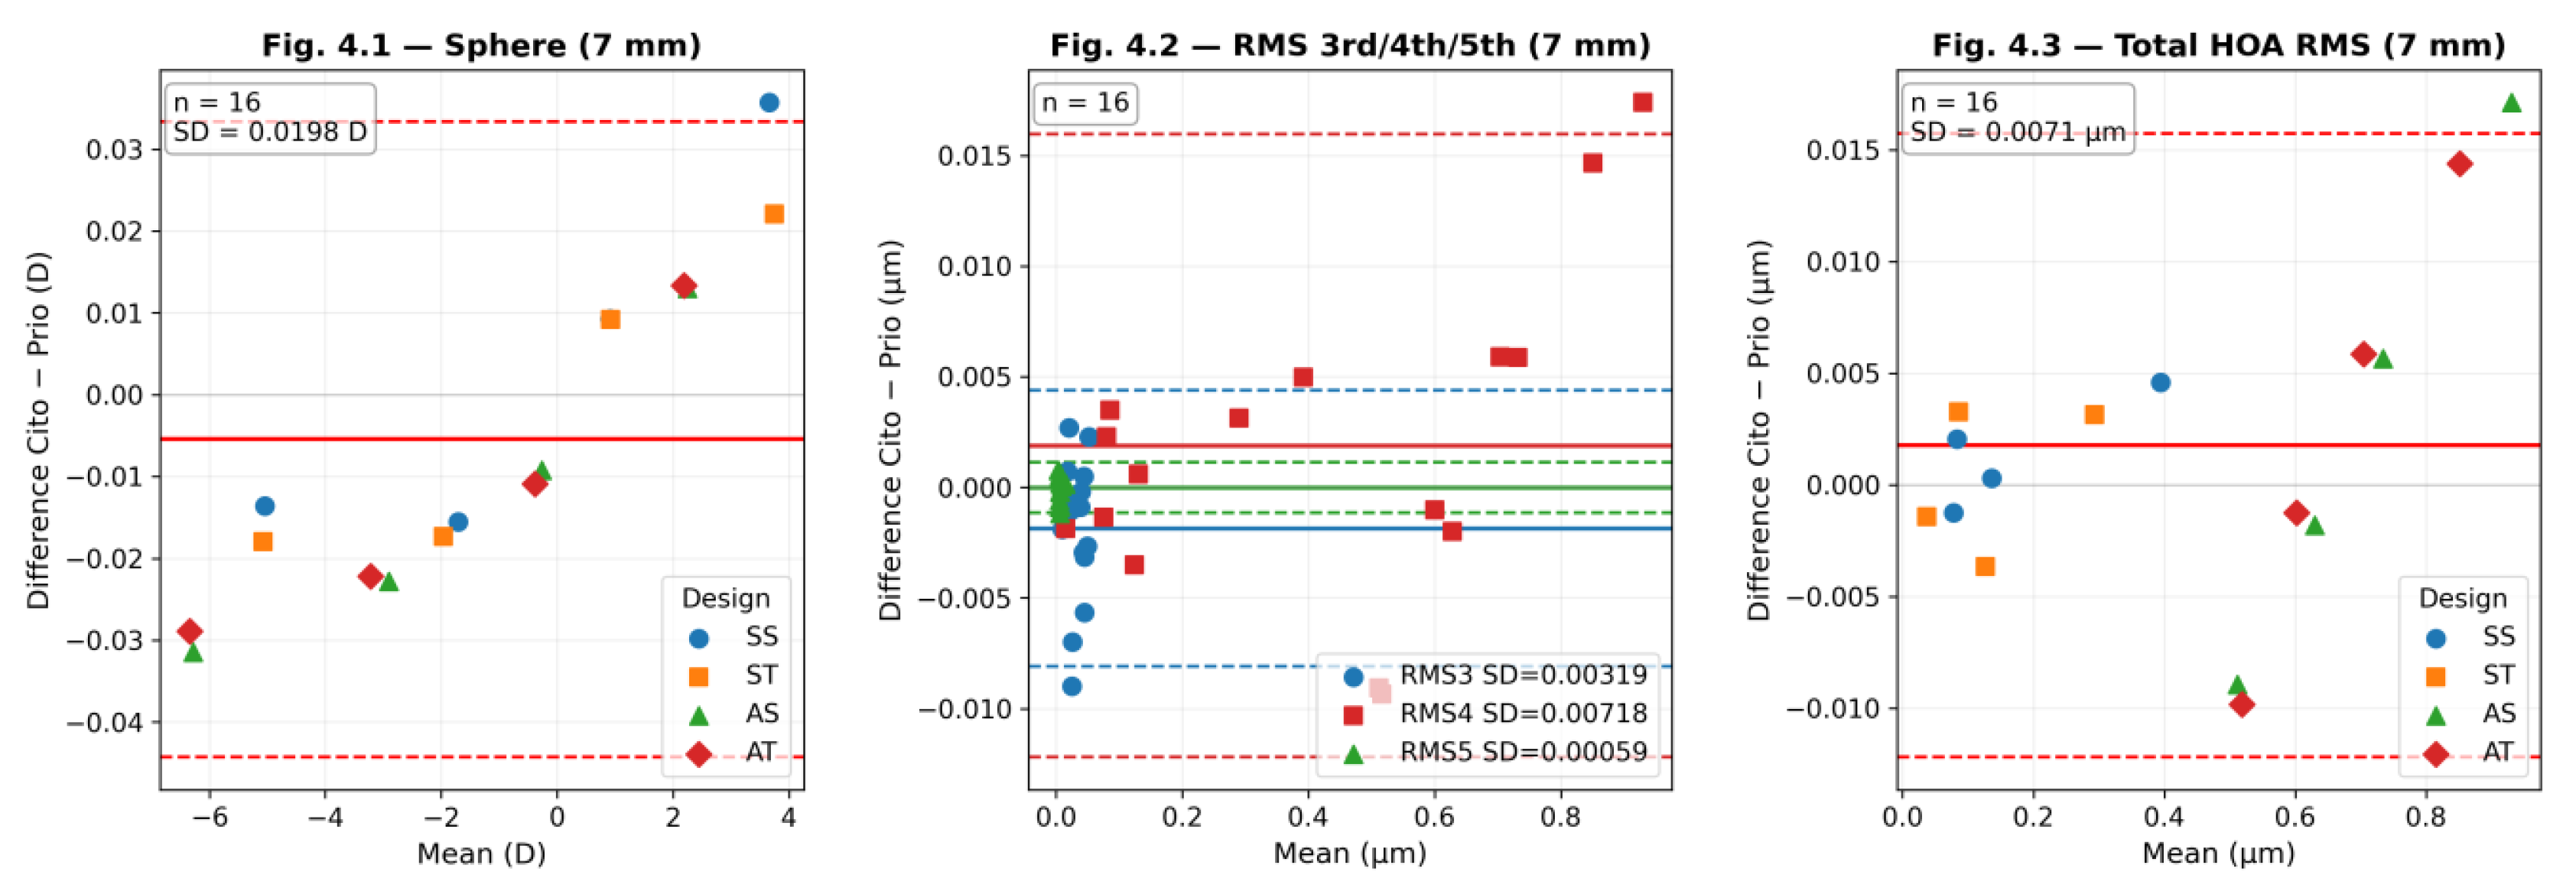

Table 1.
Technical specifications of the SHSOphthalmic Cito and SHSInspect Prio HS wavefront aberrometers (Optocraft GmbH, Erlangen, Germany) used in this study.
Table 1.
Technical specifications of the SHSOphthalmic Cito and SHSInspect Prio HS wavefront aberrometers (Optocraft GmbH, Erlangen, Germany) used in this study.
| Parameter | SHSOphthalmic Cito | SHSInspect Prio |
|---|---|---|
| Image | 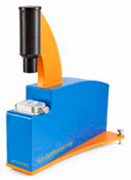 |
 |
| Technology | HS wavefront sensor | HS wavefront sensor |
| Lenslet array (lateral resolution) |
54 x 54 measurement points | 157 x 157 measurement points |
| Field of view (refractive data) | 8.00 mm | 8.50 mm |
| Wavelength | 540 ± 10 nm | 540 ± 10 nm |
| Spherical power range (air) | -30 to +30 D | -35 to +35 D |
| Power reproducibility | < 0.02 D (1 σ, lens moved) | < 0.02 D (1 σ, lens moved) |
| Power repeatability | < 0.002 D (1 σ, lens not moved) | < 0.002 D (1 σ, lens not moved) |
| Measurement duration | < 0.2 s | 0.2 to 1.0 s |
Table 2.
Specification of scleral lenses utilised in the study and cross-sectional thickness profiles.
Table 2.
Specification of scleral lenses utilised in the study and cross-sectional thickness profiles.
| BOZR (mm) | Sagittal depth | Power (D) | Thickness profile* |
|---|---|---|---|
| 9.00 | 4400 | +3.00 | 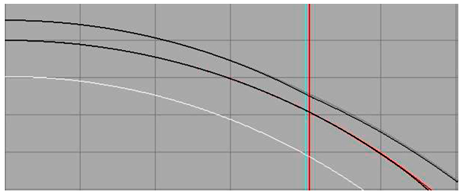 |
| 8.50 | 4600 | +0.75 | 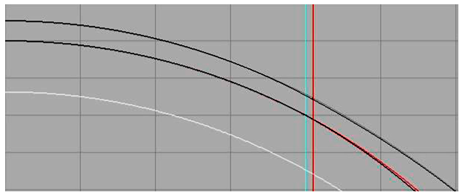 |
| 8.00 | 4800 | -1.75 | 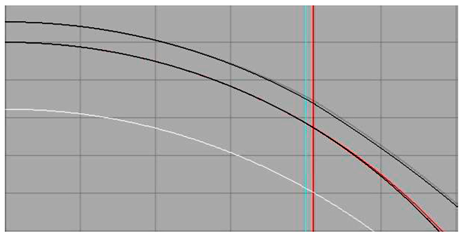 |
| 7.50 | 5000 | -4.50 | 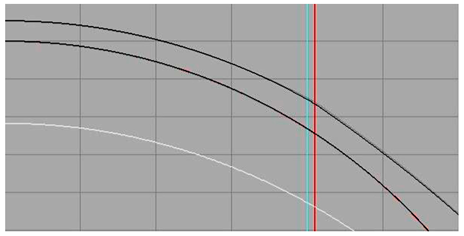 |
* For each BOZR configuration, the white profile represents the anterior corneal surface, the inner black profile represents the posterior lens surface, and the outer black profile represents the anterior surface of the spherical SL design. The grey profile, visible just beyond the outer black surface, represents the anterior surface of the aspherical (FSE = 0.70) SL design. The red vertical line indicates the edge of the optical zone. The difference between the spherical and aspherical anterior surface profiles is subtle within the optical zone, reflecting the modest eccentricity value of the aspherical design.
Table 3.
Repeatability of SHSOphthalmic Cito and SHSInspect Prio across three measurement apertures and across all 16 lenses, encompassing four design configurations (spherical symmetric, SS; spherical toric, ST; aspherical symmetric, AS; aspherical toric, AT), with four lenses per design.
Table 3.
Repeatability of SHSOphthalmic Cito and SHSInspect Prio across three measurement apertures and across all 16 lenses, encompassing four design configurations (spherical symmetric, SS; spherical toric, ST; aspherical symmetric, AS; aspherical toric, AT), with four lenses per design.
| SHSOphthalmic Cito (54×54) | SHSInspect Prio (157×157) | ||||||||
|---|---|---|---|---|---|---|---|---|---|
| Metric | Aperture (mm) | SW | CV (%) | RC | ICC | SW | CV (%) | RC | ICC |
| Sphere (D) | 3 | 0.0080 | — | 0.0222 | 1.000 | 0.0026 | — | 0.0073 | 1.000 |
| 5 | 0.0018 | — | 0.0051 | 1.000 | 0.0009 | — | 0.0024 | 1.000 | |
| 7 | 0.0022 | — | 0.0060 | 1.000 | 0.0015 | — | 0.0042 | 1.000 | |
| RMS 3rd order (µm) |
3 | 0.0008 | 17.8 | 0.0022 | 0.842 | 0.0009 | 18.5 | 0.0024 | 0.876 |
| 5 | 0.0015 | 11.4 | 0.0041 | 0.942 | 0.0019 | 13.8 | 0.0053 | 0.908 | |
| 7 | 0.0046 | 14.4 | 0.0128 | 0.890 | 0.0062 | 18.3 | 0.0173 | 0.808 | |
| RMS 4th order (µm) |
3 | 0.0005 | 3.7 | 0.0015 | 0.996 | 0.0004 | 2.6 | 0.0011 | 0.998 |
| 5 | 0.0004 | 0.4 | 0.0011 | 1.000 | 0.0021 | 2.3 | 0.0059 | 0.999 | |
| 7 | 0.0021 | 0.5 | 0.0057 | 1.000 | 0.0005 | 0.1 | 0.0014 | 1.000 | |
| RMS 5th order (µm) |
3 | 0.0005 | 21.0 | 0.0014 | 0.591 | 0.0004 | 18.4 | 0.0011 | 0.843 |
| 5 | 0.0005 | 15.0 | 0.0015 | 0.916 | 0.0005 | 12.7 | 0.0013 | 0.942 | |
| 7 | 0.0005 | 7.3 | 0.0014 | 0.964 | 0.0008 | 11.7 | 0.0022 | 0.909 | |
| Total HOA RMS (µm) | 3 | 0.0006 | 4.0 | 0.0017 | 0.994 | 0.0005 | 3.0 | 0.0013 | 0.997 |
| 5 | 0.0004 | 0.4 | 0.0011 | 1.000 | 0.0021 | 2.2 | 0.0058 | 0.999 | |
| 7 | 0.0020 | 0.5 | 0.0055 | 1.000 | 0.0007 | 0.2 | 0.0021 | 1.000 | |
Sw = within-subject standard deviation; CV = coefficient of variation (not reported for Sphere as the mean power across lenses approaches zero, rendering the coefficient of variation mathematically undefined and clinically uninformative); RC = repeatability coefficient (2.77 × Sw); ICC = intraclass correlation coefficient.
Table 4.
Inter-device agreement between SHSOphthalmic Cito and SHSInspect Prio (Bland-Altman analysis).
Table 4.
Inter-device agreement between SHSOphthalmic Cito and SHSInspect Prio (Bland-Altman analysis).
| Metric | Aperture (mm) | Bias | LoA lower | LoA upper | ICC | p-value |
|---|---|---|---|---|---|---|
| Sphere (D) | 3 | -0.00452 | -0.02749 | +0.01846 | 1.000 | 0.1442 |
| 5 | -0.00297 | -0.03034 | +0.02440 | 1.000 | 0.3484 | |
| 7 | -0.00545 | -0.04431 | +0.03341 | 1.000 | 0.2889 | |
| RMS 3rd order (µm) |
3 | -0.00012 | -0.00215 | +0.00191 | 0.886 | 0.5619 |
| 5 | -0.00066 | -0.00430 | +0.00298 | 0.950 | 0.5619 | |
| 7 | -0.00185 | -0.00810 | +0.00439 | 0.964 | 0.0342* | |
| RMS 4th order (µm) |
3 | -0.00102 | -0.00200 | -0.00003 | 0.991 | <0.001*** |
| 5 | +0.00058 | -0.00537 | +0.00653 | 0.999 | 0.4564 | |
| 7 | +0.00188 | -0.01220 | +0.01597 | 1.000 | 0.3108 | |
| RMS 5th order (µm) |
3 | +0.00015 | -0.00099 | +0.00129 | 0.756 | 0.3258 |
| 5 | -0.00004 | -0.00085 | +0.00078 | 0.976 | 0.7286 | |
| 7 | -0.00001 | -0.00116 | +0.00114 | 0.976 | 0.9424 | |
| Total HOA RMS (µm) | 3 | -0.00092 | -0.00222 | +0.00038 | 0.991 | <0.001*** |
| 5 | +0.00055 | -0.00509 | +0.00618 | 0.999 | 0.4584 | |
| 7 | +0.00177 | -0.01219 | +0.01573 | 1.000 | 0.3358 |
Bias = mean difference (Cito − Prio); LoA = 95% limits of agreement; ICC = intraclass correlation coefficient. Statistical significance assessed by paired t-test, except for the following metrics where the Shapiro-Wilk test indicated non-normal distribution of differences and the Wilcoxon signed-rank test was used: RMS 3rd order (μm) at 3.00 mm; Sphere (D) at 5.00 mm; RMS 3rd order (μm) at 5.00 mm. * p<0.05; *** p<0.001.
Table 5.
Two-way ANOVA: effect of front surface eccentricity and peripheral toricity on inter-device differences.
Table 5.
Two-way ANOVA: effect of front surface eccentricity and peripheral toricity on inter-device differences.
| Metric | Aperture (mm) | FSE (p-value) | TP (p-value) | Interaction (p-value) |
|---|---|---|---|---|
| Sphere (D) | 3 | 0.387 | 0.553 | 0.138 |
| 5 | 0.488 | 0.986 | 0.984 | |
| 7 | 0.202 | 0.830 | 0.796 | |
| RMS 3rd order (µm) |
3 | 0.079 | 0.137 | 0.468 |
| 5 | 0.159 | 0.984 | 0.521 | |
| 7 | 0.251 | 0.529 | 0.445 | |
| RMS 4th order (µm) |
3 | 0.876 | 0.899 | 0.553 |
| 5 | 0.915 | 0.583 | 0.804 | |
| 7 | 0.653 | 0.823 | 0.921 | |
| RMS 5th order (µm) |
3 | 0.239 | 0.183 | 0.689 |
| 5 | 0.693 | 0.344 | 0.270 | |
| 7 | 0.050 | 0.762 | 0.415 | |
| Total HOA RMS (µm) |
3 | 0.079 | 0.191 | 0.722 |
| 5 | 0.854 | 0.538 | 0.698 | |
| 7 | 0.662 | 0.823 | 0.962 |
Two-way ANOVA (Type II SS) on inter-device differences (Cito − Prio). FSE (Front Surface Eccentricity): spherical designs (SS + ST, n=8) vs. aspherical designs (AS + AT, FSE=0.70, n=8). TP (Toric Periphery): symmetric designs (SS + AS, n=8) vs. toric peripheral. Interaction: tests whether the effect of FSE on inter-device differences depends on the presence of TP, and vice versa. Each factor uses all 16 lenses partitioned as: SS (spherical symmetric), ST (spherical toric), AS (aspherical symmetric), AT (aspherical toric), n=4 per group. p<0.05.
Disclaimer/Publisher’s Note: The statements, opinions and data contained in all publications are solely those of the individual author(s) and contributor(s) and not of MDPI and/or the editor(s). MDPI and/or the editor(s) disclaim responsibility for any injury to people or property resulting from any ideas, methods, instructions or products referred to in the content. |
© 2026 by the authors. Licensee MDPI, Basel, Switzerland. This article is an open access article distributed under the terms and conditions of the Creative Commons Attribution (CC BY) license.
Copyright: This open access article is published under a Creative Commons CC BY 4.0 license, which permit the free download, distribution, and reuse, provided that the author and preprint are cited in any reuse.


