

Submitted:
12 July 2026
Posted:
14 July 2026
You are already at the latest version
Abstract
Optical spectroscopy provides several useful information about polymeric ultrathin films by combining interferometric and optical absorption data contained in the UV-Vis-NIR spectra. In particular, the UV-Vis-NIR spectrum of an ultrathin polymeric film contains information about the film thickness, structural disorder, bandgap energy, type of electron transition model (direct/indirect, allowed/forbidden), cutoff wavelength (i.e., the opaque/transparent switching wavelength), etc. Here, these properties have been determined for a model semi-crystalline polymer (polyethylene terephthalate, PET) in form of ultrathin film before and after a mild mechanical deformation treatment (manual stretching). It has been found that EU and Eg parameters are not strictly depending on mechanical deformation due to their main dependence on chemical composition/constitution of the polymer; consequently Eg can be used for polymer identification in the case it has a dielectric nature.
Keywords:
mylar
; polyethylene terephthalate
; ultrathin film
; interferometry
; optical absorption coefficient
; optical bandgap
; Tauc plot
; Urbach energy
; chemical analysis
1. Introduction
Absorption optical spectroscopy (UV-Vis-NIR spectroscopy) provides important physical information about dielectric polymers at solid state [1,2] and can allow their identification. The electronic structure of amorphous or semi-crystalline dielectric polymers is approximately described by a model of band-structure characterized by a high content of interstitial levels (i.e., localized tail states usually named trap states) [3,4,5]. Bandgap energy (Eg) is the fundamental feature of band-structures (it is equivalent to Lewis shell excitation energies in atoms) and its numerical value can be determined with high accuracy by using absorption optical spectroscopy data [6]. Moreover, Urbach energy, EU, which measures electronic disorder in solids with a band-structure can also be determined by the same optical spectroscopy approach [6]. Important polymer behaviors can be understood on the basis of these two physical quantities deriving from optical spectra. For example, Eg is correlated to relevant polymer characteristics like photostability, thermal stability, dielectric strength, electrical polarizability [7] and various optical parameters like the cutoff wavelength, λg=hc/Eg. On the other hand, EU measures structural disorder in polymers (i.e., a quantity depending on crystallinity degree, level of chain entanglement in the amorphous phase, impurity content, porosity, surface roughness, etc.). Both parameters are obtained by analyzing the behavior of the polymer optical absorption coefficient with photon energy in the fundamental absorption edge spectral region. This absorption coefficient is a determining factor for optical material applications (e.g., optical limiters) and has a key role in the optical analysis of polymers and other optical-grade solid media (e.g., silica glass, semiconductor oxides), since it measures how strongly a material absorbs photons of a specific energy. According to the Lambert exponential law for homogeneous optical solids (i.e., I(d)=I0·exp(-α·d)= Iinc·(1-R)2∙exp(-α·d), where Iinc is the incident light intensity, R the reflectance (Fresnel loss), I(d) is the light intensity for a d-thick film, and α is the optical absorption coefficient [6,8]), the optical absorption coefficient quantifies the fraction of light intensity lost per distance unit, as radiation propagates through the material. Since the beam positioning inside an UV-Vis spectrophotometer always is perpendicular to the sample (thin film) surface, reflectance R is given by the Fresnel equation R=(n1-n2/n1+n2)2, that provides for example for an air-PET interface a Fresnel loss value of 0.04 (with nair=1 and nPET=1.575). Therefore, the quantity, 1-R, is close to one (1-R=0.96) and the Lambert law can be simplified (also scattering is assumed as negligible). In particular, introducing a physical parameter named total absorbance, Atot, defined as Atot=Log(Iinc/I), the absorption coefficient at a specific wavelength is given by the following logarithmic relationship: α(λ)=(ln10)·[Atot/d]. Both Atot and d can be obtained from optical absorption data. Indeed, total absorbance data are directly recorded in UV-Vis spectral measurements or can be calculated from the transmittance values (i.e., Atot=-Log(T%/100), where T% is the transmittance percentage) also provided as spectrophotometer output. In addition, interferometric analysis of spectral oscillations contained in the transparence region of the spectrum allows very accurate film thickness (d) calculation (in the case the polymer refractive index is known). These optical data are combined together and photon wavelength is converted to energy by the modified Planck equation (i.e., E(eV)=1,240/λ(nm), where λ is the radiation wavelength) to achieve the α(E) graph. In the EU and Eg determination, the behavior of α(E) is analyzed by using some special types of graphical representations, named Urbach and Tauc plots, respectively.
Here, as an example of this general analysis method, a model system of ultrathin polymeric film consisting of optical-grade Mylar (polyethylene terephthalate, PET) has been investigated. Bi-axially oriented ultrathin PET films allow to fabricate highly transparent and mechanically robust plastic devices with very low X-ray fluorescence, that are widely used as windows in disposable sample cups for X-Ray Fluorescence Spectroscopy (XRF), substrates for electrodes/sensors in wearable electronics, insulator tapes, packaging material for optoelectronic devices, etc. This type of polymer has quite high refractive index (1.575) and Mylar films for XRF applications have enough flat/smooth surfaces, which increases visibility of spectral oscillations. The stretching of these PET films generates thinner layers of uniform thickness that can be analyzed by the same approaches. The optical characterization of these ultrathin films by UV-Vis-NIR absorbance spectroscopy before and after the stretching treatment allows obtaining useful information on the possible film changes in geometric, electronic and structural disorder properties, as a consequence of this mechanical deformation.
2. Materials and Methods
XRF grade Mylar films (PANalytical B.V., X-Ray film Polyesterpetp, 943050007191) have been investigated as a model of ultrathin polymer films. This type of films is made of biaxially oriented polyethylene terephthalate (PET) and are used as windows in disposable sample cups for X-Ray Fluorescence Spectroscopy (XRF), since they allow maximum transmission of low energy X-rays, high mechanical strength, low X-ray fluorescence, etc. The optical spectra were acquired at room temperature using a double beam UV-Vis-NIR spectrophotometer (VWR, UV-6300PC Spectrophotometer, VWR International Europe bvba, Leuven, Belgium). Spectra were recorded in the 190-1100 nm wavelength range, using a low scan speed and a scan step (resolution) of 0.5 nm (2mm slit). The optical spectra were processed by a devoted analysis software (UV-Vis Analyst, Version 5.44), which allowed automatic reading of peak and valley wavelengths of interferometric fringes (spectral oscillations) present in the spectrum (high transparence region) and the corresponding full-width at half-maximum (FWHM) values. The software also allowed smoothing operations for cleaning the spectrum from these interference fringes and measure the average total absorbance value in such part of the optical spectrum. In particular, the PET film was optically characterized without blanking and both reflectance (Fresnel loss) and scattering phenomena were assumed as negligible because of the normal incidence of the spectrophotometer beam on the film surface and low amount of surface defects, respectively. In particular, in order to have a perfectly perpendicular incidence of the spectrophotometer light beam, the films were accurately fixed to the instrument cuvette holder in a planar manner by using adhesive tape.
The ultrathin PET film cross-section and surface have been morphologically characterized by using a scanning electron microscope (SEM, FEI Quanta 200 FEG). According to the SEM characterization of ultrathin Mylar films, they showed uniform thickness and the presence of some surface defects, probably generated during post-processing treatments like rolling and cutting (see Figure 1a,b). The type of defect present on the film surface, namely terraces only a few nanometers thick, makes light scattering relatively ineffective. Scattering is more pronounced at interfaces with a significant refractive-index mismatch; in the present case, such shallow terraces are unlikely to induce substantial light diffusion or diffuse reflection. Indeed, ultrathin PET films exhibit very high transparency in the visible region, with a transmittance of approximately 87.4%.
The semi-crystalline nature of ultrathin PET film has been established by X-ray diffraction (XRD, X’Expert PRO, PANalytical, Oxford, UK) and crystallinity degree has been measured by differential scanning calorimetry (Discovery DSC 2500, Waters TA Instrument). PET films were also measured by a Fourier-Transform Infrared Spectrometer (FT-IR) (PerkinElmer, Frontier NIR with Micro-ATR, Milan, Italy).
3. Results
The interference phenomenon can be clearly detected in the high transparence region of the UV-Vis-NIR spectrum of ultrathin Mylar windows (see Figure 2). This physical phenomenon can be used for accurately measuring the film thickness (d is of the same order as the light wavelength). In particular, the following equation, derived from the interference maxima condition (i.e., 2n·d=m·λm) [9] in the case of a normally incident light beam, can be adopted [10]:
where d is the film thickness (in nm), Δm is the number of fringes (oscillations maxima) contained in the measurement interval, n is the average polymer refractive index, and λ1, λ2 are the wavelength limits of the measurement interval. According to the spectral oscillations in the ultrathin PET film optical spectrum shown in Figure 2, the film thickness obtained by using the above equation is 3.665 µm (an average refractive index value of 1.575 has been used for calculation [11]). It should be noted that, as visible in Figure 3a, due to very strong infrared absorption bands, spectral oscillations are difficult to detect in the FT-IR spectrum (high-wavenumber region) and are not visible in the ATR spectrum of the same film (see Figure 3b).
d=Δm/2n(1/λ1-1/λ2)
Since the PET films have a regular shape (i.e., thin circular disks), this optically measured thickness value has been confirmed by a simple geometrical calculation based on density [12]. In particular, the following expression has been used: d=m/(π·R2·ρ), where m is the film weight, R the dish radius and ρ the PET density. A value of 3.59 µm has been found by using a PET density value of 1.3g/cm3 [13]. This thickness value perfectly agrees with value obtained by the interferometric measurement.
The interferometrically measured film thickness has been used for calculating the optical absorption coefficient value. It must be pointed out that the absorbance data in the fundamental absorption edge (required for both Urbach and Tauc analysis) are readily accessible for the absorption coefficient calculation because spectral oscillations are present only in the high transparency region of the UV-Vis spectrum. In addition, the UV-Vis Analyst software allowed the application of spectral smoothing which reduced fringes in the spectrum for obtaining the average total absorbance in this spectral region [14]. A graph of ln(α) vs. the photon energy is named Urbach plot (see Figure 4a) and this special graph can be used to know the amount of structural disorder in this ultrathin PET film [15]. Structural disorder is proportional to the Urbach energy, EU, which is given by the inverse of the slope of the linear part of curve in the Urbach plot. In particular, this quantity can be obtained by linear regression analysis of this straight part of the graph (see Figure 4b). In general, the structural disorder obtained by the Urbach plot depends on all types of defects contained in this thin PET film like for example air bubbles (porosity), surface roughness, chemical impurities (molecular additives like plasticizers, UV-stabilizers, etc.) dissolved in the polymer, percentage of the amorphous phase, etc. However, with respect to perfectly processed films, most contributions can be neglected and the measured structural disorder corresponds mostly to the content of amorphous phase and to the degree of chain entanglement characterizing this amorphous phase. In the case of the ultrathin PET film such calculation led to a value of 45.0meV (with R2=0.9912), which indicates a quite low disorder, probably due to the semi-crystalline nature of this polymer.
The small value of EU that has been found by applying the Urbach approach to the spectral data of PET films can be well justified on the basis of the semi-crystalline nature of this thermoplastic polymer. Indeed, according to the XRD diffractogram shown in Figure 5a, the polymer contains an amorphous fraction, which causes the presence of a broad diffuse halo in the diffractogram, and a crystalline part, which causes the presence of three main peaks overlapped to the diffuse halo. These peaks are located at 2θ values of 16.5°, 22.4°, and 25.8°; such diffraction peak positioning is in good agreement with literature information [16]. The FWHM of diffraction peaks is inversely proportional to the crystallite size (Scherrer equation [16]); consequently, the observed broad diffraction peaks suggest the presence of very small sized crystallites in the polymer, which justifies the observed high optical transparency in the visible spectral region.
The semi-crystalline nature of the ultrathin PET films has been further confirmed by Differential Scanning Calorimetry (DSC). According to the DSC-thermogram shown in Figure 5b, the polymer presents an endothermic signal due to the melting of the crystalline phase and such melting signal appears above the glass transition temperature (Tg), which is located at ca. 80.91 °C. The PET crystallites melting signal has an onset temperature at ca. 240 °C and a minimum at 255.59 °C. The DSC characterization of the polymer allows to measure the melting enthalpy, which resulted of ca. 40.30J/g. The calorimetric crystallinity degree, XC, of the polymeric sample can be determined by comparing the specimen melting enthalpy with the theoretical melting enthalpy of hypothetical fully crystalline PET sample (ca. 140J/g [17]) and such ratio resulted of ca. 28.8%. This crystallinity value agrees with the value characteristic of bi-axially oriented PET films [18]. Therefore, the small EU value experimentally found for the PET sample by the Urbach approach seems to be completely justified by its semi-crystalline nature.
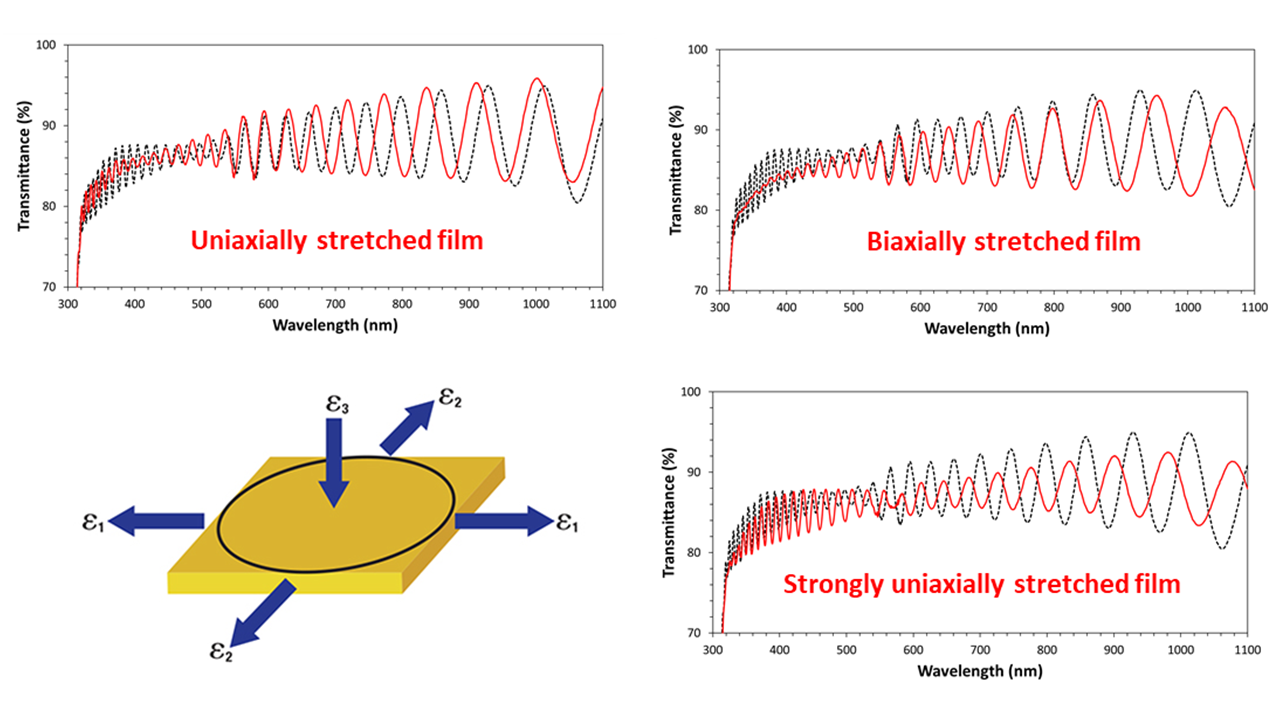
The same type of analysis (Urbach plot) has been applied to a slightly mechanically deformed (i.e., manually stretched) ultrathin PET film (see Figure 6a,b). Although, mechanical deformation had the effect to modify the film thickness (it became 3.245 µm, corresponding to 11.5% decrease), the resulting Urbach energy value (EU=45.2meV, with R2=0.9933) remained practically unchanged (see Figure 6b). Therefore, structural disorder did not increase appreciably in this system as a result of the applied stress. Typically, polymer stretching has the effect to change its crystalline morphology, causing transition from spherulitic to fibrous morphology. However, in the case of ultrathin PET film sample for XRF application, the polymer is bi-axially oriented, which means it already has a fibrous morphology generated by the extrusion undergone during the film processing stage. Therefore, the subsequent manual stretching treatment should primarily lead to increase macromolecular chain orientation along the stretching direction; however, given the very small change observed in the Urbach energy, this effect does not take place appreciably.
Ultraviolet radiation interacts with dielectric polymers causing photoexcitation (i.e., optical absorption due to electronic transitions). For some polymers like Kapton-H and polyetherimide (PEI), even visible photons may cause photoexcitations [19]. The cutoff wavelength has been observed for these ultrathin PET films at ca. 300nm. Consequently, photons with a wavelength below 300nm are completely absorbed by the film, while transparency is close to 87.4% at wavelengths above 300nm. The type of photoexcitation model and bandgap energy value (Eg) can be established optically by using the Tauc plot method. Eg is an important parameter for polymers since it is related to other physical properties like for example the permittivity (Eg is inversely proportional to material permittivity, which is the capability of electric field instauration in a material and corresponds to the material polarizability [7]). In addition, accurate Eg determination allows dielectric polymer to be identified (however, identification is not possible with conjugated polymers like polyacetylene because of the Eg dependence on the conjugation extension and therefore on molecular weight). The bandgap energy has been easily and accurately calculated by using the Tauc plot (see Figure 7a,b), which is a special graphical representation obtained by graphing the quantity (α·E)n as a function of the photon energy, E. The n value must be selected to allow the linearization of the (α·E)n function and n is 0.5 for an indirect electron transition model and 2 for a direct electron transition model (both models are for allowed electron transitions). Depending on the most convenient value found for n (the model with the best correlation factor), the type of electron transition model can be established. According to the following equation:
the value of the intercept with the energy axis corresponds to Eg (indeed, for (α·E)n = 0, it results E = Eg). The intercept value is obtained from the best fitting equation of the linear portion of curve by using the following expression: -intercept/slope. In our case, an Eg value of 3.96eV (with R2=0.9995) has been found for an indirect allowed electron transition model (n=0.5), which perfectly agrees with information provided in the literature [20,21].
(α·E)n = B·(E-Eg)
Manual stretching allowed simulating mild uniaxial mechanical stresses that polymeric films typically experience in service or during industrial uses. This investigation has shown that Eg is a polymer physical characteristic, which remains practically unchanged after the mild mechanical damage undergone by this material (see Figure 8a,b); in particular, according to this least square analysis, Eg was 3.96eV after stretching. Indeed, Eg depends mainly on atom types (composition) and the way atoms are chemically bonded together (constitution) in the repeating unit.
According to the achieved experimental results, dielectric polymers at solid-state have a band structure principally depending on the polymer chemical composition/constitution and only marginally on crystallinity, molecular weight and texture (i.e., fibrous/spherulitic morphology). Such behavior allows using the characteristic bandgap energy numerical value to establish polymer nature. Since the very dawn of analytical chemistry, the identification of inorganic compounds (e.g., elemental metals, metal salts) has been based on recognizing the electronic transitions (emission or absorption lines) involving frontier-orbitals, that is the valence shell orbitals (the Lewis electron layer). One need only think about the classical ‘flame-tests’ used by chemists since one hundred years ago, or the analysis by the early quartz-prism spectroscopes (Kirchhoff-Bunsen spectroscopes), now replaced by Atomic Absorption Spectroscopy (AAS). The yellow color imparted by sodium to the flame, the violet of potassium, the red of calcium, and so on, are well-known atomic emission phenomena. In the chemical analysis by these spectroscopes, thermally excited metals emit radiations that they are capable of absorbing too. Similarly, the precise assignment of the energy of the HOMO-LUMO transition (i.e., Eg) of dielectric polymers by UV-Vis spectrometric analysis can enable their reliable identification. In general, this approach cannot be applied to inorganic semiconductors (consider, for instance, how silicon is used - through doping - to fabricate multiple types of devices based on extrinsic semiconductors), nor to conductive/semiconductive polymers, due to their electronic configuration being dependent on the extent of conjugation (i.e., Eg = f(Mw), where Mw is the molecular weight); however, it works perfectly with dielectric polymers (and intrinsic semiconductors).
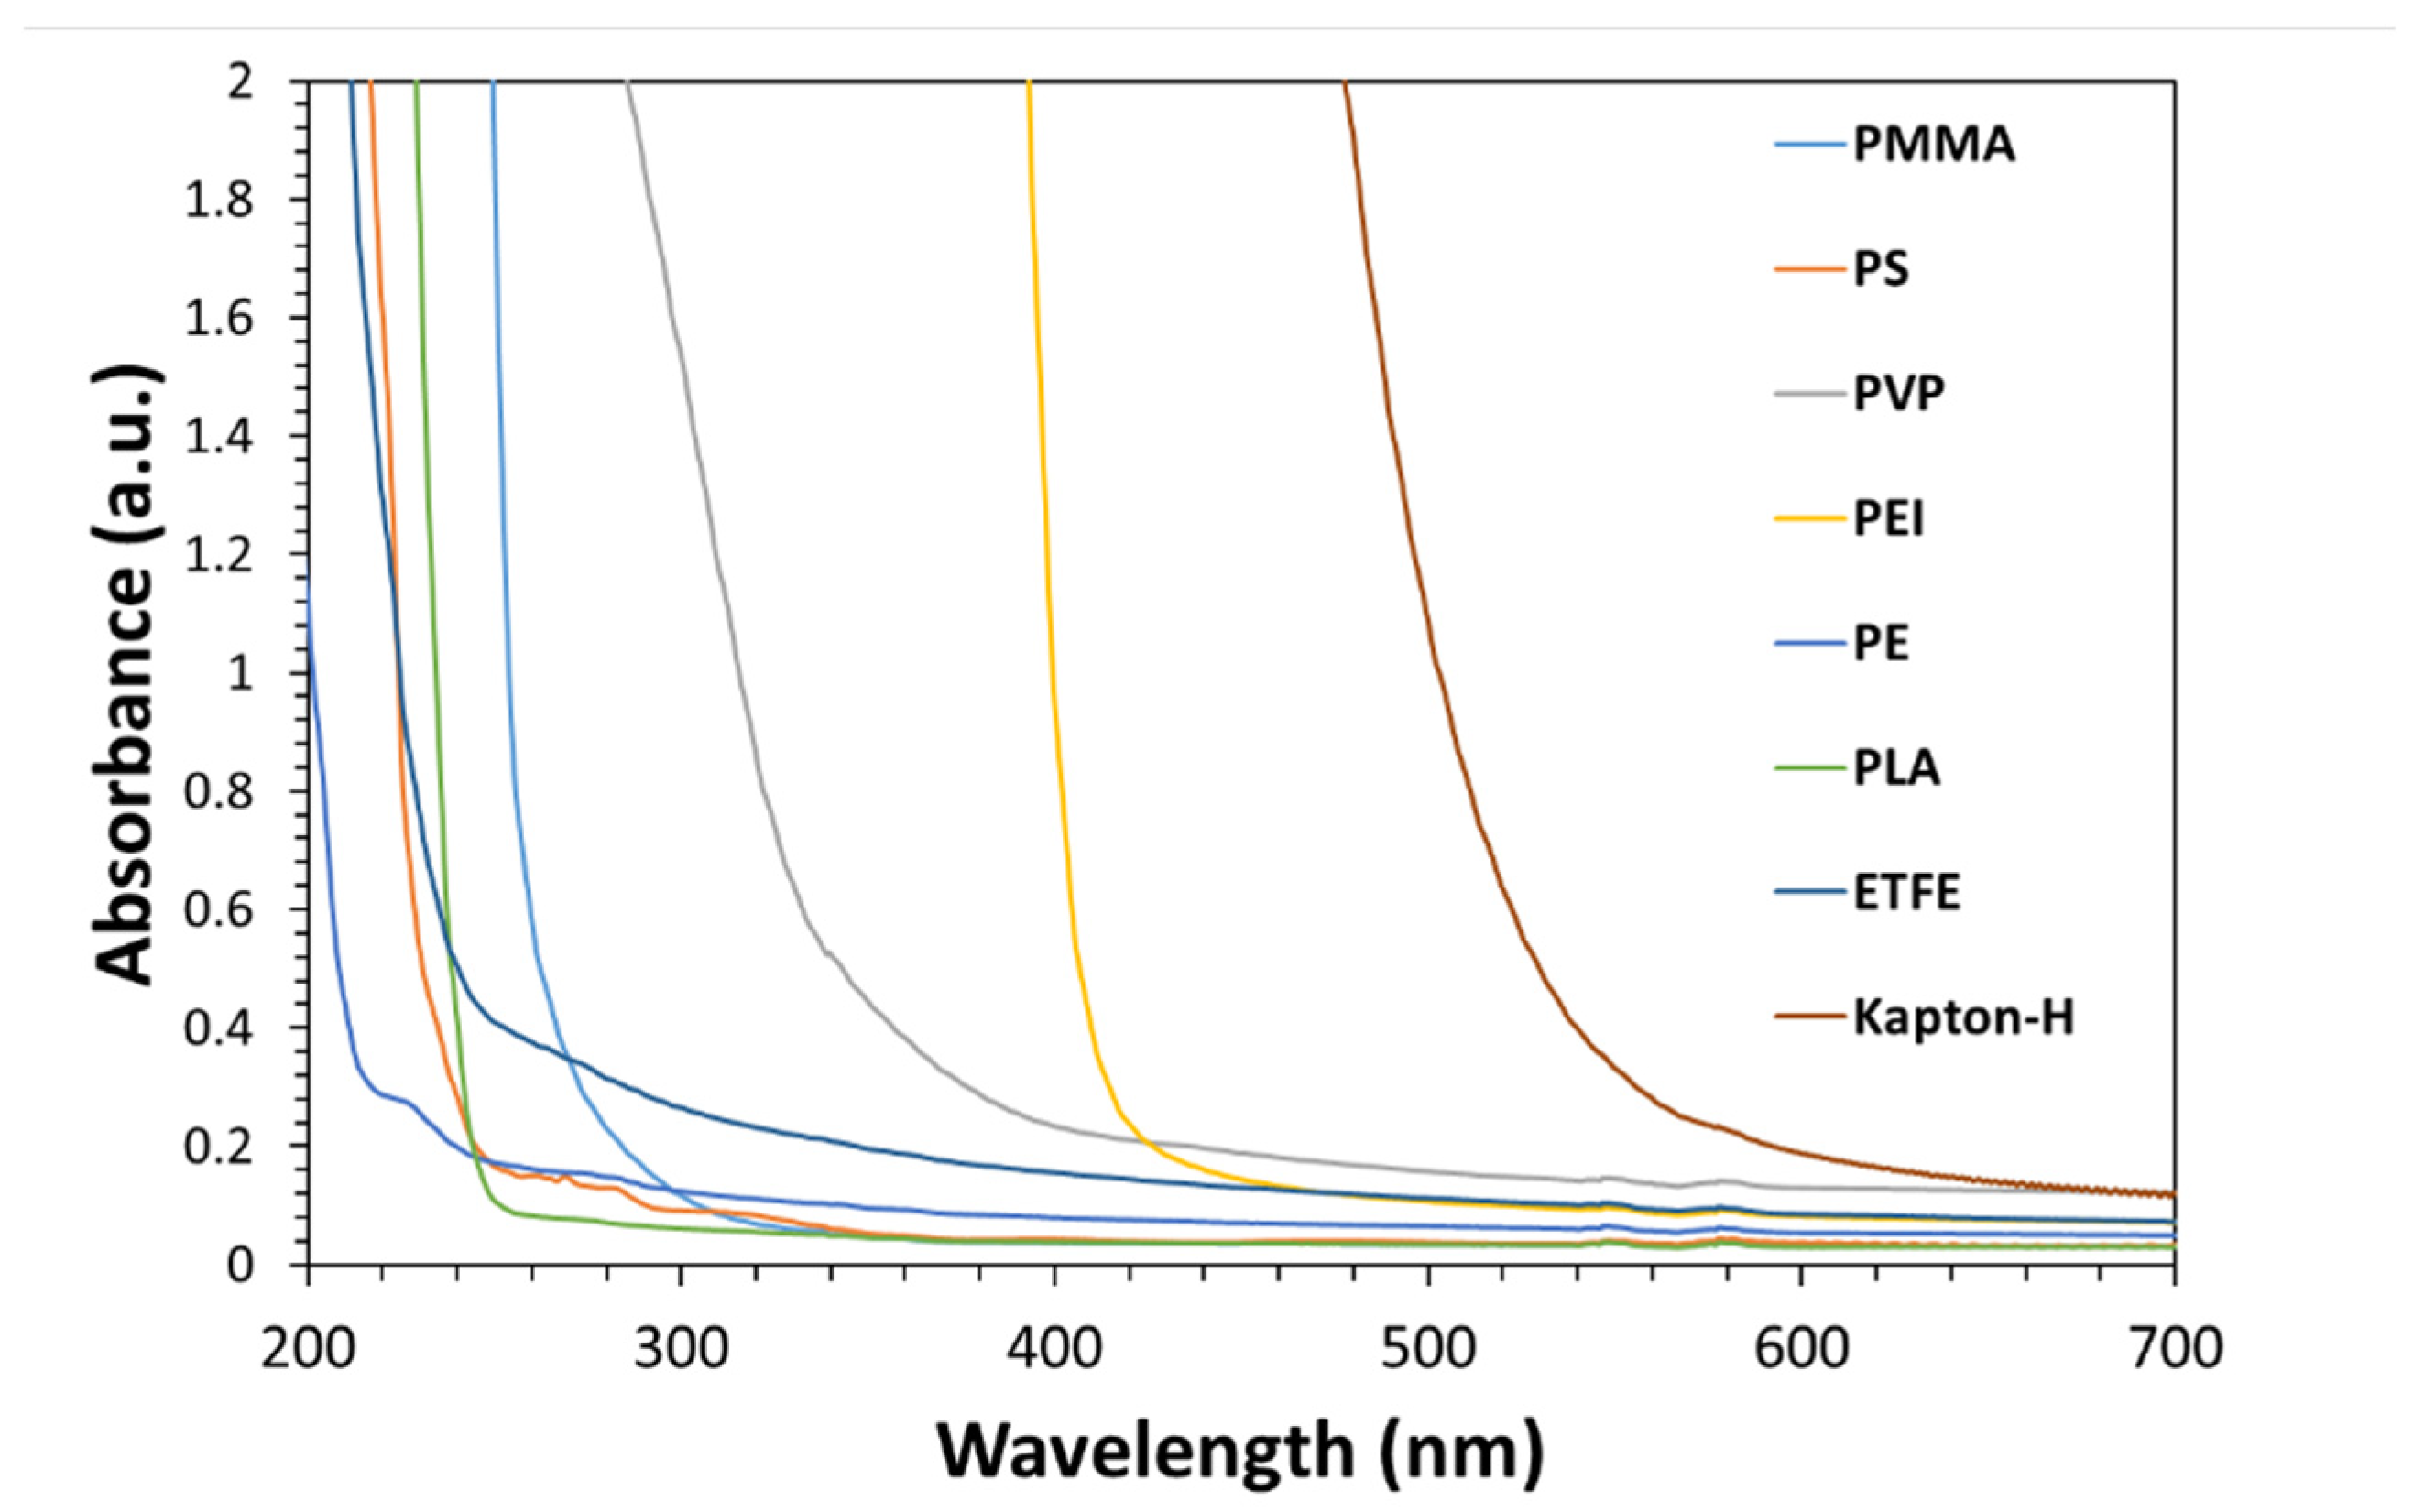
As visible in Figure 9, optical spectra of many different dielectric polymers have a similar profile, which is simply constituted of a high optically transparent spectral region characterized by an uniformly low value of absorbance, a high opacity spectral region (where the absorbance value is saturated in the full wavelength range) and a more or less sharp transition region, usually named cutoff or cuton, and corresponding to the fundamental absorption edge (HOMO-LUMO transition in the polymer band structure). The average cuton wavelength significantly varies among the different dielectric polymers (it is different also for polymers with quite similar chemical structures). Indeed, the cuton wavelength ranges in a wide spectral interval which is extending from the UV-B to Visible spectral regions (there are not dielectric polymers with a cuton falling in the NIR region of the spectrum). In particular, Figure 9 shows as the spectra of many different thermoplastic polymers are well distanced in the spectrum and mostly resolved since show cuton values located in different points of the ultraviolet and visible spectral regions (e.g., UV-B for PE and PS, UV-A for PVP, Visible for PEI and Kapton-H, etc.). Since the bandgap energies correlate with these transparent-opaque transition points, their numerical values are accordingly different and (just like the UV-Vis spectra) can be used for polymer identifying.
This chemical analysis approach can be conveniently adopted in fields like microplastics since these types of waste belong to only few, very different plastic classes that can be easily and with safety distinguished on the basis of the Eg parameter (identifying microplastics is an important aspect, since it allows adequate selection of suitable recycling/remediation processes). UV-Vis spectrophotometers could be very convenient in this research area because they have a very small beam spot and therefore sampling requires only little polymer amounts. Furthermore, these devices usually can have small size, be lightweight, and are easily transportable; they are structurally simple and consequently inexpensive, mechanically robust (diode-array devices have no moving parts) and capable of resisting in various environmental conditions. Therefore, optical spectrophotometers are suitable for building field/offshore laboratories to be placed, for example, on boats, on beaches, in landfills, etc. Yet, the chemical analysis of microplastics can be conducted directly in water (aqueous suspensions of microplastics) since this type of molecule is perfectly transparent to visible and ultraviolet light (up to approximately 100 nm).
However, microplastics are a special field that requires devoted considerations. When, through the exploration of new continents (the 16th century), humanity encountered a wide variety of living species, it faced the need to classify them in order to identify them unambiguously. The classification of species implies the important capability of recognizing them and, from that, the possibility of acting on them appropriately, once their nature is known. The classification of complex species is not as straightforward as that of chemical substances made up of a single, well-defined chemical structure. In order to build a classification for such complex species (taxonomy), Linnaeus (for animal organisms) and Mohs (for minerals) referred to external properties, which Mohs termed “historico-natural properties”. Microplastics have a well-defined chemical composition, but they are widely altered by chemical stress (e.g., oxidation and photodecomposition, contamination, etc.) and by physical stress (various types of mechanical deformations). For this reason, they are analogous to the complex and numerous natural species; hence, to act correctly upon them it is necessary to classify them just like in the case of minerals and living organisms. The approach based on external properties is therefore necessary; and just as Mohs identified one particularly discriminating property among mineral species (the hardness) and used it as the main tool for their identification, so one can argue that the bandgap energy (Eg) can play an analogous role for microplastics. We believe that Eg can be a sort of ‘ideal tool’ for the identification/classification of chemically and physically corrupted plastics, because the electronic structure at frontier-orbital has long been used in analytical chemistry to identify substances. The energy of the electronic transition between frontier orbitals (HOMO-LUMO) can be measured with good precision by means of UV-Vis-NIR spectroscopic analysis combined with graphical tools. However, degraded polymers, being complex chemical species rather than simple chemical compounds (because of surface oxidation, contamination by adsorbed inorganic substances, photodecomposition and thermal degradation, etc.), require a classification/analysis based not only on the spectroscopic investigation but also on morphological (SEM/TEM microscopy), diffractometric (XRD), thermal (DSC/TGA), and other types of analyses. Just as hardness alone is not sufficient for the identification of mineral species, so also optical spectroscopy, through the measurement of the Eg value alone, is not enough and must be integrated with other types of instrumental investigations.
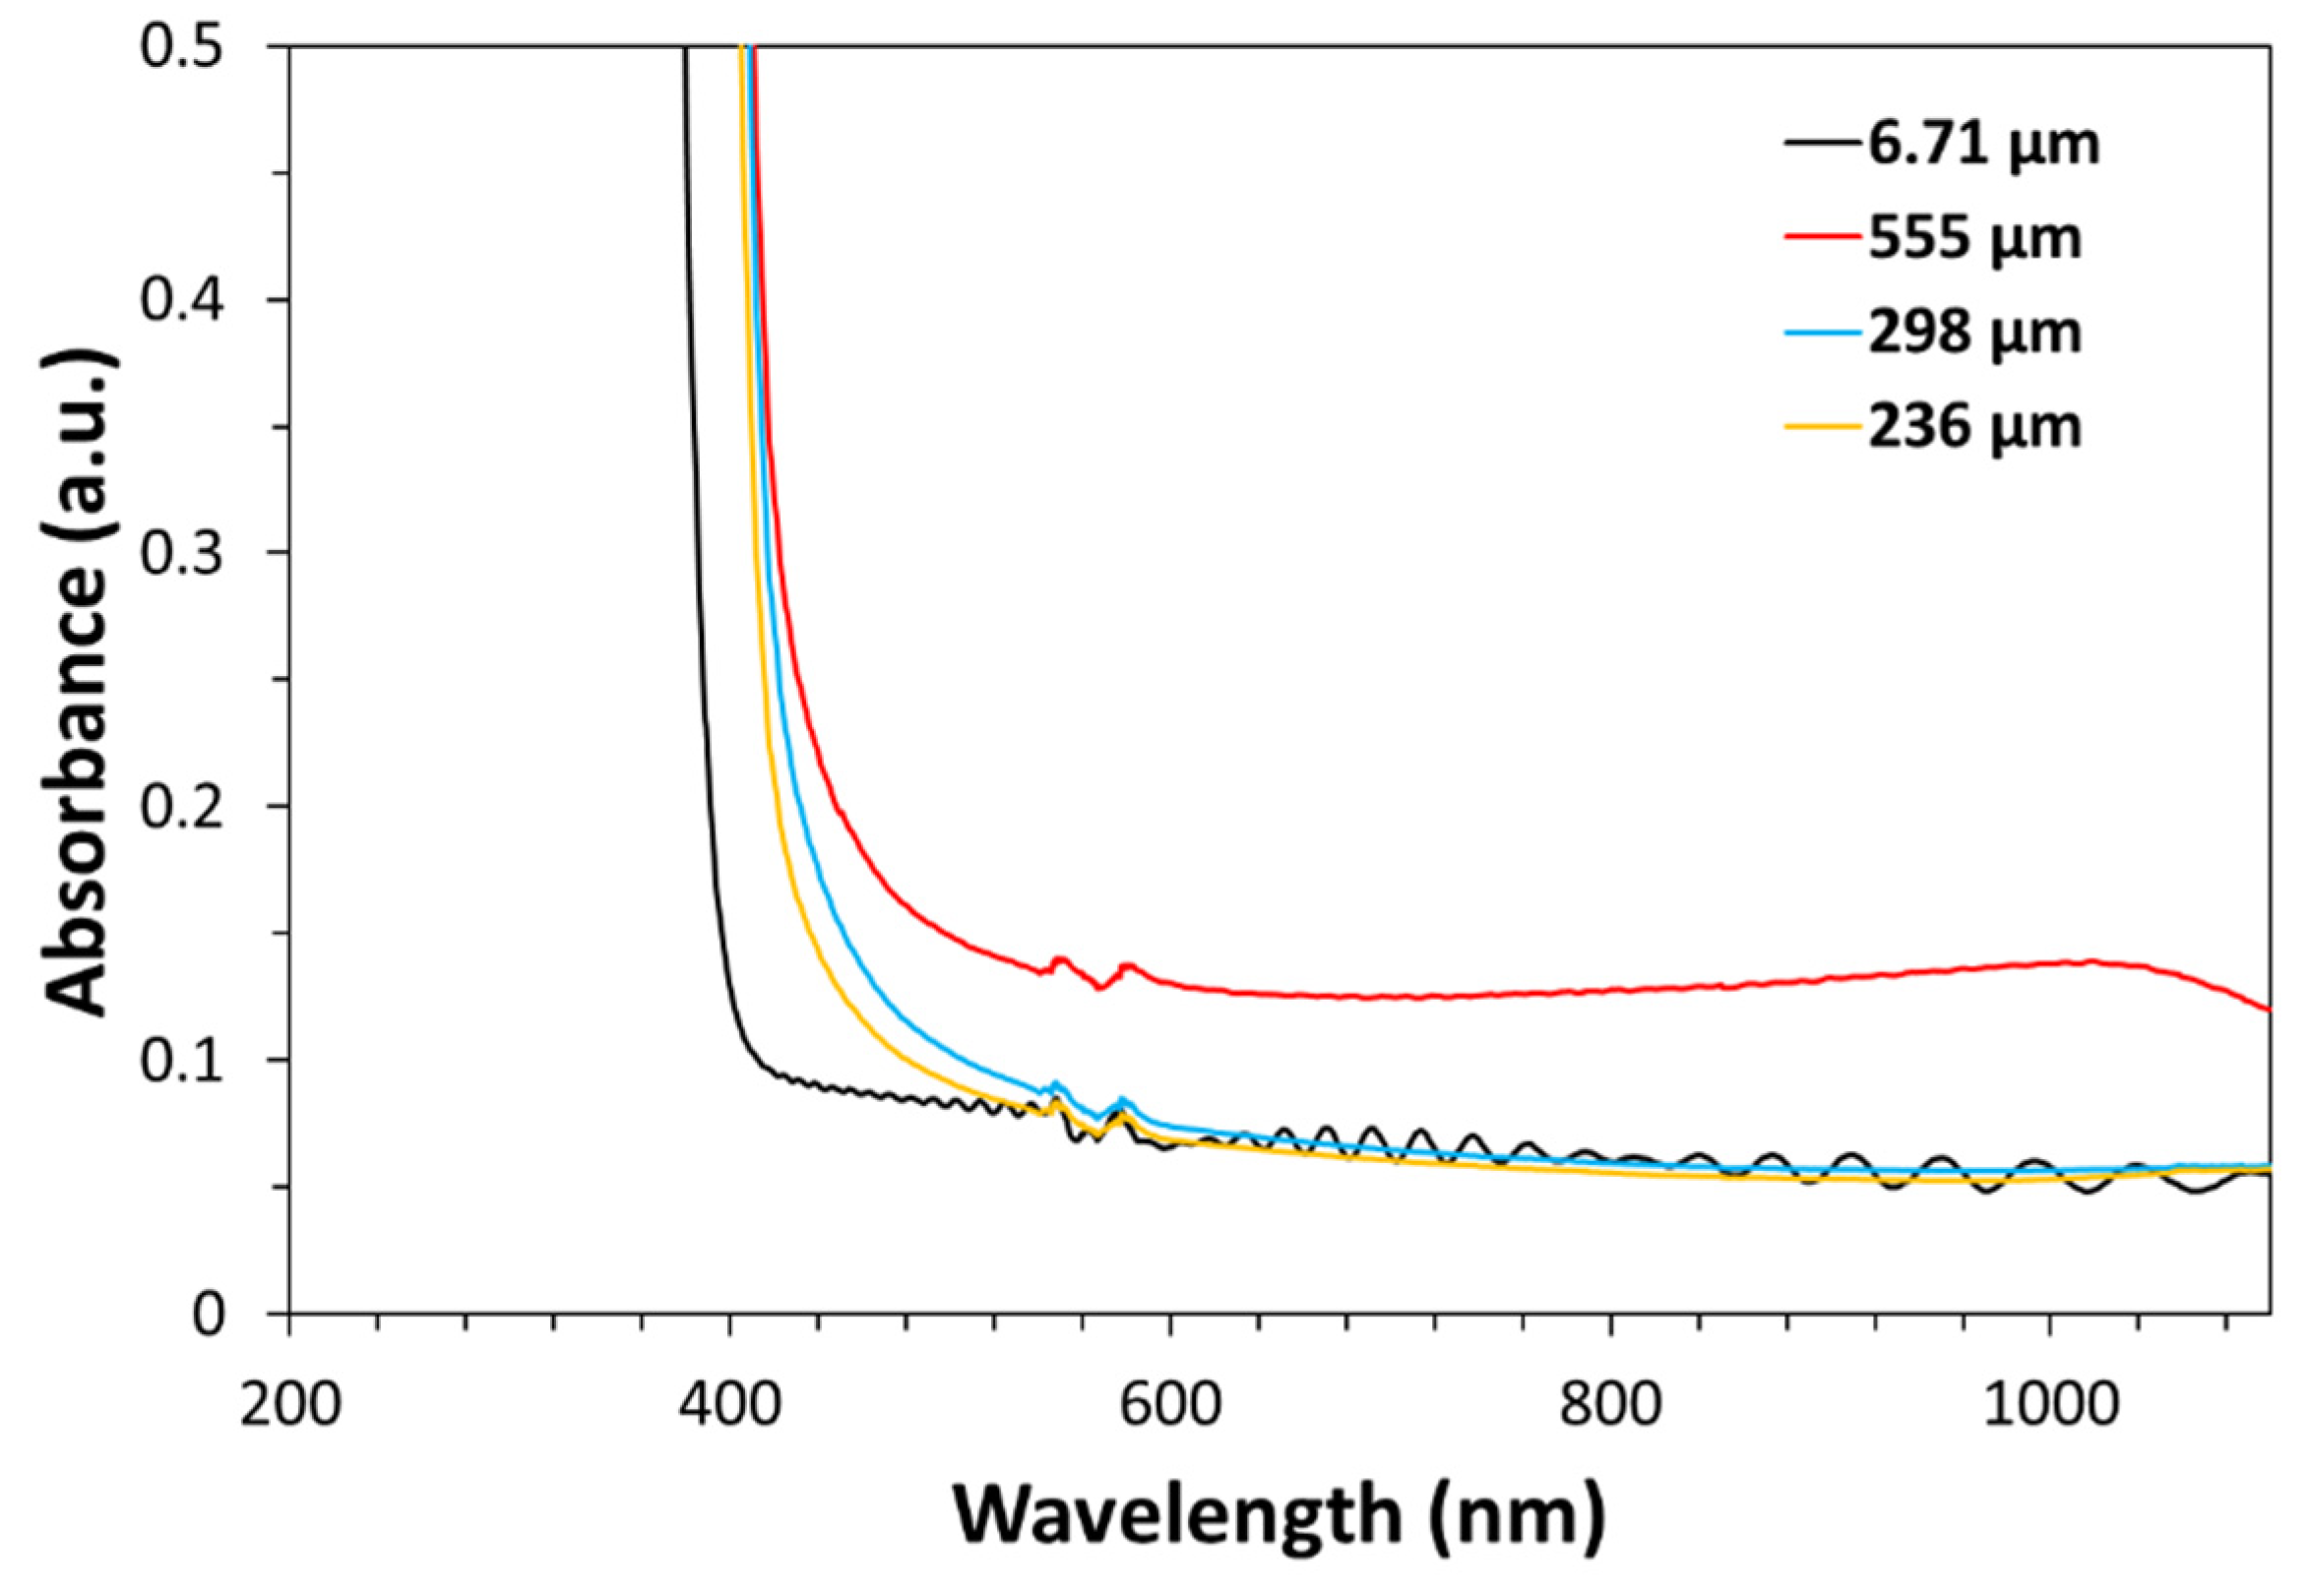
It should be noted that when the polymer film thickness becomes comparable with some characteristic length of the polymer, limitations in the conformational freedom may change the numerical value of the bandgap energy. Specifically, localized tail states reduce in the forbidden band and leads to an increase in the bandgap energy. This phenomenon is similar to the size-dependent bandgap energy widening observed in semiconductor nanoparticles (e.g., CdS, ZnS). As a consequence, the optical cut-on shifts to shorter wavelengths (higher photon energies), and other material properties may be affected, such as increased electrical resistivity, enhanced thermal insulation, better photostability, thermal stability and chemical inertness, etc. Under these conditions, UV-Vis spectroscopy can no longer reliably identify the polymer.
Figure 10.
Comparison of the optical cut-on positions for PEI films with different thicknesses.
4. Conclusions
The optical absorption coefficient of dielectric polymers quantifies how much light these synthesis materials absorb per unit distance. This important optical parameter allows analyzing band structure and structural disorder in dielectric polymers and provides many other important physical insights into these materials (e.g., cutoff wavelength, transparency %, spectral opacity range and profile, etc.). In particular, the behavior of absorption coefficient with photon energy, E=hν, allows measuring the optical bandgap energy, Eg, and the Urbach energy, EU, by using the Tauc method and Urbach plot, respectively. The behavior of the α(E) function can be obtained by combining interferometric measurements based on the analysis of spectral oscillations present in the high transparency region of the UV-Vis-NIR spectra with absorbance data contained in the area of fundamental absorption edge in the same spectra. This approach is quite general since spectral oscillations are of low intensity but can be always detected in the UV-Vis spectra of ultrathin films. Owing to a convenient refractive index value and high surface flatness/smoothness, ultrathin Mylar (PET) films have been selected as model polymeric material for this type of analysis and the changes in the optical bandgap and Urbach energy upon stretching have been investigated, finding a scarce dependence of these two parameters on the mechanical damage of films.
References
- Mohammed, H.A.; Mohammed, P.A.; Aziz, S.B. Investigation of optical band gap in PEO-based polymer composites diped with green-synthesized metal complexes using various models. RSC Adv. 2025, 15, 23319–23341. [Google Scholar] [CrossRef] [PubMed]
- Migahed, M.D.; Zidan, H.M. Influence of UV-irradiation on the structure and optical properties of polycarbonate films. Curr. Appl. Phys. 2006, 6, 91–96. [Google Scholar] [CrossRef]
- Chen, L.; Batra, R.; Ranganathan, R.; Sotzing, G.; Cao, Y.; Ramprasad, R. Electronic structure of polymer dielectrics: the role of chemical and morphological complexity. Chem. Mater. 2018, 30, 7699–7706. [Google Scholar] [CrossRef]
- Chen, L.; Huan, T.D.; Ramprasad, R. Electronic structure of polyethylene: role of chemical, morphological and interfacial complexity. Sci. Rep. 2017, 7, 6128. [Google Scholar] [CrossRef] [PubMed]
- Hoffmann, R. How chemistry and physics meet in the solid states. Angew. Chem. Int. Ed. Engl. 1987, 26, 846–878. [Google Scholar] [CrossRef]
- Zanatta, A.R. Revisiting the optical bandgap of semiconductors and the proposal of a unified methodology to its determination. Sci. Rep. 2019, 9, 11225. [Google Scholar] [CrossRef] [PubMed]
- Lamichhane. Absorption in narrow and wide gap materials. Heliyon 2023, 9, e21507. [Google Scholar] [CrossRef] [PubMed]
- Wada; Ramachari, D.; Yang, C.-S.; Pan, C.-L. Interrelationship among dielectric constant, energy band parameters and iconicity in multi-component oxide glasses revealed by optical- and THz-band spectroscopy. J. Non-Cryst. Solids 2021, 573, 121135. [Google Scholar] [CrossRef]
- Dahshan; Aly, K.A. Determination of the thickness and optical constants of amorphous Ge-Se-Bi thin films. Philos. Mag. 2009, 89, 1005–1016. [Google Scholar] [CrossRef]
- Swanepoel, R. Determination of the thickness and optical constant of amorphous silicon. J. Phys. E Sci. Instrum. 1983, 16, 1214–1222. [Google Scholar] [CrossRef]
- Zhang, X.; Qiu, J.; Li, X.; Zhao, J.; Liu, L. Complex refractive indices measurements of polymers in visible and near-infrared bands. Appl. Opt. 2020, 59, 2337–2344. [Google Scholar] [CrossRef] [PubMed]
- Hulbers, P.D.T.; Shah, D.O. Multispectral determination of soap film thickness. Langumir 1997, 13, 5995–5998. [Google Scholar] [CrossRef]
- Thompson, A.B.; Woods, D.W. Density of amorphous polyethylene terephthalate. Nature 1955, 176, 78–79. [Google Scholar] [CrossRef]
- Schade, U.; Ritter, E.; Bawagan, A.D.O.; Beckmann, J.; Aziz, E.F. Far-infrared absorption measurements on thin polymer films. In 2014 39th International Conference on Infrared Millimiter, and Terahertz waves (IRMMW-THz); IEEE, 2014. [Google Scholar] [CrossRef]
- Okutan, M. The effect of grinding on optical band gap and urbach energy of polypyrrole/graphene composites. Eskiseh. Tech. Univ. J. Sci. Technol. A-Appl. Sci. Eng. 2023, 24, 309–323. [Google Scholar] [CrossRef]
- Johnson, J.E. X-ray diffraction studies of the crystallinity in polyethylene terephthalate. J. Appl. Sci. 1959, 2, 205–209. [Google Scholar] [CrossRef]
- Viora, L.; Combeau, M.; Pucci, M.F.; Perrin, D.; Liotier, P.-J.; Bouvard, J.-L.; Combeaud, C. A comparative study on crystallization for virgin and recycled polyethylene terephthalate (PET), multiscala effects on physico-mechanical properties. Polymers 2023, 15, 4613. [Google Scholar] [CrossRef] [PubMed]
- Bandla, S.; Allahkarami, M.; Hanan, J.C. Out-of-plane orientation and crystallinity of biaxially stretched polyethylene terephthalate. Powder Diffr. 2014, 29, 123–126. [Google Scholar] [CrossRef]
- Carotenuto, G. Study of the Kapton-H fundamental absorption edge and tailing behavior. Eng. Proc. 2025, 105, 7. [Google Scholar] [CrossRef]
- Musiatowicz, M.; Turek, M.; Drozdziel, A.; Pyszniak, K.; Grudzinski, W. Modification of optical, electronic and microstructural properties of PET by 150 keV Cs+ irradiation. Adv. Sci. Technol. Res. J. 2022, 16, 11–19. [Google Scholar] [CrossRef] [PubMed]
- Sadoh; Hossain, S.; Fereira, S.; Ravindra, N.M. Optical properties of low-refractive index polymers. Mater. Sci. Eng. 2022, 6, 68–76. [Google Scholar] [CrossRef]
Figure 1.
SEM micrographs of ultrathin PET film showing cross-section (a) and surface (b).
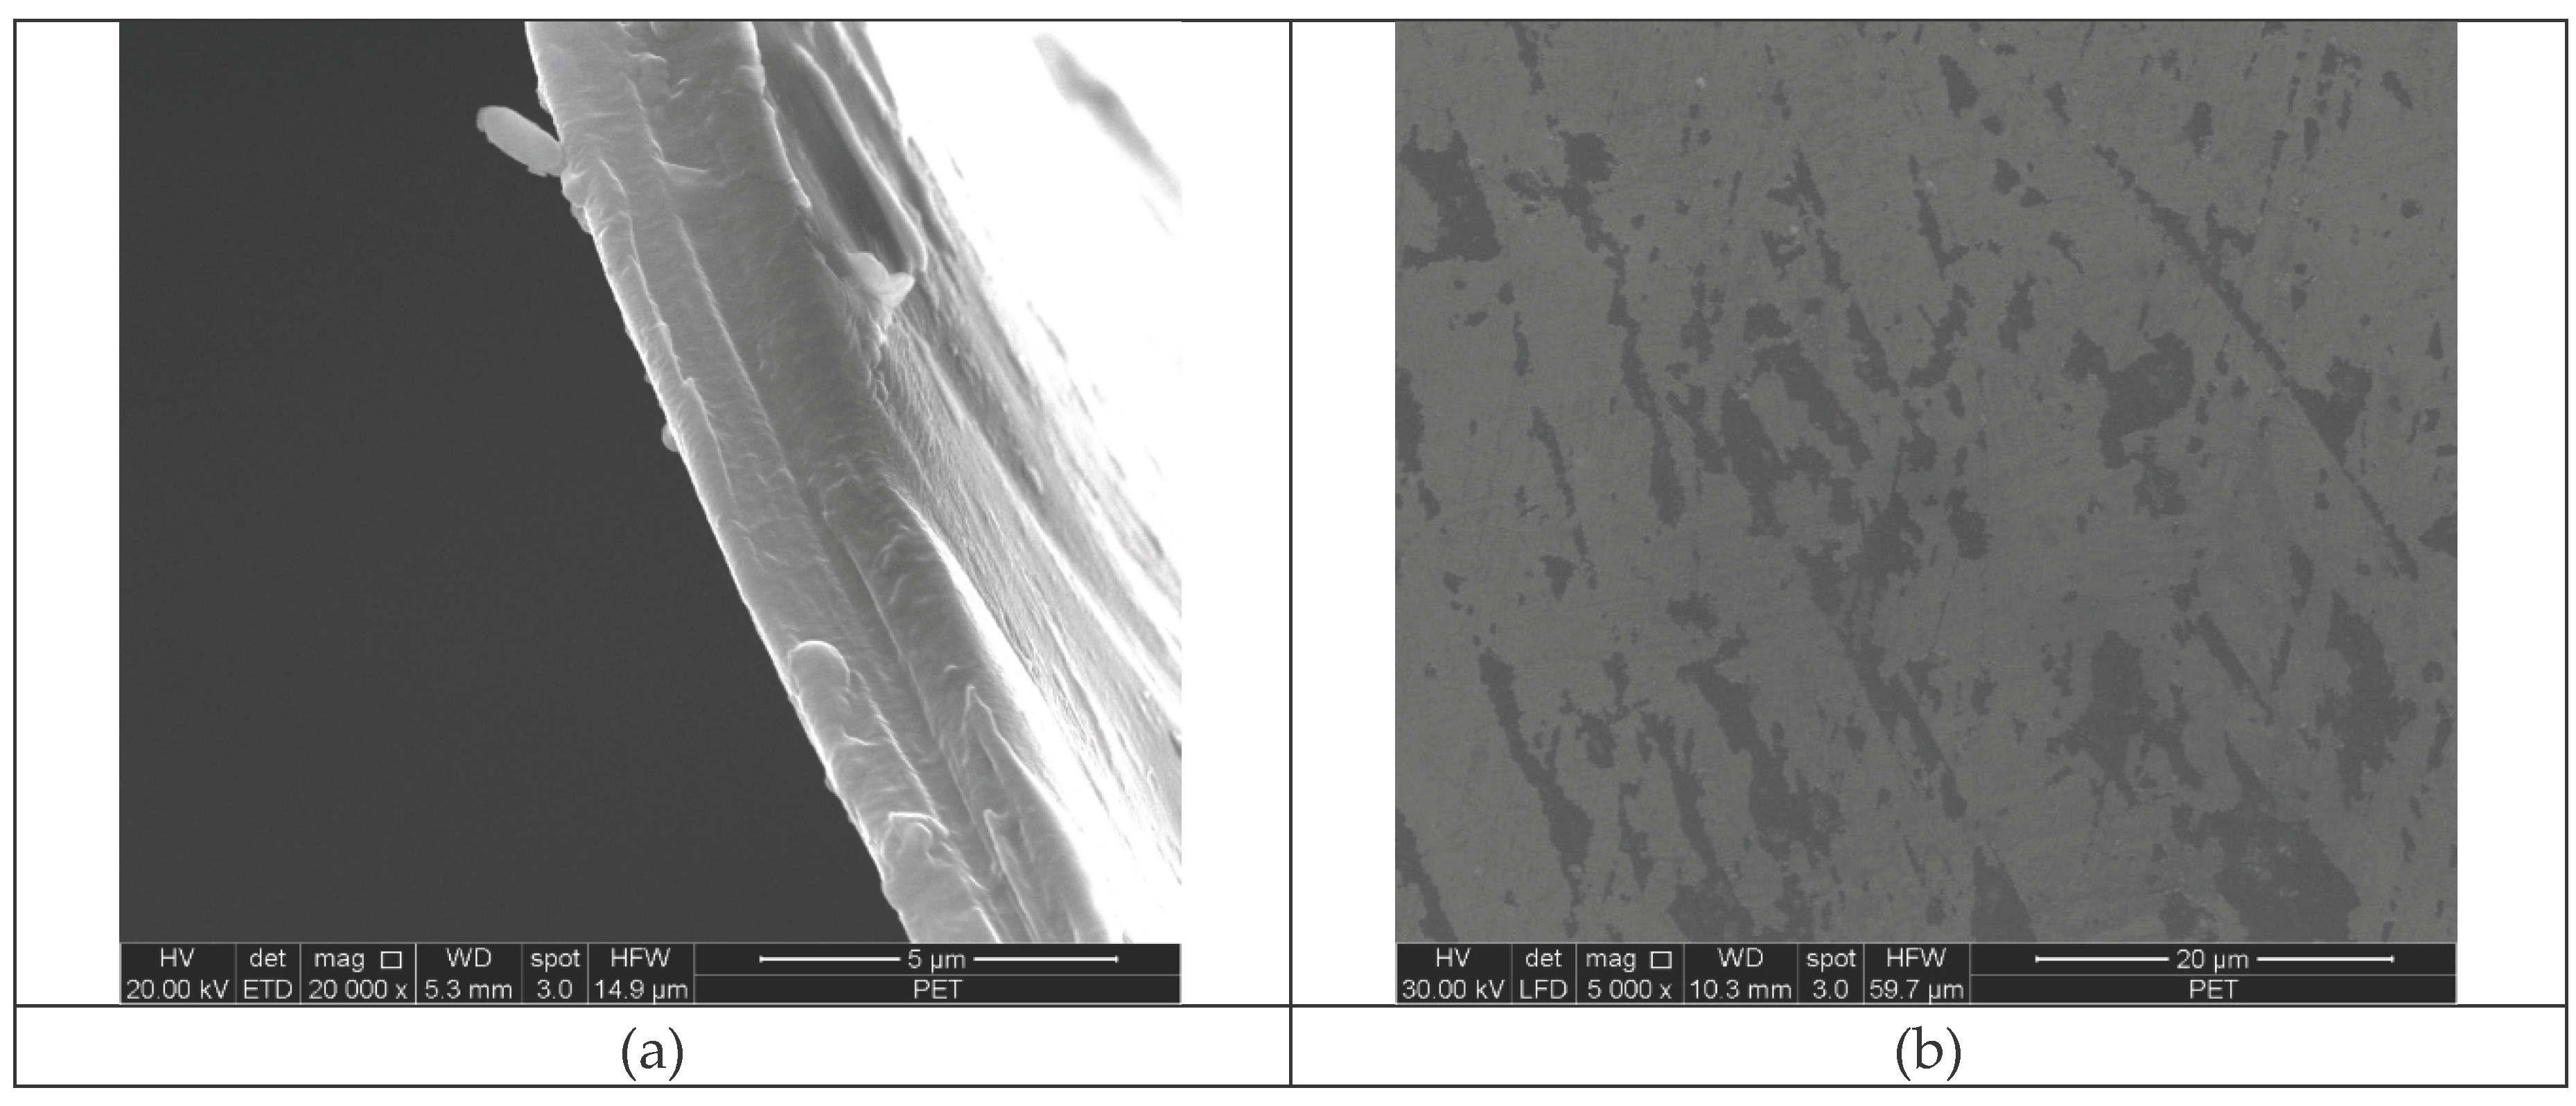
Figure 2.
Optical spectrum of PET thin film expressed as absorbance (a) and in comparison with transmittance (b).
Figure 2.
Optical spectrum of PET thin film expressed as absorbance (a) and in comparison with transmittance (b).
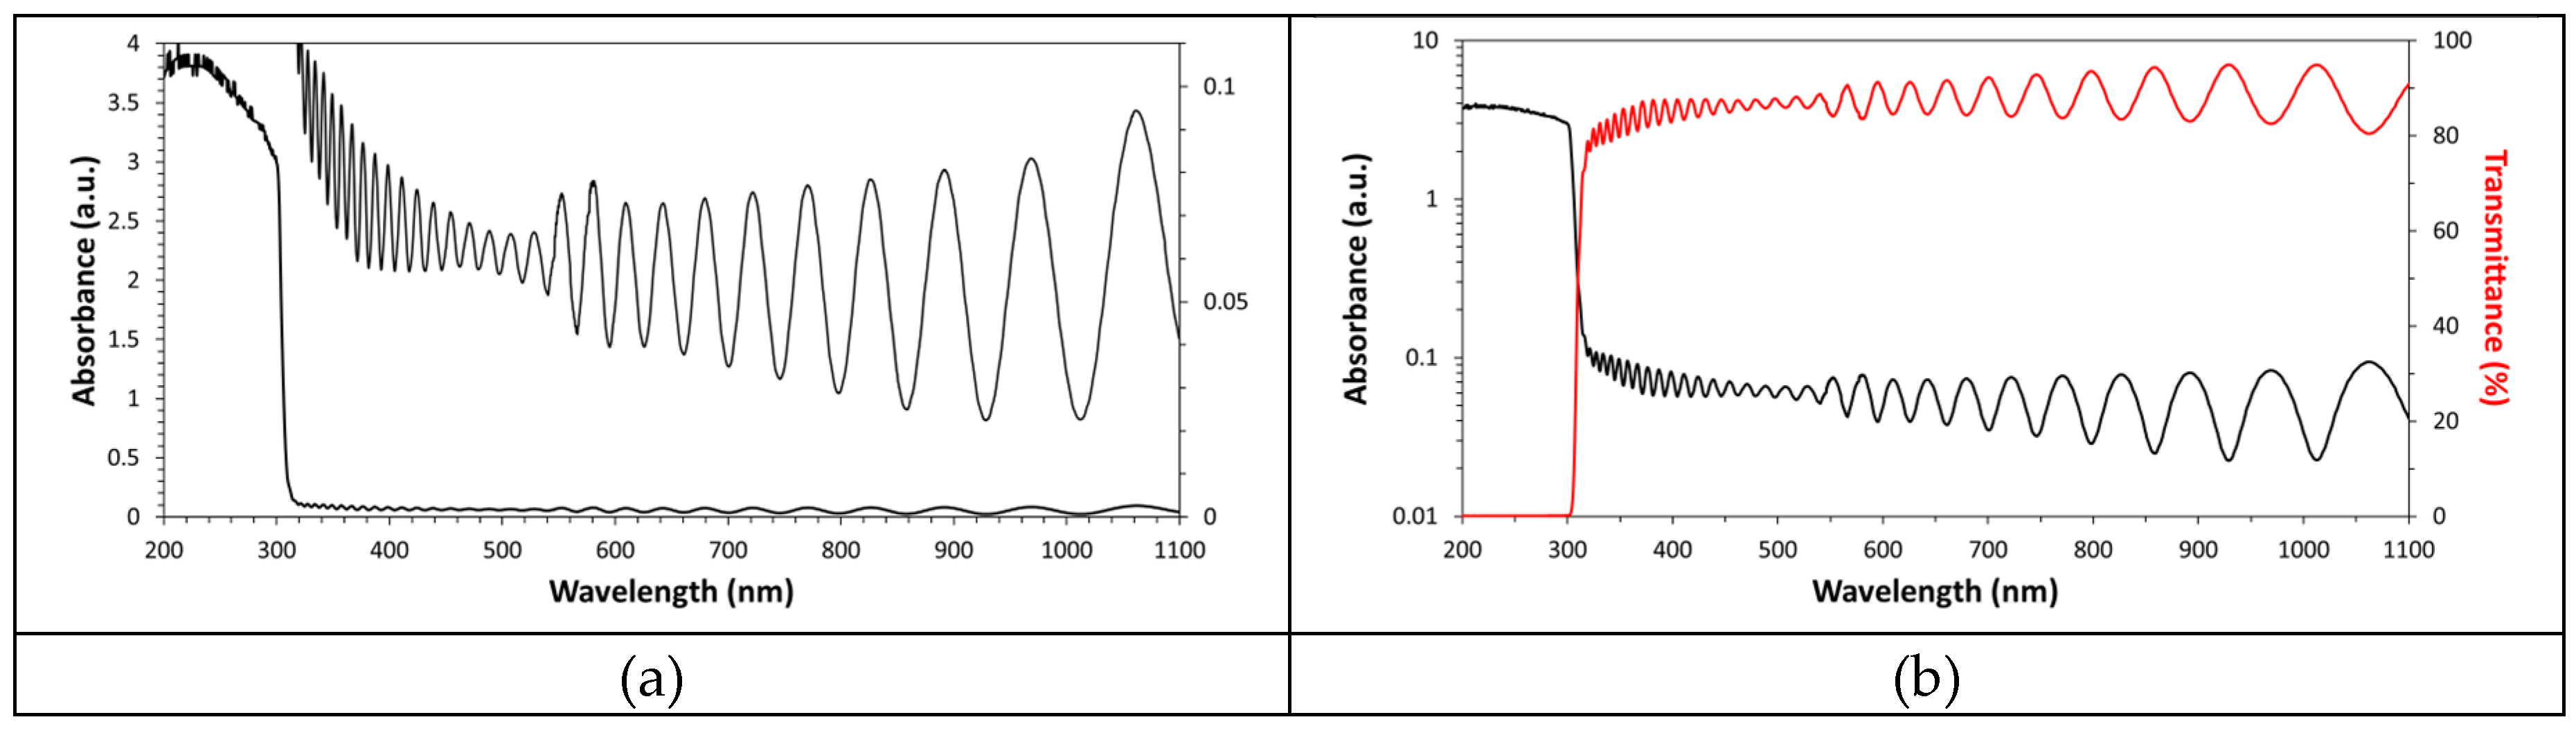
Figure 3.
FT-IR (a) and ATR (b)spectra of PET ultrathin film.
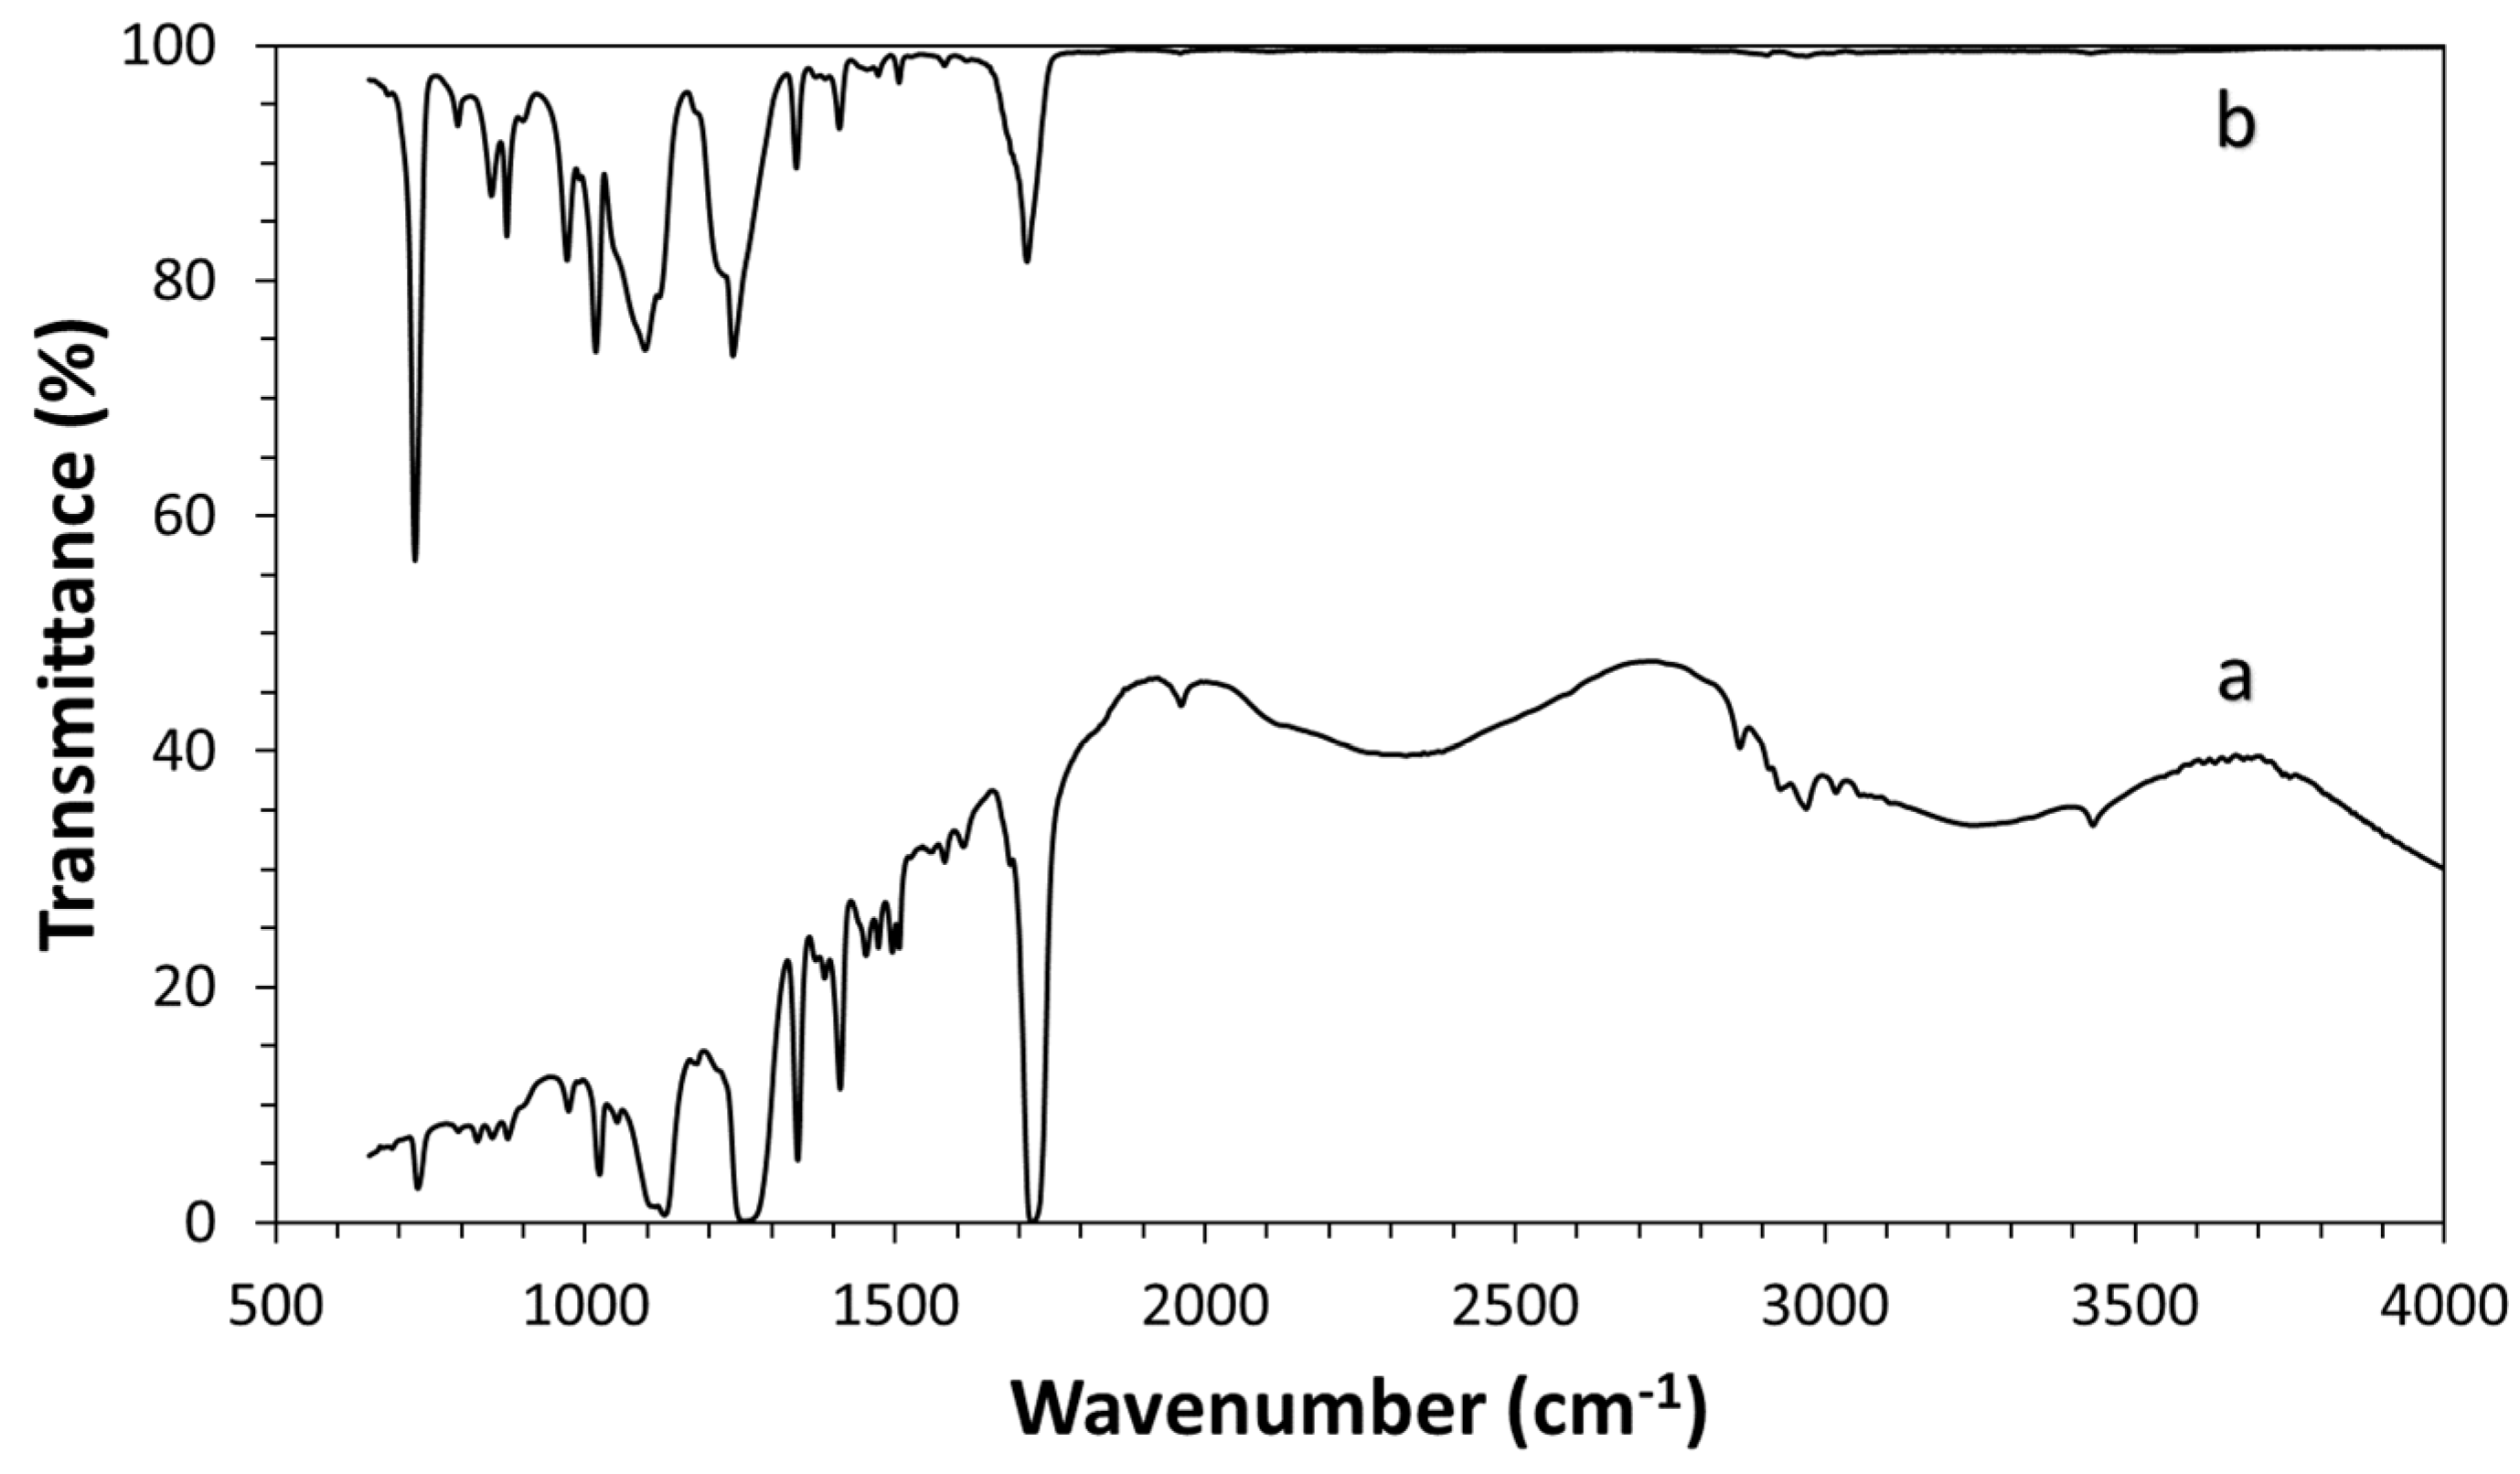
Figure 4.
PET ultrathin film Urbach plot (a) and best fitting of the linear portion of curve (b).
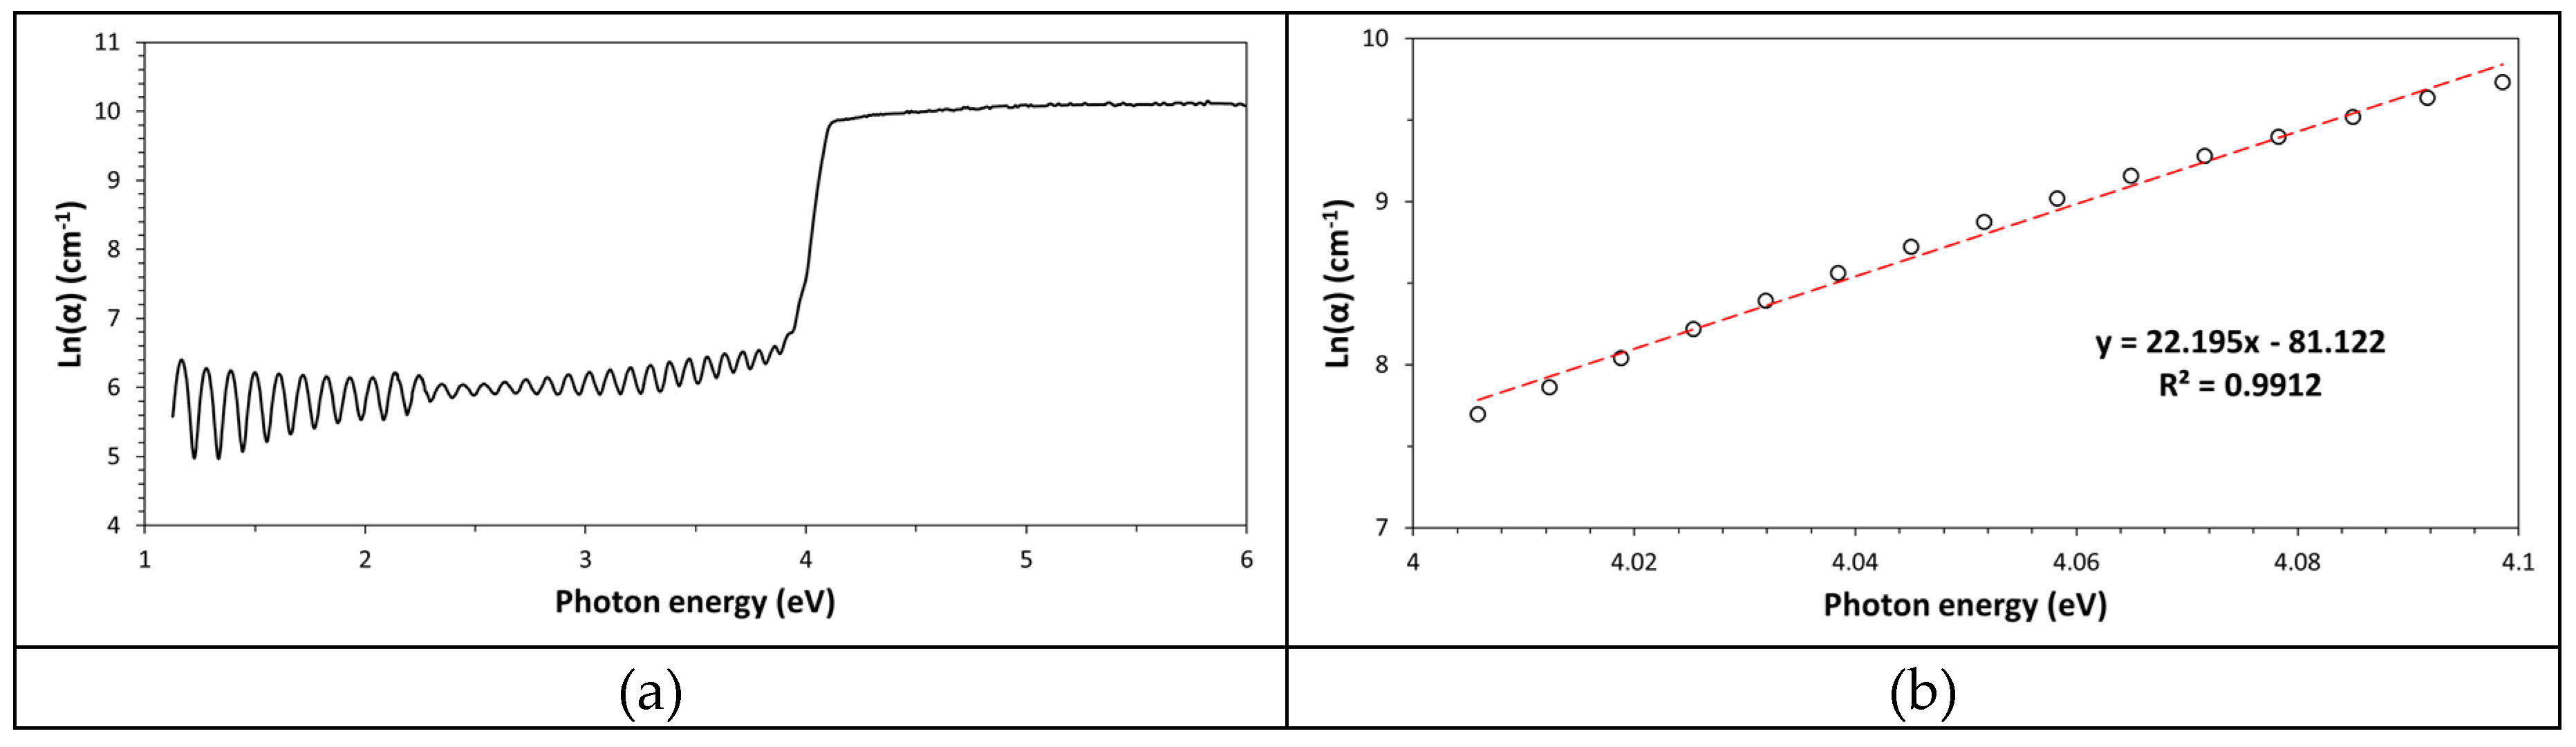
Figure 5.
XRD diffractogram (a) and DSC thermogram (b) of the ultrathin PET film.
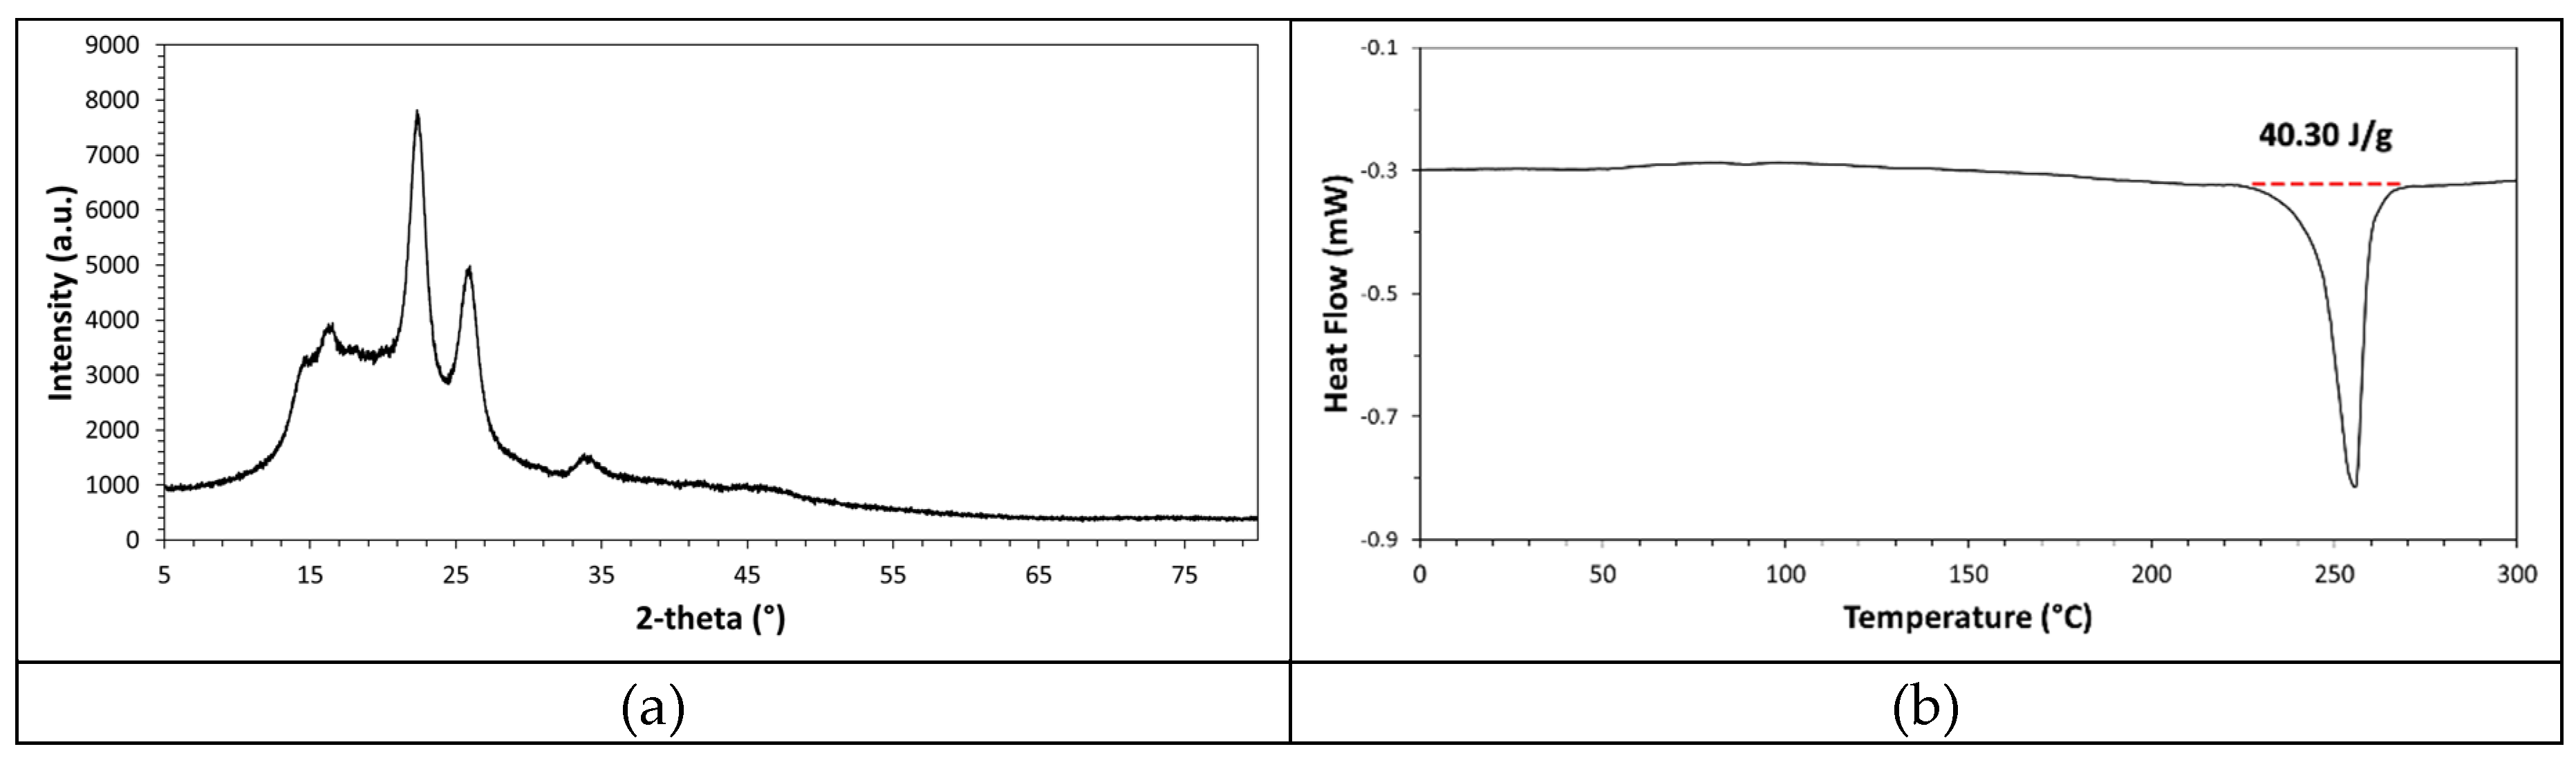
Figure 6.
Urbach plot (a) and Urbach energy evaluation by linear regression analysis (b) for uniaxially stretched ultrathin PET film.
Figure 6.
Urbach plot (a) and Urbach energy evaluation by linear regression analysis (b) for uniaxially stretched ultrathin PET film.
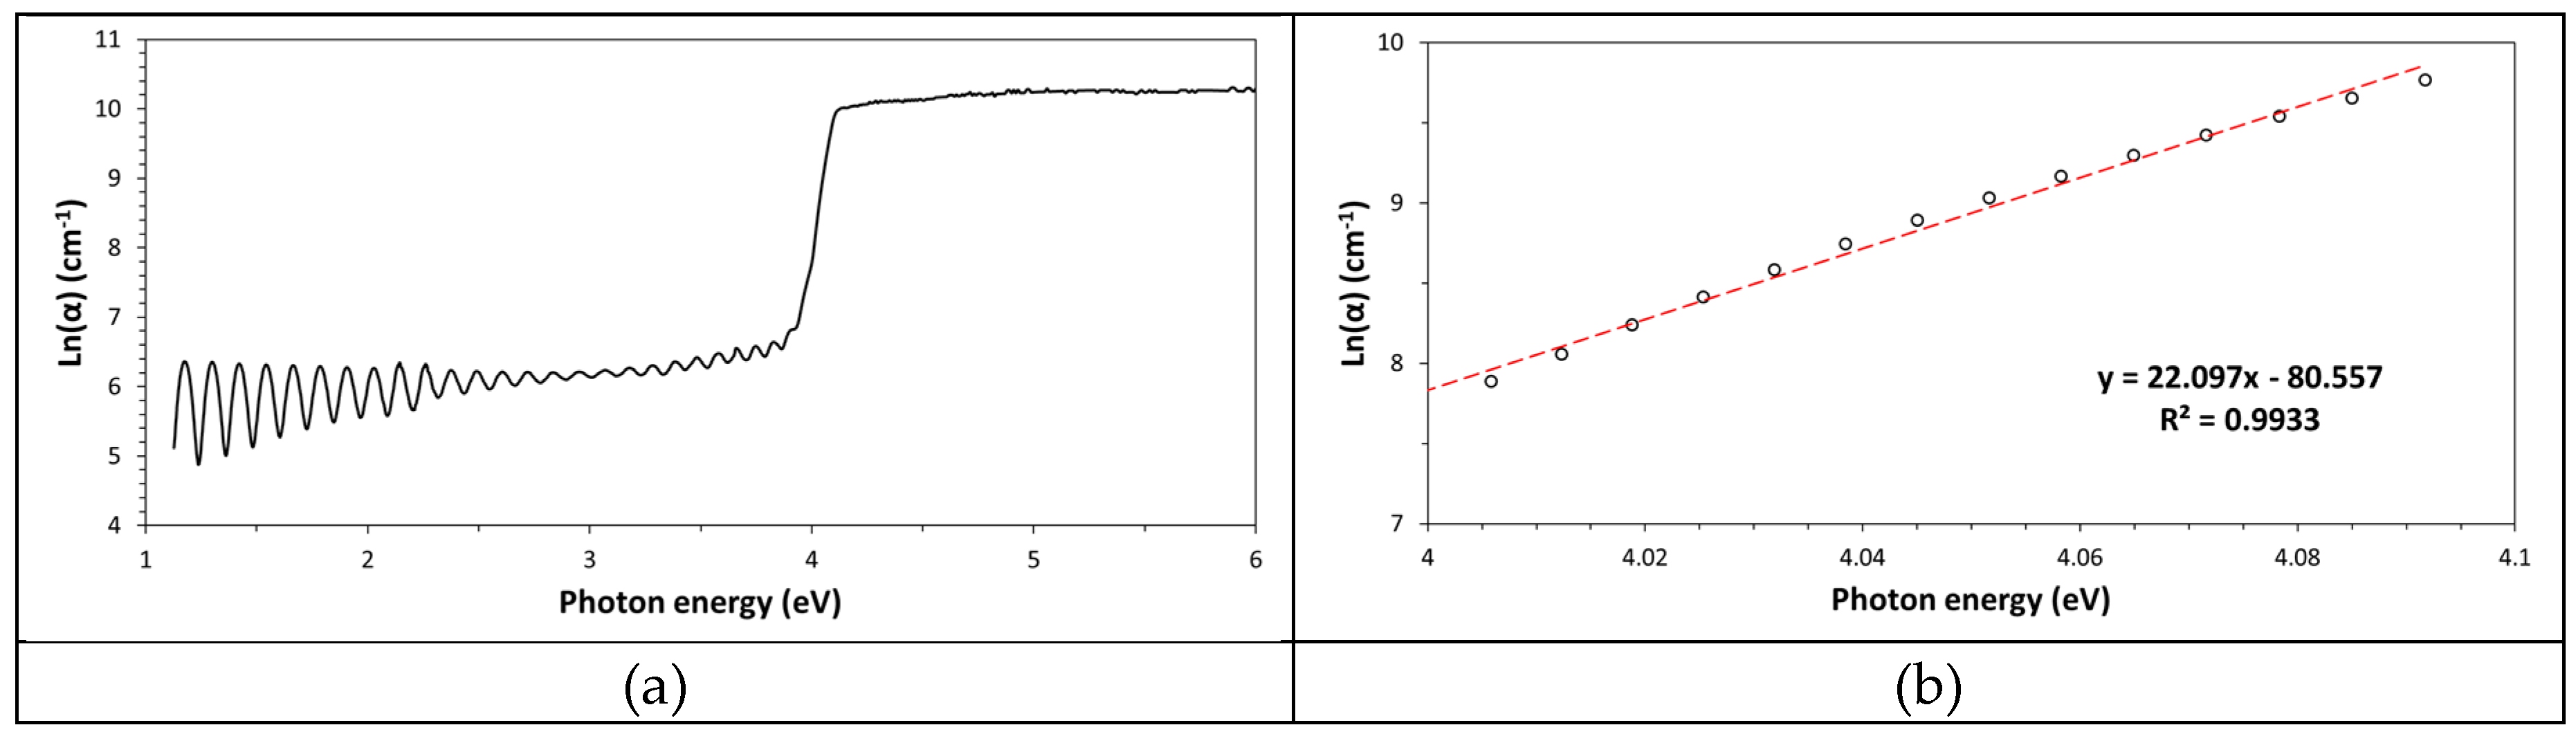
Figure 7.
PET ultrathin film Tauc plot (a) and best fitting of the linear section of the curve (b).
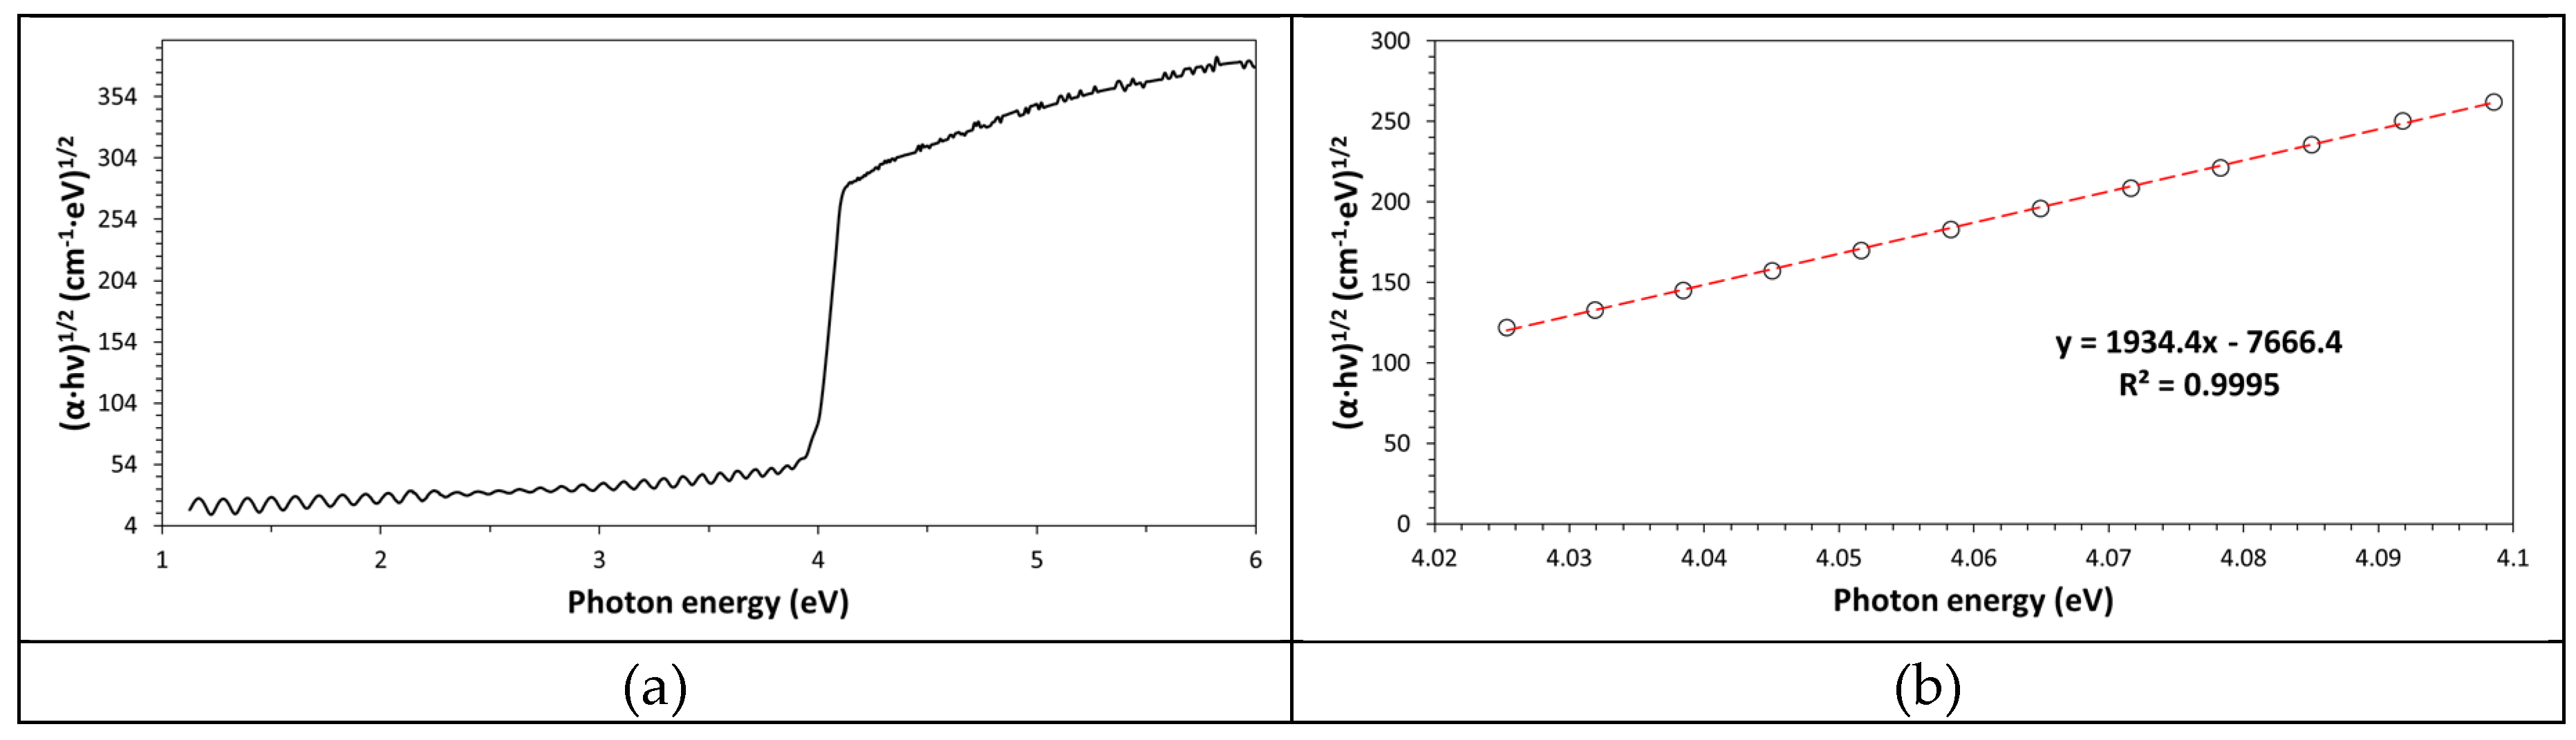
Figure 8.
Tauc plot (a) and bandgap energy estimation by linear regression analysis (b) for a stretched ultrathin PET film.
Figure 8.
Tauc plot (a) and bandgap energy estimation by linear regression analysis (b) for a stretched ultrathin PET film.
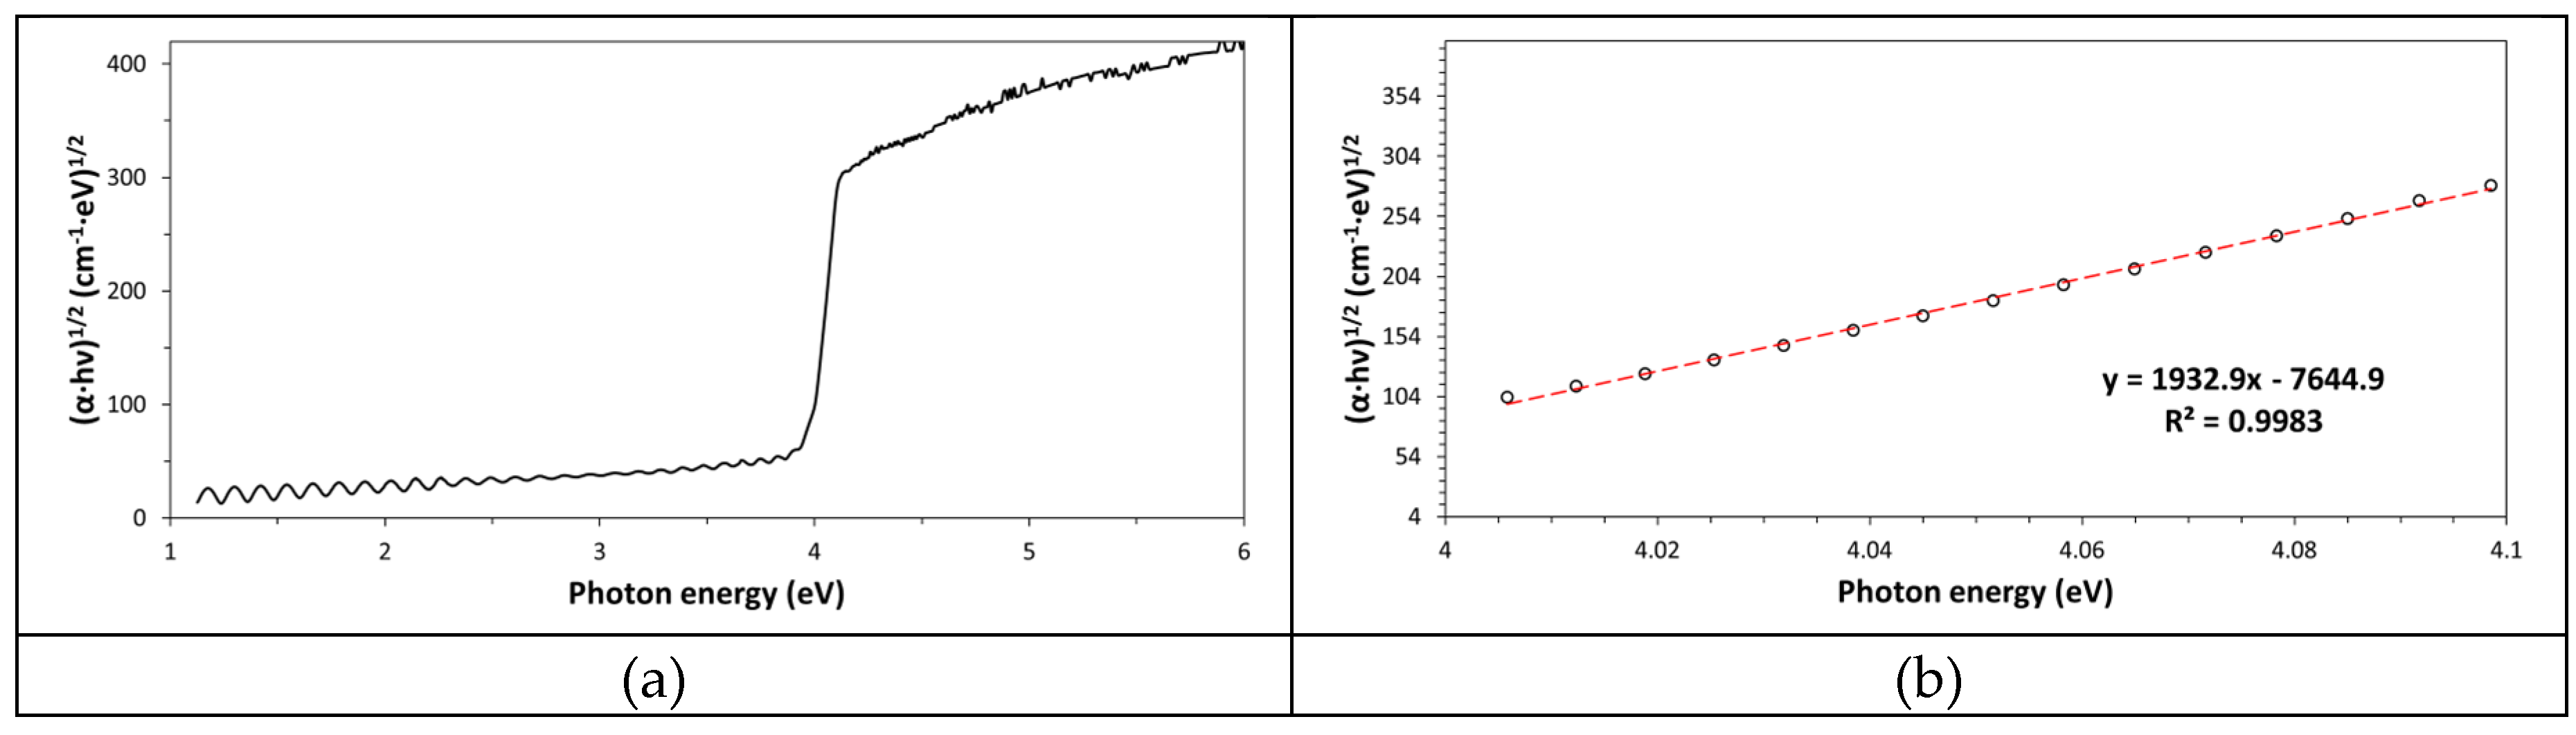
Figure 9.
Optical spectra of different polymeric films: poly(methyl methacrylate) (PMMA), polystyrene (PS), poly(vinyl pyrrolidone) (PVP), polyetherimide (PEI), polyethylene (PE), poly(lactic acid) (PLA), ethylene tetrafluoroethylene (ETFE), and Kapton-H.
Figure 9.
Optical spectra of different polymeric films: poly(methyl methacrylate) (PMMA), polystyrene (PS), poly(vinyl pyrrolidone) (PVP), polyetherimide (PEI), polyethylene (PE), poly(lactic acid) (PLA), ethylene tetrafluoroethylene (ETFE), and Kapton-H.
Disclaimer/Publisher’s Note: The statements, opinions and data contained in all publications are solely those of the individual author(s) and contributor(s) and not of MDPI and/or the editor(s). MDPI and/or the editor(s) disclaim responsibility for any injury to people or property resulting from any ideas, methods, instructions or products referred to in the content. |
© 2026 by the authors. Licensee MDPI, Basel, Switzerland. This article is an open access article distributed under the terms and conditions of the Creative Commons Attribution (CC BY) license (http://creativecommons.org/licenses/by/4.0/).
Copyright: This open access article is published under a Creative Commons CC BY 4.0 license, which permit the free download, distribution, and reuse, provided that the author and preprint are cited in any reuse.


