Submitted:
12 April 2026
Posted:
14 April 2026
You are already at the latest version
Abstract
The aim of the study is to determine physico-chemical parameters and eutrophication criteria in the Aegean Sea. The pH, temperature, salinity, dissolved oxygen, turbidity, conductivity, phosphate, ammonium nitrogen, nitrite nitrogen, nitrate nitrogen and chlorophyll-a parameters were determined. The sampling was conducted at 25 stations (Enez, Saros Bay, Gökçeada, Yeniköy, Bozcaada, Babakale, Altınoluk, Ayvalık, Dikili, Çandarlı, Foça, Bostanlı, Urla, Ildır, Çeşme, Sığacık, Kuşadası, Didim, Güllük, Bodrum, Akyaka, Gökova, Datça, Bozburun 1, Bozburun 2) during the spring-summer-autumn seasons of 2022 and 2023. In the Aegean Sea, the mean values were determined as follows: pH 8.05, temperature 21.80 °C, dissolved oxygen 7.86 mg/L, salinity 34.13‰, turbidity 25.15 mg/L, electrical conductivity 50.27 µS/cm, phosphate 9.39 µg/L, ammonium nitrogen 29.59 µg/L, nitrite nitrogen 0.5 µg/L, nitrate nitrogen 1.9 µg/L, and chlorophyll-a 1.76 µg/L.
Keywords:
Aegean Coasts
; ammonium nitrogen
; chlorophyll-a
; eutrophication
; nitrate nitrogen
; nitrite nitrogen
; phosphate
; physico-chemical parameters
; pollution
; water quality
1. Introduction
The Aegean Sea, contains numerous islands and peninsulas of varying sizes. It is characterized by a highly dynamic coastal morphology. This irregular coastal structure has led to the formation of small basins and straits. In this context, the seabed topography is highly complex. The Aegean Sea is connected to the Levant Denizi and the İyon Denizi to the south. To the north, it is connected to the Marmara Sea and the Black Sea via the Dardanelles Strait [1]. Water masses in the Aegean Sea consist of the mixing of Black Sea and Levantine waters, as well as locally formed water masses resulting from atmospheric heating and cooling processes. Riverine inputs also contribute to the Aegean Sea water mass composition [2].
In the Aegean Sea, temperature data analyses based on satellite observations were conducted between 1985 and 2008 [3]. In the study carried out by Gönülal, surface water temperature data from the Northern Aegean Sea were evaluated over a 46-year period between 1972 and 2018 [4]. With the increase in sea water temperature in the Aegean Sea, the introduction of new non-indigenous species has also increased. Interannual variations in the introduction of non-indigenous species exhibit a pattern parallel to the rise in water temperature [5].
In the Aegean Sea, pollution monitoring studies were conducted between 2014 and 2022, during which eutrophication parameters (orthophosphate, nitrite + nitrate nitrogen, chlorophyll-a, and dissolved oxygen) were measured [6].
Due to its highly indented and irregular coastline, the Aegean Region has the longest coastal shoreline in Türkiye. Consequently, tourism has developed extensively in this region. As it is also one of the most economically developed regions of the country, the coasts of the Aegean Sea have been increasingly affected by pollution events in recent years. This is primarily attributable to terrestrial pressures arising from population growth, intensive agricultural activities, and industrial development [7]. Increasing tourism, industrial activities, and wastewater discharges along the coasts of the Aegean Sea have significantly affected coastal water quality. Because the coastal morphology of the Aegean Sea consists of numerous enclosed and semi-enclosed bays, longer water residence times in these areas accelerate environmental degradation. While diffuse pollution predominates in the Northern Aegean, industrial pressures and higher population density are more pronounced in the Central Aegean. One of the major problems associated with tourism is the fluctuation in population, which adversely affects the performance of wastewater treatment plants. Accordingly, the gulfs of Izmir, Gulluk and Aliaga exhibit high concentrations of nutrients and chlorophyll-a, and a deterioration in water quality has been observed in these areas. A similar situation applies to river mouths where nutrient inputs are high [8].
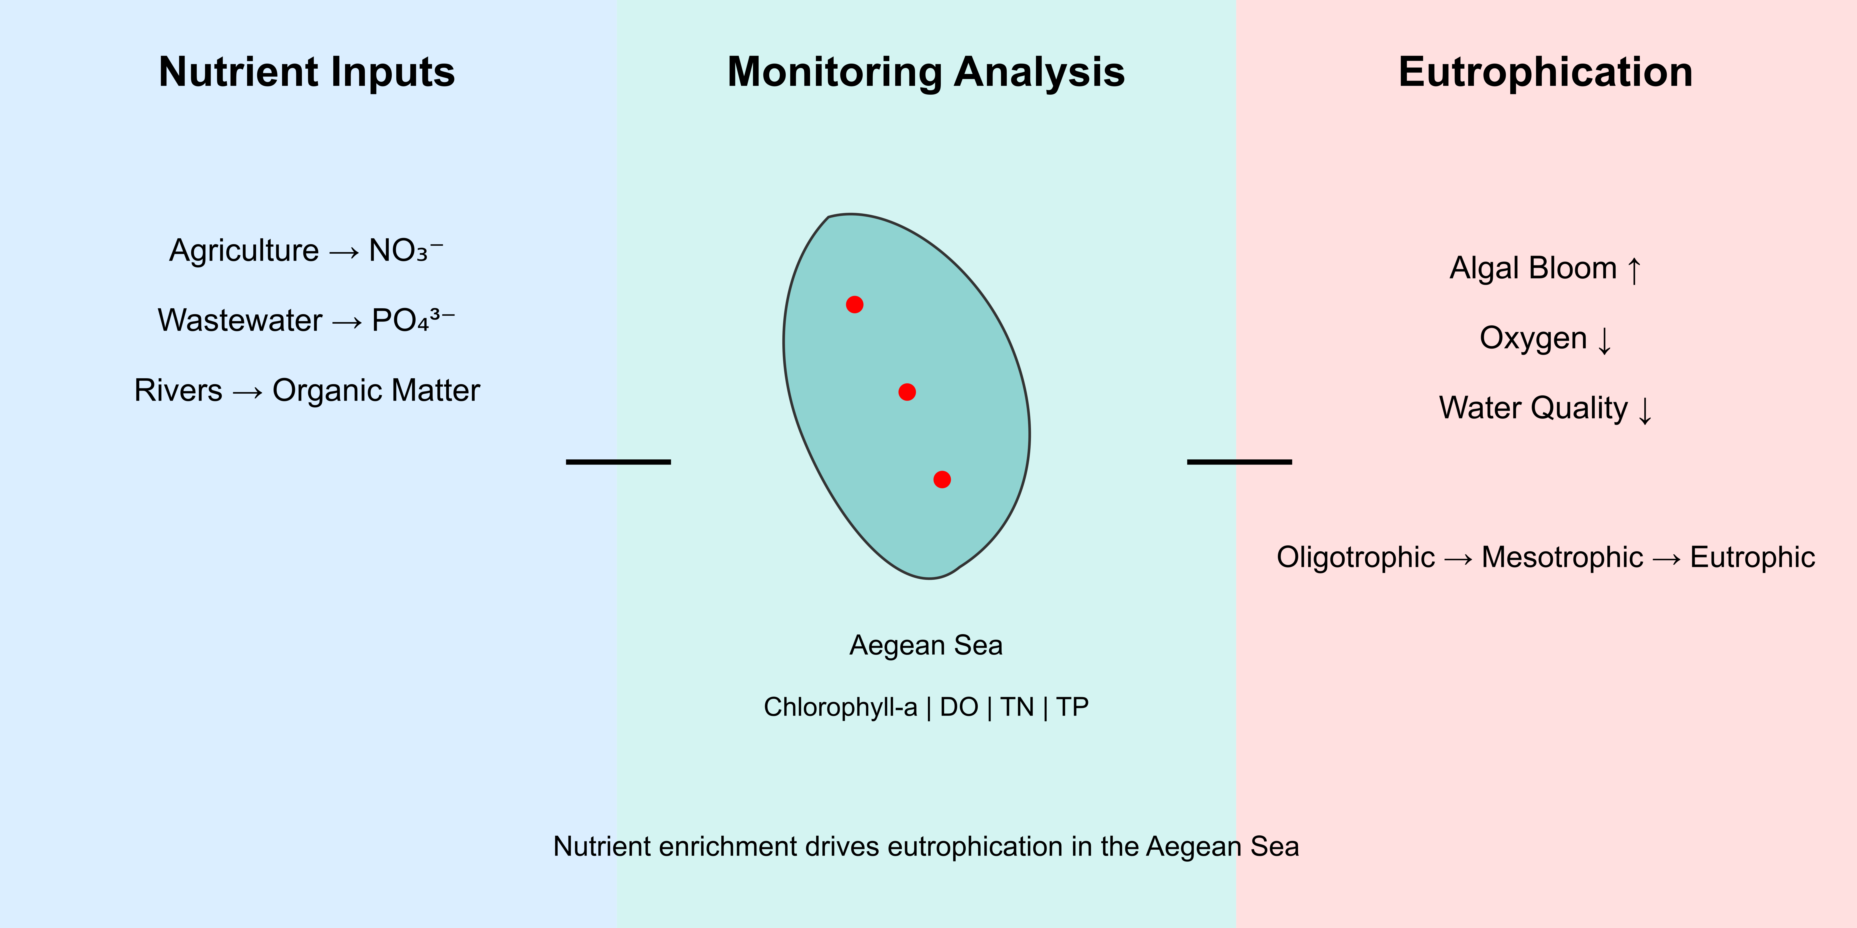
In the Aegean Sea, pollution has reached critical levels due to intensive agricultural practices, as well as domestic and industrial discharges. This pollution pressure leads to the accumulation of nutrients such as phosphate, nitrite, nitrate, and ammonium in the water column, thereby triggering eutrophication processes. As nutrient concentrations increase, chlorophyll-a levels also rise, promoting phytoplankton proliferation and consequently leading to a further deterioration of water quality.
Eutrophication is defined as the suite of adverse physical, biochemical, and ecological changes resulting from the enrichment of coastal and marine ecosystems with nutrients—particularly nitrogen and phosphorus—originating from terrestrial sources (rivers, floods, discharges) and atmospheric deposition (via precipitation). This enrichment leads to excessive organic matter production and accumulation. The most pronounced negative impacts of eutrophication on coastal ecosystems include reduced water transparency, increased primary production, a marked decline in the species distribution of aquatic vegetation, disruption of ecological balance among organisms, oxygen depletion in bottom waters, alterations in N/P/Si ratios, and, ultimately, significant changes in the structure and functioning of the food web [9].
Eutrophication assessments in aquatic environments are conducted through the systematic monitoring of pressure–state–impact (PSI) processes. Pressures are evaluated as inputs of nutrients and organic matter originating from human activities, which are transported from terrestrial sources to the marine environment via rivers, drainage basins, and point-source discharges, as well as through atmospheric pathways (precipitation) [10].
Eutrophication is a process that occurs in water bodies of lakes, estuaries, reservoirs, coastal areas, slow-moving rivers, or nutrient-rich seas such as the Baltic Sea, triggering excessive growth and proliferation of plankton. Eutrophication represents an environmental problem in coastal areas, affecting species distribution and the functioning of the ecosystem [11].
The aim of this study was to determine the water quality parameters and eutrophic structure of the Aegean Sea coasts.
<2. Materials and Methods
The physico-chemical parameters of the Aegean Sea coasts—including pH, temperature, dissolved oxygen, salinity, turbidity, and electrical conductivity—were measured using a Water Quality Meter. Concentrations of phosphate, ammonium nitrogen, nitrite nitrogen, nitrate nitrogen, and chlorophyll-a were determined following standard analytical methods [12].
For statistical evaluation, the GraphPad Prism software for Windows was utilized. Differences among sampling stations were assessed using one-way analysis of variance (ANOVA), and the Tukey test was applied to identify which groups showed statistically significant differences.
The sampling and analyses were conducted at 25 stations (Enez, Saros Bay, Gökçeada, Yeniköy, Bozcaada, Babakale, Altınoluk, Ayvalık, Dikili, Çandarlı, Foça, Bostanlı, Urla, Ildır, Çeşme, Sığacık, Kuşadası, Didim, Güllük, Bodrum, Akyaka, Gökova, Datça, Bozburun 1, Bozburun 2), during the spring, summer and autumn seasons of 2022 and 2023. The coordinates of the sampling stations are presented in Table 1.
Figure 1.
Stations.

3. Results and Discussion
The seasonal average concentrations at the 25 sampling stations were determined as follows: pH 8.21, temperature 21.8 °C, dissolved oxygen 7.86 mg/L, salinity 34.13 ‰, turbidity 25.15 mg/L, electrical conductivity 50.27 µS/cm, phosphate 9.39 µg/L, ammonium 29.59 µg/L, nitrite 0.5 µg/L, nitrate 1.9 µg/L, and chlorophyll-a 1.76 µg/L.
The mean values of pH, temperature, dissolved oxygen, salinity, turbidity, electrical conductivity, phosphate, ammonium nitrogen, nitrite nitrogen, nitrate nitrogen, and chlorophyll-a for these samples are presented in Table 2.
The variations in pH, temperature, dissolved oxygen, salinity, turbidity, electrical conductivity, phosphate, ammonium nitrogen, nitrite nitrogen, nitrate nitrogen, and chlorophyll-a are illustrated in Figure 2, Figure 3, Figure 4, Figure 5, Figure 6, Figure 7, Figure 8, Figure 9, Figure 10, Figure 11 and Figure 12.
When the pH value (8.21) was compared with the “General Quality Criteria for Seawater” and the “Standard Values that Coastal and Marine Waters Used for Recreational Purposes Must Meet,” it was found to comply with the criterion range of 6–9 [13].
When the average values obtained for the Aegean Sea were compared with the “Coastal Waters Receiving Environment Quality Criteria in Terms of General and Physicochemical Parameters” specified in the Surface Water Quality Regulation [14], the Aegean Sea was found to be classified as Class I (very good) water for dissolved oxygen and nitrite + nitrate parameters, and Class III (medium) water for phosphate (Table 3).
When the total phosphorus, nitrite+nitrate, and chlorophyll-a concentrations were compared with the “Trophic Levels of Surface Water Bodies: Aegean Coastal Waters Eutrophication Criteria” [14] in the same regulation, the trophic status of the Aegean Sea was determined to be eutrophic according to total phosphorus and chlorophyll-a values, while it was classified as oligotrophic based on nitrite+nitrate concentrations (Table 4).
When the phosphate concentrations of all stations were evaluated, it was determined that the stations generally exhibited a eutrophic character, whereas the Bostanlı station displayed a hypertrophic character. Ammonium, nitrite, nitrate, and chlorophyll-a concentrations at the Bostanlı station were higher than those measured at the other stations.
According to the results of the one-way analysis of variance (ANOVA), the differences in ammonium nitrogen, nitrite nitrogen, nitrate nitrogen, and chlorophyll-a concentrations among the stations were found to be statistically significant (p < 0.05) (Table 5).
Tukey test was performed to determine the statistically significant differences among stations. The results indicated that at the Bostanlı station (station 12), ammonium nitrogen, nitrite nitrogen, nitrate nitrogen, and chlorophyll-a concentrations were statistically significantly different from those of the other stations (Figure 13). The Bostanlı station is located in the Izmir Bay and is situated in close proximity to residential areas. The high nutrient and chlorophyll-a concentrations observed at this station are considered to be primarily associated with domestic wastewater inputs, terrestrial anthropogenic pressure, resulting in higher values compared to the other stations.
In a study conducted along the coasts of Türkiye to determine physico-chemical parameters, the measured values in the Aegean Sea were compared with the “Receiving Water Quality Criteria for Coastal Waters in Terms of General and Physico-Chemical Parameters” specified in the Surface Water Quality Regulation. According to this comparison, the Aegean Sea was classified as Class III (moderate) water quality with respect to dissolved oxygen and phosphate parameters. Furthermore, when evaluated in accordance with the “Trophic Levels of Surface Water Bodies” defined in the same regulation, the Aegean Sea was determined to be eutrophic. The eutrophic status of the Aegean Sea was further supported by dissolved oxygen, phosphate, and ammonium nitrogen concentrations corresponding to Class III and Class IV water quality. In particular, the Bostanlı monitoring station in the Aegean Sea, where the highest phosphate concentrations were recorded, was classified within the poor–bad ecological quality status [7]. Our values are also very similar values.
During the 2014–2019 monitoring period in the Aegean Sea, surface NOx (NO₂ + NO₃–N) concentrations were reported to range between 0.03 and 3.21 μM, with no pronounced seasonal variation observed. Total phosphorus concentrations were reported to vary between 0.02 and 5.16 μM throughout the 2014–2019 sampling period. The notably high values recorded in the Izmir Bay were attributed to the high domestic wastewater load in this region. Similarly, in the present study, the concentrations obtained at the stations located in the Izmir Inner Bay (particularly station 12 Bostanlı) were found to be high [10].
Pollution monitoring studies conducted in the Aegean Sea between 2014 and 2022 included measurements of eutrophication parameters (orthophosphate, nitrite+nitrate nitrogen, chlorophyll-a, and dissolved oxygen), and the reported values are comparable to those obtained in our study. Chlorophyll-a concentrations were determined to range between 0.01–42.38 μg L⁻¹ at coastal stations and 0.04–1.31 μg L⁻¹ at offshore stations during the 2014–2022 period. High concentrations were recorded in the Inner and Middle Izmir Bay (4.16–42.38 μg L⁻¹). The high chlorophyll-a levels observed in the Izmir Inner Bay indicate intensified biological activity in the environment, particularly in terms of oxygen production and consumption dynamics. Dissolved oxygen concentrations measured in coastal and offshore surface waters of the Aegean Sea varied between 6.61–9.88 mg L⁻¹ during the winter season and 3.23–8.34 mg L⁻¹ during the summer season, with a mean value of 6.58 mg L⁻¹. During monitoring studies conducted in the Aegean Sea, surface NOx (NO₂ + NO₃–N) concentrations ranged between 0.05 and 8.28 μM. High concentrations were generally observed at stations influenced by the Büyük Menderes, the Izmir Inner Bay, the outflow of the Dardanelles Strait, and the Meric River. Total phosphorus (TP) concentrations varied between 0.06 and 5.16 μM during the 2014–2022 sampling period. Winter concentrations were found to be higher than those recorded in summer. This seasonal difference has been attributed to the increased terrestrial nutrient input transported to the marine environment through enhanced precipitation and runoff during winter months. The Izmir Inner Bay was identified as one of the most polluted areas of the Aegean Sea. It has been reported that high levels of land-based pollutants—originating from population pressure, industrial activities, wastewater treatment plant effluents, riverine inputs, and port operations—result in high nutrient concentrations in this region. Consistent with these findings, the Bostanlı station located in the Izmir Inner Bay was identified as the most polluted site in our study [6].
In their study conducted in Izmir Bay, Küçüksezgin et al. (2019) [15] reported NOx concentrations ranging from 0.12 to 1.8 μM in the Outer Bay and 0.12 to 27.0 μM in the Inner–Middle Bay. Chlorophyll-a concentrations were found to range between 0.46 and 10 μg L⁻¹ in the Inner–Middle Izmir Bay and 0.09 to 0.59 μg L⁻¹ in the Outer Bay. It was also reported that the Izmir Inner Bay generally exhibits high chlorophyll-a concentrations (>10 μg L⁻¹). The obtained values are consistent with those reported in monitoring studies.
Satellite-based temperature analyses conducted in the Aegean Sea between 1985 and 2008 revealed spatial variability in warming rates across the basin. The lowest rate of temperature increase was recorded in the Dardanelles Strait and the Northern Aegean (0.042 °C year⁻¹), whereas the highest rate was observed in the Cretan Sea (0.047 °C year⁻¹). This regional contrast has been attributed to the influence of relatively cold Black Sea waters in the northern part of the basin and the warmer Levantine waters dominating the Southern Aegean [3]. Similarly, a long-term assessment of sea surface temperature in the Northern Aegean Sea covering the 46-year period between 1972 and 2018 indicated a significant warming trend, with an average annual increase of 0.035 °C and a total rise of 1.61 °C since 1972 [4].
In the study conducted by Sisman (2019) [16], based on 50-year averages in the Aegean Sea, it was reported that the mean sea surface temperature at the Izmir station increased from 10.91 °C at the beginning of the warming period to 26.47 °C in August. In contrast, at the Bodrum station, the average temperature rose from 15.46 °C to only 23.57 °C. Similarly, in our study, the mean temperature recorded at the Bodrum station was 23 °C, which is consistent with the previously reported value of 23.57 °C. The average temperature we obtained at the Bostanlı–Izmir station was 21.85 °C; when compared with the literature values, this result is close to the reported spring, summer, and autumn mean temperature of 22.47 °C.
In a study conducted in Ildır, variations in physicochemical parameters and nutrient elements were investigated in water samples. According to the analytical results, water temperature ranged between 14.0 and 24.5 °C, pH values 7.85 and 8.48, dissolved oxygen 5.2 and 9.2 mg L⁻¹, and salinity 33.97 and 41.00‰. Nitrite nitrogen concentrations varied from non-detectable levels (below the method detection limit) to 0.44 μgat L⁻¹, nitrate nitrogen from non-detectable to 1.12 μgat L⁻¹, ammonium nitrogen from non-detectable to 9.07 μgat L⁻¹, and phosphate phosphorus from non-detectable to 0.61 μgat L⁻¹ [17]. The values obtained at the Ildır station in our study are consistent with those reported in the aforementioned research.
In a study conducted in Urla, located in the Izmir Middle Bay, it was reported that water temperature ranged between 13.5–27.5 °C, dissolved oxygen between 5.8–9.0 mg L⁻¹, salinity between 32.18–38.40‰, and pH between 8.01–8.30. Nutrient concentrations were determined as follows: nitrite nitrogen 0.0–1.08 μg-at L⁻¹, nitrate nitrogen 0.0–7.16 μg-at L⁻¹, ammonium nitrogen 0.0–7.97 μg-at L⁻¹, phosphate phosphorus 0.0–1.72 μg-at L⁻¹, and chlorophyll-a 1.59–11.89 μg L⁻¹ [18]. In our study, the mean values recorded at the Urla station were as follows: water temperature 20.30 °C, dissolved oxygen 8.45 mg L⁻¹, salinity 34.73‰, pH 8.22, nitrite nitrogen 0.59 μg-at L⁻¹, nitrate nitrogen 3.16 μg-at L⁻¹, ammonium nitrogen 26.25 μg-at L⁻¹, phosphate phosphorus 8.95 μg-at L⁻¹, and chlorophyll-a 2.49 μg L⁻¹. Although the values are generally comparable, ammonium nitrogen and phosphate phosphorus concentrations were found to be considerably higher in our study.
In another study conducted in the Aegean Sea, temperature values were reported to range between 10.77–13.75 °C in the North Aegean, 14.21–16.09 °C in the Central Aegean, and 13.63–17.31 °C in the South Aegean. Salinity values were measured between 34.51–39.11 psu in the North Aegean, 38.95–39.16 psu in the Central Aegean, and 38.76–39.14 psu in the South Aegean. Reported pH values varied between 8.28–8.37 in the North Aegean, 8.29–8.32 in the Central Aegean, and 8.26–8.32 in the South Aegean [19]. In comparison, the results obtained in our study indicate higher temperature values, whereas salinity and pH values were measured to be lower than those reported in the aforementioned study.
In a study conducted in the Marmara Sea, phosphate and nitrite+nitrate concentrations were evaluated in accordance with the “Marmara Coastal Waters Eutrophication Criteria.” Based on these criteria, the water quality class was determined to be oligotrophic with respect to nitrite+nitrate and mesotrophic with respect to phosphate. Furthermore, phosphate, ammonium, nitrite, and nitrate concentrations were found to be higher at stations located near residential areas and in proximity to freshwater inflows compared to other sampling stations, indicating the influence of anthropogenic and riverine nutrient inputs on coastal water quality [20]. In our study, total phosphorus, nitrite+nitrate, and chlorophyll-a concentrations were compared with the “Aegean Coastal Waters Eutrophication Criteria.” According to this evaluation, the Aegean Sea was classified as eutrophic based on total phosphorus and chlorophyll-a levels, while nitrite+nitrate concentrations indicated an oligotrophic status.
In another study conducted in the Aliağa Körfezi, the physicochemical properties of water samples were reported as follows: station 1: temperature 13 °C, salinity 37.50 psu, pH 6.91, dissolved oxygen 5.5 mg L⁻¹; station 2: temperature 14.5 °C, salinity 38 psu, pH 6.91, dissolved oxygen 5.5 mg L⁻¹; station 3: temperature 13.5 °C, salinity 37.50 psu, pH 7.0, dissolved oxygen 5.0 mg L⁻¹; station 4: temperature 13 °C, salinity 38.50 psu, pH 6.91, dissolved oxygen 6.5 mg L⁻¹; station 5: temperature 15 °C, salinity 38 psu, pH 7.91, dissolved oxygen 5.0 mg L⁻¹; station 6: temperature 13 °C, salinity 38 psu, pH 8.02, dissolved oxygen 10.8 mg L⁻¹ [21]. In our study, stations located near Aliağa Gulf—Çandarlı and Foça—showed higher values of temperature, pH, and dissolved oxygen compared to those reported in the previous research.
In a study conducted in the Dardanelles Strait, surface seawater temperature was reported to range between 6.35 and 26.0 °C, salinity 25.1 and 32.8 ppt, pH 8.04 and 8.58, conductivity 30.3 and 41.8 mS/cm, dissolved oxygen 5.75 and 9.60 mg L⁻¹, nitrite+nitrate 0.050–2.320 μM, phosphate (PO₄³⁻) 0.133–0.700 μM, and chlorophyll-a 0.80–3.70 μg L⁻¹ [22]. Comparison with the values obtained in our study indicates that pH and dissolved oxygen are similar, while temperature and chlorophyll-a concentrations are lower, and salinity and conductivity values are higher.
4. Conclusions and Recommendations
In recent years, the increasing pollution events observed particularly in the Aegean Sea have had adverse effects on marine life, human health, and the environment. In this study, several physicochemical parameters were determined along the coastal waters of the Aegean Sea. Based on phosphate and chlorophyll-a concentrations, the Aegean Sea was classified as having an eutrophic character. The eutrophic water quality of the Aegean Sea is further supported by the classification of phosphate concentrations as third-class water quality.
Specifically, at the Bostanlı station (Station 12) in the Izmir Bay of the Aegean Sea, ammonium nitrogen, nitrite nitrogen, nitrate nitrogen, phosphate, and chlorophyll-a concentrations were higher than those at other stations, indicating that this station exhibits a hyper-eutrophic character. Since the Bostanlı station is located very close to residential areas, these high values are thought to result primarily from domestic wastewater inputs and terrestrial pressures, which are higher than at other stations. Therefore, domestic wastewater treatment plants in the Izmir Province should operate at full capacity, and if the current capacity is insufficient, it should be increased. In addition, due to the high population growth rate in Izmir, the number of treatment plants should also be increased. Water pollution monitoring should be conducted continuously, and significant preventive measures should be taken and enforced to mitigate pollution impacts.
Author Contributions
All authors have made significant contributions to this paper. Conceptualization,: O.M., E.M., F.B. and E.T.; methodology, O.M., E.M.; formal analysis, O.M., E.M.; investigation, O.M., E.M., F.B. and E.T.; resources, O.M.; data curation, O.M., E.M., F.B. and E.T.; writing-original draft preparation, O.M.; writing—review and editing, O.M. and E.M.; visualization, E.M. All authors have read and agreed to the published version of the manuscript.
Funding
This study was supported by The Scientific & Technological Research Council of Turkey (TÜBİTAK) project titled “Macroflora Species Diversity and Ecological Status of the Aegean Sea “ (Project No: 121Y215).
<Institutional Review Board Statement
This study is waived for ethical review.
Data Availability Statement
The original contributions presented in this study are included in the article.
Conflicts of Interest
The author declares no conflicts of interest.
References
- Besiktepe, S. Physical Oceanography of the Aegean Sea: A Review; The Aegean Sea Marine Biodiversity, Fisheries, Conservation and Governance; Publication No: 41, Istanbul, Türkiye, 2015.
- Gertman, I.; Pinardi, N.; Popov, Y.; Hecht, A. Aegean Sea Water Masses During the Early Stages of the Eastern Mediterranean Climatic Transient (1988–1990). Journal of Physical Oceanography 2006, 36(9), 1841-1859.
- Skliris, N.; Sofianos, S.S.; Gkanasos, A.; Axaopoulos, P.; Mantziafou, A.; Vervatis, V. Long-term sea surface temperature variability in the Aegean Sea. Advances in Oceanography and Limnology 2011, 2, 125-139.
- Salihoglu, B.; Ozturk, B. (Ed.) Climate Change and its Effects on Turkiye Seas; Turkish Marine Research Foundation; Publication no: 60, İstanbul, Türkiye, 2021.
- Salihoglu, B.; Salihoglu, B.F.; Oguz, T. The Effects of Climate Change on the Black Sea and Aegean Sea Ecosystems and Dynamics; TUBITAK ÇAYDAG, Project No: 108Y114, Erdemli-Mersin, Türkiye, 2011.
- Anonymous. Republic of Türkiye Ministry of Environment, Urbanization and Climate Change, General Directorate of Environmental Impact Assessment, Permit and Inspection, Integrated Marine Pollution Monitoring Program; 2014-2022 Aegean Sea Summary Report, 2026.
- Minareci, O.; Taskın, E.; Minareci, E. Physico-Chemical Parameters of Sea Water at Turkey Coasts. Fresenius Environmental Bulletin 2018, 27(11), 7236-7243.
- Anonymous. Final Report of the Project on Determining Sensitive Areas and Water Quality Targets on a Basin Basis in Türkiye; Project of the Ministry of Forestry and Water Affairs of the Republic of Türkiye; Ministry of Forestry and Water Affairs General Directorate of Water Management, 2016.
- Ferreira, J.G.; Andersen, J.H.; Borja, A.; Bricker, S.B.; Camp, J.; Cardoso da Silva, M.; Garcés, E.; Heiskanen, A.S.; Humborg, C.; Ignatiades, L.; Lancelot, C.; Menesguen, A.; Tett, P.; Hoepffner, N.; Claussen, U. Marine Strategy Framework Directive; Task Group 5 Report Eutrophication (April 2010); European Union and ICES, 2010. [CrossRef]
- Anonymous. Republic of Türkiye Ministry of Environment, Urbanization and Climate Change, General Directorate of Environmental Impact Assessment, Permit and Inspection, Integrated Marine Pollution Monitoring Program; 2014-2019 Aegean Sea Summary Report, 2021.
- Dogan Saglamtimur, N.; Saglamtimur, B. Eutrophication Status and Scenarios in Aquatic Environments. Omer Halisdemir University Journal of Engineering Sciences 2018, 7(1), 75-82. [CrossRef]
- APHA, AWWA, WEF. Standard Methods for the Examination of Water and Wastewater; 21st Ed., Washington, 1995.
- Official Gazette. Water Pollution Control Regulation; No: 25687, 2004.
- Official Gazette. Regulation on the Amendment of the Above Ground Water Quality Regulation; No: 29797, 2016.
- Kucuksezgin, F.; Pazi, I.; Kocak, F.; Gonul, T.; Duman, M.; Eronat, H. The Coasts of Turkey, in: World Seas: An Environmental Evaluation; Elsevier, pp. 307–332, 2019. [CrossRef]
- Sisman, E. Trend Analysis for the Cooling Period for Sea Water Temperatures in Aegean and Mediterranean Coasts. Artvin Çoruh University, Natural Hazards Application and Research Center. Journal of Natural Hazards and Environment 2019, 5(2), 291-304. [CrossRef]
- Kaymakcı Basaran, A.; Aksu, M.; Egemen, O. Monitoring the Impacts of the Offshore Cage Fish Farm on Water Quality Located in Ildır Bay (Izmir-Aegean Sea). Journal of Agricultural Sciences 2006, 13(1), 22-28.
- Durallı, E.; Egemen, O. Investigation of Pollution and Some Physico-chemical Parameters in the Vicinity of Urla Harbour. Ege University Journal of Fisheries and Aquatic Sciences 2009, 26(1), 81–85.
- Kisacik, T. Determination of the Communities of Pico, Nano and Microplankton in the Aegean Sea. Doctoral Thesis; University of Dokuz Eylül, Institute of Science, Izmir, Turkey, 2018.
- Minareci, O.; Yavuz, M.; Cakir, M. Assessment of the Surface Water Quality in Eastern Marmara Sea. Fresenius Environmental Bulletin 2019, 28(3), 2121-2132.
- Cakal Arslan, O.; Parlak, H.; Boyacioglu, M.; Karaaslan, M.A. Determination of Sediment and Water Contamination by Sea Urchin Embryotoxicity Test with Part Centrotus Lividus and Arbacia Lixula. Fresenius Environmental Bulletin 2017, 26(6), 3956-3962.
- Turkoglu, M.; Yenici, E.; Işmen, A.; Kaya, S. Variations of Nutrient and Chlorophyll-a in the Çanakkale Strait (Dardanelles). Ege University Journal of Fisheries & Aquatic Sciences 2004, 21(1-2), 93-98.
Figure 2.
Changes of pH in 2022 and 2023 in the Aegean Sea.

Figure 3.
Changes of temperature in 2022 and 2023 in the Aegean Sea.

Figure 4.
Changes of dissolved oxygen in 2022 and 2023 in the Aegean Sea.

Figure 5.
Changes of salinity in 2022 and 2023 in the Aegean Sea.

Figure 6.
Changes of turbidity in 2022 and 2023 in the Aegean Sea.

Figure 7.
Changes of conductivity in 2022 and 2023 in the Aegean Sea.

Figure 8.
Changes of phosphate in 2022 and 2023 in the Aegean Sea.

Figure 9.
Changes of ammonium nitrogen in 2022 and 2023 in the Aegean Sea.

Figure 10.
Changes of nitrite nitrogen in 2022 and 2023 in the Aegean Sea.

Figure 11.
Changes of nitrate nitrogen in 2022 and 2023 in the Aegean Sea.

Figure 12.
Changes of chlorophyll-a in 2022 and 2023 in the Aegean Sea.

Figure 13.
Statistical graphics of ammonium nitrogen (A), nitrite nitrogen (B), nitrate nitrogen (C) and chlorophyll-a (D) mean with SD.
Figure 13.
Statistical graphics of ammonium nitrogen (A), nitrite nitrogen (B), nitrate nitrogen (C) and chlorophyll-a (D) mean with SD.


Table 1.
Coordinates.
| No | Stations | Location |
|---|---|---|
| St1 | Enez | 40°41’07”N 26°03’39”E |
| St2 | Saros Bay | 40°30’30”N 26°40’35”E |
| St3 | Gökçeada | 40°14’11”N 25°54’32”E |
| St4 | Yeniköy | 39°55’46”N 26°09’34”E |
| St5 | Bozcaada | 39°47’58”N 26°04’52”E |
| St6 | Babakale | 39°28’12”N 26°13’02”E |
| St7 | Altınoluk | 39°33’59”N 26°47’42”E |
| St8 | Ayvalık | 39°16’10”N 26°36’55”E |
| St9 | Dikili | 39°02’01”N 26°48’03”E |
| St10 | Çandarlı | 38°54’46”N 26°48’56”E |
| St11 | Foça | 38°44’29”N 26°44’26”E |
| St12 | Bostanlı | 38°27’32”N 27°05’19”E |
| St13 | Urla | 38°24’33”N 26°47’55”E |
| St14 | Ildır | 38°23’53”N 26°28’31”E |
| St15 | Çeşme | 38°22’30”N 26°18’58”E |
| St16 | Sığacık | 38°10’28”N 26°46’08”E |
| St17 | Kuşadası | 37°42’28”N 27°11’33”E |
| St18 | Didim | 37°25’16”N 27°12’58”E |
| St19 | Güllük | 37°12’29”N 27°33’55”E |
| St20 | Bodrum | 36°59’58”N 27°22’28”E |
| St21 | Akyaka | 37°02’39”N 28°16’00”E |
| St22 | Gökova | 36°47’39”N 28°01’02”E |
| St23 | Datça | 36°42’06”N 27°41’19”E |
| St24 | Bozburun 1 | 36°40’27”N 28°02’57”E |
| St25 | Bozburun 2 | 36°34’47”N 28°03’08”E |
Table 2.
Mean values of Water Quality Parameters.
| PARAMETERS | pH | Temperature (°C) |
Dissolved oxygen (mg/L) |
Salinity (‰) |
Turbidity (mg/L) |
Conductivity (µS/cm) |
Phosphate (µg/L) |
Ammonium nitrogen (µg/L) |
Nitrite nitrogen (µg/L) |
Nitrate nitrogen (µg/L) |
Chlorophyll a (µg/L) |
|
|---|---|---|---|---|---|---|---|---|---|---|---|---|
| STATIONS | ||||||||||||
| Enez | 8.24±0.01 | 20.9±0.01 | 8.55±1.41 | 32.58±3.85 | 24.18±2.51 | 48.275±5.13 | 9.11±6.25 | 20.35±2.37 | 0.27±0.14 | 1.06±0.12 | 1.08±0.57 | |
| Saros Bay | 8.19±0.03 | 19.25±0.85 | 7.73±0.11 | 32.80±2.76 | 24.33±1.80 | 48.475±3.78 | 8.97±5.08 | 15.48±11.98 | 0.46±0.18 | 1.59±0.38 | 0.87±0.55 | |
| Gökçeada | 8.18±0.04 | 21.55±1.70 | 7.35±0.57 | 30.40±2.05 | 22.70±1.34 | 45.375±2.72 | 8.12±5.63 | 15.51±0.96 | 0.67±0.11 | 1.84±0.16 | 0.86±0.50 | |
| Yeniköy | 8.14±0.09 | 20.1±0.21 | 7.40±0.14 | 34.23±4.14 | 25.30±2.76 | 50.55±5.52 | 8.69±4.34 | 22.53±16.62 | 0.29±0.11 | 2.95±1.20 | 1.73±1.02 | |
| Bozcaada | 8.28±0.05 | 19.9±1.41 | 8.28±0.53 | 32.48±2.09 | 24.05±1.34 | 48.125±2.79 | 9.40±5.37 | 17.14±9.93 | 0.18±0.11 | 1.76±0.24 | 0.65±0.13 | |
| Babakale | 8.15±0.01 | 22.28±1.66 | 7.45±0.57 | 34.20±2.47 | 25.20±1.63 | 50.40±3.11 | 8.75±4.79 | 13.46±4.99 | 0.69±0.08 | 1.94±0.09 | 0.75±0.54 | |
| Altınoluk | 8.19±0.07 | 21.93±0.82 | 8.13±0.95 | 33.78±2.37 | 24.95±1.56 | 49.225±4.07 | 9.26±4.49 | 22.51±3.68 | 0.67±0.46 | 3.25±0.64 | 3.06±0.33 | |
| Ayvalık | 8.20±0.01 | 22.08±1.17 | 8.05±0.92 | 32.88±6.97 | 23.58±3.50 | 48.475±9.37 | 8.51±5.29 | 18.89±11.34 | 0.49±0,23 | 1.90±0.85 | 0.30±0.33 | |
| Dikili | 8.26±0.04 | 21.43±0.25 | 8.55±1.77 | 34.65±2.26 | 25.55±1.48 | 51.025±3.01 | 9.19±5.92 | 24.12±20.25 | 0.38±0.17 | 1.95±0.83 | 0.64±0.70 | |
| Çandarlı | 8.28±0.01 | 20.08±1.52 | 8.38±1.59 | 33.30±2.69 | 24.63±1.73 | 48.975±3.22 | 8.87±5.14 | 26.24±14.49 | 0.66±0.40 | 3.81±0.72 | 0.70±0.46 | |
| Foça | 8.11±0.14 | 20.28±2.79 | 7.93±0.53 | 34.00±3.82 | 25.08±2.51 | 50,175±4.91 | 9.12±5.02 | 27.68±25.56 | 0.51±0.25 | 3.05±0.35 | 1.34±0.38 | |
| Bostanlı | 8.10±0.07 | 21.85±0.35 | 7.30±0.71 | 32.58±0.39 | 24.15±0.21 | 48.25±0.49 | 17.57±13.95 | 108.18±44.03 | 1.44±0.23 | 6.55±1.48 | 5.28±1.40 | |
| Urla | 8.22±0.04 | 20.30±1.13 | 8.45±0.21 | 34.73±2.09 | 25.58±1.38 | 51.125±2.72 | 8.95±5.19 | 26.25±22.56 | 0.59±0.18 | 3.16±1.62 | 2.49±0.03 | |
| Ildır | 8.20±0.09 | 21.98±2.51 | 7.73±0.88 | 33.80±1.98 | 25.15±1.56 | 50.225±3.08 | 9.29±5.62 | 36.00±35.92 | 0.60±0.34 | 0.94±0.79 | 2.15±0.20 | |
| Çeşme | 8.29±0.02 | 21.28±0.74 | 8.68±0.46 | 34.95±2.33 | 25.75±1.56 | 51.45±3.11 | 9.02±4.92 | 26.70±23.69 | 0.57±0.33 | 1.60±0.42 | 2.45±0.39 | |
| Sığacık | 8.24±0.07 | 21.43±0.88 | 8.35±1.48 | 34.80±3.18 | 25.55±2.19 | 51.075±4.35 | 8.81±5.19 | 32.79±30.60 | 0.24±0.07 | 1.76±1.07 | 2.16±0.46 | |
| Kuşadası | 8.21±0.05 | 21.33±0.95 | 7.68±0.60 | 32.98±1.94 | 24.30±1,48 | 48.575±2.93 | 9.53±4.40 | 33.77±32.98 | 0.58±0.04 | 0.95±0.35 | 2.80±0.05 | |
| Didim | 8.24±0.06 | 22.33±0.95 | 8.98±2.09 | 35.93±3.22 | 26.38±2.09 | 52.675±4.14 | 10.71±4.53 | 36.21±37.83 | 0.41±0.24 | 2.18±0.62 | 0.95±0.16 | |
| Güllük | 8.19±0.06 | 23.20±1.13 | 7.55±0.57 | 35.80±3.39 | 26.28±2.16 | 52.5±4.38 | 8.97±4.73 | 34.40±24.08 | 0.31±0.17 | 1.70±0.28 | 1.76±1.75 | |
| Bodrum | 8.21±0.08 | 22.90±2.19 | 8.18±1.10 | 36.03±3.15 | 26.45±2.05 | 52.80±4.03 | 9.07±4.22 | 28.28±27.20 | 0.50±0.24 | 0.63±0.43 | 2.35±0.31 | |
| Akyaka | 8.20±0.04 | 23.98±0.60 | 7.10±0.64 | 32.60±0.92 | 24.18±0.60 | 48.35±1.27 | 9.21±4.77 | 33.55±29.61 | 0.54±0.58 | 0.80±0.71 | 0.73±0.81 | |
| Gökova | 8.22±0.06 | 23.65±1.70 | 7.00±0.14 | 35.63±3.08 | 26.13±1.94 | 52.2±3.89 | 8.91±4.67 | 30.17±31.41 | 0.30±0.01 | 1.11±0.58 | 1.99±0.62 | |
| Datça | 8.27±0.05 | 22.43±1.94 | 6.80±0.28 | 35.70±2.05 | 26.28±1.24 | 52.35±2.69 | 8.86±5.25 | 28.54±29.89 | 0.25±0.15 | 0.91±0.57 | 2.03±0.76 | |
| Bozburun 1 | 8.19±0.07 | 24.15±0.28 | 7.05±0.21 | 36.48±3.01 | 26.73±1.87 | 53.40±3.89 | 8.94±4.63 | 29.55±26.39 | 0.54±0.23 | 0.62±0.42 | 2.16±0,01 | |
| Bozburun 2 | 8.23±0.04 | 24.40±1.20 | 7.85±1.63 | 35.98±2.37 | 26.38±1.52 | 52.70±3.04 | 8.84±4.40 | 31.42±30.27 | 0.84±0.22 | 0.72±0.25 | 2.68±0.11 | |
Table 3.
Coastal Waters Receiving Environment Quality Criteria in Terms of General and Physicochemical Parameters [14].
Table 3.
Coastal Waters Receiving Environment Quality Criteria in Terms of General and Physicochemical Parameters [14].
| Parameters | Water Quality Classes | ||||
|---|---|---|---|---|---|
|
I (very good) |
II (good) |
III (medium) |
IV (poor) |
This study | |
| Dissolved oxygen (mg/L) | ≥ 7 | 6 | 5 | < 5 | 7.86 |
| Total phosphorus (µg/L) | < 5 | 5 - 7 | 7.1 - 11 | > 11 | 9.39 |
| Nitrite + Nitrate (µg/L) | < 5 | 5 - 10 | 10.1 – 20 | > 20 | 2.4 |
Table 4.
Aegean Coastal Waters Eutrophication Criteria [14].
Table 4.
Aegean Coastal Waters Eutrophication Criteria [14].
| Water Quality Classes | Total phosphorus (µg/L) | Nitrite+ Nitrate Chlorophyll-a (µg/L) (µg/L) |
|---|---|---|
| Oligotrophic | < 5 | <5 <0.5 |
| Mesotrophic | 7 | 10 1 |
| Eutrophic | 11 | 20 2 |
| Hypertrophic | >11 | >20 >2 |
| This study | 9.39 |
2.4 1.76 |
Table 5.
The result of the One-Way ANOVA test between stations.
| Table Analyzed One-way analysis of variance |
Between Stations | |||
|---|---|---|---|---|
| Ammonim nitrogen | Nitrite nitrogen | Nitrate nitrogen | Chlorophll-a | |
| P value | P<0.0001 | P<0.0001 | P<0.0001 | P<0.0001 |
| P value summary | **** | **** | **** | **** |
| Are means signif. different? (p < 0.05) | Yes | Yes | Yes | Yes |
| Number of groups | 25 | 25 | 25 | 25 |
| F | 3.643 | 6.422 | 19.78 | 17.14 |
| R squared | 0.5383 | 0.7551 | 0.9047 | 0.8916 |
Disclaimer/Publisher’s Note: The statements, opinions and data contained in all publications are solely those of the individual author(s) and contributor(s) and not of MDPI and/or the editor(s). MDPI and/or the editor(s) disclaim responsibility for any injury to people or property resulting from any ideas, methods, instructions or products referred to in the content. |
© 2026 by the authors. Licensee MDPI, Basel, Switzerland. This article is an open access article distributed under the terms and conditions of the Creative Commons Attribution (CC BY) license (http://creativecommons.org/licenses/by/4.0/).
Copyright: This open access article is published under a Creative Commons CC BY 4.0 license, which permit the free download, distribution, and reuse, provided that the author and preprint are cited in any reuse.


