Submitted:
10 April 2026
Posted:
14 April 2026
You are already at the latest version
Abstract
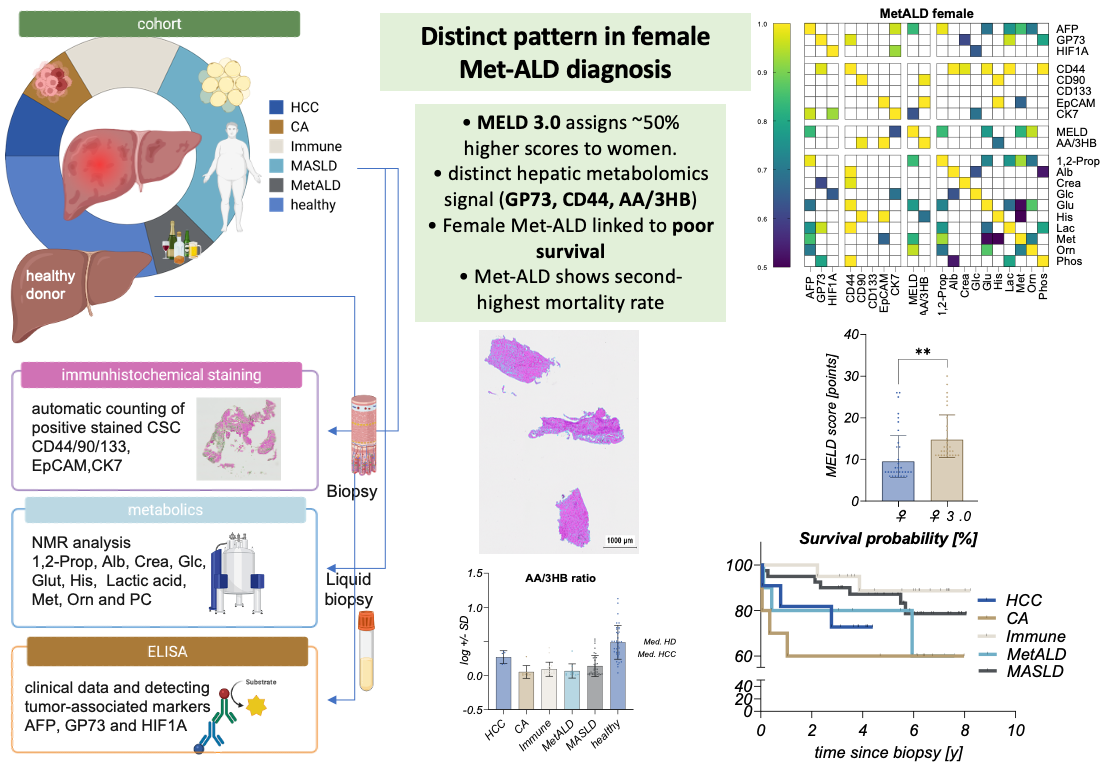
Background: Steatotic liver disease (SLD) is characterised by profound metabolic reprogramming, yet no single biomarker reliably distinguishes disease entities, stages or sex-specific risk profiles. By integrating serum metabolomic signatures as a liquid biopsy with tumour-associated CSC marker profiles in a sex-stratified analytical framework, we aimed to identify biologically meaningful differences and improve strategies for early, presymptomatic detection of SLD progression and HCC. Methods: The present study focuses on a targeted panel of strongly dysregulated serum metabolites as candidate biomarkers of disease progression, quantified by NMR-based metabolomics and ELISA and complemented by CSC marker staining. We combined these NMR-based metabolomic ‘liquid biopsy’ data with circulating tumour-associated biomarkers, MELD-based risk assessment and tissue-level CSC marker expression across MetALD, MASLD, immune-mediated and cancerogenic liver disease, HCC and healthy controls. Results: Female MetALD patients showed the second highest mortality after HCC, with lower survival than male cancer patients, despite MELD 3.0 assigning ~50% higher scores in women. MetALD mortality clustered with GP73, CD44, metabolomics and AA/3HB ratio, indicating a distinct, high-risk female phenotype. Conclusion: Integrating liquid-based metabolomic profiling, AA/3HB redox assessment, CSC markers and MELD 3.0 into sex-sensitive diagnostic pathways may improve early detection and risk stratification of alcohol-associated CLD, especially in women.
Keywords:
MetALD
; female health
; biomarkers
; CSC marker
; Metabolomics
; NMR
; sex-specific distribution
1. Introduction
Hepatocellular carcinoma (HCC) remains one of the leading causes of cancer-related mortality worldwide, with incidence rates projected to rise substantially by 2040 (1,2). In European populations, steatotic liver disease (SLD), comprising metabolic dysfunction–associated steatotic liver disease (MASLD) and metabolic dysfunction and alcohol–associated liver disease (MetALD), constitutes a significant etiological substrate for hepatocellular carcinoma (HCC). The development of cancer occurs in the context of metabolic and/or alcohol-related steatosis, accompanied by its progressive inflammatory and fibrotic sequelae, and hepatocarcinogenesis due to SLD is increasingly surpassing viral etiologies (3,4). Furthermore, epidemiological projections suggest that MASLD and MetALD will surpass hepatitis B and C virus (HBV, HCV) infections as the first and second leading causes of HCC-related mortality by 2033 (5).
Despite advances in antiviral therapies and surveillance programs, HCC is frequently diagnosed at advanced stages, when curative treatment options are limited. Current screening strategies rely on imaging-based surveillance combined with serum biomarkers such as alpha-fetoprotein (AFP), elastography, and fibrosis-based risk scores including FIB-4, APRI, and the MASLD fibrosis score (6–9). While these approaches are useful for fibrosis stratification, they insufficiently capture tumour-associated metabolic reprogramming and therefore often fail to detect early malignant transformation (10,11).
Metabolic dysregulation represents a hallmark of chronic liver disease and hepatocarcinogenesis (12,13). Alterations in mitochondrial redox balance, ketone body metabolism, lipid remodeling, and amino acid turnover reflect progressive hepatocellular stress and malignant transformation (14). Consequently, metabolomic profiling has emerged as a promising approach to identify disease-associated metabolic shifts that may precede overt clinical or radiological manifestations.
Emerging evidence further links metabolic reprogramming to the acquisition of cancer stem cell (CSC) characteristics. Markers such as CD44, CD90, EpCAM, and CK7 have been associated with tumour plasticity, therapy resistance, and immune evasion (15). These stemness-associated features are increasingly recognised as key drivers of tumour progression. However, despite their biological relevance, CSC-associated pathways are rarely integrated into biomarker strategies for early disease detection or risk stratification.
Importantly, most clinical risk scores, surveillance algorithms, and validation cohorts have been derived predominantly from male populations. As a consequence, sex-specific biological differences, including variations in hormonal milieu, body composition, alcohol metabolism, and immune regulation, remain insufficiently explored. This imbalance contributes to the systematic under-recognition of progressive liver disease in females and to reduced performance of existing diagnostic and prognostic tools for over 50% of the patients (16).
Although numerous metabolomic studies have identified metabolic alterations in chronic liver disease, no single biomarker has yet demonstrated sufficient specificity to reliably distinguish between disease entities or stages. Therefore, this study investigates a targeted panel of strongly dysregulated metabolites as candidate prognostic biomarkers of disease progression. By integrating serum metabolomic signatures as a ‘liquid biopsy’ with tumour-associated CSC marker profiles in a sex-stratified analytical framework, we aim (i) to identify prognostically relevant, biologically meaningful differences, and (ii) to detect sex-based differences that may improve strategies for early, presymptomatic disease detection.
2. Results
Clinical stratification of the clinical cohort to access the cirrhotic etiologies.
The study cohort consisted of 37 healthy controls (29%), 11 patients with diagnosed hepatocellular carcinoma (HCC, 9%) and 70 patients with chronic liver disease of different etiologies, including MASLD (30%, n = 39), immune-mediated liver disease (Immune, 16%, n = 20) and MetALD (9%, n = 11), cancerogenic lesions (CA, 8%, n = 10), as illustrated in Figure 1A and defined in Table A 1. Baseline demographic characteristics are summarized in Table 1. The mean age across disease groups, ranging from 46.1 years (healthy cohort) to 53.8 years in the immune-mediated cohort, 56.3 years in MetALD and 60 years in MASLD patients. The mean age of HCC patients was found to be 62.9 years, whereas the CA cohort represented the oldest group with a mean age of 67.2 years. Additionally, clinical data, including serum biomarkers, metabolic parameters, and selected tumour-associated markers, are outlined in Table 1, thus providing a comprehensive overview of the clinical and biochemical profile of the study cohort.
The sex distribution differed between etiologies. The healthy cohort contained the highest proportion of female individuals (64.8%), while HCC patients were predominantly male (73%), followed by MetALD with 55% males and CA displaying 60% males. In contrast, MASLD (67.5%) and immune-mediated liver disease (55%) cohorts showed a higher proportion of female patients. Kaplan–Meier analysis demonstrated etiology-dependent differences in overall survival (Figure 1B). The CA cohort exhibited the poorest survival, with approximately 60% survival at 12 months after biopsy. Patients with MetALD showed intermediate outcomes, with approximately 30% mortality within four years. In contrast, patients with MASLD and immune-mediated liver disease showed the most favorable prognosis, with immune-mediated cases reaching approximately 90% survival after eight years. Liver disease severity at the time of biopsy was assessed using the MELD score (Figure 1C). The highest MELD scores were observed in the CA group (mean 20.0), followed by MetALD (mean 14.4), immune-mediated liver disease (mean 10.7), and MASLD (mean 9.3). While the number of CA cases were limited, MELD scores were significantly higher in CA compared with the other etiologies (p < 0.05), whereas no significant differences were observed between MASLD, MetALD, and immune-mediated liver disease. Assessment of hepatic functional reserve using the Child–Turcotte–Pugh (CTP) classification confirmed these findings (Figure 1D). The majority of MASLD and immune-mediated patients were classified as Child A or B, indicating preserved or moderately impaired liver function, whereas Child C cases were rare. In contrast, MetALD patients were predominantly classified as Child B.
In result, this case study cohort demonstrates a clinically heterogeneous but functionally comparable data set, which allows the investigation of circulating metabolomic and tumour-associated biomarker signatures.
Tumour-associated biomarkers differentiate hepatocellular carcinoma but do not discriminate the etiology of chronic liver disease
To establish a biological framework for the subsequent metabolic analyses, we first assessed circulating biomarkers associated with tumour development, hepatocellular stress, and hypoxia-driven signaling, including alpha-fetoprotein (AFP), Golgi protein 73 (GP73), and hypoxia-inducible factor 1 alpha (HIF1A) (Figure 2). These markers are frequently discussed in the context of liver disease progression; however, they differ substantially in their diagnostic value for cirrhosis versus hepatocellular carcinoma (HCC). Importantly, while these biomarkers are used in clinical and experimental studies, their ability to distinguish specific cirrhotic etiologies remains limited.
As illustrated in Figure 2A and Figure 2C, HCC and healthy donor samples were displayed alongside the cirrhotic aetiologies encompassed within the cohort. In addition, the cirrhotic groups were contrasted with published reference ranges in AFP (6,26) and HIF1A (27) to provide an external benchmark for interpreting of circulating biomarker concentrations.
Serum AFP levels were markedly elevated in HCC patients compared with all other groups (Figure 2A). AFP concentrations in the HCC cohort exceeded those observed in CA, Immune, MetALD, MASLD, and healthy control groups, where AFP levels remained low and largely comparable across the non-tumour liver disease entities. These findings are consistent with the established clinical role of AFP as a marker primarily associated with malignant hepatocellular transformation rather than cirrhosis. While AFP increase in advanced liver injury or regenerative nodules, it generally lacks sufficient specificity and sensitivity to reliably classify cirrhotic patients (28–30).
To evaluate hepatocyte injury and Golgi-associated stress responses, we next analyzed GP73 levels (Figure 2B). Unlike AFP, GP73 concentrations were relatively similar across CA, Immune, MetALD, and MASLD. All chronic liver disease groups exhibited higher GP73 concentrations than the healthy and HCC reference cohorts, in accordance with the established association of GP73 with hepatocyte injury, inflammation and fibrotic remodelling (29). It is noteworthy that GP73 levels were found to be consistently higher in cirrhotic conditions compared to HCC (30) suggesting that GP73 primarily detects chronic hepatocellular stress and fibrotic remodelling rather than tumour burden. These findings lend support to the concept of GP73 as a non-specific marker of advanced liver injury across cirrhotic aetiologies(31,32), with limited ability to discriminate between individual causes of chronic liver disease.
Finally, we assessed circulating levels of HIF1A (Figure 2C), a central regulator of cellular adaptation to hypoxia and metabolic stress. HIF1A concentrations were strongly elevated in HCC patients and, to a lesser extent, in CA patients, remained markedly lower in MetALD, MASLD, immune-mediated disease, and healthy controls. The pronounced elevation observed in HCC likely reflects hypoxia-driven signaling within the tumour microenvironment, where rapid cellular proliferation and abnormal vascularization lead to oxygen limitation and activation of hypoxia-responsive pathways, consistent with hypoxia-inducible factor, driven responses described in experimental and clinical settings (33). In this context, HIF1A primarily reflects tumour-associated metabolic reprogramming and microenvironmental hypoxia rather than a general marker of cirrhosis, but in line with its role as a broadly conserved stress response rather than a cirrhosis-specific biomarker. Therefore, the elevation in CA patients is indicative of progressive tissue remodeling and compromised oxygen diffusion.
In sum, the analysis of AFP, GP73, and HIF1A highlights that these markers capture distinct aspects of liver disease biology. AFP and HIF1A predominantly reflect tumour-associated processes, including hepatocellular dedifferentiation and hypoxia-driven metabolic reprogramming, and therefore serve primarily as indicators of HCC rather than cirrhosis. In contrast, GP73 appears to be more closely associated with general hepatocyte injury and fibrotic liver remodeling but does not distinguish well between different etiologies of chronic liver disease. Importantly, MetALD patients did not display the tumour-associated biomarker profile observed in HCC, which subsequently leads to the inclusion of NMR-based metabolic profiling to investigate whether the metabolic profile could provide discriminatory potential.
MetALD exhibits a distinct metabolic signature involving lipid metabolism, nitrogen detoxification, and oxidative stress
To better understand the metabolic alterations associated with alcohol-associated liver disease and its progression toward cirrhosis and HCC, we analyzed metabolites reflecting lipid metabolism, nitrogen detoxification, oxidative stress, energy metabolism, and hepatic synthetic function. Evaluating these markers across different liver disease entities allows the identification of metabolic disturbances that specifically characterize MetALD and distinguish alcohol-induced hepatocyte injury from other chronic liver pathologies.
One of the earliest metabolic alterations observed relates to lipid metabolism, reflected by changes in phosphatidylcholine levels (Figure 3A). In the MetALD group, a significant reduction in phosphatidylcholine was observed in comparison with both CA and immune-mediated liver disease, suggesting a substantial disruption of phospholipid metabolism in alcohol-associated disease. While patients with MASLD demonstrated moderately elevated phosphatidylcholine levels, indicative of metabolic syndrome-related lipid alterations, those with MetALD exhibited the lowest levels among the non-tumour liver diseases, even exhibiting lower levels than those observed in patients with HCC.
Progression of metabolic stress is further reflected in disturbances of nitrogen metabolism, captured by the metabolites glutamine and ornithine (Figure 3B–C). Glutamine levels were markedly reduced in MetALD compared with HCC and healthy controls, and were also lower than those observed in CA, MASLD, and immune-mediated liver disease. This pattern suggests that ammonia buffering capacity and mitochondrial function are particularly compromised in alcohol-associated hepatocyte injury. Ornithine concentrations in MetALD were lower than HCC and healthy individuals, but remained relatively higher than those observed in CA, MASLD, and immune-mediated disease. Because ornithine is a central intermediate of the hepatic urea cycle, these findings indicate that nitrogen detoxification is impaired in MetALD but may still retain partial functionality compared with other chronic liver diseases where ornithine levels are even further diminished.
Histidine, a precursor for antioxidant metabolites and protective metabolites, was depleted in Met-ALD (Figure 3D). Histidine levels were lowest in the MetALD cohort and were significantly reduced compared with both HCC and healthy individuals. When compared with other chronic liver disease entities, histidine was also lower in MetALD than in CA, MASLD, and immune-mediated disease.
Alterations in energy metabolism were evident from changes in systemic glucose levels (Figure 3E). Glucose concentrations were lowest in MetALD patients and lower than in CA, MASLD and immune-mediated disease, consistent with ethanol-induced increases in the hepatic NADH/NAD⁺ ratio that inhibit gluconeogenic enzymes and reduce hepatic glucose production. In contrast, HCC patients displayed the highest glucose levels across all groups, in keeping with tumour-driven metabolic reprogramming and increased hepatic glucose output.
Interestingly, lactate levels (Figure 3F) were similar in all cirrhotic subgroups, indicating largely preserved systemic lactate handling across non-tumor liver diseases despite ongoing metabolic stress. By contrast, lactate concentrations were lowest in HCC patients, consistent with altered tumour metabolism in which lactate is more actively utilised as an energy substrate within the tumour and its microenvironment rather than accumulating in the circulation.
The progression of metabolic dysfunction is further supported by markers of hepatic functional capacity. Albumin levels (Figure 3G) were lowest in both MetALD and HCC patients compared with healthy individuals, indicating impaired hepatocyte synthetic capacity and declining liver function. When compared with other chronic liver disease entities, albumin concentrations in MetALD were lower than in CA and immune-mediated disease but were similar to those observed in MASLD. This finding suggests that hepatocyte functional impairment is already pronounced in alcohol-associated disease and shares certain features with metabolic liver injury.
Finally, creatinine levels (Figure 3H) were slightly elevated in the MetALD cohort than in CA, MASLD, and immune-mediated disease, although these differences were not statistically significant. This mild increase may reflect early systemic metabolic stress or subtle renal alterations that frequently accompany chronic liver disease, with creatinine indicating underlying muscle mass and protein turnover.
Methionine levels (Suppl. Figure 1) were comparable across MetALD, CA, MASLD, immune-mediated disease and healthy individuals, indicating preserved hepatic methylation capacity despite the metabolic disturbances observed in MetALD.
Taken together, these findings reveal a coordinated metabolic signature associated with alcohol-induced liver disease. The observed pattern confirmed that disease progression begins with impaired lipid metabolism and hepatocellular steatosis, followed by disturbances in nitrogen detoxification and oxidative stress responses. These alterations ultimately lead to impaired energy metabolism and reduced hepatic synthetic capacity.
Altered Ketone Body Metabolism Reflects Mitochondrial Redox Imbalance in MetALD
We next examined whether the NMR-derived metabolic alterations in MetALD extend to ketone body metabolism by calculating the acetoacetate to 3-hydroxybutyrate ratio (AA/3HB), a marker of hepatic mitochondrial redox state that depends on the NADH/NAD⁺-dependent interconversion of ketone bodies. Under physiological conditions, AA/3HB ratios in healthy individuals are typically reported around 0.5–1.0, indicating balanced ketone body metabolism (22,34). When analysing the case study cohort (Figure 4A), the AA/3HB ratio differed significantly across entities and was markedly reduced in MetALD compared with healthy individuals, indicating a shift toward 3-hydroxybutyrate accumulation consistent with ethanol-induced elevation of the hepatic NADH/NAD⁺ ratio and mitochondrial metabolic stress in alcohol-associated liver disease (18).
In contrast, HCC patients displayed comparatively higher AA/3HB ratios, approaching or exceeding those observed in healthy individuals. This pattern reflects tumor-associated metabolic reprogramming and altered mitochondrial substrate utilization in HCC potentially favouring acetoacetate accumulation or reduced conversion to 3-hydroxybutyrate. Additionally, replacement of metabolically active hepatocytes by tumor tissue may contribute to altered systemic ketone body ratios.
To assess potential sex effects on ketone body metabolism, we stratified AA/3HB ratios by biological sex (Figure 4B). This analysis was motivated by the underrepresentation of women in many alcohol-associated liver disease studies despite evidence suggesting increased susceptibility to alcohol-induced liver injury. In female MetALD, women demonstrated significantly lower median AA/3HB ratios in comparison to men, whereas median values exhibited convergence between sexes at the HCC stage. Despite a marginally more pronounced decrease in male MetALD patients, the same pattern was observed in women, indicating that the ethanol-driven mitochondrial redox shift underlying the reduced AA/3HB ratio is a general metabolic feature of MetALD rather than a sex-restricted phenomenon. The comparable alterations observed in both sexes lend support to the hypothesis that AA/3HB functions as a reliable indicator of alcohol-associated mitochondrial imbalance, thereby complementing the NMR-derived metabolomic signature.
Tissue-level CSC marker expression correlates with systemic metabolic signatures and reveals sex-specific prediction patterns for MetALD
To validate whether the systemic biomarker and metabolic signatures identified by liquid biopsy were mirrored at the tissue level, we next examined the expression of cancer stem cell (CSC)-associated markers in liver tissue biopsies and correlated these findings with circulating and metabolic parameters. For CSC staining, we selected CD44, CD90, CD133, EpCAM, and CK7 as markers capturing progenitor activation, epithelial plasticity, and early tumor-associated remodeling in chronic liver injury and hepatocellular carcinogenesis. Representative immunohistochemical staining in CA, immune-mediated disease, and MetALD are shown in Supplementary Figure 2A. Quantification of positively stained tissue areas was performed using the scoring approach described in the Methods. CD44-positive areas were highest in CA tissues, whereas immune-mediated disease and MetALD samples showed lower but detectable expression (Suppl. Figure 2C). In exploratory survival analysis, CD44-positive biopsies tended to have poorer surveillance outcomes than CD44-negative biopsies within the case study cohort (Suppl. Figure 2C). CD90 expression was more pronounced in CA and MetALD than in immune-mediated disease, while CD133 levels varied across entities without clear aetiology-specific enrichment (Suppl. Figure 2D-E). showed more variable levels across entities without clear etiology-specific enrichment. CK7, indicating ductular reaction and biliary differentiation, was detectable across disease groups but most prominent in CA, and EpCAM expression was significantly higher in CA than in immune-mediated disease and MetALD, consistent with enhanced epithelial progenitor activation in advanced disease stages (Suppl. Figure 2F-G). Overall, CSC-associated cellular responses were observed across chronic liver disease entities but were most pronounced in CA, representing the end-stage disease state in this cohort.
Next, to determined analysed tissue markers relative to systemic biomarker signatures, Pearson correlation was employed, integrating CSC markers with circulating biomarkers, metabolic parameters, and clinical indices (Figure 5A-B, Suppl. Figure 3A-D and Suppl. Figure 4A-B). Correlation matrices for all entities are depicted in Suppl. Figure 3A-D. Both positive and negative correlations are shown over the full range of coefficients, revealing distinct, aetiology-dependent correlation patterns. In the CA subgroup (Suppl. 3A), CSC markers clustered with markers of advanced liver dysfunction and metabolic disturbance, including albumin, creatinine, glucose and several amino acid metabolites, indicating a close link between progenitor activation, structural liver damage and metabolic decompensation in end-stage disease.
In contrast, the MetALD subgroup (Suppl. 3B) displayed distinct correlation pattern, where CSC markers were more frequently associated with metabolites linked to mitochondrial redox balance and alcohol-associated metabolic remodeling, including the AA/3HB ratio, phosphatidylcholine metabolism, and amino acid metabolites (e.g. glutamine, histidine, and ornithine). For the immune-mediated disease cohort (Suppl. Figure 3C), the data presented a more moderate and distributed correlation pattern, with CSC markers showing associations with circulating injury markers (AFP, GP73) and some metabolic parameters. Compared with MetALD, however, correlations with mitochondrial redox–associated metabolites were less pronounced. Instead, the data showed that progenitor activation is linked to inflammatory remodelling and immune-driven hepatocellular stress. As expected for the MASLD subgroup (Suppl. Figure 3D). In MASLD, CSC markers showed a more metabolically integrated correlation pattern, associating with metabolites of glucose, amino acid and phospholipid metabolism, but not prominently with the AA/3HB ratio, thereby differing from the redox-driven pattern observed in MetALD. To explore sex-dependent effects in MetALD, we next performed sex-stratified correlation analyses in female (Figure 5A-B) and male patients (Suppl. Figure 4A-B). To highlight most relevant associations, only positive correlations (Pearson r = 0.5–1.0) are displayed in these matrices. The female CA patient cohort (Figure 5A) displayed no pronounced differences to the male CA patient cohort (Suppl. Figure 4A), while female MetALD patients (Figure 5B) showed a more distinguishable correlation pattern compared to their male counterparts (Suppl. Figure 4B). Correlations involving the AA/3HB ratio and amino acid metabolites indicated that alcohol-associated mitochondrial stress closely interacts with progenitor-associated tissue responses in female patients, whereas the corresponding male correlation matrices (Suppl. Figure 4B) appeared less structured This pattern suggests that metabolic–progenitor coupling may be particularly relevant for disease progression in women. To assess the clinical relevance of these findings, we next focused on disease severity and outcome in the female case study cohort (Figure 5C–E). In female patients, MELD 3.0 scores were significantly higher than conventional MELD values (Figure 5D), pointing to an improved capture of disease severity in a more sex-neutral manner. The predictive performance of MELD-based scoring in females showed good agreement between predicted and observed values in a normal QQ plot (Figure 5E). Finally, Kaplan–Meier survival analyses (Figure 5F) confirmed the validity of MELD 3.0 calculation in this cohort with overlapping survival curve s for female in MetALD and CA patients, consistent with similar advanced disease stages and survival patterns (Figure 5B).
These results support a predictive model in which MetALD is characterized by a metabolically defined disease phenotype, and that integration of metabolic biomarkers with CSC-associated tissue responses may provide improved strategies for predicting disease progression, particularly in female patients approaching advanced disease stages comparable to CA.
3. Discussion
This case study provides, to our knowledge, the first integrated, sex-stratified analysis combining liquid-biopsy metabolomics, ketone-body redox profiling, conventional serum biomarkers, MELD-based risk assessment, and tissue-level CSC marker expression across a contemporary cohort of patients with MetALD, MASLD, immune-mediated liver disease, CA, HCC, and healthy controls. Within this framework, MetALD emerges as a distinct, metabolically defined disease phenotype that is insufficiently captured by conventional tumour-associated markers alone and is particularly informative in female patients, in whom alcohol-related mitochondrial stress and progenitor-associated responses converge with adverse risk profiles.
Consequently, it is imperative to identify this vulnerable cohort at an early stage, while they are still in the presymptomatic stage. Consequently, it can be deduced that in the future, metabolic analysis using a liquid biopsy should be performed clinically prior to imaging, or at the very latest, concurrently with it. Furthermore, an invasive tissue sample should only be taken as a secondary measure.
This observation is clinically relevant given the rapidly changing epidemiology of liver disease. Liver cancer remains a leading cause of cancer mortality, and future projections suggest a substantial rise in HCC burden, with alcohol use and steatotic liver disease among the major drivers (1,3). At the same time, MASLD prevalence is increasing worldwide, and MetALD has emerged as a clinically important overlap phenotype in which metabolic dysfunction and alcohol exposure synergize, amplifying steatohepatitis, fibrosis, and HCC risk (35,36). This is especially relevant because MASLD-related HCC is still under-surveilled, with substantially lower screening rates than HCC or other etiologies (37,38).
Serum biomarker analysis confirmed that AFP and HIF1A primarily identify malignant transformation, whereas GP73 reflects general hepatocellular injury and fibrotic remodeling rather than MetALD itself. AFP behaved as expected, strongly separating HCC from non-malignant liver disease, consistent with its established role as a marker of hepatocellular dedifferentiation (24). HIF1A likewise reflected hypoxia-driven tumor biology rather than cirrhotic etiology (39). In contrast, GP73 was elevated across cirrhotic disease states, consistent with prior work showing that it tracks chronic hepatocyte stress and fibrosis rather than tumor burden alone (32). Our GP73 ELISA values also aligned with recently discussed reference ranges and extend those data by including MetALD alongside MASLD, immune-mediated disease, CA, and HCC. Together, these findings show that classical tumor-associated markers are biologically informative but insufficient to discriminate MetALD.
The discriminatory information instead came from the metabolic layer. NMR profiling identified a MetALD-associated signature characterized by altered metabolites. This is in line with broader metabolomics literature showing that chronic liver disease is accompanied by coordinated changes in lipid metabolism, amino-acid turnover, glucose regulation, and mitochondrial pathways, and that these metabolic patterns can distinguish cirrhosis, steatohepatitis, and HCC (40–43). In our cohort, the metabolic pattern of MetALD clearly differed from MASLD, immune-mediated disease, and HCC, supporting the idea that MetALD represents a distinct pathobiological state rather than a simple overlap diagnosis.
The AA/3HB ratio added a mechanistic redox dimension to this interpretation. Because the cytosolic NADH/NAD⁺ ratio mirrors the mitochondrial pool, it serves as a functional indicator of hepatic mitochondrial redox state (18,19). The reduced AA/3HB ratio in MetALD fits well with alcohol-driven NADH accumulation and the resulting shift toward 3-hydroxybutyrate, consistent with mitochondrial reductive stress (44). By contrast, HCC showed comparatively higher ratios, likely reflecting tumor-associated metabolic reprogramming and altered mitochondrial substrate use (14). Thus, the AA/3HB ratio complements the metabolite panel by linking the observed biochemical changes to mitochondrial dysfunction, a core feature of alcohol-associated liver injury.
A central translational message of this study is the explicit focus on female MetALD. Women remain underrepresented in alcohol-related liver disease research, although converging data indicate that they are biologically more vulnerable to alcohol-induced liver injury and alcohol-attributable cancer, including breast cancer, even at moderate consumption levels (45–47). At the same time, hazardous drinking in middle-aged women remains common in Europe, underscoring that this is not a rare or theoretical problem (48). In this context, the signal observed in female MetALD in our cohort is not a marginal subgroup finding, but directly relevant for population-level liver and cancer prevention.
Our data demonstrate that female MetALD constitute a distinct high-risk phenotype in which metabolic dysfunction and alcohol toxicity converge more strongly than in male. This concept is mechanistically plausible: loss of oestrogen-mediated protection, increasing visceral adiposity, insulin resistance, dyslipidaemia and obesity-related inflammatory signalling are likely to amplify alcohol-induced oxidative stress, lipotoxicity and fibrogenesis in women (49). In keeping with this, female MetALD patients in our cohort showed more structured and stronger correlation patterns between CSC markers and metabolic parameters than male MetALD patients, particularly involving the AA/3HB redox ratio and amino acid–related metabolites. This does not suggest an entirely different disease entity, but rather a tighter coupling between systemic metabolic stress and progenitor-associated tissue remodelling in women, whereas sex differences were less pronounced in CA, where end-stage decompensation appears to override aetiology-specific mechanisms.
The tissue-level CSC analysis supports this interpretation. Markers such as CD44, CD90, CD133, EpCAM, and CK7 are associated to progenitor activation, epithelial plasticity, migration, chemoresistance, and early hepatocarcinogenesis (50–52). While absolute CSC-marker expression was highest in CA, the more informative observation was the correlation structure. In MetALD, CSC markers preferentially tracked metabolic stress parameters, whereas in CA they aligned more strongly with markers of general hepatic decompensation. This suggests that, in MetALD, progenitor-associated remodeling is more tightly linked to metabolic injury biology than to terminal liver failure. In this sense, CSC markers do not function as primary MetALD classifiers, but they provide biological validation that the circulating metabolite signature reflects relevant tissue remodeling.
The female subgroup also highlighted the value of sex-dependent clinical scoring. In our cohort, MELD 3.0 was significantly higher than conventional MELD in women, supporting the concept that sex-adjusted scoring better captures disease severity in female patients. This is consistent with prior evidence that women are disadvantaged by creatinine-driven scoring systems because lower muscle mass leads to lower serum creatinine at comparable renal dysfunction (40,53). Our findings therefore support the view that sex-dependent biomarker interpretation and sex-adapted clinical scoring should be considered together.
This study has several strengths. It integrates clinical, serologic, metabolomic, redox, and tissue-level data within a single, well-characterised cohort. Furthermore, it employs sex-stratified analyses rather than treating sex solely as an adjustment covariate. However, it is imperative to acknowledge the significant limitations that are inherent to this approach. The number of participants in each subgroup is limited, particularly in the MetALD group and for sex-stratified analyses. All assessments are based on baseline measurements, with no longitudinal follow-up. Consequently, it is imperative to regard the present findings as biologically robust and hypothesis-generating; however, further validation is necessary through prospective cohort studies.
The differentiation of patients on an individual basis is only feasible to a limited extent. This constraint is presumably indicative of an overlap between MASLD and MetALD, given that the MASLD cohort may comprise an unspecified proportion of patients who would formally fulfil MetALD criteria, in view of the open-ended questionnaire design and variability in self-reported alcohol intake. Conversely, the healthy donor group may comprise individuals in a presymptomatic disease stage who would more accurately be classified as MASLD or MetALD, which is consistent with the study’s focus on early and subclinical disease.
4. Materials and Methods
Preparation of blood samples and asservation. Venous blood was collected from patients and healthy control subjects in serum Monovettes (Sarstedt, Germany). The blood sample was left at room temperature for 30 minutes until coagulation was complete. After centrifugation at 1,800 g for 10 minutes, the serum was aspirated. Aliquots of 500 µl serum were stored at -80 °C until further processing. The aliquots were then shipped on dry ice to lifespin GmbH (Regensburg, Germany) for metabolome profiling and stored at -80 °C until further processing. Nuclear magnetic resonance (NMR) spectroscopy. Serum aliquots were shipped on dry ice and analysed using a targeted 1H-NMR metabolomics platform (lifespin GmbH, Regensburg, Germany). After thawing at room temperature, 350 µL serum were mixed with 350 µL aqueous buffer (H2O p.A., 0.1 g/L NaN3, 0.067 mol/L Na2HPO4, 0.033 mol/L NaH2PO4, pH 7.15 ± 0.05, 5% D2O, 6 mM pyrazine), and 600 µL of the mixture were transferred into 5 mm NMR tubes (Bruker, Billerica, MA, USA). Spectra were acquired at 310 K on an AVANCE NEO 600 MHz spectrometer (Bruker) using a NOESY presaturation pulse sequence (noesygppr1d, 16 scans, relaxation delay 10 s, acquisition time 2.75 s, 96k data points, spectral width 30 ppm). 1H-NMR spectra were Fourier transformed, phased, and baseline-corrected in TopSpin 4.1.1 (Bruker). Metabolites and lipoproteins were automatically detected and quantified using proprietary software (Blood Profiler 1.4, Lipoprotein Profiler 1.2.3_A, lifespin GmbH), yielding 87 serum parameters (metabolites in mmol/L); values below the limit of detection were set to zero.
Enzyme-linked Immuno-sorbent assay. Precoated sandwich-ELISA were used to detect α-fetoprotein (AFP) (R&D Systems, Minneapolis, USA), glycoprotein 73 (GP73) (ThermoFisher Scientific, Waltham, USA), and hypoxia-inducible factor-1-alpha (HIF1A) (ThermoFisher Scientific, Waltham, USA). Serum samples (diluted 1:3) were assayed as specified in the manufacturer’s protocols. No deviations from the kit procedures were introduced, except for the use of a different streptavidin–HRP solution (SDT GmbH, Baesweiler, Germany) (diluted 1:000) for the GP73 ELISA. Plates were analysed using the Tecan Spark 10 M microplate reader (Tecan Group Ltd, Männedorf, Switzerland).
Immunohistochemistry. Core needle liver biopsies were immediately fixed in 10% neutral buffered formalin for 24 hours, routinely processed, and embedded in paraffin. Sections of 2 µm thickness were mounted on glass slides. Immunohistochemistry was performed on selected sections to evaluate the expression of stem cell markers CD44, CD90, CD133, CK7 and EpCAM. Following the HIER-based epitope-retrieval protocol by deparaffinization at 72 °C, antigen retrieval was achieved by heating slides in acidic citrate ER1 (CD133, EpCAM, CK7 (pH 6.0)) or ER2 (EDTA-based) for CD44 at 100 °C for 10 minutes (CD44, EpCAM, CK7) or 20 minutes (CD133). After inactivating endogenous peroxidase, slides were incubated with primary antibodies (each at relevant dilutions) at room temperature. Detection of rabbit and mouse primary antibodies was performed on an automated immunostainer (BOND-III, Leica Biosystems, Nussloch, Germany) using a high-sensitivity, polymer-based HRP/DAB system (Bond Polymer Refine Detection Kit, Leica Biosystems), with diaminobenzidine as chromogen and hematoxylin counterstaining, according to the manufacturer’s instructions. All runs included appropriate positive and negative controls to ensure specificity and reproducibility of the immunostaining results.
Immunohistochemical stainings were digitally acquired as single bright-field extractions at 4-fold magnification within defined target areas (Suppl. 2B) using an all-in-one fluorescence microscope (BZ-X1000, Keyence, Osaka, Japan). The numbers of positively stained cells and total cells were manually counted within each target area, and expression levels were quantified as the ratio (percentage) of positive cells relative to the total cell count per field (Suppl. 2C). The resulting values were recorded and processed using spreadsheet software (Excel 2010, Microsoft Corp., Redmond, USA).
Statistical analysis and sample size. Processed sample size of liquid biopsies (n=188) and tissue biopsies (n=40) are illustrated in a flowchart (Suppl. Figure 5), with entities and compared to healthy control cohort distinguished by color. Statistical analysis and visualisation were performed using GraphPad Prism 9.5.1 (Boston, MA, USA). Descriptive statistics (median [IQR]) were calculated for patient characteristics. Statistical analyses were performed using one-way ANOVA with appropriate post hoc multiple comparison testing. Statistical significance was defined as p < 0.05, and significance levels are reported using the following notation: ns (p > 0.05), *p < 0.05, **p ≤ 0.01, ***p ≤ 0.001, p ≤ 0.0001. Exact p-values are provided in the text, figures, or tables where appropriate. P-values for group comparisons are shown xx, and levels of significance are indicated as ns (not significant). Pearson’s correlation analysis was used to assess associations between two parameters, with statistical significance defined according to the same thresholds. Survival analysis employed Kaplan–Meier curves with log-rank testing.
5. Conclusions
In summary, the findings of the present study support a model in which MetALD represents a metabolically defined disease phenotype, with female MetALD patients constituting a particularly vulnerable subgroup that is not adequately captured by conventional tumour-associated markers such as AFP, HIF1A and GP73. While these markers provide a useful contextual strategy for detecting malignancy and global liver injury, they are not sufficiently informative to reliably identify MetALD. By contrast, the integration of serum metabolite profiles, AA/3HB redox status, correlations with CSC markers and MELD 3.0 offers a coherent approach for sex-specific risk stratification and the earlier detection of alcohol-related hepatocellular injury. In this context, sex-specific differences in susceptibility, metabolism and tissue response need to be actively incorporated into diagnostic strategies, risk stratification and therapeutic decision-making.
Supplementary Materials
The following supporting information can be downloaded at the website of this paper posted on Preprints.org, Figure S1: Methionine levels across study cohorts; Figure S2: Immunohistochemical staining; Figure S3: Pearson correlation heatmaps; Figure S4: Pearson correlation für CA and MetaLD in males and CD44-associated, sex-specific survival.
Author Contributions
JK, WD, SL initiated and supervised the research study; AV and JK designed the experiments; SL, AH, KS and SL supervised the collection of human samples; AV, GM, SS, SH, FD conducted experiments and acquired data; AV, JK, GM analyzed data; JK, AV, GM, WD, and TK wrote the manuscript. All authors discussed the data and corrected the manuscript. All authors had access to the study data and had reviewed and approved the final manuscript.
Funding
The German Research Foundation (DFG) funded the study with a grant to JK (KA 5390/2-1). All funding sources supporting the work are acknowledged, and authors have nothing to disclose. This research was funded by the Ministry of Science, Research and Cultural Affairs of the State of Brandenburg with a grant to AV.
Institutional Review Board Statement
The study was conducted in accordance with the Declaration of Helsinki and approved by the ethical committee of the university medical school Theodor Fontane (E-01-20190905) and the Ethical Review Committee of the Ärztekammer Hamburg (PV-3578) for studies involving humans.
Informed Consent Statement
Informed consent was obtained from all subjects involved in the study.
Acknowledgments
The authors thank the personnel of MHB, especially Karina Börner and Eileen Maly for excellent technical assistance. We thank the laboratory personnel of lifespin GmbH for the support of the study. The Center for Translational Medicine and especially its core facilities provided excellent technical infrastructure as well as service for all conducted experiments.
Conflicts of Interest
The authors declare no conflicts of interest. The funders had no role in the design of the study; in the collection, analyses, or interpretation of data; in the writing of the manuscript; or in the decision to publish the results. The company Lifespin GmbH, with contributions by S. Heelemann and Strathmeyer, was involved solely in the acceptance and processing of serum samples. Neither individual had any influence on the study design, methodology, data processing, or data analysis.
Abbreviations
The following abbreviations are used in this manuscript:
| 1,2-Propanediol | 1,2-Propanediol |
| AA/3HB | Acetoacetate/3-Hydroxybutyrate |
| AFP | α-Fetoprotein |
| AKBR | Arterial ketone body ratio |
| ALB | Albumin |
| ALT | Alanin-Aminotransferase |
| ANOVA | analysis of variants |
| CD | Cluster of differentiation |
| CK | Cytokeratin |
| CPT | Child-Torcotte-Pugh |
| Crea | Creatine |
| CSC | Cancer stem cell |
| ELISA | enzyme-linked immunosorbent assay |
| EPCAM | Epithelial Cell Adhesion Molecule |
| Glc | Glucose |
| Glu | Glutamine |
| GP73 | Golgi protein 73 |
| HBV, HCV | hepatitis B, C virus |
| HCC | hepatocellular carcinoma |
| Hif1α | Hypoxinduced factor 1 alpha |
| His | Histidine |
| Lac | Lactic acid |
| MASLD | metabolic dysfunction-associated steatotic liver disease |
| Met | Methionine |
| MetALD | metabolic dysfunction-associated alcohol-related liver disease |
| MELD | Model of endstage liver disease |
| NMR | Nuclear magnetic resonance (spectroscopy) |
| Orn | Ornithine |
| Phos | Phosphatidylcholine |
Appendix A

Table A1.
Overview of characteristics of the study cohort.
| Category in manuscript | Clinical term | description |
|---|---|---|
| HCC | Hepatocellular carcinoma | Primary malignant liver tumour arising from hepatocytes |
| CA (Cancerogenic liver disease) |
Lesion suspicious for hepatocellular carcinoma | Cancerogenic hepatic lesion of extrahepatic origin (e.g., metastasis) arising from cholangiocarcinoma or from primary tumours of the breast, colon, or lung |
| Immune | Immune-mediated liver disease | liver injury primarily caused by an aberrant immune response against hepatic or biliary mainly autoimmune origin |
| MetALD | metabolic dysfunction-associated alcohol-related liver disease | Chronic liver disease characterized by hepatic steatosis in the presence of metabolic dysfunction and significant alcohol consumption. |
| MASLD | metabolic dysfunction-associated steatotic liver disease |
Chronic liver disease associated with metabolic dysfunction and hepatic steatosis in the absence of significant alcohol intake |
References
- Sung H, Ferlay J, Siegel RL, Laversanne M, Soerjomataram I, Jemal A, et al. Global Cancer Statistics 2020: GLOBOCAN Estimates of Incidence and Mortality Worldwide for 36 Cancers in 185 Countries. CA A Cancer J Clinicians. 2021 May;71(3):209–49. [CrossRef]
- Rumgay H, Arnold M, Ferlay J, Lesi O, Cabasag CJ, Vignat J, et al. Global burden of primary liver cancer in 2020 and predictions to 2040. Journal of Hepatology. 2022 Dec;77(6):1598–606. [CrossRef]
- Chan SL, Sun HC, Xu Y, Zeng H, El-Serag HB, Lee JM, et al. The Lancet Commission on addressing the global hepatocellular carcinoma burden: comprehensive strategies from prevention to treatment. The Lancet. 2025 Aug;406(10504):731–78. [CrossRef]
- Bowie K. Majority of global liver cancer cases “preventable,” Lancet commission finds. BMJ. 2025 Jul 29;390:r1587. [CrossRef]
- Henry-Blake C, Balachandrakumar V, Kassab M, Devonport J, Matthews C, Fox J, et al. Lower hepatocellular carcinoma surveillance in metabolic dysfunction-associated steatotic liver disease: Impact on treatment eligibility. J of Gastro and Hepatol. 2024 Dec;39(12):2817–25. [CrossRef]
- Qiu S, Cai J, Yang Z, He X, Xing Z, Zu J, et al. Trends in Hepatocellular Carcinoma Mortality Rates in the US and Projections Through 2040. JAMA Netw Open. 2024 Nov 18;7(11):e2445525. [CrossRef]
- Berzigotti A, Tsochatzis E, Boursier J, Castera L, Cazzagon N, Friedrich-Rust M, et al. EASL Clinical Practice Guidelines on non-invasive tests for evaluation of liver disease severity and prognosis – 2021 update. Journal of Hepatology. 2021 Sep;75(3):659–89. [CrossRef]
- Galle PR, Forner A, Llovet JM, Mazzaferro V, Piscaglia F, Raoul JL, et al. EASL Clinical Practice Guidelines: Management of hepatocellular carcinoma. Journal of Hepatology. 2018 Jul;69(1):182–236. [CrossRef]
- Elderkin J, Al Hallak N, Azmi AS, Aoun H, Critchfield J, Tobon M, et al. Hepatocellular Carcinoma: Surveillance, Diagnosis, Evaluation and Management. Cancers. 2023 Oct 24;15(21):5118. [CrossRef]
- Strandberg R, Åberg F, Asteljoki JV, Luukkonen PK, Salomaa V, Jula A, et al. Use of new CORE risk score to predict 10 year risk of liver cirrhosis in general population: population based cohort study. BMJ. 2025 Sep 29;390:e083182. [CrossRef]
- Graupera I, Thiele M, Serra-Burriel M, Caballeria L, Roulot D, Wong GLH, et al. Low Accuracy of FIB-4 and NAFLD Fibrosis Scores for Screening for Liver Fibrosis in the Population. Clinical Gastroenterology and Hepatology. 2022 Nov;20(11):2567-2576.e6. [CrossRef]
- Archer AJ, Belfield KJ, Orr JG, Gordon FH, Abeysekera KW. EASL clinical practice guidelines: non-invasive liver tests for evaluation of liver disease severity and prognosis. Frontline Gastroenterol. 2022 Sep;13(5):436–9. [CrossRef]
- Neureiter D, Kiesslich T, Ocker M. Translating Fibrosis to Malignancy: Biomarkers and Therapeutic Opportunities in Liver Fibrosis and Hepatocellular Carcinoma. Medical Sciences. 2026 Feb 25;14(1):110. [CrossRef]
- Sangro B, Argemi J, Ronot M, Paradis V, Meyer T, Mazzaferro V, et al. EASL Clinical Practice Guidelines on the management of hepatocellular carcinoma. Journal of Hepatology. 2025 Feb;82(2):315–74. [CrossRef]
- Jee YM, Lee JY, Ryu T. Chronic Inflammation and Immune Dysregulation in Metabolic-Dysfunction-Associated Steatotic Liver Disease Progression: From Steatosis to Hepatocellular Carcinoma. Biomedicines. 2025 May 21;13(5):1260. [CrossRef]
- Du D, Liu C, Qin M, Zhang X, Xi T, Yuan S, et al. Metabolic dysregulation and emerging therapeutical targets for hepatocellular carcinoma. Acta Pharmaceutica Sinica B. 2022 Feb;12(2):558–80. [CrossRef]
- Chen TH, Lin SH, Lee MY, Wang HC, Tsai KF, Chou CK. Mitochondrial alterations and signatures in hepatocellular carcinoma. Cancer Metastasis Rev. 2025 Mar;44(1):34. [CrossRef]
- Addison T. Observations on fatty degeneration of the liver. In: Guy’s Hospital reports. London: S. Highley. p. 476–85.
- Véronique Terrasse. Alcohol: a major preventable cause of cancer [Pressemitteilung] [Internet]. [cited 2025 Oct 18]. (IARC Evidence Summary Brief No. 6). Report. Available from: https://www.iarc.who.int/wp-content/uploads/2025/10/IARC_Evidence_Summary_Brief_6.pdf.
- Rumgay H, Ferlay J, De Martel C, Georges D, Ibrahim AS, Zheng R, et al. Global, regional and national burden of primary liver cancer by subtype. European Journal of Cancer. 2022 Jan;161:108–18. [CrossRef]
- WHO. European Health Alliance on Alcohol launched to reduce the unsustainable toll of alcohol harms in Europe [Internet]. 2025 May 8 [cited 2025 Oct 18]. Available from: https://www.who.int/europe/news/item/08-05-2025-european-health-alliance-on-alcohol-launched-to-reduce-the-unsustainable-toll-of-alcohol-harms-in-europe.
- Rinella ME, Lazarus JV, Ratziu V, Francque SM, Sanyal AJ, Kanwal F, et al. A multisociety Delphi consensus statement on new fatty liver disease nomenclature. Journal of Hepatology. 2023 Dec;79(6):1542–56. [CrossRef]
- Younossi ZM, Kalligeros M, Henry L. Epidemiology of metabolic dysfunction-associated steatotic liver disease. Clin Mol Hepatol. 2025 Feb 28;31(Suppl):S32–50. [CrossRef]
- Swarup S, Ahmed I, Grigorova Y, Zeltser R. Metabolic Syndrome. In: StatPearls [Internet]. Treasure Island (FL): StatPearls Publishing; 2025 [cited 2025 Oct 18]. Available from: http://www.ncbi.nlm.nih.gov/books/NBK459248/ PubMed PMID: 29083742.
- Bray F, Laversanne M, Sung H, Ferlay J, Siegel RL, Soerjomataram I, et al. Global cancer statistics 2022: GLOBOCAN estimates of incidence and mortality worldwide for 36 cancers in 185 countries. CA A Cancer J Clinicians. 2024 May;74(3):229–63. [CrossRef]
- McNeil CA, Pramfalk C, Humphreys SM, Hodson L. The storage stability and concentration of acetoacetate differs between blood fractions. Clinica Chimica Acta. 2014 Jun;433:278–83. [CrossRef]
- Yamaoka K, Kanayama M, Tajiri K, Yamane M, Marumo F, Sato C. Clinical Significance of Arterial Ketone Body Ratio in Chronic Liver Disease. Digestion. 1998;59(4):360–3. [CrossRef]
- Kemperman RH, Ganetzky RD, Master SR. B-169 Beta-hydroxybutyrate/acetoacetate Ratio as Indicator for Mitochondrial Diseases Utilizing a Novel LC-MS/MS Based Ketone Body Panel. Clinical Chemistry. 2023 Oct 1;69(Supplement_1):hvad097.501. [CrossRef]
- Yassen KA, Galley HF, Lee A, Webster NR. Mitochondrial redox state in the critically ill. Br J Anaesth. 1999 Aug;83(2):325–7. PubMed PMID: 10618950. [CrossRef]
- Dishart MK, Schlichtig R, Tønnessen TI, Rozenfeld RA, Simplaceanu E, Williams D, et al. Mitochondrial redox state as a potential detector of liver dysoxia in vivo. Journal of Applied Physiology. 1998 Mar;84(3):791–7. [CrossRef]
- Mey JT, Erickson ML, Axelrod CL, King WT, Flask CA, McCullough AJ, et al. β-Hydroxybutyrate is reduced in humans with obesity-related NAFLD and displays a dose-dependent effect on skeletal muscle mitochondrial respiration in vitro. American Journal of Physiology-Endocrinology and Metabolism. 2020 Jul 1;319(1):E187–95. [CrossRef]
- Liu Y, Hong Z, Tan G, Dong X, Yang G, Zhao L, et al. NMR and LC/MS-based global metabolomics to identify serum biomarkers differentiating hepatocellular carcinoma from liver cirrhosis: Serum Biomarkers in Hepatocellular Carcinoma. Int J Cancer. 2014 Aug 1;135(3):658–68. [CrossRef]
- Liu Z, Zheng Y, Li Y, West China School of Medicine, Sichuan University, Chengdu, China, College of Computer Science, Sichuan University, Chengdu, China, Department of General Surgery, the First Affiliated Hospital of Wenzhou Medical University, China, et al. Association between ketone body levels and chronic liver disease: Epidemiological studies and potential mechanisms. AIMSPH. 2026;13(1):82–104. [CrossRef]
- Laffel L. Ketone bodies: a review of physiology, pathophysiology and application of monitoring to diabetes. Diabetes/Metabolism Research and Reviews. 1999;15(6):412–26. [CrossRef]
- Wishart DS. Emerging applications of metabolomics in drug discovery and precision medicine. Nat Rev Drug Discov. 2016 Jul;15(7):7. [CrossRef]
- Kim HY. Recent advances in nonalcoholic fatty liver disease metabolomics. Clin Mol Hepatol. 2021 Oct;27(4):553–9. PubMed PMID: 34098712; PubMed Central PMCID: PMC8524071. [CrossRef]
- Mudgal P, Kumar Gupta S, Malik S, Nith RB, Kumar S, K R, et al. Biomarker discovery in NAFLD: insights from metabolomics and vote counting meta-analysis. Metabolomics. 2025 Aug 12;21(5):116. [CrossRef]
- Kano N, Want EJ, McPhail MJW. Metabolomics in Advanced Liver Disease. Curr Treat Options Gastro. 2021 Jun 1;19(2):380–97. [CrossRef]
- Daniels NJ, Hershberger CE, Kerosky M, Wehrle CJ, Raj R, Aykun N, et al. Biomarker Discovery in Liver Disease Using Untargeted Metabolomics in Plasma and Saliva. IJMS. 2024 Sep 21;25(18):10144. [CrossRef]
- Semenza GL. HIF-1 and tumor progression: pathophysiology and therapeutics. Trends in Molecular Medicine. 2002 Apr;8(4):S62–7. [CrossRef]
- Galle PR, Foerster F, Kudo M, Chan SL, Llovet JM, Qin S, et al. Biology and significance of alpha-fetoprotein in hepatocellular carcinoma. Liver Int. 2019 Dec;39(12):2214–29. [CrossRef]
- Kim D, Cho E, Yu KS, Jang IJ, Yoon JH, Park T, et al. Comprehensive Metabolomic Search for Biomarkers to Differentiate Early Stage Hepatocellular Carcinoma from Cirrhosis. Cancers. 2019 Oct 6;11(10):1497. [CrossRef]
- Ishimoto T, Nagano O, Yae T, Tamada M, Motohara T, Oshima H, et al. CD44 Variant Regulates Redox Status in Cancer Cells by Stabilizing the xCT Subunit of System xc− and Thereby Promotes Tumor Growth. Cancer Cell. 2011 Mar;19(3):387–400. [CrossRef]
- Lee TKW, Guan XY, Ma S. Cancer stem cells in hepatocellular carcinoma — from origin to clinical implications. Nat Rev Gastroenterol Hepatol. 2022 Jan;19(1):26–44. [CrossRef]
- Yamashita T, Kaneko S. Orchestration of hepatocellular carcinoma development by diverse liver cancer stem cells. J Gastroenterol. 2014 Jul;49(7):1105–10. [CrossRef]
- Magee JA, Piskounova E, Morrison SJ. Cancer Stem Cells: Impact, Heterogeneity, and Uncertainty. Cancer Cell. 2012 Mar;21(3):283–96. [CrossRef]
- Zhang K, Che S, Su Z, Zheng S, Zhang H, Yang S, et al. CD90 promotes cell migration, viability and sphere-forming ability of hepatocellular carcinoma cells. Int J Mol Med. 2017 Dec 8. [CrossRef]
- Kinsey E, Lee HM. Management of Hepatocellular Carcinoma in 2024: The Multidisciplinary Paradigm in an Evolving Treatment Landscape. Cancers. 2024 Feb 4;16(3):666. [CrossRef]
- Rodriguez LA, Schmittdiel JA, Liu L, Macdonald BA, Balasubramanian S, Chai KP, et al. Hepatocellular Carcinoma in Metabolic Dysfunction-Associated Steatotic Liver Disease. JAMA Netw Open. 2024 Jul 11;7(7):e2421019. [CrossRef]
- Tan DJH, Ng CH, Lin SY, Pan XH, Tay P, Lim WH, et al. Clinical characteristics, surveillance, treatment allocation, and outcomes of non-alcoholic fatty liver disease-related hepatocellular carcinoma: a systematic review and meta-analysis. The Lancet Oncology. 2022 Apr;23(4):521–30. [CrossRef]
- Tsochatzis EA, Bosch J, Burroughs AK. Liver cirrhosis. The Lancet. 2014 May;383(9930):1749–61. [CrossRef]
- Sarich P, Canfell K, Egger S, Banks E, Joshy G, Grogan P, et al. Alcohol consumption, drinking patterns and cancer incidence in an Australian cohort of 226,162 participants aged 45 years and over. Br J Cancer. 2021 Jan 19;124(2):513–23. [CrossRef]
- Esser MB, Sherk A, Liu Y, Henley SJ, Naimi TS. Reducing Alcohol Use to Prevent Cancer Deaths: Estimated Effects Among U.S. Adults. American Journal of Preventive Medicine. 2024 Apr;66(4):725–9. [CrossRef]
- Leal-Lassalle H, Estévez-Vázquez O, Cubero FJ, Nevzorova YA. Metabolic and alcohol-associated liver disease (MetALD): a representation of duality. npj Gut Liver. 2025 Jan 10;2(1):1. [CrossRef]
- Bosque-Prous M, Espelt A, Borrell C, Bartroli M, Guitart AM, Villalbí JR, et al. Gender differences in hazardous drinking among middle-aged in Europe: the role of social context and women’s empowerment. Eur J Public Health. 2015 Aug;25(4):698–705. [CrossRef]
- Chen Y, Zhou J, Li J, Feng J, Chen Z, Wang X. Plasma metabolomic analysis of human hepatocellular carcinoma: Diagnostic and therapeutic study. Oncotarget. 2016 Jul 26;7(30):47332–42. [CrossRef]
- Huang F, Jiang H, Shen M, Zhang C, Chen Y, Pan B, et al. Plasma metabolomic profiling for hepatocellular carcinoma diagnosis and microvascular invasion prediction. Intl Journal of Cancer. 2025 Nov 15;157(10):2187–96. [CrossRef]
- Fotakis C, Kalafati IP, Amanatidou AI, Andreou V, Matzapetakis M, Kafyra M, et al. Serum metabolomic profiling unveils distinct sex-related metabolic patterns in NAFLD. Front Endocrinol. 2023 Oct 3;14:1230457. [CrossRef]
- Balcar L, Scheiner B, Fulgenzi CAM, D’Alessio A, Pomej K, Roig MB, et al. A meta-analysis and real-world cohort study on the sex-related differences in efficacy and safety of immunotherapy for hepatocellular carcinoma. JHEP Reports. 2024 Feb;6(2):100982. [CrossRef]
- Erlandsen EJ, Randers E. Reference intervals for plasma cystatin C and plasma creatinine in adults using methods traceable to international calibrators and reference methods. Clinical Laboratory Analysis. 2018 Jul;32(6):e22433. [CrossRef]
- Krishnan A, Woreta TA, Vaidya D, Liu Y, Hamilton JP, Hong K, et al. MELD or MELD-Na as a Predictive Model for Mortality Following Transjugular Intrahepatic Portosystemic Shunt Placement. J Clin Transl Hepatol. 2022 Jul 13;000(000):000–000. [CrossRef]
- Varnaccia G, Manz K, Zeiher J, Rattay P, Lange C. Risky Alcohol Consumption and Heavy Episodic Drinking among Parents in Germany: Results of a Nationwide Cross-Sectional Study. Journal of Environmental and Public Health. 2019 Dec 5;2019:1–13. [CrossRef]
Figure 1.
characterization of study cohort. The composition of the cohort under study (A) is presented in a pie chart. The survival probability for both sexes (B) over an 8-year period following biopsy is broken down by entity. The clinical description of the cohort is supplemented by the MELD score (C), and the Child–Pugh classes (D).

Figure 2.
Cancer associated marker concentrations in cirrhotic subgroups. Tumour-associated biomarkers categorised as AFP (A), GP73 (B), and HIF1A (C) [mmol/L], are listed logarithmically (A, C) and linearly (B) by entity. The left-hand y-axis shows cut-off values for HCC and healthy donors (HD), as reported in the literature. Data are presented as mean ± standard deviation (SD), with individual patient values overlaid as dots. P values (test by one-way ANOVA with post hoc multiple comparison) are indicated above the bars, with levels of significance denoted as ns– ****.

Figure 3.
NMR-based metabolic analysis in cirrhotic subgroups. The bar chart depicts (A) Phosphatidylcholine, (B) Glutamine, (C) Ornithine, (D) Histidine, (E) Glucose, (F) Lactic acid, (G) Albumin and (H) Creatinine expression levels, with the highest values observed in HCC, followed by CA, MetALD and healthy controls, whereas levels are decreased in MASLD and lowest in the Immune cohort. Data are presented as mean ± standard deviation (SD), with individual patient values overlaid as dots. P values (test by one-way ANOVA with post hoc multiple comparison) are indicated above the bars, with levels of significance denoted as ns– ****.

Figure 4.
AA/3HB-ratio ratio as a clinical feature. (A-B) Acetoacetate/3-hydroxybutyrate ratio measured by NMR in all subgroups. The ratios of females to males are additionally compared and stratified by entity. The classification of the study’s own references was performed according to the Youden index (A), whereas the categorization was based on the median (B) for each sex, as displayed on the right-hand Y-axis. Data are presented as mean ± standard deviation (SD), with individual patient values overlaid as dots. P values (test by one-way ANOVA with post hoc multiple comparison) are indicated above the bars, with levels of significance denoted as ns– ****.

Figure 5.
A comparison of the observed differences in sex-specific clustering in women. Tumour-assosciated marker, cancer stem cell (CSC) marker and metabolomics in female subjects associated with liver cell damage like carcinogenic (A) and alcohol-related (B) were shown as heatmaps. For the purpose of enhancing visibility, the correlation coefficient r is assigned a colour code ranging from 0.5 (blue) to 1 (yellow), with values below 0.5 (r<0.5) being concealed (white). The purpose of this is to render the clustering more clearly visible. This is complemented by the higher prevalence of GP73 (C) in women and the increase in MELD 3.0 compared with the previous MELD score in women (D). Q–Q plot comparing predicted and actual values for female MELD and MELD 3.0, with predicted values on the y-axis and actual values on the x-axis, showing a slight S-shaped deviation of data points around the reference line (E). Kaplan–Meier survival curve for MetALD and cancer-related causes in female patients with a MELD score ≥15 over an 8-year period following biopsy, as shown in (F), demonstrates lower survival in females than in males.

Disclaimer/Publisher’s Note: The statements, opinions and data contained in all publications are solely those of the individual author(s) and contributor(s) and not of MDPI and/or the editor(s). MDPI and/or the editor(s) disclaim responsibility for any injury to people or property resulting from any ideas, methods, instructions or products referred to in the content. |
© 2026 by the authors. Licensee MDPI, Basel, Switzerland. This article is an open access article distributed under the terms and conditions of the Creative Commons Attribution (CC BY) license (http://creativecommons.org/licenses/by/4.0/).
Copyright: This open access article is published under a Creative Commons CC BY 4.0 license, which permit the free download, distribution, and reuse, provided that the author and preprint are cited in any reuse.


