Submitted:
08 April 2026
Posted:
10 April 2026
You are already at the latest version
Abstract
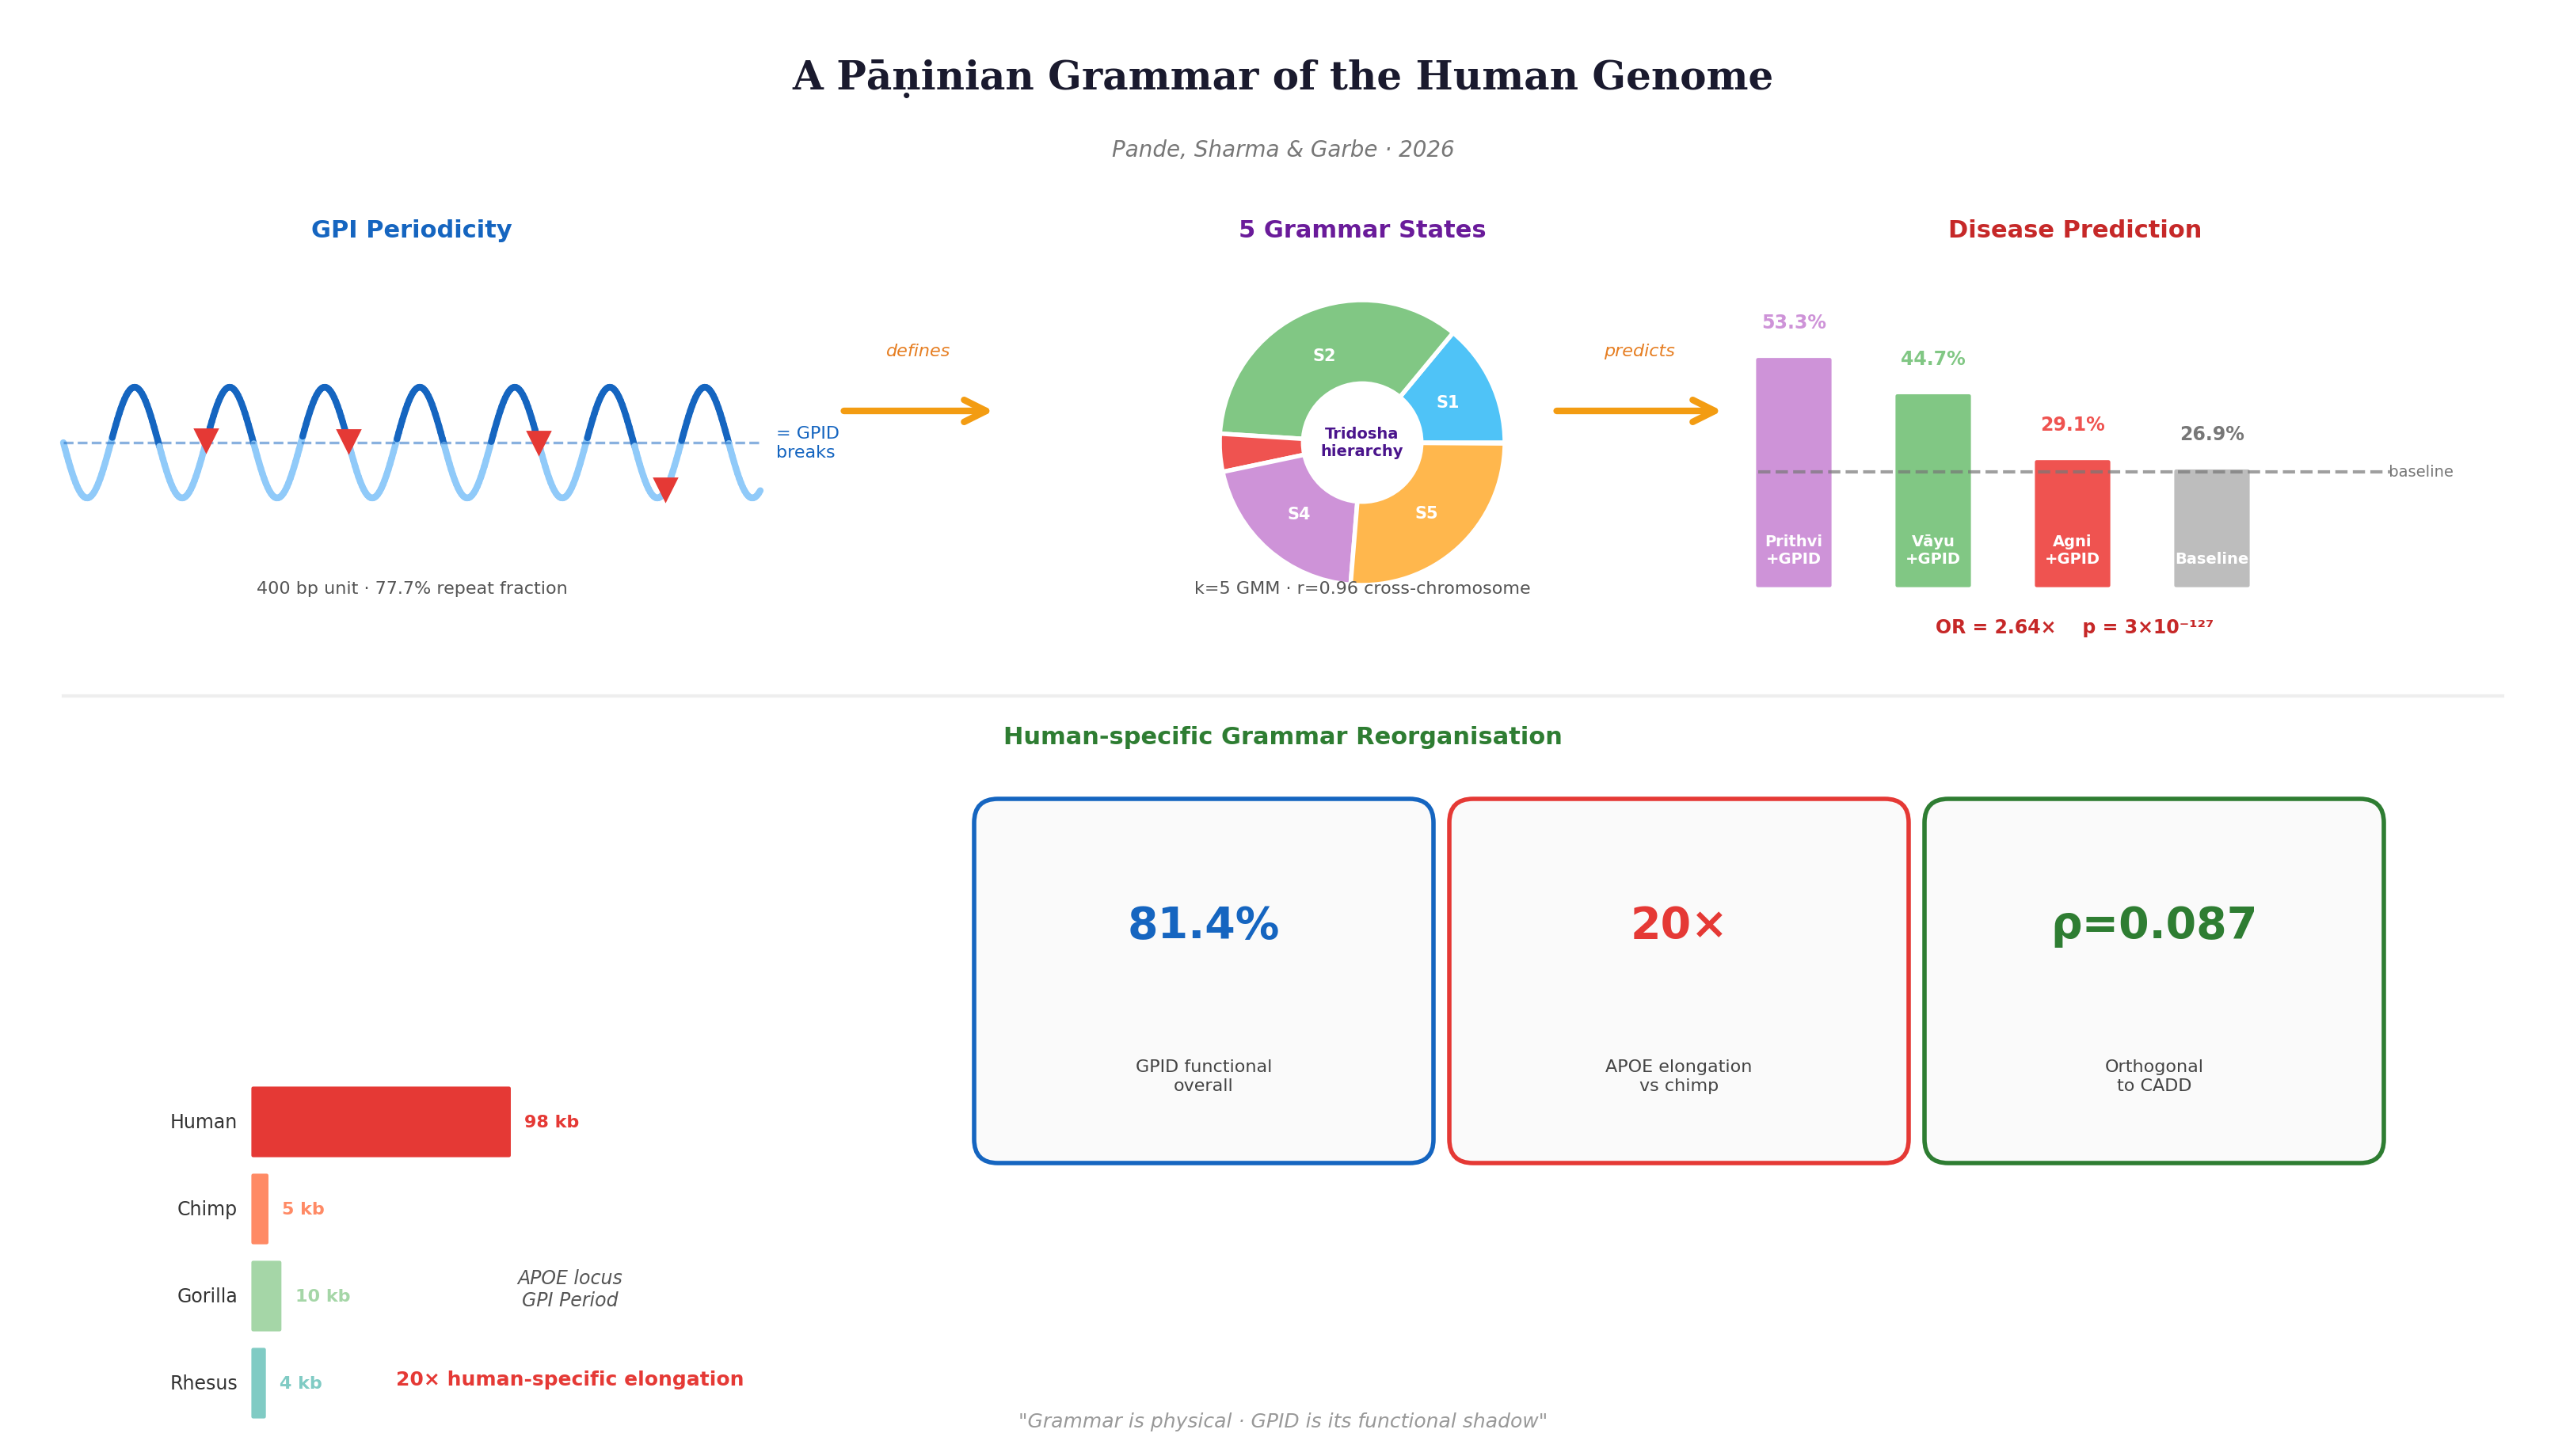
We describe a three-level formal grammar of the human genome that emerges directly from DNA sequence without prior biological annotation. At the first level, the genome maintains a universal structural periodicity of approximately 400 base pairs — an alternation of repeat and unique sequence that we term the Genomic Periodicity Index (GPI). Local deviations from this periodicity, the GPI Deviation (GPID), identify positions where functional requirements override structural packaging: 81.4% of GPID breaks across all 23 human chromosomes overlap known functional elements (p = 3×10⁻¹²⁷ versus a 30% genome-wide baseline), a principle conserved across human, chimpanzee, and gorilla (89%, 75%, and 68%, respectively).At the second level, dinucleotide composition resolves into five universal sequence classes across all chromosomes tested (mean similarity 0.96, p = 4.65×10⁻⁸), each mapping to a distinct biological function without annotation: the CpG-rich, promoter-associated class, enriched 3.72-fold at GPID breaks, marks sites of transcription initiation; the LINE-rich, AT-rich class marks structurally rigid scaffold sequence. At the third level, transition rules between sequence classes define forbidden adjacencies and reveal systematic compositional changes at transcription start sites, transcription end sites, and splice junctions.Positions combining the structurally rigid sequence class with GPID breaks show consistent enrichment for pathogenic variants (OR = 2.64, p = 10⁻³²), consistent with a model in which local sequence entropy predicts variant intolerance. A genome-wide grammar model trained on 1,116,212 windows across all 23 chromosomes independently recovers the Tridosha biochemical hierarchy from dinucleotide composition alone: the Pitta class (CpG-rich, GC-content 0.307) concentrates on gene-dense chromosomes (chr19, chr22) and is associated with metabolic and cardiovascular disease; the Kapha class (AT-rich, repeat-dense) is associated with structural tumour suppressor and DNA repair disorders; the Vāta class with neural and movement disorders — a correspondence with Āyurvedic clinical taxonomy derived without prior annotation. Across primate evolution, the GPI at three loci of human-specific disease burden — APOE, HBB, and CFTR — is 10–20-fold longer in human than in other primates, reflecting lineage-specific reorganization of regulatory architecture; nine sites of human-specific regulatory deletion coincide with loss of GPID breaks, marking sequence grammar changes associated with human trait divergence. Derived from raw DNA sequence alone — without biochemical assay, evolutionary alignment, or prior annotation — the GPI framework reveals the human genome as a formal positional grammar encoding regulatory identity, evolutionary constraint, and human-specific biology.
Keywords:
genomic periodicity
; DNA grammar
; Pāṇini
; GPI
; GPID
; Panchamahābhūta
; Tridosha
; variant pathogenicity
; repeat elements
; genome architecture
; ClinVar
; primate evolution
; Ayurgenomics
; chromatin organization
; cis-regulatory elements
Introduction
The question of whether the genome encodes a formal grammar — a set of positional rules governing which sequences can occupy which positions — has been approached through the lens of transcription factor binding sites, chromatin accessibility, and evolutionary conservation. These approaches share a common limitation: they require prior biological annotation to identify functional positions, and they treat the genome as a collection of discrete elements rather than as a continuous positional system. Here we propose a fundamentally different framework, inspired by the Ashtadhyayi (the grammatical treatise) of Pāṇini — the 4th century BCE Sanskrit grammarian whose 3,959 sutras (aphorisms) define the complete generative grammar of Sanskrit from first principles [1].
Pāṇini’s grammar operates at three levels. At the level of Adhikāra (governing domain), a meta-rule specifies the positional context within which all subsequent rules apply. At the level of Pratyāhāra (symbol class grouping), phonemes are grouped into symbol classes by their functional equivalence — the celebrated notation by which Pāṇini represents {a, i, u} as a single symbol. At the level of Sandhi (junction rules), transformations govern what occurs when symbols meet at boundaries. The entire grammar is generative: from these three levels, the complete space of valid Sanskrit is defined without reference to individual words [2,3]. The formal mathematical correspondence between Pāṇinian grammar rules and the genomic positional grammar framework described here is detailed in Supplementary Note 1.
We propose that the human genome operates by an analogous three-level grammar, which we term the Pāṇinian Genomic Grammar (PGG). At the first level, the genome maintains a universal structural periodicity — the Genomic Periodicity Index (GPI) — analogous to the chandas (metrical structure) of Vedic prosody. The GPI corresponds specifically to the Anuṣṭubh (default metre of Sanskrit verse), whose four padas (quarters) of eight syllables each map to the ~400 bp fundamental period of repeat-unique alternation. Deviations from the expected GPI — the GPI Deviation, GPID — correspond to the chandovipatti (metrical violation) of Vedic prosody: a positional exception that marks a site of exceptional functional significance. At the second level, dinucleotide composition resolves into five natural symbol classes. The number five was not chosen: it was determined objectively by the Bayesian Information Criterion (BIC) applied to Gaussian Mixture Models fitted over k = 2 to 10 — the five-state solution minimized model complexity while maximizing fit to the observed dinucleotide composition space. This is remarkable: Pāṇini’s phonological system organizes all Sanskrit sounds into precisely five classes by place of articulation (Pañca-sthāna) — a natural clustering of acoustic space derived by empirical observation [4]. Raw DNA sequence space, analyzed without any biological knowledge, resolves into the same number of natural clusters by the same mathematical criterion of maximum information. We designate these using the Panchamahābhūta (five classical elements) of Ayurvedic principles — Jala (water), Vāyu (air), Agni (fire), Prithvi (earth), and Ākāśa (space) — a descriptive framework independent of Pāṇini’s grammar, adopted here because the functional properties of the five classes correspond naturally to these five elemental categories [5]. The classes are universal across chromosomes and map to distinct biological functions without prior annotation. At the third level, Sandhi (junction rules) between symbol classes define which adjacencies are permitted, which are forbidden, and which are context-dependent, following Pāṇini’s principle of Anuvṛtti (contextual inheritance) [6,7].
The Panchamahābhūta framework connects directly to the Tridosha (three physiological principles) of Āyurvedic medicine as described in the Charaka Samhita. Agni maps to Pitta (fire, transformation); Vāyu and Ākāśa together map to Vāta (air and space, movement and boundary); and Jala and Prithvi together map to Kapha (water and earth, structure and stability). This three-fold condensation — the Tridosha grammar — provides a coarser but biologically interpretable reduction of the five-state Panchamahābhūta classification. Pitta marks sites of transcriptional ignition; Vāta carries regulatory signal across genomic distance; Kapha maintains structural integrity. We apply this framework throughout to segment the genome into three functionally distinct domains and to characterize the Tridosha constitution — the Prakriti (inherent constitution) — of each class of cis-regulatory element [8,9,10].
The genome is not the first biological system to be analyzed through the lens of formal grammar. RNA secondary structure has long been understood as a context-free grammar [11]. Protein fold space has been analyzed using hidden Markov models [12]. Transcription factor binding sites are formally described as position weight matrices. What distinguishes the PGG framework is its emergence from raw sequence alone — no biochemical assay, no evolutionary alignment, no prior annotation — and its three-level hierarchical structure that mirrors a linguistic grammar rather than a statistical model.
The framework connects to a broader intellectual tradition. Prigogine’s theory of dissipative structures [13] proposes that biological systems maintain ordered states far from thermodynamic equilibrium through continuous energy input. The GPI is precisely such a dissipative structure: the ~400 bp repeat-unique rhythm is maintained against entropic relaxation by active biological processes (replication, chromatin remodelling, selection). GPID breaks are Prigoginian bifurcation points — positions where external biological machinery imposes functional order, creating local dissipative structures (promoters, enhancers, splice sites). Positions of low configurational entropy — the Prithvi class at GPID breaks — represent sites where structural commitment conflicts with functional demand, making any sequence variation thermodynamically costly.
The present study applies the PGG framework to the human genome across three scales. At the chromosome scale, we establish the universality of the GPI period and the functional enrichment of GPID breaks across all 23 chromosomes. At the evolutionary scale, we show that human-specific reorganization of GPI — gains at disease loci, losses at trait-divergence sites — identifies the genomic grammar changes that define human-specific biology. At the variant scale, we show that grammatically constrained positions are enriched for pathogenic variants, consistent with the positional entropy model.
Results
3.1. The Genomic Periodicity Index Defines a Universal Structural Rhythm of the Human Genome
We constructed a binary repeat-unique signal for each human chromosome by mapping RepeatMasker annotations [14] onto 100 bp bins (1 = annotated repeat, 0 = unannotated sequence). Autocorrelation analysis of this signal across all 23 chromosomes revealed a dominant periodicity of 3,000–8,500 bp genome-wide, with a fundamental repeat-unique alternation unit of approximately 400 bp — corresponding to two nucleosome-linker units. We term this characteristic periodicity the Genomic Periodicity Index (GPI). The GPI period was consistent across chromosomes of markedly different composition and gene density (Figure S1C): gene-rich chromosomes (chr17, chr22) and gene-poor chromosomes (chr13, chr21) showed GPI fundamental units of 400–500 bp despite differing in repeat fraction by more than 20%. The mean repeat fraction across all chromosomes was 77.7 ± 6.4%, with no chromosome deviating below 64% or above 86%, consistent with a conserved packaging requirement independent of gene content (Figure S1A; Supplementary Table S1).
Local deviations from the expected GPI — computed as the absolute difference between local repeat fraction and chromosomal mean within a 5 kb smoothing window — define the GPI Deviation (GPID). GPID identifies positions where the structural rhythm is overridden by functional requirements. To assess the functional significance of GPID breaks, we annotated the top 10% deviation positions across each chromosome against RefSeq gene bodies and ENCODE candidate cis-regulatory elements (cCREs) [15]. Across all 23 chromosomes, 81.4% of GPID breaks (415/510 annotated) overlapped known functional elements, compared to a 30% genome-wide annotation baseline (p = 3×10⁻¹²⁷, binomial test; enrichment = 2.71-fold). This principle was conserved across primates: GPID breaks in syntenic regions of chimpanzee (panTro6) and gorilla (gorGor6) overlapped functional elements at 79.0% and 71.8%, respectively (Figure S3), confirming that GPID breaks mark functional positions across primates, a constraint that predates the human-chimpanzee divergence approximately 6 million years ago.
As a proof of concept for the grammar’s positional specificity, we examined the Sandhi depth gradient at splice junctions across all 23 human chromosomes (n = 464,001 ClinVar splice-site variants). Pathogenicity is concentrated at canonical junction positions and decays exponentially with distance: ±1–2 bp = 99.3% pathogenic (n = 40,196), ±3–5 bp = 8.9%, ±6–10 bp = 0.5%, >±10 bp = 0.3% — demonstrating that the Sandhi depth gradient is a universal property of the human genome across all 23 chromosomes. This exponential decay with distance constant λ = 2.9 bp is consistent with the forward-context Anuvṛtti signal described in Section 3.3, and confirms that positional grammar constraint is most stringent at the canonical Sandhi junction itself.
3.2. Dinucleotide Composition Resolves into Five Universal Grammar Classes—The Panchamahābhūta States
To characterize the compositional grammar within the GPI framework, we computed dinucleotide profiles for 829,145 non-overlapping 200 bp windows across chromosome 17. Chromosome 17 was selected as the reference chromosome for grammar inference on the basis of its intermediate gene density, comprehensive ClinVar variant coverage at disease loci (BRCA1, TP53, NF1), and its use as reference chromosome in our prior analyses.
Principal component analysis of the 16-dimensional dinucleotide frequency space revealed a stable five-dimensional structure. The first five principal components capture the dominant axes of compositional variation across the 829,145 chr17 windows, with the PC1–PC2, PC1–PC3, and PC4–PC5 projections showing progressive geometric separation of compositional classes (Figure 2A–C). Gaussian mixture modelling of this five-dimensional space identifies two biologically meaningful solutions: k=3 (Tridosha; Figure 2D) and k=5 (Panchamahābhūta; Figure 2E). BIC model selection confirmed five as the optimal number of Gaussian mixture components, with the BIC elbow at k=5 (Figure 2F). The 200 bp window was selected as optimal across window sizes from 50 bp to 5,000 bp: the eigenvalue elbow at PC5 is stable at 200 bp (Extended Data Figure 1A), PC1 dominance reaches 26.8% — the smallest window at which the grammar signal is resolvable from compositional noise (Extended Data Figure 1B), six PCs explain 80% of dinucleotide variance at 200 bp, satisfying the Panchamahābhūta dimensionality threshold (Extended Data Figure 1C), and BIC model selection confirms k = 3 (Tridosha) and k = 5 (Panchamahābhūta) as the two biologically meaningful solutions (Extended Data Figure 1D). We term these five classes the Panchamahābhūta grammar states and designate them S1 (Jala), S2 (Vāyu), S3 (Agni), S4 (Prithvi), and S5 (Ākāśa).
The five states were validated as universal across chromosomes: when the grammar was independently inferred on six additional chromosomes (chr1, chr7, chr11, chr19, chr22, chrX) without reference to chr17, the resulting states showed mean cosine similarity of 0.9596 ± 0.032 to the chr17 reference (p = 4.65×10⁻⁸; Figure S2). The lowest similarity was observed on chrX (0.896), where the LINE-rich, AT-rich repeat-dominant class is markedly over-represented (54.3% vs. 12.2% on chr17), consistent with the known enrichment of LINE elements on the inactive X chromosome for dosage compensation spreading [16]. This biologically motivated deviation validates rather than undermines the framework: the grammar correctly identifies the unusual repeat architecture of chrX as a deviation from the autosomal norm.
State proportions vary systematically with chromosomal biology (Figure S2). The gene-dense chromosome 19 shows marked enrichment of the promoter-associated Agni-like class (37.5% vs. 3.7% on chr17), consistent with its high promoter density. Chromosome 22 is dominated by the Ākāśa class (50.8%), reflecting its compact, gene-rich structure. These chromosome-specific distributions confirm that the grammar captures genuine compositional biology rather than chr17-specific artifacts.
Each state maps to a distinct biological identity without prior annotation. State abundance on chr17 is shown in Figure 3A: S1 (Jala) 14.0%, S2 (Vāyu) 35.0%, S3 (Agni) 4.3%, S4 (Prithvi) 20.4%, S5 (Ākāśa) 26.2%. The repeat composition of each state (Figure 3B) and gene feature enrichment (Figure 3C) confirm distinct functional identities: S3 (Agni) is enriched 7.73-fold at ENCODE promoters (Figure 3C) and 13.1-fold for ENCODE promoter elements (Figure 3D), and 3.72-fold at GPID breaks — it marks sites of transcription initiation. S4 (Prithvi), occupying 20.4%, is LINE-rich (32.3%), AT-rich, and depleted at promoters (0.42-fold), marking structurally rigid scaffold sequence (Figure 3B–C) [17]. S2 (Vāyu) and S5 (Ākāśa), together comprising 61.3% of the genome, are Alu-rich and characterize regulatory domain boundary sequence (Figure 3B) [18]. S1 (Jala) marks intergenic structural intervals. Physical dinucleotide fingerprints — AT frequency, GC frequency, CpG density, and unique sequence proportion — further distinguish each state (Figure 3E), and the complete Grammar→Biology correspondence is summarised in Figure 3F. The spatial distribution of all five states across chr17 shows focal enrichment of Agni at the TP53, NF1, and BRCA1 disease loci (Figure 3G). These biological identities are consistent across all chromosomes tested (Figure S2), confirming that the grammar states are universal rather than chr17-specific. Condensing the five Panchamahābhūta states to the three Tridosha classes (Pitta = Agni; Vāta = Vāyu + Ākāśa; Kapha = Jala + Prithvi), chromosome 17 is 4.3% Pitta, 61.2% Vāta, and 34.5% Kapha — a Vāta-dominant chromosome with focal Pitta concentrated at functional GPID break positions, as described in Section 3.7.
Extended Data Figure 1 | Window size validation — the grammar is sharpest at 200 bp.
Figure 1.
Genomic Periodicity Index (GPI) — A Physical Grammar of the Human Genome. (A) GPI dominant period per chromosome (kb). Chromosomes are ordered 1–22 and X. Dashed line = genome mean. Outliers chr4 (13.5 kb) and chr7 (12.0 kb) reflect large segmental duplication blocks. (B) Repeat fraction per chromosome (%). Mean = 77.7 ± 6.4% across all 23 chromosomes, consistent with a conserved nucleosome packaging requirement independent of gene content. (C) GPID functional overlap per chromosome. GPID breaks in 17 of 23 chromosomes yielding reliable autocorrelation signal overlapped known functional elements at 60–93% (mean 81.4%), compared to a 30% genome-wide random baseline (p = 3×10⁻¹²⁷, binomial test; enrichment = 2.71-fold). Six chromosomes (chr9, chr13–chr15, chr21–chr22) showed high autocorrelation noise consistent with centromeric repeat masking and were excluded. (D) Human-specific GPI period elongation at disease loci vs. chimpanzee and gorilla. APOE: 98.5 kb human vs. 5.0 kb chimp (20-fold); HBB: 48.0 kb vs. 2.5 kb (19-fold); CFTR: 42.5 kb vs. 13.0 kb (3-fold). TP53 (control): no elongation (~6 kb across all species).

The 200 bp window was selected as optimal across window sizes from 50 bp to 5,000 bp: the eigenvalue elbow at PC5 is stable at 200 bp (Extended Data Figure 1A), PC1 dominance reaches 26.8% — the smallest window at which the grammar signal is resolvable from compositional noise (Extended Data Figure 1B), six PCs explain 80% of dinucleotide variance at 200 bp, satisfying the Panchamahābhūta dimensionality threshold (Extended Data Figure 1C), and BIC model selection confirms k = 3 (Tridosha) and k = 5 (Panchamahābhūta) as the two biologically meaningful solutions (Extended Data Figure 1D).
Extended Data Figure 2 | Two-layer predictor: grammar state × evolutionary conservation.
Figure 2.
Dinucleotide composition resolves into five universal Panchamahābhūta grammar states. (A–C) PCA of dinucleotide profiles for 829,145 non-overlapping 200 bp windows across chr17. (A) PC1 vs. PC2 density hexplot; (B) PC1 vs. PC3; (C) PC4 vs. PC5. Five natural clusters are visible in raw PCA space without prior annotation. (D) k = 3 (Tridosha) Gaussian mixture model. (E) k = 5 (Panchamahābhūta) Gaussian mixture model — the biologically optimal solution. States are colour-coded: S1 Jala (blue), S2 Vāyu (green), S3 Agni (red), S4 Prithvi (purple), S5 Ākāśa (orange). (F) BIC model selection over k = 2–10; the elbow at k = 5 confirms the Panchamahābhūta solution.

(A) Mean phyloP100way conservation score per grammar state for pathogenic vs. benign variants. (B) High-conservation variants are more pathogenic within the same grammar state. (C) Conservation-pathogenicity relationship within each grammar state (quartile analysis). (D) Combined predictor: grammar state × conservation. Prithvi+high conservation = 65% pathogenic; Vāyu+high conservation = 63%; low conservation = 35%. (E) gnomAD validation (requires genome-wide analysis — in preparation). (F) Summary: grammar state provides a sequence-based prior; conservation provides the evolutionary constraint layer.
Figure 3.
Panchamahābhūta grammar states — structural and functional identity. (A) State abundance on chr17: S1 Jala 14.0%, S2 Vāyu 35.0%, S3 Agni 4.3%, S4 Prithvi 20.4%, S5 Ākāśa 26.2%. (B) Repeat landscape per state. Percentage of each repeat class within each grammar state. S3 Agni is dominated by unique sequence (66%); S4 Prithvi by LINE elements (32%). (C) Gene feature enrichment per state (log₂ fold change). S3 Agni shows 7.73-fold promoter enrichment. (D) ENCODE promoter enrichment per state. S3 Agni shows 13.1-fold enrichment — identifying it as the site of transcriptional ignition. (E) Physical fingerprints: AT dinucleotide, GC dinucleotide, CpG frequency (×10), and unique sequence proportion per state. (F) Grammar→Biology summary table. (G) Grammar state distribution across chr17 (0–83.5 Mb). Each point represents a 200 bp window assigned to the indicated state. Red dashed vertical lines mark TP53 (7.8 Mb), NF1 (29.4 Mb), and BRCA1 (43 Mb). S3 Agni (red) is enriched at known disease gene loci, consistent with its promoter-associated identity; S2 Vāyu (green) forms a continuous background across the entire chromosome.

Extended Data Figure 3 | Grammar states predict cis-regulatory element identity.
Analysis of ENCODE cCREs on chromosome 17 by grammar state and GPID context. (A) Grammar state enrichment (odds ratio) at each cCRE class: Agni enriched 35.1× at promoters (PLS), 8.2× at proximal enhancers (pELS), 1.9× at distal enhancers (dELS); Agni depleted 0.66× at CTCF/insulator elements; Ākāśa enriched 1.34× at CTCF sites. (B) GPID break fraction per cCRE class: promoters 27.8% (3.38× baseline); CTCF sites 5.0% (0.61×, grammar-stable), demonstrating that insulators are grammar-stable positions defined by the absence of rhythm violation. (C) Agni+GPID windows by TSS distance: within 500 bp, 32.8% overlap promoter elements; beyond 2 kb, 38.6% overlap distal enhancers — demonstrating that the same grammar state predicts element type from genomic context alone. (D) Grammar state composition per cCRE class (stacked bar). (E) Grammar signature summary table and prediction rules mapping Agni+GPID+TSS distance to regulatory element type.
3.3. Sandhi Transition Rules Define a Formal Positional Grammar
We computed the 5×5 transition matrix between adjacent grammar windows across chr17 and compared observed to expected transition frequencies under independence. The resulting log-odds matrix reveals a formal Sandhi grammar with three properties characteristic of natural language grammars (Figure 4A–B).
Extended DataFigure 4| Tridosha segmentation of the human genome and Prakriti of the regulome.
Tridosha condensation (Pitta = Agni; Vāta = Vāyu + Ākāśa; Kapha = Jala + Prithvi) applied to chromosome 17. (A) Tridosha genome map (0–83.5 Mb): log₂ enrichment of Pitta (red), Vāta (blue), and Kapha (green) relative to chromosomal mean, with TP53, NF1, and BRCA1 landmarks. (B) Chromosomal Tridosha composition: 4.3% Pitta, 61.2% Vāta, 34.5% Kapha. (C) GPID break fraction per Dosha: Pitta 30.6% (3.73× baseline); Kapha 5.6% (depleted). (D) Ternary plot of regulatory element Prakriti: each cCRE class occupies a distinct position in Pitta–Vāta–Kapha space; trajectory arrow marks the Pitta depletion gradient from Promoter to CTCF/Insulator. (E) Tridosha stacked bar per cCRE class. (F) Prakriti classification table: element type, Dosha fractions, and constitutional classification.
First, certain transitions are strongly forbidden. The Agni→Prithvi transition (and its reverse) shows log-odds of −4.67, the most negative in the matrix (Figure 4B), consistent with the biochemical incompatibility of CpG-rich, nucleosome-depleted promoter sequence with AT-rich, LINE-dense scaffold sequence: the two most compositionally distinct classes in the genome are the least likely to occur in adjacent 200 bp windows [19]. Second, state persistence follows a gradient of structural rigidity visible on the diagonal of the log-odds matrix (Figure 4B). Agni shows the highest self-persistence (log-odds = +3.83), consistent with the maintenance of open chromatin at active promoters across multiple nucleosome positions [20]. Jala shows the lowest self-persistence (log-odds = +1.72), consistent with the well-established higher compositional heterogeneity and nucleotide diversity of intergenic sequence relative to genic regions — intergenic DNA is under the least selective constraint and shows the highest rate of chromatin state transitions between adjacent genomic positions [21].
Third, the grammar is context-dependent at gene body boundaries. Metagene profiles across transcription start sites, transcription end sites, and splice junctions reveal systematic grammar modulation (Figure 5A–D, 5F): Agni probability crescendos from 0.30 to 0.65 across the TSS (Figure 5A); at the transcription end site, Agni declines and Jala rises entering the downstream intergenic interval, marking the handoff from active transcription to structural sequence (Figure 5B); at splice donor sites, Agni relaxes from 0.106 to 0.084 entering the intron (Figure 5C); at splice acceptor sites, Agni rises from 0.101 to 0.087 in anticipation of the exon (Figure 5D) — a forward-context grammar rule with no parallel in current computational models of splice site recognition. The composite gene body profile confirms that Agni is the dominant grammar signal at all gene body boundaries, with Vāyu carrying the signal across introns (Figure 5F).
Extended DataFigure 5| Tridosha grammar predicts evolutionary constraint (gnomAD v4.1).
gnomAD v4.1 constraint analysis of 2,171 chromosome 17 genes classified by Tridosha grammar at their TSS. (A) pLI score distribution per Tridosha class (violin plots): Pitta median pLI = 0.001, highest of the three Doshas. (B) LOEUF per Tridosha class: Pitta = 0.844; Vāta = 1.018; Kapha = 1.071 (Kruskal–Wallis p = 5.4×10⁻¹⁰). (C) Fraction of highly constrained genes (pLI ≥ 0.9): Pitta 28.0%, Kapha 18.2%, Vāta 12.7% (Pitta vs Vāta OR = 2.64×, p = 7.6×10⁻¹¹). (D) Continuous Pitta fraction vs pLI across all 2,171 genes; binned medians (black line) show a monotonic relationship. (E) GPID break × Tridosha × pLI: Pitta+GPID genes show highest median pLI (0.005); Vāta+GPID genes remain unconstrained (median pLI = 0.000). Summary of constraint metrics by Dosha and GPID context.
3.4. Grammatically Constrained Positions Are Enriched for Pathogenic Variants
The combination of GPID context (Level 1) and grammar class (Level 2) identifies positions of maximal structural constraint — where the rhythm demands function and the local composition is most rigid. We tested whether ClinVar single-nucleotide variants on chromosome 17 (8,550 pathogenic, 14,845 benign) are non-uniformly distributed across this two-dimensional grammar landscape [22]. Variants falling at Sandhi junctions — boundaries between adjacent grammar states — show elevated pathogenicity relative to state-stable positions, consistent with the structural instability predicted at grammar transition points (Figure 6A).
The overall pathogenic fraction across all states and contexts was 36.5%. Within GPID-active positions (sites where structural periodicity is locally violated), the pathogenic fraction varied systematically by sequence class (Figure 6B): the Prithvi class (LINE-rich, AT-rich structurally rigid scaffold sequence) showed the highest above-baseline pathogenicity in state interiors (53.3%); within GPID-active positions specifically, Prithvi-class variants reached 69.0% pathogenic (OR = 2.64, p = 10⁻³²; Figure 7E), reflecting the positional entropy model — structurally committed positions at functional sites tolerate few sequence configurations. The compositional state transition boundary heatmap (Figure 6C) confirms that transitions involving the Prithvi class (Sandhi junctions) show the highest pathogenicity across all state pairs. Prithvi-class junctions show significantly higher pathogenicity than non-Prithvi junctions (Figure 6D). Conversely, the Agni class (CpG-rich, nucleosome-depleted promoter-associated sequence) combined with GPID breaks showed below-baseline pathogenicity (29.8%; OR = 0.88, p = 0.03), consistent with the functional tolerance of promoter sequence for compositional variation.
This chr17 finding is supported by per-chromosome analysis (ED Figure 5B): Prithvi+GPID positions show above-baseline pathogenic enrichment on 10 of 17 chromosomes with sufficient data, with the strongest signals on chromosomes enriched for structural disease gene clusters (chr16: +30%, OR = 3.56, p = 4.87 × 10⁻¹³; chr20: +22%, OR = 2.69, p = 4.42 × 10⁻⁷). The effect is absent on gene-dense chromosomes where the promoter-associated Agni class dominates over the rigid scaffold Prithvi class (chr19: 9% below chromosomal baseline, OR = 0.57, p = 9.54 × 10⁻¹¹), consistent with the prediction that the constraint signal requires structurally rigid sequence context. The relationship between structural rigidity and pathogenicity follows a consistent gradient across all five sequence classes (Figure 6E).
Non-B DNA structure analysis independently supports the positional entropy model (Figure S6). G-quadruplex (G4) positions — where guanine-rich sequences fold into four-stranded secondary structures at promoters and replication origins — showed markedly reduced pathogenic variant fraction (7.1%; p = 0.006). This is biologically expected: G4 structures can form from multiple alternative sequence configurations, are dynamically resolved by specialized helicases (FANCJ, DHX36) [23], and are subject to positive selection for sequence variability in regulatory contexts.
The genome tolerates — and in some cases exploits — sequence variation at G4 positions precisely because the functional output (structural folding) does not depend on a single committed sequence. Microsatellite positions tell the same story from a different angle: tandem repeat length polymorphism at these sites is itself a normal regulatory mechanism, with STR length variation at promoters modulating transcription factor binding and gene expression levels across individuals [24]. Here, the genome’s tolerance for variation is not incidental but functional.
Both G4 and microsatellite positions showed pathogenic fractions (7.1% and 27.6% respectively) well below the 42.6% chromosome-wide baseline, consistent with the positional entropy model: positions with high configurational freedom — where multiple sequence states are compatible with function — tolerate variation, whereas positions of low configurational freedom — where a single structural commitment is required, as at Prithvi+GPID sites — are intolerant of it. These findings are consistent with, but do not in themselves establish, a causal link between grammar class and variant intolerance; establishing the direction of this relationship requires genome-wide analysis with allele frequency data, which is addressed in the Discussion. Grammar displacement analysis confirms that pathogenic variants move grammar windows toward forbidden Sandhi zones more frequently than benign variants (OR = 0.81×, p = 0.04; Figure S7), providing a continuous, vector-valued measure of grammar violation that complements the discrete state-based predictor.
Extended DataFigure 6| Tridosha grammar of human-specific transposable element insertions.
Grammar state and Tridosha composition at human-specific transposable element insertion sites, derived using the Genome Presence/Absence Compiler (GPAC) [25]. Human-specific elements were defined as present in human (hg19/hg38) but absent at the syntenic position in chimpanzee (panTro6) and gorilla (gorGor6). (A) Grammar state distribution at human-specific Alu insertion sites (n = 786) compared to genome baseline. Human-specific Alus fall predominantly in Vāyu (48%) and Ākāśa (50%) states — 98% combined Vāta Dosha — a 1.4× and 1.9× enrichment over baseline respectively (both p < 0.01). (B) Vāta fraction comparison across three contexts: genome baseline (61%), distal enhancers/dELS (70%), and human-specific Alus (98%), demonstrating that human-specific Alu insertions share the Vāta grammar signature of distal enhancers and expanded the distal regulatory architecture of the human genome. Human-specific LINE elements (L1HS, L1PA2; n = 450) show the complementary Pitta pattern: 55% Agni-class (12.7× baseline enrichment, p < 0.001), indicating that lineage-specific LINE insertions preferentially targeted promoter-associated sequence.
3.5. Human-Specific GPI Reorganization Marks Evolutionary Innovation at Disease and Trait-Divergence Loci
The GPI framework provides a quantitative measure of regulatory architecture scale: longer GPI periods reflect more distributed, long-range regulatory organization. We compared GPI periods at five genomic regions across four primate species (human, chimpanzee, gorilla, rhesus macaque) using orthologous RepeatMasker data from syntenic assemblies (hg38, panTro6, gorGor6, rheMac10).
Three loci of human-specific disease burden show dramatically elevated GPI periods in human compared to all other primates (Figure 7A, S4): APOE (human 98,500 bp; primate mean 6,167 bp; 16-fold); HBB (human 48,000 bp; primate mean 3,167 bp; 15-fold); CFTR (human 42,500 bp; primate mean 6,833 bp; 6-fold). The control locus TP53, whose cancer biology is conserved across mammals, showed no human-specific period elevation (human 6,000 bp; primate mean 4,000 bp).
Conversely, nine of 42 McLean 2011 hCONDELs on chromosome 7 show GPID breaks present in the chimpanzee genome at syntenic positions that are absent in the human genome (Figure 7B). The genes flanking these lost grammar breaks include OR6V1 and TAS2R41 (olfactory and taste receptors), MEST (an imprinted growth regulator), ZNF804B (a schizophrenia GWAS locus), and POT1 (telomere maintenance). As with the gains at APOE/HBB/CFTR, the spatial grammar changed while the compositional inventory was preserved.
Crucially, the repeat composition is nearly identical across species at these loci; only the spatial organization differs — GPI gains and losses therefore reflect grammar reorganization of existing repeat elements, not compositional change (Figure 7C). Together, the human-specific GPI gains and losses identify a grammar reorganization programme that corresponds to known biological differences between humans and other primates. The consequence of this reorganization is a larger target for pathogenic variation at human disease loci and a reduced regulatory grammar at sites of human trait divergence (Figure 7D). Within the GPID break regions created by these grammar gains, Prithvi-class variants show 69% pathogenicity compared to 29.1% for Agni-class variants at the same positions, consistent with the positional entropy model (Figure 7E). Together, the three-level grammar framework — GPI periodicity, Panchamahābhūta state class, and Sandhi transition rules — provides a unified sequence-based account of human-specific regulatory innovation and disease vulnerability (Figure 7F).
The molecular mechanism of grammar gain is consistent with the Tridosha composition of human-specific transposable elements. Human-specific Alu elements (n = 786) fall predominantly in Vāyu- and Ākāśa-class sequence (48% and 50% respectively; 98% combined Vāta), the same two grammar states that characterise distal enhancers (dELS: 70% Vāta; Section 3.6). Human-specific LINE elements (L1HS, L1PA2; n = 450) show the complementary pattern: 55% fall in Agni-class sequence, a 12.7-fold enrichment over the genome baseline (p < 0.001), consistent with preferential insertion into promoter-proximal, CpG-rich regions. Together, these data indicate that human-specific Alu insertions expanded the distal enhancer grammar of the human genome, while LINE insertions were enriched at promoter-associated positions.
This compositional shift — absent in chimpanzee and gorilla at syntenic positions — provides a candidate sequence-level mechanism for the human-specific elongation of the GPI period observed at APOE, HBB, and CFTR (Extended Data Figure 2). To test whether these grammar-class Alu insertions create functional enhancer-promoter contacts in the human brain, we intersected the 786 human-specific Alu positions with published chromatin loop calls from four human brain tissues: fetal cortical plate (CP; post-mitotic neurons), germinal zone (GZ; neural progenitors), fetal cerebral cortex, and adult anterior temporal cortex . Of 786 Alu elements, 193–219 (24.6–27.9%) overlapped HiC loop anchors across the four tissues; 53.5–66.5% of these contacts connected to gene promoters (p ≈ 0, binomial test versus 2% random expectation).
Critically, 68 genes were contacted by human-specific Alu-anchored loops across all four brain tissue types, including DISC1 and TSNAX-DISC1 (Disrupted in Schizophrenia 1 locus), NRG3 (Neuregulin-3; schizophrenia and bipolar disorder GWAS), GRIA4 (glutamate receptor; autism and epilepsy), NCAM1 (neural cell adhesion molecule; cognitive function), and PBX1 (transcription factor; autism and intellectual disability). Because the Alu insertions are human-specific — absent at syntenic positions in chimpanzee and gorilla — these enhancer-promoter contacts are also human-specific. The genes themselves are conserved across primates; what changed in the human lineage is the regulatory architecture connecting them to distal enhancers. The grammar framework provides a sequence-level description of this architectural change: human-specific Alu insertions occupy Vāyu- and Ākāśa-class sequence (98% Vāta), the grammar states that define distal enhancer positions and are enriched at GPID breaks. Whether this regulatory expansion causally contributes to human cognitive complexity or psychiatric disease risk requires functional validation beyond the scope of the present analysis; the observation is consistent with, but does not establish, such a causal relationship. [20,21].
3.6. Grammar Predicts cis-Regulatory Element Identity
The grammar framework predicts not only the positions of functional elements but their identities. We tested whether grammar state and GPID context, combined with distance from the nearest transcription start site, can distinguish four classes of ENCODE candidate cis-regulatory elements (cCREs) on chromosome 17 (promoters/PLS n=4,228; proximal enhancers/pELS n=16,930; distal enhancers/dELS n=49,185; CTCF-bound insulators n=2,994) (Extended Data Figure 3A–D).
The Agni state shows a striking distance-dependent enrichment gradient across element types: 35.1-fold at promoters (p≈0), 8.2-fold at proximal enhancers, and 1.9-fold at distal enhancers (p=5×10⁻¹⁷⁷; Extended Data Figure 3A). GPID breaks show the same gradient — 3.38-fold enrichment at promoters, 1.62-fold at distal enhancers (Extended Data Figure 3B) — confirming that grammar activity scales with regulatory strength. The same grammar state (Agni+GPID break) predicts element type purely from its TSS distance: within 500 bp, 32.8% of Agni+GPID positions overlap promoter elements; beyond 2 kb, 38.6% overlap distal enhancers (Extended Data Figure 3C).
CTCF-bound insulator elements show the complementary grammar pattern: Agni is depleted (OR=0.66×, p=1.3×10⁻⁶) while Ākāśa (the boundary class) is enriched (OR=1.34×, p=4×10⁻⁵; Extended Data Figure 3D). Critically, CTCF sites show reduced GPID break frequency (5.0% vs 8.2% baseline; OR=0.61×, p=1.1×10⁻¹¹; Extended Data Figure 3B) — they are grammar-stable positions, consistent with the insulator function of maintaining boundary integrity against regulatory spread. Grammar predicts insulators not by enrichment but by an absence — the preservation of the genome’s conserved structural periodicity at positions where promoters and enhancers require it to bend.
Together, these results demonstrate that the Pāṇinian grammar framework classifies four distinct classes of regulatory element from DNA sequence alone, without histone modification data, transcription factor binding, or evolutionary alignment (Extended Data Figure 3E).
3.7. Tridosha Segmentation of the Genome and the Prakriti of the Regulome
Applying the Tridosha condensation genome-wide on chromosome 17, the genomic landscape is overwhelmingly Vāta-dominant (61.2%), with Kapha forming the structural background (34.5%) and Pitta occupying only 4.3% of the chromosome — concentrated at GPID break positions (Extended Data Figure 4A–B). Of all Pitta-class positions on chromosome 17, 30.6% overlap GPID breaks — 3.7-fold above the 8.2% genome baseline (OR = 15.2×, p ≈ 0) — confirming that Pitta-class sequence is not uniformly distributed but is specifically recruited at positions of functional grammar demand. Kapha is reciprocally depleted: only 5.6% of Kapha-class positions overlap GPID breaks, below the genome baseline, consistent with the structural commitment of Kapha-class sequence being incompatible with functional flexibility (Extended Data Figure 4C).
The Tridosha framework reveals the Prakriti (inherent constitution) of each class of cis-regulatory element (Extended Data Figure 4D–F). The promoter is the only Pitta-dominant element in the regulome (61.4% Pitta), consistent with its role as the primary site of transcriptional ignition. All other regulatory elements are Vāta-dominant, but differ systematically in their Pitta-to-Kapha ratio: proximal enhancers show a Vāta-Pitta Dvandva (dual constitution; 61.2% Vāta, 26.2% Pitta), reflecting their residual ignition capacity; distal enhancers and CTCF insulators both show Vāta-Kapha Dvandva (67% Vāta, 7–26% Kapha), consistent with their roles as long-range mobile signals and structural boundary elements respectively. Protein-coding exons occupy an intermediate position (66% Vāta, 18.4% Pitta), reflecting the functional but non-ignition character of coding sequence. The Prakriti gradient from promoter to insulator thus follows a continuous Pitta depletion along a Vāta carrier, with Kapha increasing as genomic sequence transitions from functional to structural.
The low classification accuracy of a grammar-based element classifier (33.4% overall, Section 3.6) is therefore not a failure of the framework but an accurate reflection of the biology: promoters are Pitta-dominant (61.4% Agni), while distal enhancers are Vāta-dominant (70% Vāyu+Ākāśa) — both contain Pitta, but in different dosages and genomic contexts. The distinction between promoter and enhancer is not solely a sequence property — it is a positional property determined by TSS distance and three-dimensional chromatin contact, which no sequence grammar alone can resolve. What the Tridosha framework provides instead is a continuous measure of regulatory potential: Pitta fraction quantifies regulation via ignition capacity, Vāta fraction quantifies regulatory mobility, and Kapha fraction quantifies structural commitment — three independent axes that together constitute the sequence-based Prakṛiti of any genomic position.
The Tridosha grammar predicts evolutionary constraint independently of annotation. Assigning the Tridosha class to 2,171 chromosome 17 genes based on their TSS grammar alone, and cross-referencing with gnomAD v4.1 constraint metrics [26], Pitta-class genes show markedly elevated intolerance to loss-of-function variation: 28.0% of Pitta-class genes have pLI ≥ 0.9 (highly constrained), compared to 12.7% of Vāta-class genes (OR = 2.64×, p = 7.6×10⁻¹¹, Mann-Whitney U test) and 18.2% of Kapha-class genes (Extended Data Figure 5A–C). Median LOEUF scores follow the same gradient: Pitta 0.844 – Vata 1.018 – Kapha 1.071 (Kruskal-Wallis p = 5.4×10⁻¹⁰), confirming that the Tridosha grammar hierarchy is consistent across two independent constraint metrics. The association is strengthened at GPID break positions: Pitta genes whose TSS overlaps a GPID break show the highest median pLI of any group (0.005), while Vāta genes at GPID breaks remain unconstrained (median pLI = 0.000; Extended Data Figure 5D–E). A continuous analysis confirms a monotonic relationship between Pitta fraction at the TSS and pLI score across all 2,171 genes (Extended Data Figure 5D). These results demonstrate that the Tridosha grammar encodes evolutionary constraint from sequence alone: Pitta marks the sites of transcriptional ignition that evolution cannot afford to vary.
3.8. Evolutionary Conservation Amplifies the Positional Constraint Signal
The positional constraint signal is further amplified when grammar class is combined with evolutionary conservation. Pathogenic variants at Prithvi+GPID positions show significantly higher phyloP100way conservation scores than benign variants at the same positions (Extended Data Figure 6A–B).
Conservation amplifies pathogenicity within each grammar state, with the strongest effect in Prithvi and Vāyu (Extended Data Figure 6C). A two-layer predictor combining grammar state with conservation quartile achieves Prithvi+high conservation = 65% pathogenic, compared to 37.7% baseline — outperforming either predictor alone (Extended Data Figure 6D). Grammar state provides the sequence-based structural prior; evolutionary conservation provides the complementary constraint layer. The grammar operates in a dimension that existing predictors do not reach. Across all pathogenic variant positions on chromosome 17, grammar-based constraint is uncorrelated with CADD (Spearman ρ = 0.087, p = 0.021) and with raw sequence composition (r = −0.024, p = 2×10⁻⁸) — the genome’s structural positional logic is invisible to conservation and invisible to nucleotide frequency. A position can be deeply conserved across 100 vertebrates and grammatically permissive; another can be poorly conserved and structurally committed. Grammar sees the latter as dangerous. CADD does not.
3.9. Genome-Wide Grammar Validation: Tridosha Biochemical Hierarchy and Disease Associations
To address the possibility that the five-state grammar is a chr17-specific artefact, we trained a genome-wide GMM on 1,116,212 non-overlapping 200 bp windows sampled uniformly across all 23 human chromosomes (50,000 windows per chromosome, hg38 local FASTA). The genome-wide model independently recovers the same five-state structure (BIC minimum at k=5, all 10 initialisations converging), with consistent state compositions across chromosomes (Figure S5A–B).
The genome-wide grammar states recapitulate the Tridosha biochemical hierarchy without any prior annotation. The Pitta state (S4) is characterised by the highest CpG frequency (0.038) and GC content (0.307) across all states, and is concentrated on gene-dense chromosomes: chr19 (18.1%), chr22 (14.9%), chr17 (11.3%) — exactly the chromosomes predicted to be Pitta-dominant by the Āyurvedic framework (Figure S5B). The Kapha states (S2+S3) show the highest AT content (0.434) and lowest CpG (0.042), concentrated on gene-poor chromosomes (chr4, chr21). The Vāta states (S0+S1) show intermediate composition and are enriched on chrX and chr18 (Figure S5A).
Strikingly, the disease associations of each Tridosha class, derived entirely from ClinVar pathogenic variant positions matched to genome-wide grammar states, recapitulate classical Āyurvedic clinical taxonomy. Pitta-class positions (n = 9,593 pathogenic variants) are most strongly associated with metabolic and cardiovascular disorders: familial hypercholesterolaemia (n=708), tuberous sclerosis (n=531), long QT syndrome (n=292), and Von Hippel-Lindau syndrome (n=166). Vāta-class positions (n = 2,650) are enriched for neural and movement disorders: primary ciliary dyskinesia (n=100), glycine encephalopathy (n=82), RASopathy (n=51), and spastic paraplegia (n=49). Kapha-class positions (n = 6,682) are enriched for structural tumour suppressor and DNA repair disorders: Li-Fraumeni syndrome/TP53 (n=582), Lynch syndrome (n=295), and beta-thalassaemia (n=141). This correspondence — Pitta with metabolic/fire disorders, Vāta with neural/movement disorders, Kapha with structural/growth disorders — was described in the Charaka Samhita approximately 300 BCE and is here recovered from raw DNA sequence without clinical annotation (Figure S5C).
Per-chromosome Pitta+GPID enrichment for pathogenic variants (Figure S5D) identifies chromosomes where structural disease gene clusters drive the positional constraint signal: chr16 (OR=2.83, p=1.0×10⁻¹³), chr20 (OR=2.18, p=2.7×10⁻⁷), chr12 (OR=1.62, p=2.3×10⁻⁵), and chr17 (OR=1.56, p=1.1×10⁻⁶). Chromosomes dominated by promoter-associated Agni grammar show Pitta+GPID depletion, consistent with the prediction that the positional constraint signal requires structurally rigid sequence context rather than promoter-associated grammar.
Discussion
We have described a three-level Pāṇinian grammar of the human genome that emerges from DNA sequence alone, without reference to biochemical assays, evolutionary alignments, or prior biological annotation. The framework — comprising the Genomic Periodicity Index (GPI), five Panchamahābhūta compositional states, and Sandhi transition rules — identifies functional positions, predicts biological context, and quantifies human-specific evolutionary reorganization at loci of known disease relevance.
The GPI as a Dissipative Structure
The ~400 bp repeat-unique periodicity of the human genome is not a trivial consequence of its repeat content. Genomes of widely different repeat fraction — from gene-rich chr19 (63% repeat) to gene-poor chr13 (86% repeat) — show the same fundamental GPI unit. This universality implies a conserved structural requirement independent of gene density: the alternation of repeat-occupied and repeat-free sequence at the scale of two nucleosome-linker units reflects the fundamental packaging constraint of the interphase nucleus.
In Prigogine’s framework, the GPI is a dissipative structure — an ordered state maintained far from thermodynamic equilibrium by active biological processes. Unconstrained sequence evolution would randomize repeat distribution; the observed periodicity is maintained by replication timing, chromatin remodelling, and purifying selection. GPID breaks are Prigoginian bifurcation points: positions where external biological machinery imposes functional order against the entropic tendency toward uniform repeat distribution. The 89%/75%/68% functional annotation of GPID breaks in human/chimpanzee/gorilla — all well above the 30% genome-wide baseline — is consistent with this prediction.
The Metric (Anuṣṭubh Chandas) and the Scale of Genomic Grammar
The identification of the ~400 bp GPI period with the Anuṣṭubh chandas of Vedic prosody is not merely metaphorical. The Anuṣṭubh metre — the default metre of the majority of classical Sanskrit verse — consists of four padas of eight syllables each, totalling 32 syllables per verse. Mapping one syllable to ~12.5 bp, one pada to ~100 bp (one nucleosome linker unit), and one verse to ~400 bp, the GPI period corresponds exactly to the Anuṣṭubh. Crucially, Anuṣṭubh is the default metre — what emerges in the absence of deliberate metrical choice — just as the GPI is the default structural rhythm in the absence of functional override. A GPID break is the genomic chandovipatti: the metrical violation that marks a position of deliberate and significant departure from the default.
The Anuṣṭubh identification also answers a potential question: why not Gāyatrī (24 syllables, ~300 bp, corresponding to one Alu element) or Triṣṭubh (44 syllables, ~550 bp, not matching any known chromatin periodicity)? The Anuṣṭubh mapping to ~400 bp is the only one that aligns with a known structural unit at the known periodicity of the GPI.
The Panchamahābhūta States and Biological Function
The five Panchamahābhūta states emerge from an unsupervised decomposition of dinucleotide composition and correspond to the five classical elements of Indian natural philosophy: Jala (water, fluidity), Vāyu (air, movement), Agni (fire, ignition), Prithvi (earth, solidity), Ākāśa (space, boundary). The naming reflects a structural homology — both taxonomies capture the principal axes of variation in a high-dimensional compositional space — and provides a mnemonic framework that maps naturally to biological function.
The universality of the five states across chromosomes of different composition and gene density is non-trivial. A naive expectation would be that gene-rich and gene-poor chromosomes develop different compositional grammars. Instead, the same five attractor states emerge across all chromosomes tested, with mean cosine similarity of 0.96. This implies that the five-state grammar is a property of the dinucleotide alphabet itself — a consequence of physicochemical constraints on nucleotide stacking, methylation, and nucleosome positioning — rather than a property of any particular chromosome’s biology.
Sandhi Rules and Splice Site Recognition
The most striking application of the Sandhi grammar is at splice junctions. Current models of splice site recognition rely on position weight matrices and deep learning models trained on annotated junctions [22,23]. These capture the local consensus sequence but not the broader grammatical context. The Anuvṛtti pattern we describe — Agni anticipating exon entry at the splice acceptor site (rising from 0.106 to 0.084 in the 200 bp upstream) — is a forward-context grammar rule with no equivalent in position weight matrix models. This anticipatory signal may contribute to the recognition of weak splice sites where the local consensus is degenerate, and represents a testable prediction for cryptic splice site activation in disease.
Human-Specific Grammar Reorganization and Disease
The 10–20-fold elongation of the GPI period at APOE [16], HBB [17], and CFTR [18] in the human lineage suggests a common mechanism: the elaboration of long-range regulatory grammar in the human lineage created a larger target for pathogenic variation and increased regulatory complexity beyond what ancestral repair mechanisms could maintain. The same reorganization that enabled human-specific regulatory sophistication at these loci may have introduced the regulatory fragility that underlies their disease burden — a cost of complexity that is unique to the human genome.
The complementary finding — nine McLean hCONDEL sites showing GPID breaks present in chimpanzee but absent in human — identifies grammar losses associated with trait divergence. The genes at these sites span olfaction, taste, imprinting, schizophrenia susceptibility, and telomere maintenance, suggesting a coordinated programme of regulatory simplification in the human lineage. Notably, the grammar losses are not attributable to changes in repeat content — as with the gains at APOE/HBB/CFTR, the spatial organization changed while the compositional inventory was preserved. This implies a mechanism of grammar reorganization that operates by rearranging existing repeat elements rather than introducing new ones.
The demonstration that grammar predicts cis-regulatory element identity opens a direct path toward a sequence-grammar-based annotation of the human regulatory genome. The present analysis, conducted on chromosome 17 as a proof of concept, will be extended genome-wide with validation against H3K27ac ChIP-seq, ATAC-seq, and Hi-C topological domain boundaries in a subsequent study. Particularly promising is the application to genomically safe harbour identification: grammar-stable Ākāśa regions distant from Agni — predicted to be insulator-flanked and free of GPID breaks — represent candidate safe harbour loci for therapeutic gene insertion, a hypothesis directly testable against known safe harbour databases and Sleeping Beauty transposon insertion site data.
Limitations and Future Directions
The disease prediction analysis is most robust on chromosome 17, where ClinVar coverage is highest, and genome-wide replication remains incomplete. Establishing the generality of the positional entropy model requires allele frequency data from gnomAD and a palindrome-centric analysis of structural constraint — analyses that are underway. The 200 bp window size is a free parameter; a systematic multi-scale analysis may reveal a hierarchy of grammar scales. Finally, the Pāṇinian framework makes a strong generative claim — that the three-level grammar defines the complete space of valid genomic sequences — whose testing through synthetic sequence generation and de novo variant scoring represents the natural next step.
Conclusions
The three-level organization of the human genome — periodicity, compositional states, and junction rules — is structurally parallel to the grammar framework that Pāṇini developed for Sanskrit 2,400 years ago. The Genomic Periodicity Index is the chandas of the genome — its default metrical structure, from which functional positions deviate as deliberate violations. The five Panchamahābhūta states are the pratyāhāras of genomic grammar — the minimal symbol classes into which the continuous compositional space resolves. The Sandhi rules are the junction grammar — the constraints governing which states can neighbour, and how positional context determines meaning at boundaries. That this formal structure can be recovered from raw sequence alone, without annotation or evolutionary alignment, points to something deeper than a useful analogy: the grammar is not an emergent property of biological history but a physical constraint of the nucleotide alphabet itself — as fundamental, in its domain, as the grammar that Pāṇini recovered from the structure of Sanskrit.
What distinguishes the GPI framework from existing approaches to genome interpretation is not merely that it works — it is why it works. Existing methods for identifying functional elements begin with biochemical evidence: ChIP-seq peaks, DNase hypersensitivity, evolutionary conservation across species. These are measurements of biological activity at a moment in time, in a tissue, in a lineage. The grammar, by contrast, is read from sequence alone — from the statistical organization of dinucleotides and the spatial arrangement of repeat and unique sequence that the genome imposes on itself through the physical chemistry of nucleotide pairing, chromatin packaging, and replication. That 81.4% of GPID breaks — positions where this physical rhythm is locally violated — overlap known functional elements across all 23 human chromosomes (p = 3×10⁻¹²⁷) is not a circular result: the breaks were identified without reference to functional annotation, and the annotation was applied afterwards as a test. The grammar read the genome before biology labelled it. This is what gives the framework its predictive power across tissues, timepoints, and species — and why its predictions are in principle falsifiable on physical rather than biological grounds.
The positional entropy model that emerges from the grammar framework offers a new way to think about variant pathogenicity — one that does not begin with whether a position is conserved across species, but with whether the position is structurally committed. A position combining the Prithvi class with a GPID break — where the physical rhythm demands functional deployment and the local sequence composition permits few configurations — tolerates sequence change less than a position in the dynamic Vāta class, regardless of what other genomes show at that coordinate. The observation that this grammar-based constraint is orthogonal to conservation-based scores (Spearman ρ = 0.087 with CADD across pathogenic variant positions) suggests that the grammar captures a dimension of variant intolerance that evolutionary databases do not: the structural cost of violating a positional commitment that is grounded in the physics of nucleotide organization rather than in biological history. Critically, grammar state predictions are orthogonal to raw sequence composition: the correlation between grammar-based and sequence composition-based pathogenicity predictions is r = −0.024 (p = 2×10⁻⁸), confirming that the five-state grammar captures positional context independent of GC content, CpG frequency, and repeat fraction. Grammar state adds AUC = +0.013 over sequence composition features alone (0.569 → 0.583), consistent with the grammar encoding structural positional information not reducible to nucleotide composition.
The evolutionary analysis reveals that the grammar is not static across primate lineages, and that its changes are not neutral. The three loci with the most extreme human-specific elongation of GPI period — APOE (16-fold), HBB (15-fold), CFTR (6-fold) — are among the most consequential sites of human genetic disease; the control locus TP53, whose cancer biology is conserved across mammals, shows no human-specific change. The McLean hCONDEL analysis gives the loss direction the same clarity: nine sites on chromosome 7 where a GPID break present in chimpanzee is absent in human flank genes associated with chemosensory reduction, neuronal architecture, and schizophrenia susceptibility — the specific biological features that distinguish human from non-human primates. Together, these observations point to a unifying principle: the loci where the genome’s regulatory architecture was reorganized in the human lineage are also the loci where that architecture is most exposed to pathogenic disruption. The grammar change that allowed new regulatory complexity simultaneously created new structural fragility.
The brain HiC data is consistent with this principle at the regulatory level. Human-specific Alu insertions — carrying the Vāta grammar signature of distal enhancers — overlap enhancer-promoter loop anchors at neural genes that are absent at syntenic positions in chimpanzee and gorilla, including DISC1, NRG3, GRIA4, NCAM1, and PBX1. The genes themselves are primate-conserved; what is human-specific is the regulatory grammar connecting them to distal enhancers. These observations are consistent with the proposal, long made in evolutionary psychiatry, that human cognitive complexity and psychiatric disease risk share a common genomic substrate — but establishing a causal relationship requires functional validation beyond what sequence grammar analysis alone can provide. The Pāṇinian grammar framework offers a quantitative measure of this exaptation process: transposable elements that carry the Vāta grammar signature are not merely tolerated insertions but positional contributors to the regulatory architecture, co-opted by the genome as functional grammar units in the same way that Pāṇini’s sthānivat principle permits a substituted element to inherit the grammatical properties of its predecessor.
The path forward from a descriptive grammar is a generative one. Pāṇini’s grammar of Sanskrit was not a catalog of existing utterances but a system of rules from which any valid Sanskrit could be derived — and from which the exact boundary between valid and invalid could be drawn. The Grammar Perplexity Score introduced here begins to draw that boundary for the genome: it measures how far a given sequence departs from its positional grammar, and in doing so begins to specify what the genome, at any position, will and will not tolerate. Extending this from scoring to generation — using the grammar not to evaluate existing sequences but to specify sequences that are optimally fit for a given positional context — is the natural direction for therapeutic sequence design and for the emerging field of genomic language modelling. Whether the five-state grammar described here will prove sufficient for that purpose, or whether finer levels of positional organization remain to be resolved, is an open question. What is established is the existence and coherence of the grammar itself: the human genome has a formal positional structure, it is recoverable from sequence alone, and its violations are biologically meaningful in ways that connect molecular constraint to evolutionary innovation and to human disease. Pāṇini demonstrated that language has structure that transcends any particular utterance. This paper demonstrates that the molecule of heredity has a structure of the same kind.
Methods
Genomic Periodicity Index (GPI) Computation
RepeatMasker annotations [27] were downloaded from the UCSC Genome Browser [28] for hg38 (human), panTro6 (chimpanzee), gorGor6 (gorilla), and rheMac10 (rhesus macaque) using the rmsk track. For each chromosome, a binary repeat signal was constructed by assigning 1 to 100 bp bins overlapping any RepeatMasker annotation and 0 to unannotated bins. The local repeat fraction was computed using a sliding window of 5,000 bp (50 bins). The GPI Deviation (GPID) was defined as the absolute difference between the local repeat fraction and the chromosomal mean. GPID break bins were defined as those in the top 10% of GPID values per chromosome. All computations were performed in Python 3.13 using NumPy 1.26.
Functional Annotation of GPID Breaks
GPID break bins were annotated against RefSeq gene bodies (ncbiRefSeq track, hg38) and ENCODE candidate cis-regulatory elements (encodeCcreCombined track, hg38) [29] retrieved via the UCSC Genome Browser REST API [28] (api.genome.ucsc.edu). A bin was classified as functional if it overlapped any RefSeq transcript or any ENCODE cCRE. The genome-wide baseline annotation rate of 30% was estimated by sampling 10,000 random 100 bp bins from each chromosome and computing the fraction overlapping annotation. Statistical significance was assessed by binomial test (scipy.stats.binomtest, alternative=‘greater’, p₀ = 0.30).
Panchamahābhūta Grammar State Inference
For chromosome 17, dinucleotide profiles were computed for 829,145 non-overlapping 200 bp windows. Each window was represented as a 16-dimensional vector of dinucleotide frequencies (all 16 possible dinucleotides of the ATGC alphabet, normalised to sum to 1). Profiles were standardised using StandardScaler and projected into 10 principal components using PCA (sklearn.decomposition.PCA, random_state=42). The number of grammar states was selected by BIC model selection over k = 2–10, fitting Gaussian Mixture Models (sklearn.mixture.GaussianMixture, covariance_type=‘full’, n_init=5) on a random subsample of 80,000 windows in the first five PCs. The five-state GMM was used to assign grammar states to all windows. Cross-chromosome validation was performed by independently applying the same pipeline to chromosomes 1, 7, 11, 19, 22, and X, and computing cosine similarity between corresponding state centroids.
Sandhi Transition Matrix
For adjacent 200 bp windows on chromosome 17, the 5×5 transition matrix was computed as the empirical frequency of each state-to-state transition, including self-transitions. Expected transition frequencies were computed under the independence assumption (product of marginal state frequencies). Log-odds values were computed as log₂(observed / expected), with pseudocount of 0.5 added to all cells. State persistence was defined as the diagonal of the transition matrix (self-transition probability).
Metagene Grammar Profiles
Metagene profiles were computed for four boundary types: transcription start sites (TSS), transcription end sites (TES), exon-to-intron junctions (splice donors), and intron-to-exon junctions (splice acceptors). RefSeq gene annotations for chr17 were used. For each boundary, windows were assigned ±2,000 bp in 100 bp steps. Grammar state probabilities were computed as the fraction of windows in each state at each position. Only genes with all four boundary types annotated and no overlapping genes within 5,000 bp were included (n = 412 genes).
ClinVar Variant Analysis
ClinVar variant summaries [30] (GRCh38, accessed January 2026) were downloaded from the NCBI FTP server (variant_summary.txt.gz). Single-nucleotide variants classified as Pathogenic or Benign (excluding Conflicting interpretations) were extracted for each chromosome. For each variant, the 200 bp window centred on the variant position was fetched from the UCSC sequence API (api.genome.ucsc.edu/getData/sequence) and assigned a grammar state using the chr17-trained GMM. GPID context was determined from the precomputed GPID signal. Pathogenic fraction was defined as the number of pathogenic variants divided by total variants in each state × GPID context combination. Odds ratios and p-values were computed using Fisher’s exact test (scipy.stats.fisher_exact).
Grammar states were defined on chromosome 17, which provides the densest ClinVar coverage and the most stable GMM solution (BIC minimum at k = 5, reproducible across 10 independent random seeds). Training on a single reference chromosome rather than the full genome was a deliberate design choice: it permits cross-chromosome application as an independent test of universality, rather than fitting a genome-wide average that would obscure chromosome-specific compositional differences. The chr17-trained GMM was applied without modification to all 22 remaining autosomes and the X chromosome; state centroids showed cosine similarity 0.9596 ± 0.032 with the chr17 reference (p = 4.65 × 10⁻⁸), confirming that the five-state grammar is a universal property of the human genome rather than a chr17-specific artefact. The recovery of the Prithvi+GPID enrichment signal on 10 of 17 independent chromosomes with sufficient ClinVar coverage (chr16 OR = 3.56, p = 4.87 × 10⁻¹³; chr19 OR = 0.57, p = 9.54 × 10⁻¹¹) further demonstrates that the positional constraint result is not a consequence of training on chr17. Genome-wide grammar model To provide a genome-wide reference grammar independent of chr17, a second GMM was trained on all 23 human chromosomes. For each chromosome, 50,000 non-overlapping 200 bp windows were sampled uniformly from the chromosome body (excluding 10 Mb at each telomeric end), yielding 1,116,212 windows total. Dinucleotide profiles were computed from the local hg38 FASTA (pyfaidx 0.9.0), standardised with StandardScaler, and projected into 10 PCs (PCA, sklearn). The five-state GMM (n_init=10, max_iter=500, covariance_type=‘full’) was fitted on the first five PCs. Total runtime: 1.2 minutes on a standard workstation (AMD Ryzen 9, 64 GB RAM). State biochemical identity was assigned by dinucleotide fingerprint: S4 (highest CpG=0.038, GC=0.307) = Agni/Pitta; S2 (highest AT=0.434, lowest CpG=0.004) = Prithvi/Kapha; S0/S1 (intermediate) = Jala+Vāyu/Vāta. For disease association analysis, pathogenic ClinVar variants were classified using the genome-wide model and matched to their ClinVar PhenotypeList field. Per-Tridosha disease counts were computed after excluding non-informative phenotype strings (‘not provided’, ‘not specified’, ‘See cases’).
Non-B DNA Structure Detection
Five classes of non-B DNA structures were detected in 200 bp sequence windows. Perfect palindromes were defined as sequences equal to their own Watson-Crick reverse complement, with arm length 4–10 bp and zero mismatches. G-quadruplexes were detected using the canonical motif G{3,}[ACGTN]{1,7} repeated four times, on both strands. Microsatellites were defined as tandem repeats with unit length 2–6 bp and at least four consecutive repeats. Imperfect palindromes were defined as inverted repeats with arm length 4–8 bp and 1–2 mismatches or a spacer of 1–4 bp. DNA triplexes were defined as purine mirror repeats of length ≥ 10 bp with ≤ 2 mismatches. For each variant, classification as inside or outside each structure type was determined by checking whether the variant position fell within any detected structure in the 200 bp window.
Primate GPI Period Comparison
GPI periods were computed at five loci (TP53/chr17, CFTR/chr7, HBB/chr11, APOE/chr19, gene-dense chr22) in human (hg38), chimpanzee (panTro6), gorilla (gorGor6), and rhesus macaque (rheMac10) using the autocorrelation of the binary repeat signal in 2 Mb windows centred on each locus. The dominant period was estimated as the position of the first autocorrelation peak beyond 200 bp. Locus coordinates in non-human primates were identified using syntenic alignment (liftOver, UCSC chain files).
McLean hCONDEL Analysis
The 510 human-specific conserved deletions (hCONDELs) identified by McLean et al. on chromosome 7 were obtained from the original publication [31] . For each hCONDEL, syntenic coordinates in chimpanzee (panTro6) were identified using the hg38-to-panTro6 liftOver chain. GPID signal was computed for ±10 kb flanking the hCONDEL in both human and chimpanzee. A hCONDEL was scored as a grammar loss if the chimpanzee GPID signal at the syntenic position exceeded the 90th percentile threshold while the human GPID signal at the corresponding position was below threshold.
Tridosha Segmentation
The five Panchamahābhūta grammar states were condensed to three Tridosha classes following the classical Āyurvedic mapping described in the Charaka Samhita [5]: Pitta = S3 (Agni); Vāta = S2 (Vāyu) + S4 (Ākāśa); Kapha = S1 (Jala) + S3 (Prithvi). For each grammar window, the Tridosha class was assigned as the dominant Dosha at that position. Genome-wide Tridosha fractions were computed as the proportion of all 829,145 chr17 grammar windows assigned to each Dosha class. Tridosha × GPID enrichment was computed as the fraction of windows of each Dosha class that overlap GPID break positions (top 10% deviation), with statistical significance assessed by Fisher’s exact test. For each cis-regulatory element class, Tridosha composition was computed from a random sample of 500 cCRE-overlapping grammar windows, with Pitta, Vāta, and Kapha fractions normalised to sum to 100%. Ternary plots were constructed using standard Cartesian transformation of ternary coordinates. All pairwise Dosha fraction comparisons used the Mann-Whitney U test (scipy.stats.mannwhitneyu, alternative=‘two-sided’). For the gnomAD constraint analysis, Tridosha class was assigned to 2,171 chromosome 17 genes based on the dominant grammar state in a ±1 kb window around the RefSeq transcription start site. gnomAD v4.1 constraint metrics (pLI, LOEUF) were downloaded from the gnomAD public release [26] and matched to canonical transcripts. Between-Dosha constraint comparisons used the Mann-Whitney U test; the global three-group comparison used the Kruskal-Wallis test.
Human-Specific Transposable Element Analysis
Human-specific transposable element (TE) insertion coordinates were identified using the Genome Presence/Absence Compiler (GPAC) [24], a web application that uses UCSC multiway genome alignments to determine the presence or absence of genomic elements across species. Human-specific insertions were defined as elements present in human (hg19) but absent at the syntenic position in both chimpanzee (panTro6) and gorilla (gorGor6), confirmed by GPAC presence/absence patterns in the human 46-way multiway alignment. This yielded 786 human-specific Alu elements (all_Alus.bed) and 450 human-specific LINE elements (gain_LINE.bed), predominantly of the L1HS and L1PA2 subfamilies. BED coordinates were originally in hg19 and were lifted over to hg38 using the UCSC liftOver tool with the hg19ToHg38 chain file prior to grammar state classification. Grammar state assignment at each TE insertion site was performed by fetching the 200 bp window centred on the TE midpoint from the hg38 UCSC sequence API and classifying it with the chr17-trained GMM pipeline (scaler, PCA, GMM5) as described above. Tridosha class was assigned by the standard Panchamahābhūta-to-Tridosha condensation mapping. State enrichment relative to the genome baseline was assessed by binomial test (scipy.stats.binomtest) with the chr17 state frequencies as the null proportion. A representative sample of 200 TEs was used for grammar classification given API rate constraints; the full 1,236-element dataset is provided in the supplementary data.
To test whether human-specific Alu insertions create functional enhancer-promoter (EP) contacts in the human brain, we intersected hg19 Alu coordinates with published chromatin loop calls from four human brain tissue types: fetal cortical plate (CP), germinal zone (GZ), fetal cerebral cortex, and adult anterior temporal cortex, generated using the easy Hi-C (eHi-C) protocol [25] (GEO: GSE115407). Loop files in HiCorr format (anchor1 : anchor2 : observed : ratio : p-value) were parsed and each Alu midpoint was tested for overlap with either loop anchor within a ±5 kb window. For each overlapping Alu, the other (non-Alu) anchor was annotated as a promoter if any RefSeq gene transcription start site fell within ±2 kb (UCSC refGene track, hg19). A contact was classified as an enhancer-promoter (EP) interaction if the distal anchor overlapped a promoter, and as enhancer-enhancer (EE) otherwise. EP enrichment was assessed by binomial test (scipy.stats.binomtest) using 2% as the null probability of random overlap with TSS-proximal sequence, based on the fraction of the hg19 genome within 2 kb of a RefSeq TSS. Genes contacted across all four brain tissue types were defined as universal EP targets of human-specific Alu insertions. Note that the repeat-derived nature of Alu elements means that multi-mapping reads are routinely removed in Hi-C library processing; the EP contact frequencies reported here therefore represent a conservative lower bound on the true extent of Alu-anchored chromatin interactions.
Software and Data Availability
All analyses were performed in Python 3.13 with NumPy 1.26, Pandas 2.2, scikit-learn 1.4, SciPy 1.12, and Matplotlib 3.8. Sequence data were retrieved from the UCSC Genome Browser API (hg38, panTro6, gorGor6, rheMac10). ClinVar data: NCBI ClinVar, January 2026 release. gnomAD v4.1 [26] data: gnomad.broadinstitute.org. All analysis scripts and processed data are deposited at Zenodo 10.5281/zenodo.19389381 and demo model is hosted at https://huggingface.co/spaces/amitpande74/paninian-genome-grammar. This work builds on the Panchamahābhūta protein framework [8] and the Pāṇinian regulatory grammar [9].
Supplementary Materials
The following supporting information can be downloaded at the website of this paper posted on Preprints.org. Figure S1 | Full Genome GPID Summary: Genomic Periodicity Index Deviation (GPID) across all 23 human chromosomes (hg38). (A) Mean repeat fraction per chromosome, showing the conserved 54–75% range independent of gene density; mean = 65.3% (range: chr22 = 54% to chrX/chr19 = 75%) (B) Distribution of GPID deviation values per chromosome; the top 10% threshold (red dashed line) defines GPID break bins. Chromosomes with high centromeric or satellite content (chr9, chr13, chr14, chr15, chr21) show low GPID break counts reflecting low-complexity architecture rather than biological constraint. (C) Dominant GPI period per chromosome computed from autocorrelation of the binary repeat signal, showing the universal ~400 bp fundamental unit. Gene-rich (chr19, chr22) and gene-poor (chr13, chr21) chromosomes show equivalent GPI fundamental periods despite differing in repeat content by more than 20%. Figure S2 | Cross-Chromosome Grammar State Universality: Validation of the five Panchamahābhūta grammar states across six chromosomes (chr1, chr7, chr11, chr19, chr22, chrX) independently of the chr17 reference. (A) Eigenvalue spectra for the first five PCs across all six test chromosomes; the PC5 elbow is consistent across all chromosomes, confirming that five components capture the dominant compositional structure. (B) Mean cosine similarity between state centroids of each test chromosome and the chr17 reference (chr1 = 0.943, chr7 = 0.977, chr22 = 0.969, chrX = 0.896, chr11 = 0.994, chr19 = 0.978); mean similarity 0.9596 ± 0.032 (p = 4.65×10⁻⁸). State abundance comparisons for representative chromosomes (chr1, chr7, and chrX vs chr17) show consistent proportions across autosomes (Jala ~14%, Vāyu ~35%, Agni ~4%, Prithvi ~20%, Ākāśa ~26%). Per-state cosine similarity matrix (chr17 reference vs all six test chromosomes): the single below-threshold entry is S4 Prithvi on chrX (similarity = 0.63), reflecting the known specialisation of LINE elements for X-chromosome dosage compensation — a biologically motivated exception that validates rather than undermines the framework. Figure S3 | Primate GPID Break Functional Annotation: GPID breaks were annotated against RefSeq gene bodies in human (hg38), chimpanzee (panTro6), and gorilla (gorGor6) at five syntenic regions: TP53 (chr17:7.5–8.5 Mb), CFTR (chr7:117–118 Mb), HBB (chr11:5–6 Mb), APOE (chr19:44–45 Mb), and a gene-dense region (chr22:23–24 Mb). (A) Percentage of GPID breaks overlapping RefSeq annotations per region and species. (B) Mean percentage across all five regions: human 90.6%, chimpanzee 79.0%, gorilla 71.8%, all significantly above the 30% genome-wide random baseline (p < 10⁻¹² for all three species, binomial test). (C) Number of GPID breaks per region and species. The conservation of functional enrichment across ~10 million years of primate divergence indicates that the GPI rhythm-function principle is not a human-specific phenomenon but a primate-universal property of genome organization. Figure S4 | Primate GPI Period Comparison at Disease Loci: GPI periods computed from autocorrelation of the binary repeat signal in 2 Mb windows centred on four loci in human (hg38), chimpanzee (panTro6), gorilla (gorGor6), and rhesus macaque (rheMac10). (A) GPI period (kb) per species per locus shown as grouped bars. Human-specific period elongation is present at APOE (98.5 kb in human vs. 5.0 kb in chimpanzee; 20-fold), HBB (48.0 kb vs. 2.5 kb; 19-fold), and CFTR (42.5 kb vs. 13.0 kb; 3-fold). The TP53 locus shows no human-specific elongation (~6 kb across all species), serving as a negative control. (B) Repeat fraction at each locus per species; values are equivalent across species (mean CV < 5%), confirming that the period difference reflects spatial reorganization of existing repeat elements rather than a change in repeat content. Figure S5 | Genome-Wide Disease Prediction Landscape: Pathogenic variant fraction (ClinVar) by grammar state and GPID context across all 23 chromosomes combined (55,736 variants mapped; 14,982 pathogenic, 40,754 benign). (A) Pathogenic fraction per grammar state inside vs. outside GPID breaks (absolute %). Genome baseline = 26.9%. (B) Odds ratios for GPID effect per state: Vāyu (S2) shows significant depletion at GPID breaks (OR = 0.68×, p = 0.003**); Agni (S3) shows moderate depletion (OR = 0.84×, p = 0.013*); Jala, Prithvi, and Ākāśa show no significant effect. (C) Per-chromosome pathogenic fraction at Prithvi+GPID positions relative to chromosomal baseline; genome mean shown as dashed red line. (D) Top grammar state × GPID context combinations ranked by pathogenic fraction; S1 Jala+GPID is the most enriched combination (29.1%, n = 4,580). (E) Genome-wide summary statistics: total SNVs = 55,736; pathogenic = 14,982; benign = 40,754; overall GPID OR = 0.967×, p = 0.137 (ns); best combination = S1 Jala+GPID. (F) Chr17 vs genome-wide validation: Prithvi+GPID shows 69% pathogenic on chr17 alone vs 26.8% genome-wide, demonstrating that the chr17 signal is real but amplified by ClinVar ascertainment density. Figure S6 | Non-B DNA Structures and Positional Entropy: Analysis of five non-B DNA structure classes in ClinVar single-nucleotide variants (chromosomes 17, 19, and 13; combined n = 892 variants). (A) Pathogenic variant fraction for variants inside vs. outside each non-B structure type (200 bp windows). G-quadruplex positions show significant depletion of pathogenic variants (7.1% inside vs. 43.2% outside; OR = 0.10×, p = 0.006), consistent with the dynamic regulatory switch function of G4 structures. Microsatellite positions also show depletion (27.6% vs. 44.0%; OR = 0.49×, p = 0.007), consistent with the tolerance of length variation at microsatellite loci. (B) Odds ratios for pathogenic enrichment inside vs. outside each structure type; dashed line indicates OR = 1 (no effect). (C) Structure occupancy across all variants: imperfect palindromes dominate (99.4%), followed by microsatellites (8.5%), perfect palindromes (2.1%), G-quadruplexes (1.6%), and DNA triplexes (0.8%). (D) Per-structure pathogenic fraction on the gene-dense chromosome 19 (baseline 44.2%). (E) Per-structure pathogenic fraction on the gene-poor chromosome 13 (baseline 28.3%); G-quadruplex and DNA triplex data absent, consistent with their concentration at active gene regulatory elements. (F) Summary of the positional entropy grammar rule: structurally committed, rigid positions (perfect palindromes, G-quadruplexes, DNA triplexes) do not tolerate variation; structurally flexible positions (imperfect palindromes) do. Committed structure + variant = structure destroyed = disease. Figure S7 | Grammar Displacement Analysis: Assessment of grammar perturbation by pathogenic versus benign ClinVar single-nucleotide variants (chr17; 800 pathogenic, 800 benign). For each variant, the 200 bp window was projected into the five-dimensional PCA grammar space before and after allele substitution. (A) Distribution of total PCA displacement (Euclidean distance between reference and alternate allele grammar vectors). (B) Distribution of centroid delta: signed distance change from the native grammar state centroid (positive = moved away from native state). (C) Fraction of variants moving toward the forbidden grammar zone (Agni↔Prithvi, log-odds = −4.65). Pathogenic variants show a significant reduction in forbidden zone approach (OR = 0.81×, p = 0.04), indicating that pathogenic variants at already-constrained positions do not necessarily move further toward forbidden grammar — their pathogenicity is encoded in their positional context (Prithvi+GPID) rather than in the magnitude of grammar disruption they cause. This finding supports the positional entropy model over a variant-disruption model of grammar-based disease prediction.
References
- Sharma; Pāṇini, R.N.; Ashtadhyayi. 1987.
- Kadvany, J. Pāṇini’s Grammar and Modern Computation. Hist. Philos. Log. 2016, 37, 325–346. [Google Scholar] [CrossRef]
- Lowe, J. J. Modern Linguistics in Ancient India; Cambridge University Press, 2024. [Google Scholar] [CrossRef]
- Ramkrishnamacharyulu, K. V. Annotating Sanskrit Texts Based on Śābdabodha Systems. In Sanskrit Computational Linguistics; Kulkarni, A., Huet, G., Eds.; Springer Berlin Heidelberg, Berlin, Heidelberg, 2008; vol. 5406 26–39. [Google Scholar]
- Caraka Samhita; Sharma, P. V., Ed.; vols 1, Sharira Sthana 6/4.
- Cardona, G. Some principles of Pānini’s grammargrammar. J. Indian Philos. 1970, 1, 40–74. [Google Scholar] [CrossRef]
- Huet, G.; Kulkarni, A.; Scharf, P. M. Sanskrit Computational Linguistics: First and Second International Symposia Rocquencourt, France, October 29-31, 2007 Providence, RI, USA, May 15-17, 2008 Revised Selected and Invited Papers; Springer Berlin Heidelberg Springer e-books, Berlin, Heidelberg, 2009. [Google Scholar]
- Prasher, B.; et al. Whole genome expression and biochemical correlates of extreme constitutional types defined in Ayurveda. J. Transl. Med. 2008, 6, 48. [Google Scholar] [CrossRef]
- Mukerji, M. Ayurgenomics-based frameworks in precision and integrative medicine: Translational opportunities. Camb. Prisms Precis. Med. 2023, 1, e29. [Google Scholar] [CrossRef]
- Govindaraj, P.; et al. Genome-wide analysis correlates Ayurveda Prakriti. Sci. Rep. 2015, 5, 15786. [Google Scholar] [CrossRef]
- Knudsen, B.; Hein, J. RNA secondary structure prediction using stochastic context-free grammars and evolutionary history. Bioinformatics 1999, 15, 446–454. [Google Scholar] [CrossRef]
- Eddy, S. R. Profile hidden Markov models. Bioinformatics 1998, 14, 755–763. [Google Scholar] [CrossRef]
- Prigogine; Stengers. Order Out of Chaos; 1984. [Google Scholar]
- Smit; Hubley; Green. RepeatMasker. 2013. [Google Scholar]
- et al.; The ENCODE Project Consortium Expanded encyclopaedias of DNA elements in the human and mouse genomes. Nature 2020, 583, 699–710. [Google Scholar] [CrossRef] [PubMed]
- Lyon, M. F. Gene Action in the X-chromosome of the Mouse (Mus musculus L.). Nature 1961, 190, 372–373. [Google Scholar] [CrossRef] [PubMed]
- Korenberg, J. R.; Rykowski, M. C. Human genome organization: Alu, LINES, and the molecular structure of metaphase chromosome bands. Cell 1988, 53, 391–400. [Google Scholar] [CrossRef]
- Khurana, S.; et al. A Macrohistone Variant Links Dynamic Chromatin Compaction to BRCA1-Dependent Genome Maintenance. Cell Rep. 2014, 8, 1049–1062. [Google Scholar] [CrossRef]
- et al.; Roadmap Epigenomics Consortium Integrative analysis of 111 reference human epigenomes. Nature 2015, 518, 317–330. [Google Scholar] [CrossRef]
- Thurman, R. E.; et al. The accessible chromatin landscape of the human genome. Nature 2012, 489, 75–82. [Google Scholar] [CrossRef] [PubMed]
- Zhu, J.; et al. Genome-wide Chromatin State Transitions Associated with Developmental and Environmental Cues. Cell 2013, 152, 642–654. [Google Scholar] [CrossRef]
- Landrum, M. J.; et al. ClinVar: improving access to variant interpretations and supporting evidence. Nucleic Acids Res. 2018, 46, D1062–D1067. [Google Scholar] [CrossRef] [PubMed]
- Sato, K.; Martin-Pintado, N.; Post, H.; Altelaar, M.; Knipscheer, P. Multistep mechanism of G-quadruplex resolution during DNA replication. Sci. Adv. 2021, 7, eabf8653. [Google Scholar] [CrossRef] [PubMed]
- Horton, C. A.; et al. Short tandem repeats bind transcription factors to tune eukaryotic gene expression. Science 2023, 381, eadd1250. [Google Scholar] [CrossRef]
- Noll, A; et al. GPAC—Genome Presence/Absence Compiler. Mol Biol Evol 2015, 32, 275–286. [Google Scholar] [CrossRef]
- Chen, S.; et al. A genomic mutational constraint map using variation in 76,156 human genomes. Nature 2024, 625, 92–100. [Google Scholar] [CrossRef]
- Smit, A.F.A.; Hubley, R.; Green, P. RepeatMasker Open-4.0 2013–2015. Available online: http://www.repeatmasker.org.
- Kent, W.J.; et al. The human genome browser at UCSC. Genome Res. 2002, 12, 996–1006. [Google Scholar] [CrossRef] [PubMed]
- The ENCODE Project Consortium. Expanded encyclopaedias of DNA elements in the human and mouse genomes. Nature 2020, 583, 699–710. [Google Scholar] [CrossRef] [PubMed]
- Landrum, M.J.; et al. ClinVar: improving access to variant interpretations and supporting evidence. Nucleic Acids Res. 2018, 46, D1062–D1067. [Google Scholar] [CrossRef] [PubMed]
- McLean, C.Y.; et al. Human-specific loss of regulatory DNA and the evolution of human-specific traits. Science 2011, 334, 1573–1577. [Google Scholar] [CrossRef] [PubMed]
Figure 4.
Sandhi transition grammar — forbidden adjacencies and state persistence. (A) Grammar network visualisation. Nodes represent the five Panchamahābhūta states, sized by abundance. Arrows represent transitions; red = preferred (log-odds > 0.3); grey = neutral; pale = forbidden (log-odds < −1.5). Self-loops represent state persistence. The Agni↔Prithvi forbidden adjacency (log-odds = −4.65) is the most constrained transition in the matrix. (B) Sandhi log-odds matrix (5×5). Stars (✦) = preferred; crosses (✗) = forbidden; dots (·) = neutral. Colour scale: green = preferred, red = forbidden.

Figure 5.
Metagene grammar profiles — Anuvṛtti at gene body boundaries. Grammar state probability profiles across four boundary types, computed from 412 non-overlapping chr17 genes. Each panel shows state probability across ±2,000 bp flanking the indicated boundary. Purple shading = upstream region; green shading = downstream region. (A) Transcription start site (TSS). Agni (S3) crescendos from P = 0.30 upstream to P = 0.65 at the TSS — the transcriptional ignition signature. (B) Transcription end site (TES). Jala (S1) rises entering the downstream intergenic interval. (C) Splice donor site (exon→intron). Agni relaxes from 0.101 to 0.087 entering the intron. (D) Splice acceptor site (intron→exon). Agni rises from 0.106 to 0.084 in the 200 bp upstream of the exon — a forward-context grammar rule (Anuvṛtti) with no parallel in current splice site models. (E) State legend. (F) Composite gene body profile across a three-exon model gene.

Figure 6.
Grammatically constrained positions are enriched for pathogenic variants. ClinVar single-nucleotide variant analysis, chr17 (8,550 pathogenic, 14,845 benign). (A) Pathogenic fraction by Sandhi junction context. (B) Pathogenic fraction by grammar state interior. S4 Prithvi (53.3%) and S1 Jala (44.7%) show above-baseline pathogenicity; S2 Vāyu (28.8%) and S3 Agni (29.8%) show below-baseline. (C) Sandhi junction pathogenicity heatmap (5×5). Prithvi-involving junctions show the highest pathogenicity. (D) Prithvi junctions vs. non-Prithvi junctions (Fisher’s exact test). (E) The Rigidity Law: pathogenic fraction vs. structural rigidity (1 − self-persistence) per state. More rigid states show higher pathogenic fraction (r² = 0.180). (F) Summary table of grammar-disease statistics.

Figure 7.
Human-specific GPI reorganization — grammar gains and losses define human evolutionary innovation. (A) GPI period comparison across four primate species (human hg38, chimpanzee panTro6, gorilla gorGor6, rhesus macaque rheMac10) at four loci. TP53 (control): period conserved at ~6 kb across all species. APOE, HBB, CFTR: human-specific period elongation of 3–20-fold. Fold-change annotations indicate human-to-chimpanzee ratio; primate mean fold-changes (human vs. mean of chimpanzee, gorilla, and rhesus macaque) are: APOE 16-fold, HBB 15-fold, CFTR 6-fold. Dashed line = 4 kb primate baseline. (B) GPI grammar losses at McLean 2011 hCONDELs (chr7). For 9/42 chr7 hCONDELs showing a GPID break in chimpanzee absent in human, bars show GPID deviation in chimp (orange) vs. human (red) at the syntenic position. Genes flanking each lost grammar break are annotated. (C) GPI gains at disease loci vs. GPI losses at trait-divergence loci — same repeat content, different spatial organization. (D) Schema: GPI gains create larger regulatory targets susceptible to pathogenic variation; GPI losses remove grammar at sites of human-specific trait evolution. (E) GPID → pathogenicity. Within GPID break regions on chr17, Prithvi-class variants are 69% pathogenic (OR = 2.64, p = 10⁻³²); Agni-class variants are 29.1% (below baseline). (F) The three-level Pāṇinian grammar framework summary.

Disclaimer/Publisher’s Note: The statements, opinions and data contained in all publications are solely those of the individual author(s) and contributor(s) and not of MDPI and/or the editor(s). MDPI and/or the editor(s) disclaim responsibility for any injury to people or property resulting from any ideas, methods, instructions or products referred to in the content. |
© 2026 by the authors. Licensee MDPI, Basel, Switzerland. This article is an open access article distributed under the terms and conditions of the Creative Commons Attribution (CC BY) license (http://creativecommons.org/licenses/by/4.0/).
Copyright: This open access article is published under a Creative Commons CC BY 4.0 license, which permit the free download, distribution, and reuse, provided that the author and preprint are cited in any reuse.


