Submitted:
08 April 2026
Posted:
09 April 2026
You are already at the latest version
Abstract
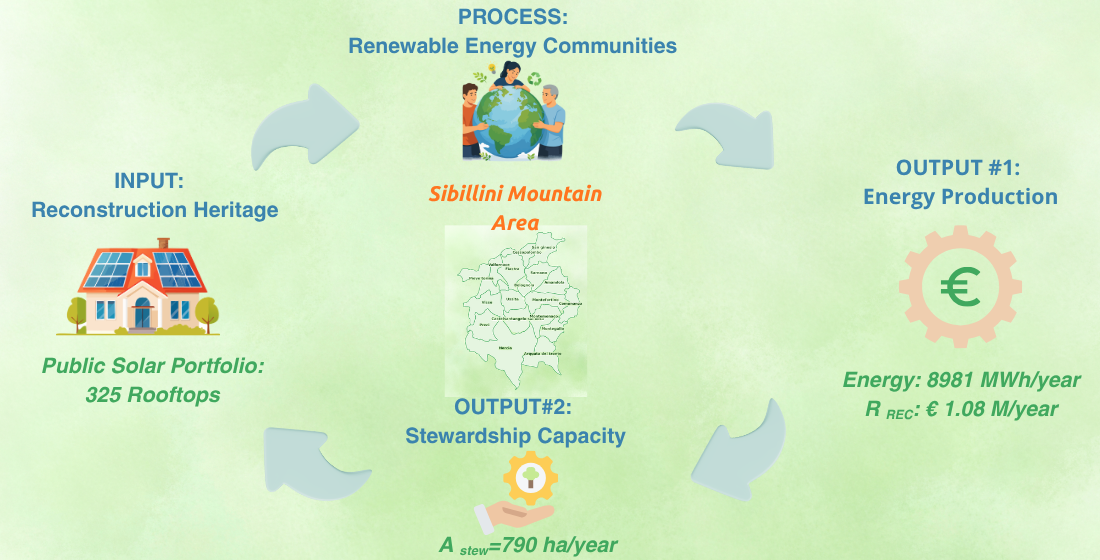
The management of European mountain landscapes is increasingly threatened by rural abandonment and escalating environmental risks. This study investigates an innovative Stewardship-Renewable Energy Communities model for the Central Apennines, exploring how post-seismic public reconstruction can serve as a financial engine for territorial maintenance. Utilizing Open Data Sisma administrative records and Photovoltaic Geographical Information System irradiation metrics, the research assesses the solar potential of 20 municipalities within the Sibillini seismic crater. To ensure a reliable baseline, a Building Suitability Coefficient was introduced as a conservative proxy for the public reconstruction sector. Results indicate that the establishment of public Renewable Energy Communities could generate approximately €1.08 million in annual revenue from 325 identified energy nodes. This economic surplus provides a Stewardship Capacity sufficient to fund the active maintenance of 789.77 hectares per year through Nature-based Solutions, assuming a standardized rate of 1,200 €/ha. The study concludes that distributed rooftop solar portfolios represent a non-invasive, self-funding mechanism for mountain resilience. By leveraging the Anthropo-systemic capital of reconstructed public hubs, mountain territories can transition from passive management neglect to active, energy-backed stewardship, offering a reproducible template for high-value cultural landscapes.
Keywords:
photovoltaic
; renewable energy communities
; geographical information system
; Sibillini Mountains
; Apennines
; post-seismic reconstruction
; landscape stewardship
; nature-based solutions
; energy systems
1. Introduction
The resilience of the European socio-economic fabric is inextricably linked to the vitality of its Inner Areas, territories characterized by profound geographic and cultural identity yet increasingly marginalized by urban-centric development models [1].
These landscapes share a distinct set of structural constraints that define their permanent natural complexity. The European classification of urbanization identifies nearly 80% of these municipalities as rural, often located at significant distances from essential service hubs (hospitals, schools, and transit nodes), which exacerbates the risk of demographic shrinkage and economic stagnation (Figure 1) [2].
This peripherality is compounded by climatic restrictions that, while historically shaping unique agropastoral mosaics, now leave these regions highly exposed to the escalating impacts of climate change [3].
1.1. Dynamic Evolution of the Apennine Socio-Ecological Systems
In Italy, the Inner Areas represent geographically a strategic pillar of the national landscape, encompassing approximately 177,000 km2 (roughly 59% of the national surface) and hosting over 13 million residents [4]. Characterized by high average elevations, with 42.4% of municipalities situated in hilly regions and complex topographies, they face systemic challenges in infrastructure and accessibility [5]. Despite their peripheral status relative to service provision centers, these territories are not merely empty spaces; they contribute significantly to the national economy through the Cultural and Creative Sectors, which account for 6.1% of Italy’s national added value [6].
The National Strategy for Inner Areas (SNAI), approved with the European Commission Implementing Decision C(2022) 4787, constitutes the relative territorial policy for the 2020–2027 programming period, identifying marginalized municipalities based on specific accessibility parameters: health, education, and collective mobility, enclosing therefore 1904 municipality, more than 4.5 million residents, over a surface of 94000 km2 [7,8].
A foundational body of research has established a framework for assessing the environmental health of these fragile systems, identifying five critical pillars of landscape functionality: Carbon Sequestration, Water Availability, Biodiversity, Fire Risk, and Soil Degradation [9]. While these parameters were originally synthesized to diagnose the impacts of land use modification in the Central Apennines, recent empirical evidence from the 2020–2026 period demands a refined understanding of their current trajectories.
The most recent data indicates an alarming acceleration in the “management neglect paradox”. In terms of Water Availability, longitudinal studies in Central Italy document a significant reduction in the river runoff across all seasons between 1927 and 2020, alongside a decreasing trend in the runoff coefficient driven by thermal anomalies and shifting precipitation patterns [10]. Recent hydro-climatic analyses conducted in the Central Apennine Hydrographic District highlight a significant intensification of water stress, characterized by a paradoxical increase in the frequency and severity of meteorological drought periods, despite annual precipitation volumes remaining essentially stationary between 1965 and 2020. This trend is particularly marked on the Tyrrhenian coast, where the percentage of months experiencing severe drought has quadrupled over the last twenty years, from 5% to 24%, due to multidecadal oscillations that are placing increasing pressure on the resilience of regional aquifers [11].This hydrological stress is mirrored in Biodiversity dynamics (Figure 2); the abandonment of traditionally managed wooded grasslands has reached a tipping point where shrub encroachment reduces light availability even beyond the canopy edge, displacing rare heliophilous specialists in favor of shade-tolerant pre-forest species [12].
Simultaneously, the unmanaged forest expansion, which has increased forest surface by 20% over the last 30 years, has transitioned from a carbon-positive asset to a liability [13,14]. In the temperate regions of Central Italy, the escalation of wildfire risk is increasingly driven by prolonged drought periods that interact with specific landscape vulnerabilities, particularly in mountainous and hilly terrains where the forest matrix predominates [15]. Mapping these risks reveals that geomorphological factors (specifically southern exposures and slopes exceeding 15%) create zones of high susceptibility that demand targeted spatial planning. Within these areas, successional land covers such as shrublands and wastelands have emerged as highly fire-sensitive ecological units, underscoring the necessity of differentiating between vegetation types that exacerbate fuel hazards and those that could potentially be managed as natural mitigation agents [14]. Beyond the physical susceptibility of the terrain, the Italian wildfire crisis is exacerbated by a governance framework that prioritizes reactive emergency suppression over proactive prevention, a gap that is increasingly difficult to bridge as rural abandonment drives unprecedented fuel accumulation across the Apennine ridge [16]. Finally, Soil Degradation remains a dominant negative trend; multi-temporal assessments using the Environmentally Sensitive Area Index (ESAI) in Latium (1960–2020) reveal a widening divergence in soil health between coastal and inland mountain districts, as millenary drainage and terrace systems collapse under neglect [17].
1.2. Active and Passive Rewilding: Pros & Cons
The depopulation of territories and the progressive abandonment of the cultivated soil, have proposed a debate about the management of these areas [18,19]. In particular, the discourse on passive rewilding in the Mediterranean mountains, and the Central Apennine ridge specifically, presents a multifaceted socio-ecological trajectory. On one hand, recent longitudinal evidence suggests that non-intervention can facilitate the restoration of carbon-rich, old-growth characteristics in Mediterranean mountain forests, potentially rebuilding mixed beech–silver fir (Fagus sylvatica, Abies alba) systems that are more resilient to climatic shifts [20]. This successional process, in an experimental study in Mediterranean basin mountains, is accompanied by measurable gains in soil organic carbon stocks and microbial quality, which progressively improve as croplands transition into old-forest structures [21]. Furthermore, the successful dispersal of reintroduced wild ungulates, such as red deer, highlights the capacity of rewilding to support wildlife recovery, though their preference for forest edges suggests that a cultural mosaic rather than total canopy closure remains optimal for habitat functionality [22].
Conversely, the management neglect inherent in strict passive strategies triggers a critical conflict in these human-shaped landscapes. In areas such as the Abruzzo, Lazio, and Molise National Park, an intense debate has emerged regarding the preservation of high-nature-value grasslands against the systemic expansion of unmanaged forests [23]. Theoretical perspectives argue that approaches aiming for strict non-intervention are conceptually inconsistent when applied to cultural ecosystems co-evolved with human agency over millennia. In this context, total land abandonment is increasingly viewed as suboptimal; it erodes landscape heterogeneity, displaces open-habitat specialists, and exacerbates wildfire hazards by allowing continuous fuel loads to accumulate [24]. Therefore, while passive rewilding offers distinct regulating benefits, its implementation in the Apennines must be balanced against the loss of the biodiversity-rich agricultural mosaics that define the region’s socio-ecological identity.
1.3. Socio-Economic Stewardship and the Anthropo-Systemic Value of the Apennines
The preservation of the Central Apennine cultural landscape is fundamentally dependent on the maintenance of its Anthropo-systemic value, the unique territorial capital, both tangible and intangible, that persists only through the continuous presence and active agency of local communities. Research within the 2016–2017 seismic crater area suggests that the withdrawal of human presence constitutes a net loss for the public budget, as the resulting destruction of territorial capital outweighs any immediate savings in service provision [25]. This valuation underscores the necessity of the SNAI, which seeks to counteract the marginalization of these zones by fostering integrated development models that address their structural distance from essential services. Several concrete economic pathways emerge from the literature and they involve tourism, agriculture and services sectors [26].
Agritourism and nature-based tourism are the most frequently cited opportunity. Agrotourism in European mountain areas can diversify farm income while preserving extensive agricultural landscapes [27]. The Rewilding Apennines initiative, recently selected for a five-year program under the Endangered Landscapes & Seascapes Programme starting April 2026, explicitly aims to “support new economic opportunities linked to a healthier, more dynamic natural environment” alongside ecological restoration in the central Apennines [28].
Traditional and quality food products are another pillar. A University of Parma partnership in the Apennines worked to strengthen short supply chains for mountain farmers, showing that community–university collaboration can help overcome the isolation that makes these supply chains fragile [29]. Therefore was born the idea of a proximity economy model where minor food supply chains from fragile areas become drivers of local revitalization based on cooperation, reciprocity, and shared value creation [30].
Payments for ecosystem services represent a less developed but potentially transformative mechanism. A recent work (2022) identified specific agricultural practices that deliver bundles of ecosystem services across policy scenarios, particularly grazing-related practices: extending the grazing period, grazing in semi-natural and abandoned areas, adapting stocking rates, and seasonal transhumance [31]. These findings suggest that properly compensating farmers for landscape management could close the income gap that drives abandonment.
Community-based cooperatives have emerged as an institutional innovation in Italian inner areas. An article reports that these enterprises, which pursue general interest and create local partnerships, can address the specific needs of depopulating communities and potentially reverse demographic decline by enhancing social, natural, and artificial capital [32].
1.4. Feasibility of Photovoltaic Energy Development in Mountain Regions
Current literature on renewable energy transitions in mountain regions highlights a significant spatial and multi-criteria trade-off [33]. Studies conducted in the high-altitude environment of the Andean region, consistently rank ground-mounted PV arrays lower than forest biomass or hydropower due to their substantial land-use footprint and negative impact on landscape heritage [34]. GIS-based studies in Polish mountains have shown that only about one-fifth of total incoming radiation can be converted to electricity in protected mountain areas, with annual solar potential ranging widely from 113 to 1,314 kWh/m² [35]. Throughout the year, photovoltaic systems in highland regions in Europe and Lebanon, demonstrated superior efficiency, with Performance Ratios spanning 73.73% to 88.64%. This trend suggests that lower ambient temperatures in these altitudes contribute to enhanced system output; consequently, the mean annual yield for the two locations in the Italian Alps ranges from 101.57 to 108.27 kWh/kWp [36].
Central Italy (roughly Lazio, Tuscany, Umbria, Marche, and not for specifically mountain areas; latitudes ~41-43°N) generally receives annual global horizontal irradiation (GHI) in the range of about 1,400–1,700 kWh/m²/year, depending on altitude, coastal proximity, and local climate. For a well-oriented fixed PV system (typically about 30° tilt, south-facing), the in-plane irradiation is higher, and expected annual energy yields are roughly 1,200-1,500 kWh/kWp [37]. However, notable gaps remain in the feasibility studies of PV development in Central Apennines and in understanding how non-invasive solar portfolios can be integrated into post-disaster recovery frameworks.
1.5. Study Aim and Research Questions
The primary aim of this study is to quantify the untapped solar potential of the public reconstruction sector within the Sibillini Mountains cluster and to propose a self-funding Stewardship-Renewable Energy Communities (RECs) model. We hypothesize that by leveraging the newly reconstructed public building stock as a solar backbone, mountain municipalities can generate an economic surplus dedicated to the active maintenance of the surrounding landscape. To achieve this, the research addresses the following key questions:
- RQ1: How is the solar potential spatially distributed across the seismic crater, and which municipalities can act as regional energy hubs?
- RQ2: Can the economic incentives derived from these public solar hubs provide sufficient financial coverage to support active landscape stewardship, Nature-based Solutions (NbS), in particular in high-risk landscape?
- RQ3: What is the realistic solar potential of the public reconstruction sector when filtered through a building-suitability proxy?
2. Materials and Methods
This study selects the Sibillini Mountains (about 70,000 ha spanning the Marche and Umbria regions) as your pilot area for scientifically strategic reasons. This region serves as a Living Lab for the management neglect paradox, having been severely impacted by the 2016–2017 seismic sequence and being a focal point for the SNAI.
The methodology adopts an integrated, multi-criteria approach to evaluate the feasibility of a REC as a financial engine for landscape stewardship in the Sibillini Mountains.
2.1. Study Area: The Sibillini Mountains
The pilot area encompasses the Monti Sibillini National Park and the surrounding municipalities within the 2016 seismic crater (Table 1).
This area (Figure 3) is characterized by:
- Geomorphological Vulnerability: high wildfire susceptibility in southern-exposed slopes (>15%) and successional shrublands [14].
- Hydrological Stress: a documented increase in severe drought frequency, rising from 5% to 24% in recent decades [11].
- Socio-Demographic Fragility: significant rural abandonment and Anthropo-systemic capital loss following the 2016 earthquake. [25]
2.2. Module I: Spatial Identification of Energy Assets (GIS Analysis) and Rooftop Availability
We utilize high-resolution remote sensing and cadastral data to identify two main energy features:
- PV Solar Radiation for the above-mentioned municipalities, considered under global irradiation optimum angle and calculated horizon for terrain shadow, using PVGIS-SARAH13 (EU joint Research Centre) for the period 2020-2023 (latest data available) [37];
- PV Surfaces, mapping Anthropo-systemic opportunities, including the rooftops of public seismic-damaged buildings and degraded/marginal surfaces identified for reconstruction. Using Open Data Sisma 2016, we identify seismic-damaged infrastructures: mapping the rooftops of buildings within the 2016 seismic crater that are slated for public reconstruction or temporary stabilization [38]. These surfaces represent immediate opportunities for decentralized energy generation without further land consumption [39].
2.3. Module II: The Energy-Stewardship Economic Loop
This module models the financial mechanism through which the revenue generated by the REC is redirected to fund the operational costs of landscape maintenance, effectively decoupling territorial stewardship from volatile agricultural markets.
2.3.1. Revenue Modeling: The REC Financial Engine
The economic output of the energy-sharing model is calculated based on the combined production from the PV and biomass assets identified in Module I. The revenue stream is defined by the current Italian regulatory framework of Ministry of the Environment and Energy Security (MASE) [40] and the strategic priorities of the National Strategic Plan for Inner Areas (PSNAI) 2025 [8], focusing on two primary components:
- Incentivized Energy Sharing: revenue is derived from the sharing incentive for electricity produced and consumed within the community boundaries. For the Sibillini pilot area, we apply a weighted average incentive rate based on the latest ministerial decrees, accounting for the mountain correction factor intended to offset higher installation and maintenance costs in inner areas.
- System Charge Savings: the model incorporates the reduction in regional system charges and the valorization of energy injected into the grid. This creates a surplus fund specifically earmarked for the community’s general interest-in this case, the maintenance of the Anthropo-systemic capital.
2.3.2. Operational Cost Modeling: Nature-based Solutions
The costs of active stewardship are quantified by evaluating the requirements of specific NbS necessary to restore the High Nature Value cultural mosaic. We focus on two primary interventions:
- ▪ Rotational Grazing and Transhumance: costs include the management of livestock (shepherding labor, mobile fencing, and water supply) required to maintain open grasslands and prevent woody encroachment. Following the valuation models - Bernués et al. (2014) ; Zabala et al. ( 2021) - the estimation of the economic value of these agroecosystem services amounts at approximately 120 € per hectare/year, with a significant portion of the willingness to pay attributed to wildfire prevention and biodiversity conservation [41,42].
- ▪ Mechanical Mowing and Scrub Clearing: in areas where grazing is insufficient or labor is scarce, mechanical mowing is modeled to ensure the persistence of heliophilous plant species and forest-edge habitats. These costs are adjusted for the steep topography of the Sibillini ridge (slopes >15%), which necessitates specialized equipment and higher labor intensity.
2.3.3. The Stewardship Capacity
The Energy-Stewardship Loop is closed by calculating the Stewardship Capacity (Astew):
where RREC (REC Revenue) is the gross revenue from energy production, COp (Operative Cost) represents the technical operation and maintenance costs of the energy plants, and CNbS_unit (Nature-based Solutions unit Cost) is the total cost of landscape maintenance.
This metric (Astew) identifies the specific portion of high-value or high-risk landscape (e.g., strategic fire-breaks, peri-urban slopes, or bio-corridors) that can be adopted and managed through the solar energy surplus.
3. Results
3.1. Anthropo-Systemic PV Potential
The geospatial analysis of the Anthropo-systemic photovoltaic potential across 1365 km² of the Sibillini crater reveals a highly viable, yet topographically constrained, solar resource. By weighting the high-resolution satellite data (PVGIS-SARAH3, 2020–2023) against municipal surface areas, the region demonstrates a weighted average specific yield (Yf) of 1390.52 kWh/kWp, assuming a conservative system Performance Ratio (PR) of 0.8 [43,44].
Crucially, the data quantifies the geomorphological vulnerability inherent to the Apennine ridge. The application of calculated horizon shading exposes significant intra-regional variance: optimally situated municipalities such as Castelsantangelo sul Nera achieve peak yields of 1567.36 kWh/kWp, whereas the highest regional settlement of Bolognola experiences seasonal solar radiation penalties, dropping to 1218.66 kWh/kWp (Table 2). This variance dictates that regional energy planning cannot rely on generic provincial averages, but must be hyper-localized to the topographic realities of the seismic crater.
These data are graphically represented with a high-resolution spatial distribution of anthropo-systemic solar potential (Yf) across the Sibillini crater study area (Figure 4 (a)). The map highlights the topographic constraints on energy yield, identifying high-production plateau hubs and low-production valley systems. Boundaries are based on 2026 ISTAT administrative coordinates that matches with the municipality’s denomination of PVGIS-SARAH13 of Table 3.
3.2. Quantification of the Public Solar Rooftop Availability
This study focused exclusively on the Public Reconstruction sector within the 2016 seismic crater, as public buildings (e.g., schools, town halls, gyms) possess the ideal structural, administrative, and load-profile characteristics to act as the primary energy hubs for a REC. Data regarding the number of funded public reconstruction projects were extracted from the official administrative databases (Open Data Sisma 2016). However, preliminary analysis revealed a significant semantic limitation in the datasets: the term “public interventions” aggregates actual buildings (suitable for PV integration) with non-building infrastructure (e.g., retaining walls, cemeteries, road repairs, and landslide consolidations) .To resolve this and avoid overestimating the available roof surfaces, a granular verification was conducted on the municipalities of Norcia and Preci, where detailed project descriptions were available. The analysis demonstrated that out of the total funded public works, only a fraction involved actual buildings with roof surfaces (approximately 24 out of 63 interventions in Norcia, and 20 out of 44 in Preci). Based on these localized empirical data, a Building Suitability Coefficient (Ce) was established at 0.40 (40%). For the remaining municipalities in the Sibillini cluster, where detailed architectural descriptions were missing from the regional databases, the available PV-suitable buildings were calculated by applying this conservative coefficient to the total number of public interventions. This allowed for the spatial mapping of the new urban solar backbone across the crater.
The analysis of the public reconstruction datasets, filtered through Ce, identifies a total of 325 potential energy hubs across the Sibillini cluster (Figure 4 (b)).
These represent reconstructed public buildings capable of acting as the primary nodes for a REC. Assuming a standardized conservative installation of 20 kWp per public building (typical for small-to-midscale public facilities) [45], the total installed capacity for the public sector of the cluster is estimated at 6.50 MWp. Given the specific local irradiation (Table 2), this infrastructure would generate approximately 9 GWh per year, calculated as follow:
where E is the energy produced annually [kWh], P is the peak power [kWp], PR is the Performance ratio (0.8) and H(i)opt is the average annual irradiation [kWh/m2/year]; therefore, on average in the Sibillini mountain area:
E = (20 kWp/plant · 325 plants) ·0.8 · 1738.15 = 9,037,600 kWh ≅ 9 GWh
The results, analyzed instead at the level of individual municipalities, reveal a hierarchy of Resilience Nodes (Table 3). Pieve Torina, with 33 potential hubs, emerges as the cluster leader. Other strategic nodes, such as Montegallo and Ussita, demonstrate that even sparsely populated mountain municipalities can become net energy exporters and significant land-care providers. The “verified nodes” of Norcia and Preci provide 24 and 20 hubs respectively, confirming that the urban-to-mountain funding loop is viable even in the most historically significant and sensitive areas of the crater.
3.3. Hypotized kWh Economic Value and Stewardship Surplus Calculation
To define the Astew values, it is fundamental to evaluate the related revenues (RREC) and associate costs (COP and CNbS_unit).
About RREC has been considered the current Italian Regulatory Framework for RECs, specifically the MASE Decree (Ministry of Environment and Energy Security) active in 2024-2026.
The consequent hypothesized economic value of 0.12 €/kWh is a conservative rate calculated as follows:
- ▪
- Incentive for Shared Energy: approximatively 0.11 €/kWh (Variable based on the market price, but capped/indexed for plants under 1 MW).
- ▪
- ARERA Valuation (Reimbursement of Network Charges): approximatively 0.01 €/kWh (the benefit of consuming energy where it is produced).
- ▪
- Total Revenue: this 0.12 €/kWh represents the net benefit that the REC earns for every kilowatt-hour shared among its members in the Sibillini municipalities, providing a stable 20-year revenue stream for localized landscape maintenance [46].
As shown in Table 4, the total cluster RREC is estimated at 1,077,721 € per year.
In reference to COP, to ensure the long-term viability of the solar infrastructure, the model accounts for annual operation and maintenance costs. Following international benchmarks for distributed rooftop PV in Europe [47], a conservative maintenance cost of €20/kWp/year was applied. For a standard 20 kWp installation, this results in an annual expenditure of €400, which is deducted from the gross shared energy incentives to determine the final surplus available for landscape maintenance.
The cost per hectare relative to the Nature-based Solutions (CNbS_unit) in the Sibillini mountains, are not passive (leaving nature alone). Instead, they involve active interventions designed to restore the socio-ecological equilibrium of the wooded grasslands, with these Key Activities:
- Targeted Pastoralism (shepherding): Paying shepherds to bring flocks to specific “high-risk” areas. The goal is “mosaic grazing,” which keeps the grass short and prevents the accumulation of dry biomass (fuel) that leads to intense wildfires.
- Strategic Mowing: mechanical clearance of scrub and tall grass in areas where grazing is not possible, particularly around the “Wildland-Urban Interface” (the border between the town and the forest).
- Scrub Thinning: elective removal of invasive shrubs (like Juniperus or Cytisus) that act as “ladder fuels,” allowing ground fires to climb into the tree canopy.
Despite the “surprising paucity of rewilding literature truly focusing on economics and/or providing detailed quantification” [45], an estimate has been obtained based on the following considerations. In the Rural Development Programs (PSR) for the Marche and Umbria regions (e.g., Misura 10: Agro-climatico-ambientali), the compensatory payments for organic farming or mountain pasture maintenance often range from 800 to 900€/ha [46]. However, these are passive subsidies. Literature on active stewardship (where the farmer must provide a specific service like firebreak maintenance) adds the cost of specialized labor, bringing the total to the €1,000 - €1,500 range. Using a baseline of €1,200/ha [47,48], a single 20 kWp REC can provide full financial coverage for the stewardship of approximately 2.7 hectares of critical buffer zones.
Applying the stewardship cost benchmark of €1,200/ha/year for active maintenance (e.g., fire-risk reduction, fuel-load control, and mosaic grazing), the solar energy produced by these public roofs could fund the active protection of 789.77 hectares of high-risk mountain slopes annually.
4. Discussion
The findings of this study validate the hypothesis that the post-seismic reconstruction of public infrastructure in the Sibillini Mountains can serve as a strategic energy backbone, providing the necessary financial leverage for active landscape stewardship. By prioritizing a distributed rooftop portfolio over utility-scale ground arrays, the proposed model reconciles the technical imperatives of the energy transition with the preservation of high-value Apennine cultural landscapes.
4.1. Interpretation of Results
The application of the model to the regional reconstruction data allowed for the geographic visualization of the post-seismic solar potential (Figure 5). The resulting spatial distribution highlights specific municipalities that possess a critical mass of reconstructed public buildings. These nodes are strategically positioned to act as the foundational pillars for the local Renewable Energy Communities, transforming the burden of public reconstruction into an active network of distributed renewable power generation.
The results provide a structured response to the core research objectives of this study.
RQ1: Regarding the spatial distribution of energy potential, the analysis reveals a hyper-localized energy landscape dictated by topographic and geomorphological realities. The significant delta between high-irradiation plateau hubs, such as Castelsantangelo sul Nera (1567.36 kWh/kWp), and valley-bottom systems like Bolognola (1218.66 kWh/kWp) indicates that regional planning for mountain RECs cannot rely on generic provincial averages. This spatial heterogeneity suggests that “Energy Hubs” must be strategically selected based on micro-climatic performance to maximize the stewardship dividend.
RQ2: In terms of economic feasibility, the findings demonstrate that the proposed REC framework is self-sustaining. The cumulative potential to generate approximately €1.08 million in annual revenue allows for the transition from passive, subsidy-dependent conservation to an active stewardship model. This revenue stream is capable of funding the maintenance of nearly 790 hectares of high-risk mountain slopes annually, effectively bankrolling NbS such as wildfire risk reduction and hydrogeological stabilization through private-public energy partnerships.
RQ3: The quantification of solar potential, through the Ce, successfully identifies 325 viable energy nodes across the cluster. By applying this conservative filter, the research moves beyond theoretical maximums to provide a reliable baseline for administrative implementation. This identifies the public reconstruction sector not merely as a cost center for the State, but as a productive Anthropo-systemic asset for territorial resilience.
4.2. Sensitivity Analysis and Model Robustness
The economic robustness of the proposed framework was evaluated through a sensitivity analysis utilizing a 3x3 contingency matrix (Table 5). This procedure assesses the stability of the annual Stewardship Capacity (Astew), quantified as the total fundable land area (ha) per annum, against a ±20% variation in two primary stochastic parameters:
- System Yield (Performance Ratio, PR): reflecting technical variances, environmental uncertainties, and localized shading effects (Baseline PR=0.80).
- Incentive Rates: representing the inherent volatility of energy markets and potential shifts in the national regulatory framework (Baseline 0.12 €/kWh).
The sensitivity matrix reveals that the model maintains a positive and significant impact even in the most pessimistic scenario (Bottom-left/Top-left cells). Specifically, even with a simultaneous 20% drop in both technical performance and energy incentives, the Sibillini cluster can still fund over 460 hectares of active landscape maintenance annually. Conversely, under optimistic conditions, this capacity expands to nearly 1,200 hectares, demonstrating the high scalability and economic stability of the Stewardship-REC framework as a primary tool for territorial resilience.
4.3. Methodological Limitations and Assertive Baseline
The primary limitation of this study stems from the administrative nature of the Open Data Sisma databases, which are structured for financial tracking rather than spatial or architectural analysis. Consequently, exact volumetric data and precise roof square footage for the reconstructed buildings are largely missing from the current open repositories. To bridge this gap, this study introduced the Ce as a necessary proxy. It is crucial to acknowledge that deriving its value from the detailed datasets of Norcia and Preci and extrapolating it to the entire Sibillini cluster introduces a margin of spatial uncertainty. The ratio of infrastructure-to-buildings may fluctuate depending on the specific geomorphological damage of each municipality.
However, within the context of systemic landscape planning, this 40% assumption is intentionally conservative. It filters out the administrative noise of the open data and prevents the severe overestimation of solar capacity. Therefore, the resulting maps and energy models should be interpreted not as an absolute maximum yield, but as a reliable baseline scenario for territorial policy.
4.4. Future Research Directions
Future research must leverage post-reconstruction digital twins to transition from this coefficient-based estimation to deterministic calculations. The integration of Building Information Modeling at the regional level, combined with drone-based photogrammetry, would allow for precise square-meter assessments of solar-ready surfaces. Furthermore, future studies should explore the integration of Agrivoltaics on marginal or abandoned farmland to assess if the Astew can be scaled to cover larger landscape units without conflicting with biodiversity goals. Finally, a longitudinal study of the actual ecological dividends, measuring the impact of active maintenance on wildfire frequency and soil stability, will be essential to validate the long-term success of the Stewardship-REC model in the Central Apennines.
Author Contributions
Conceptualization, B.M., F.C., G.C. and A.C.; methodology, B.M.; software, A.C.; validation, F.C. and G.C.; formal analysis, B.M. and F.C.; data curation, F.C. and A.C.; writing—original draft preparation, G.C. and A.C.; writing—review and editing, F.C. and G.C.; supervision, B.M. and A.C. All authors have read and agreed to the published version of the manuscript. All authors have read and agreed to the published version of the manuscript.
Funding
This research received no external funding.
Data Availability Statement
The raw solar radiation, PV performance datasets, and all useful data finalized to determinate AStew were obtained from the European Commission’s Joint Research Centre Photovoltaic Geographical Information System (PVGIS-SARAH3), available at https://re.jrc.ec.europa.eu/pvg_tools/en/, and Open data sisma 2016, available at https://sisma2016data.it. The custom Python-based analytical framework developed for the area-weighted cluster analysis and the extraction of topographic shading impacts is available in a public repository at https://zenodo.org/records/19356503, DOI: 10.5281/zenodo.19356503. All other derived data supporting the findings of this study are included within the article and its supplementary materials.
Conflicts of Interest
The authors declare no conflicts of interest.
Abbreviations
The following abbreviations are used in this manuscript:
| Astew | Stewardship Capacity |
| Ce | Building Suitability Coefficient |
| CNbS_unit | Natural-based Solutions Unit Cost |
| COp | Operative Cost |
| MASE | Ministry of Environment and Energy Security |
| NbS | Natural-based Solutions |
| SNAI | National Strategy for Inner Areas |
| PR | Performance Ratio |
| PV | Photovoltaic |
| PSNAI | National Strategic Plan for Internal Areas |
| REC | Renewable Energy Community |
| RREC | Renewable Energy Community Revenue |
| Yf | Average Specific Yield |
Appendix A: Comparative Summary of Solar Yield, Estimated REC Revenues and the Resulting Annual Stewardship Capacity for the 20 Investigated Municipalities
| Municipality | Area (km2) | H(i)opt [kWh/m^2/year] | Specific Yield [kWh/kWp] | Availabe public roofs | Energy (MWh/year) | RREC (€) | COP (€) | Astew (ha) |
| Amandola | 69 | 1762,46 | 1.409,97 | 12 | 338,39 | € 40.607 | € 4.800 | 29,84 |
| Arquata del Tronto | 92 | 1726,14 | 1.380,91 | 26 | 718,07 | € 86.169 | € 10.400 | 63,14 |
| Bolognola | 26 | 1523,33 | 1.218,66 | 8 | 194,99 | € 23.398 | € 3.200 | 16,83 |
| Castelsantangelo s.N. | 71 | 1959,2 | 1.567,36 | 27 | 846,37 | € 101.565 | € 10.800 | 75,64 |
| Cessapalombo | 28 | 1766,18 | 1.412,94 | 6 | 169,55 | € 20.346 | € 2.400 | 14,96 |
| Comunanza | 54 | 1730,1 | 1.384,08 | 6 | 166,09 | € 19.931 | € 2.400 | 14,61 |
| Fiastra | 84 | 1622,03 | 1.297,62 | 20 | 519,05 | € 62.286 | € 8.000 | 45,24 |
| Montefortino | 78 | 1717,37 | 1.373,90 | 11 | 302,26 | € 36.271 | € 4.400 | 26,56 |
| Montegallo | 48 | 1576,24 | 1.260,99 | 31 | 781,82 | € 93.818 | € 12.400 | 67,85 |
| Montemonaco | 68 | 1718,36 | 1.374,69 | 9 | 247,44 | € 29.693 | € 3.600 | 21,74 |
| Norcia | 276 | 1810,01 | 1.448,01 | 25 | 724,00 | € 86.880 | € 10.000 | 64,07 |
| Pieve Torina | 74 | 1750,14 | 1.400,11 | 33 | 924,07 | € 110.889 | € 13.200 | 81,41 |
| Preci | 82 | 1773,16 | 1.418,53 | 17 | 482,30 | € 57.876 | € 6.800 | 42,56 |
| San Ginesio | 78 | 1810,36 | 1.448,29 | 14 | 405,52 | € 48.662 | € 5.600 | 35,89 |
| Sarnano | 63 | 1710,36 | 1.368,29 | 10 | 273,66 | € 32.839 | € 4.000 | 24,03 |
| Ussita | 55 | 1665,42 | 1.332,34 | 29 | 772,75 | € 92.731 | € 11.600 | 67,61 |
| Valfornace | 49 | 1729,08 | 1.383,26 | 13 | 359,65 | € 43.158 | € 5.200 | 31,63 |
| Visso | 100 | 1685,3 | 1.348,24 | 28 | 755,01 | € 90.602 | € 11.200 | 66,17 |
| Sibillini Cluster | 1395 | 1738,15 | 1.390,52 | 325 | 8.981,01 | € 1.077.721 | € 130.000 | 789,77 |
References
- Ottomano Palmisano, G.; Sardaro, R.; La Sala, P. Recovery and Resilience of the Inner Areas: Identifying Collective Policy Actions through PROMETHEE II. Land 2022, 11, 1181. [Google Scholar] [CrossRef]
- Urban-Rural Europe—Introduction. 2024. Available online: https://ec.europa.eu/eurostat/statistics-explained/index.php?title=Urban-rural_Europe_-_introduction#Area_and_population.
- Hincks, S.; Carter, J.; Connelly, A. A new typology of climate change risk for European cities and regions: Principles and applications. Global Environmental Change 2023, 83, 102767. [Google Scholar] [CrossRef]
- Basile, G.; Cavallo, A. Rural Identity, Authenticity, and Sustainability in Italian Inner Areas. Sustainability 2020, 12, 1272. [Google Scholar] [CrossRef]
- ISTAT. The Geography of Inner Areas in 2020. Territories between Potential and Weaknesses. 2022. Available online: https://www.istat.it/wp-content/uploads/2024/11/20220720_FOCUS_Inner_Areas_en.pdf.
- European Commission. Digitalisation, Innovation, Competitiveness and Culture - Tourism and Culture 4.0 2021.
- European Commission. Commission Implementing Decision of 15 July 2022 Approving the Partnership Agreement with the Italian Republic; 2022. [Google Scholar]
- Department for Cohesion Policies and the South. In National Strategic Plan for Internal Areas (PSNAI) 2021-2027; Presidency of the Council of Ministers: Rome, Italy, 2025.
- Marchetti, B.; Castelli, G. Struttura Commissariale Sisma 2016, 00187 Roma, Italy, Corvaro, F., & DIISM, Università Politecnica delle Marche, 60131 Ancona, Italy. Evaluation of Environmental Impacts Related to Land Use Modification in the Central Apennines of Italy. Highlights Sustain. 2025, 4, 240–255. [Google Scholar]
- Rahi, A.; et al. Unraveling hydroclimatic forces controlling the runoff coefficient trends in central Italy’s Upper Tiber Basin. Journal of Hydrology: Regional Studies 2023, 50, 101579. [Google Scholar] [CrossRef]
- Romano, E.; Petrangeli, A. B.; Salerno, F.; Guyennon, N. Do recent meteorological drought events in central Italy result from long-term trend or increasing variability? Intl Journal of Climatology 2022, 42, 4111–4128. [Google Scholar]
- Allegrezza, M.; et al. The Effects of Different Management Intensities on Biodiversity Conservation in the Wooded Grasslands of the Central Apennines. Forests 2025, 16, 1034. [Google Scholar] [CrossRef]
- Bugalho, M. N.; Pérez-Barbería, F. J.; Pereira, J. M. C.; Gordon, I. J. Does re-wilding contribute to biodiversity conservation in Mediterranean cultural landscapes? Ambio 2026, 55, 546–557. [Google Scholar]
- Gentilucci, M.; Barbieri, M.; Younes, H.; Rihab, H.; Pambianchi, G. Analysis of Wildfire Susceptibility by Weight of Evidence, Using Geomorphological and Environmental Factors in the Marche Region, Central Italy. Geosciences 2024, 14, 112. [Google Scholar] [CrossRef]
- Trucchia, A.; Meschi, G.; Fiorucci, P.; Gollini, A.; Negro, D. Defining Wildfire Susceptibility Maps in Italy for Understanding Seasonal Wildfire Regimes at the National Level. Fire 2022, 5, 30. [Google Scholar] [CrossRef]
- Kirschner, J. A.; et al. Governance drivers hinder and support a paradigm shift in wildfire risk management in Italy. Reg Environ Change 2024, 24, 13. [Google Scholar] [CrossRef]
- Maialetti, M.; Salvati, L.; Chelli, F. M. Sustainable Development, Territorial Disparities in Land Resources, and Soil Degradation: A Multi-Temporal Approach. Resources 2024, 13, 125. [Google Scholar] [CrossRef]
- Hart, E. E.; Haigh, A.; Ciuti, S. A scoping review of the scientific evidence base for rewilding in Europe. Biological Conservation 2023, 285, 110243. [Google Scholar] [CrossRef]
- Fayet, C. M. J.; Verburg, P. H. Modelling opportunities of potential European abandoned farmland to contribute to environmental policy targets. CATENA 2023, 232, 107460. [Google Scholar] [CrossRef]
- Palli, J.; Mensing, S. A.; Schoolman, E. M.; Solano, F.; Piovesan, G. Historical ecology identifies long-term rewilding strategy for conserving Mediterranean mountain forests in south Italy. Ecological Applications 2023, 33. [Google Scholar] [CrossRef] [PubMed]
- Cortijos-López, M.; Sánchez-Navarrete, P.; Lasanta, T.; Nadal-Romero, E. How do acid or alkaline soil environments affect soil organic carbon stocks in a post-abandonment secondary succession process in Mediterranean mountain areas? Catena 2023, 232. [Google Scholar] [CrossRef]
- Rivieccio, E.; et al. Population development and landscape preference of reintroduced wild ungulates: successful rewilding in Southern Italy. Peerj 2022, 10. [Google Scholar] [CrossRef]
- Pallotta, E.; Boccia, L.; Rossi, C. M.; Ripa, M. N. Forest Dynamic in the Italian Apennines. Applied Sciences 2022, 12, 2474. [Google Scholar] [CrossRef]
- García-Ruiz, J. M.; Lasanta, T.; Nadal-Romero, E.; Lana-Renault, N.; Álvarez-Farizo, B. Rewilding and restoring cultural landscapes in Mediterranean mountains: Opportunities and challenges. Land Use Policy 2020, 99. [Google Scholar] [CrossRef]
- Morettini, G.; Compagnucci, F. What futures for the Apennines? The anthropo-systemic value of mountainous inner areas. Futures 2025, 166. [Google Scholar] [CrossRef]
- Bianchino, A.; Fusco, D.; Giordano, P.; Liguori, M. A.; Summa, D. Tourism as a means to counteract inner areas (ias) depopulation: the case study of Campania region. SIEDS 2024, 247–258. [Google Scholar] [CrossRef]
- Alhitmi, H. K.; Rahman, E. Z.; Bayram, G. E. Regenerative Tourism - the Concept of Moving beyond Responsible and Sustainable Tourism. In The Role of Artificial Intelligence in Regenerative Tourism and Green Destinations; 2024. [Google Scholar] [CrossRef]
- Restoring the wild hearth of Italy. Rewilding Apennines. Available online: https://rewilding-apennines.com/news/restoring-the-wild-heart-of-italy/.
- Mancini, M. C.; Arfini, F.; Guareschi, M. When Higher Education Meets Sustainable Development of Rural Areas: Lessons Learned from a Community–University Partnership. Social Sciences 2022, 11. [Google Scholar] [CrossRef]
- Marotta, G.; Nazzaro, C. Proximity economy and local food chains for the regeneration of inner areas. Italian Review of Agricultural Economics 2023, 78, 3–15. [Google Scholar] [CrossRef]
- Bernués, A.; et al. Targeting best agricultural practices to enhance ecosystem services in European mountains. Journal of Environmental Management 2022, 316. [Google Scholar] [CrossRef]
- Mastronardi, L.; Romagnoli, L. Community-based cooperatives: A new business model for the development of Italian inner areas. Sustainability Switzerland 2020, 12. [Google Scholar] [CrossRef]
- Ortega Romero, I.; Serrano-Guerrero, X.; Ochoa Malhaber, C.; Barragán-Escandón, A. Spatial Analysis of Rooftop Solar Energy Potential for Distributed Generation in an Andean City. Energies 2026, 19, 344. [Google Scholar] [CrossRef]
- Cely Quesada, F. Y.; et al. A review of renewable technologies for power generation in the high mountain ecosystem. Sustainable Engineering and Innovation 2025, 7, 559–574. [Google Scholar] [CrossRef]
- Stachura, T.; Halecki, W.; Bedla, D.; Chmielowski, K. Spatial Solar Energy Potential of Photovoltaic Panels Surrounded by Protected Mountain Ranges. Civil and Environmental Engineering Reports 2022, 32, 73–95. [Google Scholar] [CrossRef]
- Faraj, N.; et al. Solar power at new heights: comparing photovoltaic performance across altitudes. Solar Energy 2026, 305, 114256. [Google Scholar] [CrossRef]
- Photovoltaic Geographical Information System (PVGIS). joint-research-centre.ec.europa.eu https://jointresearch-centre.ec.europa.eu/photovoltaic-geographical-information-system-pvgis_en.
- Open Data Ricostruzione Sisma 2016. Available online: https://sisma2016data.it/.
- Kakoulaki, G.; et al. Communication on the potential of applied PV in the European Union: Rooftops, reservoirs, roads (R3 ). EPJ Photovolt. 2024, 15, 2. [Google Scholar] [CrossRef]
- Ministry of the Environment and Energy Security (MASE). Incentives for the Spread of Renewable Energy Self-Consumption Forms.
- Bernués, A.; Rodríguez-Ortega, T.; Ripoll-Bosch, R.; Alfnes, F. Socio-Cultural and Economic Valuation of Ecosystem Services Provided by Mediterranean Mountain Agroecosystems. PLoS ONE 2014, 9, e102479. [Google Scholar] [CrossRef]
- Zabala, J. A.; Martínez-Paz, J. M.; Alcon, F. A comprehensive approach for agroecosystem services and disservices valuation. Science of The Total Environment 2021, 768, 144859. [Google Scholar] [CrossRef]
- Dani Ali, N.; et al. Optimizing tilt angle of the roof for the best performance ratio of rooftop photovoltaic. Bulletin EEI 2025, 14, 4949–4961. [Google Scholar] [CrossRef]
- Solano, J. C.; Arciniega, J. J.; Espinoza-Andaluz, M.; Santana-Villamar, J.; Ordóñez-Saca, B.; Vallejo-Cervantes, C.; Rodríguez-Álava, L. The Performance Ratio of a Grid-Connected Photovoltaic System: An Experimental and Calculative Analysis. In Congress on Research, Development and Innovation in Renewable Energies; Springer Nature Switzerland: Cham, 2025; pp. 25–37. [Google Scholar] [CrossRef]
- D’Adamo, I.; Falcone, P. M.; Gastaldi, M.; Morone, P. The economic viability of photovoltaic systems in public buildings: Evidence from Italy. Energy 2020, 207, 118316. [Google Scholar] [CrossRef]
- Energetici, Gestore Servizi. DECRETO CACER e TIAD – Regole Operative per l’accesso al Servizio per l’autoconsumo Diffuso e al Contributo PNRR. 2025. Available online: https://www.gse.it/documenti_site/Documenti%20GSE/Servizi%20per%20te/AUTOCONSUMO/Gruppi%20di%20autoconsumatori%20e%20comunita%20di%20energia%20rinnovabile/Regole%20e%20procedure/ALLEGATO%201%20Regole%20Operative%20CACER.pdf.
- Solar PV Supply Chain Cost Tool: Methodology, Results and Analysis; 2026.
Figure 1.
EU data crossing between area typology (urban, intermediate, and rural) and GDP development (2008-2021). Source: Eurostat, 2024.
Figure 1.
EU data crossing between area typology (urban, intermediate, and rural) and GDP development (2008-2021). Source: Eurostat, 2024.

Figure 2.
Biodiversity in Italian Central Apennines. Spring flowering in Sarnano e Castelluccio di Norcia.
Figure 2.
Biodiversity in Italian Central Apennines. Spring flowering in Sarnano e Castelluccio di Norcia.

Figure 3.
Geographical map of the Sibillini Mountains area.

Figure 4.
Maps of the Sibillini Mountains area with: (a) distribution solar potential (Yf) and (b) estimated new roofs on public building.
Figure 4.
Maps of the Sibillini Mountains area with: (a) distribution solar potential (Yf) and (b) estimated new roofs on public building.

Figure 5.
Annual Stewardship Capacity by municipality. The area of each polygon is proportional to the hectares of active landscape maintenance fundable by the solar REC surplus.
Figure 5.
Annual Stewardship Capacity by municipality. The area of each polygon is proportional to the hectares of active landscape maintenance fundable by the solar REC surplus.


Table 1.
Municipalities of the Sibillini Mountains area under study.
| Municipality | Province | Region | Area (km2) |
| Arquata del Tronto Comunanza Montegallo Montemonaco |
Ascoli Piceno | Marche | 92 54 48 68 |
| Amandola Montefortino |
Fermo | Marche | 69 79 |
| Bolognola Castelsantangelo sul Nera Cessapalombo Fiastra Fiordimonte Pievebovigliana Pieve Torina San Ginesio Sarnano Ussita Visso Valfornace |
Macerata | Marche | 26 71 28 84 21 27 74 78 63 55 100 49 |
| Norcia Preci |
Perugia | Umbria | 276 82 |
| Sibillini Cluster | 1444 |
Table 2.
PV potential of the municipalities of Sibillini Mountains area (2020-2023).
| Municipality | Surface Area (km2) |
Avg. Annual Irradiation (H(i)opt) [kWh/m2/year] |
Specific Yield (Yf) (PR=0.8) [kWh/kWp] |
| Amandola | 69 | 1762.46 | 1409.97 |
| Arquata del Tronto | 92 | 1725.74 | 1380.60 |
| Bolognola | 26 | 1523.33 | 1218.66 |
| Castelsantangelo sul Nera | 71 | 1959.20 | 1567.36 |
| Cessapalombo | 28 | 1765.78 | 1412.63 |
| Comunanza | 54 | 1730.10 | 1384.08 |
| Fiastra | 84 | 1622.03 | 1297.63 |
| Montefortino | 78 | 1717.37 | 1373.89 |
| Montegallo | 48 | 1576.24 | 1260.99 |
| Montemonaco | 68 | 1717.96 | 1374.37 |
| Norcia | 276 | 1809.61 | 1447.69 |
| Pieve Torina | 74 | 1750.14 | 1400.11 |
| Preci | 82 | 1773.16 | 1418.53 |
| San Ginesio | 78 | 1810.36 | 1448.29 |
| Sarnano | 63 | 1710.36 | 1368.29 |
| Ussita | 55 | 1665.42 | 1332.34 |
| Valfornace | 49 | 1728.68 | 1382.94 |
| Visso | 100 | 1685.30 | 1348.24 |
| Sibillini Cluster | 1395 | 1738.15 | 1390.52 |
Table 3.
Public Solar Potential and Stewardship Capacity by Municipality under the estimate of Ce=0,4 and 20kWp installation per building.
Table 3.
Public Solar Potential and Stewardship Capacity by Municipality under the estimate of Ce=0,4 and 20kWp installation per building.
| Municipality |
Number of new roofs |
Annual Energy (MWh/year) |
| Amandola | 12 | 333.5 |
| Arquata del Tronto | 26 | 722.5 |
| Bolognola | 8 | 222.3 |
| Castelsantangelo sul Nera | 27 | 750.3 |
| Cessapalombo | 6 | 166.7 |
| Comunanza | 6 | 166.7 |
| Fiastra | 20 | 555.76 |
| Montefortino | 11 | 305.7 |
| Montegallo | 31 | 861.5 |
| Montemonaco | 9 | 250.1 |
| Norcia | 25 | 694.7 |
| Pieve Torina | 33 | 917.0 |
| Preci | 17 | 472.4 |
| San Ginesio | 14 | 389.0 |
| Sarnano | 10 | 277.9 |
| Ussita | 29 | 805.9 |
| Valfornace | 13 | 361.2 |
| Visso | 28 | 778.0 |
| Sibillini Cluster | 325 | 9031.1 |
Table 4.
Revenues and costs from PV plants in Sibillini mountains area.
| Municipality | RREC (€) | COP (€) | Astew (ha) | |
| Amandola | € 40,607 | €4,800 | 29.84 | |
| Arquata del Tronto | € 86,169 | €10,400 | 63.14 | |
| Bolognola | € 23,398 | €3,200 | 16.83 | |
| Castelsantangelo sul Nera | € 101,565 | €10,800 | 75.64 | |
| Cessapalombo | € 20,346 | €2,400 | 14.96 | |
| Comunanza | € 19,931 | €2,400 | 14.61 | |
| Fiastra | € 62,286 | €8,000 | 45.24 | |
| Montefortino | € 36,271 | €4,400 | 26.56 | |
| Montegallo | € 93,818 | €12,400 | 67.85 | |
| Montemonaco | € 29,693 | €3,600 | 21.74 | |
| Norcia | € 86,880 | €10,000 | 64.07 | |
| Pieve Torina | € 110,889 | €13,200 | 81.41 | |
| Preci | € 57,876 | €6,800 | 42.56 | |
| San Ginesio | € 48,662 | €5,600 | 35.89 | |
| Sarnano | € 32,839 | €4,000 | 24.03 | |
| Ussita | € 92,731 | €11,600 | 67.61 | |
| Valfornace | € 43,158 | €5,200 | 31.63 | |
| Visso | € 90,602 | €11,200 | 66.17 | |
| Sibillini Cluster | € 1,077,721 | €130,000 | 789.77 |
Table 5.
Sensitivity analysis of the total annual Stewardship Capacity (Astew) [ha/year] in response to ±20% fluctuations in System Yield (PR) and Incentive Rates.
Table 5.
Sensitivity analysis of the total annual Stewardship Capacity (Astew) [ha/year] in response to ±20% fluctuations in System Yield (PR) and Incentive Rates.
| Astew [ha/year] |
Yield -20% (PR=0.64) |
Baseline Yield (PR=0.80) |
Yield +20% (PR=0.96) |
|
Incentive -20% (0.096 €/kWh) |
468 ha | 611 ha | 754 ha |
| Baseline Incentive (0.120 €/kWh) | 611 ha | 790 ha | 969 ha |
|
Incentive +20% (0.144 €/kWh) |
754 ha | 969 ha | 1,184 ha |
Disclaimer/Publisher’s Note: The statements, opinions and data contained in all publications are solely those of the individual author(s) and contributor(s) and not of MDPI and/or the editor(s). MDPI and/or the editor(s) disclaim responsibility for any injury to people or property resulting from any ideas, methods, instructions or products referred to in the content. |
© 2026 by the authors. Licensee MDPI, Basel, Switzerland. This article is an open access article distributed under the terms and conditions of the Creative Commons Attribution (CC BY) license (http://creativecommons.org/licenses/by/4.0/).
Copyright: This open access article is published under a Creative Commons CC BY 4.0 license, which permit the free download, distribution, and reuse, provided that the author and preprint are cited in any reuse.


