

Submitted:
06 April 2026
Posted:
08 April 2026
You are already at the latest version
Abstract
Antibiotic contamination of water, particularly tetracycline (TC), poses significant environmental risks and requires sustainable treatment solutions. This study reports a green and cost-effective synthesis of a ZnO/chitosan nanocomposite (ZnO/CS) for photocatalytic TC removal. ZnO nanoparticles were synthesized using lime juice as a natural stabilizing agent and subsequently incorporated into a chitosan matrix. The physicochemical properties of the composite were characterized by X-ray diffraction (XRD), Fourier-transform infrared spectroscopy (FTIR), UV–Vis diffuse reflectance spectroscopy (UV–Vis DRS), scanning electron microscopy coupled with energy-dispersive X-ray spectroscopy (SEM–EDX), transmission electron microscopy (TEM), X-ray photoelectron spectroscopy (XPS), and Brunauer–Emmett–Teller (BET) surface area analysis. The results confirmed the formation of hexagonal wurtzite ZnO and strong interfacial interactions between ZnO and the –NH2/–OH groups of chitosan. A red shift reduced the band gap from 3.18 to 3.03 eV, while the specific surface area increased from 10.7 to 21.7 m² g⁻¹. Under LED irradiation, the ZnO/CS nanocomposite achieved 94% TC removal within 120 min, following pseudo-first-order kinetics based on the Langmuir–Hinshelwood model. These findings demonstrate the potential of the green-synthesized ZnO/CS nanocomposite for antibiotic removal from aqueous environments.
Keywords:
green synthesis
; ZnO nanoparticles
; ZnO/Chitosan nanocomposites
; photocatalytic degradation
; Tetracycline
1. Introduction
The increasing contamination of water resources by hazardous organic compounds, particularly pharmaceutical residues such as antibiotics, has emerged as a critical global environmental challenge owing to their adverse effects on aquatic ecosystems and potential risks to human health [1,2,3]. Tetracycline (TC) is an antibiotic extensively used in the pharmaceutical industry for humans as well as for livestock. When TC is released into the environment directly or indirectly, it causes various impacts on human health and the ecosystem [4,5,6].
Many techniques have already been implemented for water treatment such as membrane filtration, absorption, activated carbon, ozonation, ion exchange, Fenton catalytic reagent, electro-chemical destruction, etc. However, these techniques have some limitations, such as high cost, the formation of by-products, and the formation of strongly activated sludge, which is not suitable for wastewater treatment. Advanced oxidation processes (AOPs) by photocatalysts are considered a promising technique for wastewater treatment, which is based on the production of highly reactive oxidizing species that help to break down complex antibiotics bonds into simpler products [7,8]. Photocatalysts based on semiconductors have attracted great attention towards advanced material science research [9]. Among semiconductors, zinc oxide (ZnO) is widely used in various fields because of its distinct properties, such as a wide and direct band-gap energy, high exciton binding energy at room temperature, biocompatibility, abundant availability, good chemical stability, and low production costs [10]. These unique properties make ZnO a promising candidate for applications like ultraviolet light detectors, solar cells, transducers, sensors, and photocatalysts [10].
To synthesize ZnO nanoparticles (NPs),, a variety of synthetic approaches have been carried out, such as hydrothermal processes, sol-methods, chemical vapor deposition, precipitations, laser ablations, and physical vapor depositions [11,12,13]. These methods typically involve the use of organic solvents and hazardous reducing agents, which are, in most cases, highly reactive and toxic to the environment [14]. Therefore, to overcome the challenges of this method, green synthesis could be an expectant alternative, enabling eco-friendly and cost-effective protocols using green and renewable materials [13]. Green approaches use biological resources such as plant extracts, bacteria, fungi, algae, and yeast, which contain natural phytochemicals that function as both reducing and capping agents for the synthesis of ZnO (NPs), providing an eco-friendly alternative to traditional chemical methods [14,15]. Lemon, which is commonly used for cooking all over the world, has been employed for the synthesis of various nanomaterials owing to the high contents of bioactive compounds like ascorbic acid, citric acid, sugars, and polyphenols serving as reducing agents [16,17,18]. Therefore, the utilization of lemon juice as a green synthesis medium represents a feasible and sustainable approach, as it not only replaces hazardous chemical reagents but also reduces energy consumption and environmental impact.
The fabrication of metal oxide-based composites has emerged as an effective route to improve the efficiency of semiconductor oxide photocatalytic systems. Hybrid composites formed by integrating polymers with metal oxides offer significant advantages by generating synergistic effects that enhance light absorption, reduce charge recombination, and improve photocatalytic performance [19,20]. Chitosan (CS), a natural polysaccharide polymer derived from chitin, has gained immense attention for its use in nanocomposite materials due to its biocompatibility, nontoxicity, biodegradability, and cost-effectiveness [21,22]. Additionally, chitosan’s numerous amino and hydroxyl groups make it an excellent adsorbent for heavy metal ions and other pollutant uptake [23].
The incorporation of oxide NPs into a chitosan matrix markedly enhances both the mechanical stability and photocatalytic activity of the resulting composite. The improvement in mechanical strength and structural integrity is mainly attributed to strong interfacial interactions between oxide and the functional groups (–NH2 and –OH) of chitosan, which reinforce the polymer network and effectively suppress nanoparticle agglomeration [24,25]. In parallel, the enhanced photocatalytic performance originates from the synergistic interaction between nanoparticles and the biopolymer matrix, where chitosan promotes uniform dispersion of active sites, facilitates interfacial charge transfer, and enhances pollutant adsorption via electrostatic and hydrogen-bonding interactions, leading to more efficient generation and utilization of reactive species under light irradiation [24,26].
Numerous studies have reported chitosan–metal oxide composites for environmental remediation, in which the metal oxide NPs are typically synthesized via established physicochemical routes before being incorporated into the chitosan matrix. For instance, ZnO NPs prepared by precipitation have been immobilized onto chitosan to form ZnO/CS nanocomposites for dye degradation and pesticide adsorption [27]. Similarly, TiO2 NPs synthesized through sol–gel method have been embedded in chitosan frameworks to develop photocatalytic membranes for water purification [28]. Furthermore, spinels (e.g., NiCo2O4, CoFe2O4) have been successfully loaded onto chitosan, yielding hybrid materials with enhanced adsorption capacity and photocatalytic performance toward various environmental pollutants [23,29]. However, most conventional strategies rely on chemical-intensive routes, potentially limiting the sustainability and scalability of these nanocomposites. Therefore, developing greener and more sustainable synthesis approaches that minimize chemical consumption and energy input is highly desirable for advancing chitosan-based functional materials for environmental applications.
In this study, green synthesis using lemon juice was employed to prepare ZnO, followed by the fabrication of a ZnO/CS nanocomposites, in which ZnO NPs were uniformly immobilized on the chitosan matrix. The ZnO/chitosan composite was characterized and evaluated for its photocatalytic performance in tetracycline degradation
2. Materials and Methods
2.1. Materials
All the reagents are of analytical grade and used without further purification. They include Zn(CH3COO)2.2H2O (99%), Chitosan (DE = 80%), NaOH (98%), CH3COOH (99%), HCl (37%, d = 1.19 g mL−1 ), and Tetracycline (98%). Deionized distilled water was used as the solvent throughout the experiment.
2.2. Collection of Lime Juice
Green lime was purchased from a supermarket in Vinh city, Nghe An province, Vietnam, and thoroughly washed with deionized distilled water. The juice was collected by squeezing the lime, followed by centrifugation (13,000 rpm, 10 min), filtration, and finally stored at 4 oC for further use.
2.3. Synthesis of ZnO/CS
1.097 g Zn(CH3COO)2·2H2O was dissolved in 50 mL of deionized water, followed by the addition of 20 mL lime extract and 30 mL deionized water. The mixture was magnetically stirred at 70–80 °C until gelation occurred. The resulting gel was dried and subsequently calcined at an appropriate temperature to obtain ZnO NPs.
For the preparation of ZnO/CS, 1 g of chitosan was first dissolved in 100 mL of 1% (v/v) acetic acid. Then, 0.3 g of the synthesized ZnO NPs was added to the solution. The mixture was magnetically stirred and ultrasonicated for 30 minutes. 1 M NaOH solution was then added dropwise until the pH reached approximately 10. The suspension was ultrasonicated for an additional 30 minutes, followed by heating at 80 oC for 3 hours. Finally, the precipitate was filtered and washed several times with distilled water to reach a neutral pH, then dried in an oven at 50 to 60 oC for 6 hours to obtain nanocomposite.
2.4. Characterizations of ZnO NPs and ZnO/CS Nanocomposite
The crystalline phases and structural parameters were determined by using X-ray Diffraction (XRD) on a D8 Advance diffractometer (Bruker, Germany) equipped with CuKα radiation (λ = 0.15406 nm). The diffraction patterns were recorded in the 2θ range of 10o to 70o.
Surface functional groups and chemical interactions between ZnO and chitosan were identified using Fourier Transform Infrared Spectroscopy (FT-IR) on a Thermo-Nicolet Nexus 670 instrument.
The surface morphology and particle size distribution were observed via Scanning Electron Microscopy (SEM) on a HITACHI S-4800 and Transmission Electron Microscopy (TEM) on a JEOL JEM-1400.
Elemental composition and mapping were performed using Energy-Dispersive X-ray Spectroscopy (EDX) technique on a HORIBA 7593-H system integrated into the HITACHI S-4800 SEM.
The optical properties and light-harvesting capacity of the solid samples were evaluated using UV–Vis Diffuse Reflectance Spectroscopy (UV–Vis DRS) on a Cary 5000 UV–Vis–NIR spectrometer.
The chemical valence states and surface elemental oxidation states were analyzed using X-ray Photoelectron Spectroscopy (XPS) on an ESCALab 250 spectrometer (Thermo VG, UK).
The specific surface area and porosity of the materials were determined by the Brunauer–Emmett–Teller (BET) method using nitrogen adsorption-desorption isotherms on a Tristar-3000 (and Tristar-3020) instrument.
2.5. Photocatalytic Evaluation
A 30 W LED lamp was used to provide visible light for all degradation experiments in this study. Photocatalytic assessments were performed in a glass vessel containing 50 mL of TC solution (50 mg/L) and 0.05 g of catalyst material. The TC solution containing the photocatalyst was magnetically stirred in the dark at room temperature for 60 min to achieve adsorption-desorption equilibrium. Then, the degradation performance of TC was assessed under visible light using ZnO, CS, and ZnO/CS. During the photocatalytic degradation of TC, a small aliquot of the solution was withdrawn every 30 min and analyzed by a UV-Vis spectrophotometer to determine the concentration of the remaining pollutant. The removal efficiency (RE) of TC is calculated using the following equation:
here, (mg/L) and (mg/L) correspond to the concentration of TC at time t and the initial concentration, respectively.
The kinetics of the photodegradation reaction of TC were studied by first-order kinetics model expressed in Equation (2), according to the Langmuir–Hinshelwood kinetics model:
where k and t are respectively the kinetic rate constant and irradiation time. The k value indicates the photocatalytic activity, and it was calculated by the linear plot slope.
3. Results
3.1. Synthesis and Characteristics of ZnO NPs
To evaluate the crystallization process and the formation of the desired phase for ZnO, the sample was annealed at different temperatures and then analyzed by XRD (Figure 1). The sample heating in the temperature of 300 °C indicated broad and low peaks, proving that the sample is primarily in the amorphous form. With increasing calcination temperature (>300 °C), the samples gave the characteristic peaks of ZnO corresponded to the characteristic spacing between (100), (002), (101), (102), (110), (103), (200), (112), and (201) crystal planes of a hexagonal structure, providing clear evidence of the formation of ZnO (JCPDS number 36-1451) [30]. Furthermore, the reflection peaks became sharper with increasing annealing temperature, indicating an increase in crystallinity. From the above results, we chose the heating temperature of 500 oC to prepare ZnO NPs for the next experiments.
The average particle size D (nm) has been calculated using the well-known Scherrer’s formula [31]:
where K is the correction factor, which is set as 0.9, β is the FWHM of the most intense peak (101).
In the ZnO hexagonal structure, the plane spacing d is related to the lattice constants a, c, and the Miller indices by the following relation [32]:
The lattice parameter (a, c), cell volume (V), and the X-ray density (ρ) were calculated from the (002) and (100) planes of XRD patterns using the following equations [32]:
where M is the molecular weight of the substance (81.38 g/mol for ZnO), n is the number of formula units in the unit cell (n = 2 for ZnO), and N is Avogadro number.
Table 1 lists the crystallite size (D), lattice parameter (a), cell volume (V), and the X-ray density (ρ) of ZnO nanoparticles at different annealing temperatures obtained from X-ray diffraction data.
It is evident that the calculated crystallite sizes are found to increase with the annealing temperature, which may be due to the merging of smaller crystallites into larger ones because of high annealing temperatures [30].
The calculated lattice parameters are in close agreement with those of bulk ZnO (JCPDS Card no. 36-1451, a = 3.2490 Å, c = 5.2060 Å. A progressive increase in annealing temperature leads to an expansion of the lattice constants ‘a’ and ‘c’ as well as the unit cell volume ‘V’, which can be attributed to the growth of crystallite size. Similar observations have been reported in previous studies [30,33,34].
In addition, the most prominent diffraction peaks of (100), (002), and (101) crystal planes are shifted towards lower diffraction angle (2) with increasing annealing temperature, which is evident from Figure 1b. This leads to an increase in interplanar distance of the ZnO crystal. This kind of behaviour can be attributed to a decrease in microstrain in the ZnO lattice after annealing [30,35].
3.2. X-Ray Diffraction Analysis of ZnO/CS
The XRD patterns of CS, ZnO, and ZnO/CS nanocomposite are shown in Figure 2. The XRD diffraction profile of CS clearly indicates a characteristic crystalline reflection at around 2θ ≈ 20 o, which is typically associated with the semi-crystalline nature of chitosan [36,37,38].
For ZnO, the XRD pattern can be indexed to the wurtzite structure, which is well matched with the standard card for the hexagonal ZnO crystal (JCPDS card no. 36-1451). The diffraction peaks of ZnO were detected at 2θ values of 31.86, 34.53, 36.37, 47.67, 56.77, 62.97, 66.53, 68.07 and 69.23° corresponding to hkl values of (100), (002), (101), (102), (110), (103), (200), (112), and (201) [39] .
In the case of the ZnO/CS system, the XRD pattern of ZnO/CS showed the main peaks corresponding to both ZnO and chitosan. However, the intensity of these peaks was lower than that of pure ZnO and chitosan, which can be attributed to interactions between ZnO and chitosan’s functional groups. It can be observed that the crystal structure of ZnO remained intact after interacting with chitosan, and the presence of two separate sets of diffraction peaks for ZnO and chitosan confirms the successful formation of ZnO/Chitosan [40].
In the case of the ZnO/CS system, the XRD pattern of ZnO/CS showed the main peaks corresponding to both ZnO and chitosan. However, the intensity of these peaks was lower than that of pure ZnO and chitosan, which can be attributed to interactions between ZnO and chitosan’s functional groups. It can be observed that the crystal structure of ZnO remained intact after interacting with chitosan, and the presence of two separate sets of diffraction peaks for ZnO and chitosan confirms the successful formation of ZnO/Chitosan [40].
3.3. FTIR Characterization
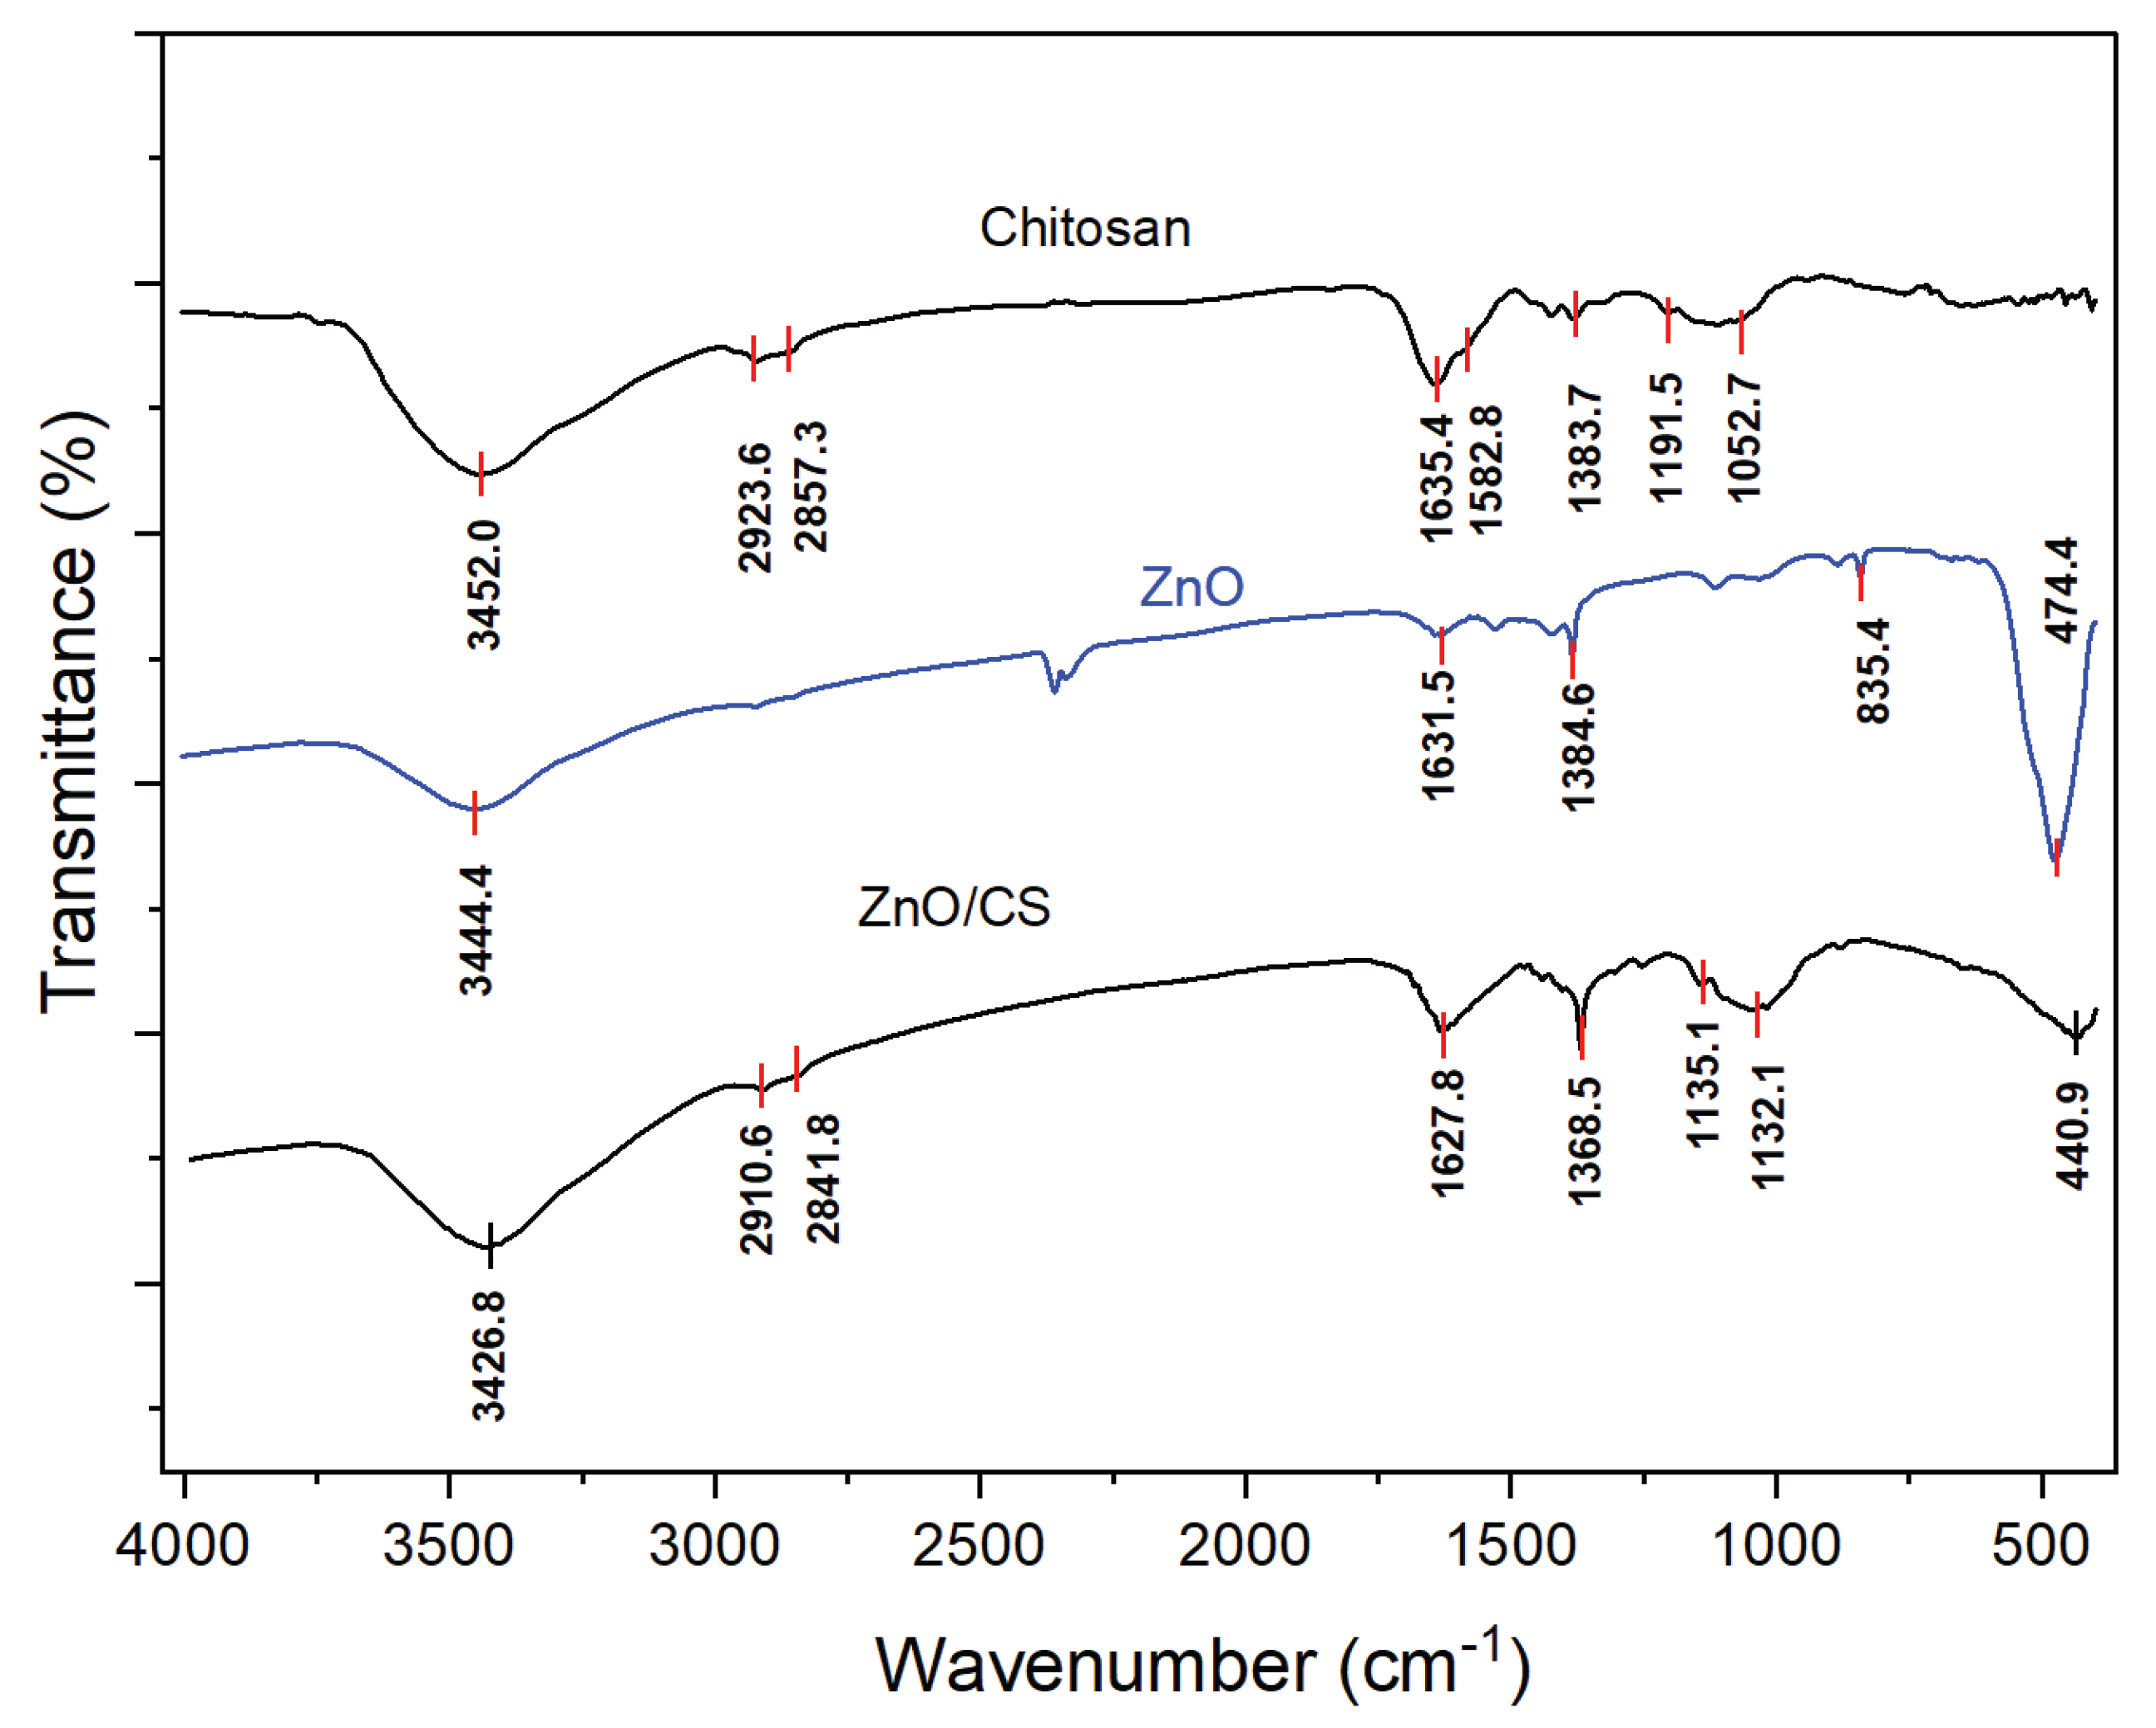
In the CS spectrum, a broad peak at 3452.0 corresponds to the stretching vibrations of hydroxyl (–OH) and amino ) groups [41]. The absorption peaks at 2923.6, 2857.3 are attributed to the symmetric and asymmetric vibrations of C-H stretching vibration, respectively [42,43,44,45].
Figure 3.
The FTIR spectra of pure chitosan (CS), ZnO, and ZnO/CS nanocomposite.
In the CS spectrum, a broad peak at 3452.0 corresponds to the stretching vibrations of hydroxyl (–OH) and amino ) groups [41]. The absorption peaks at 2923.6, 2857.3 are attributed to the symmetric and asymmetric vibrations of C-H stretching vibration, respectively [42,43,44].
In addition, other absorption peaks appeared at 1635.4 corresponding to amide carbonyl groups (45–47), 1383.7 assigned to C–H bending vibrations, and 1052.7 attributed to the C–O–C stretching vibration of β-(1→4) glycosidic linkages connecting glucosamine and N-acetylglucosamine units in the chitosan polymer backbone [46,47,48,49]. The presence of free amino groups in deacetylated glucosamine mers is visible at 1582.8 and 1191.5 cm−1.
In the FTIR spectrum of ZnO NPs, the strong broad peaks in higher region at 3444.4 is due to the stretching vibration of hydroxyl (OH) group on the surface of ZnO nanoparticle [50,51]. A slightly broad peak around 1633 is attributed to the bending vibration of the OH group, and might be due to the chemisorbed and/or physiosorbed moisture on the surface of ZnO NPs [52].
In the ZnO/CS nanocomposite, a combination of both CS and ZnO characteristic peaks was observed. The distinctive peaks of ZnO are shifted to a lower wavenumber, from 474.4 in pure ZnO to 440.9 in the ZnO/CS nanocomposite. Additionally, the broad peak at 3452.0 , assigned to the stretching vibrations of the –NH2 and –OH groups in chitosan, shifted to 3426.8 in the ZnO/CS nanocomposite. The reason for this appears to be the interaction between ZnO molecules and chitosan’s OH and NH2 groups [53,54,55].
3.4. Microstructural and Elemental Analysis
Figure 4 shows the FESEM, TEM images and the EDS profiles of ZnO NPs and ZnO/CS.
The SEM and TEM image (Figure 4a) shows ZnO nanoparticles with predominantly spherical to quasi-spherical morphology, with an average particle size of approximately 20–30 nm. The particles exhibit noticeable aggregation, forming larger agglomerates due to their high surface energy and interparticle interactions [56]. The SEM image of the ZnO/Chitosan composite displays a significant change in morphology (Figure 4c). The original spherical shape of the ZnO nanoparticles is no longer clearly visible and appears to be embedded within or coated by the chitosan matrix. TEM image of ZnO/CS nanocomposite (Figure 4c) presented well defined and smoother particles. Thus, it can be concluded that chitosan prevented the known tendency of ZnO agglomeration. SEM and TEM images of ZnO/CS revealed that ZnO nanoparticles were uniformly distributed within the chitosan matrix with significantly reduced agglomeration compared to pure ZnO, suggesting that chitosan acts as a stabilizing and dispersing agent.
EDS analysis was performed to confirm the presence of different elements and approximate their composition in ZnO NPs and ZnO/CS nanocomposite (Figure 4b,d). EDS results indicated the presence of elements Zn, O in ZnO, and C, O, N, and Zn in the nanocomposite. The quantitative analyses, expressed as weight percentages for each element, showed good agreement with the expected values.
3.5. UV–VIS Diffuse Reflectance Spectroscopy (DRS) Analysis
Figure 5a shows the absorbance spectra of ZnO and ZnO/CS samples. There is a slight red shift in the UV–vis absorption edge, observed for ZnO/CS compared to ZnO. The optical band gap of the photocatalysts can be calculated from the plot of (αhυ)2 versus the photon energy (hυ) [57], as shown in Figure 5b. The band gaps of ZnO and ZnO/CS are 3.18 and 3.03 eV, respectively. The reduction in the optical bandgap of ZnO/chitosan nanocomposites compared to pure ZnO is primarily attributed to strong chemical interactions and complexation between Zn2+ ions and the amino (−NH2) and hydroxyl (−OH) groups of the chitosan matrix [58]. This interaction leads to the formation of interfacial heterojunctions and the introduction of intermediate energy levels within the forbidden gap, facilitating electronic transitions with lower energy requirements and enhancing light harvesting in the visible region [59].
3.6. X-Ray Photoelectron Spectroscopy (XPS) Analysis
XPS was used to determine the electronic states of elements on the material surface. A full-range XPS curve of ZnO/CS is shown in Figure 6a, which confirms the presence of expected C, O, N, and Zn elements in the material.
For pure ZnO, the binding peaks at 1044.2 eV and 1021.2 eV, assigned to Zn 2p1/2 and Zn 2p3/2, respectively, confirm the presence of Zn2+ on the ZnO surface, as shown in Figure 6b. In the case of ZnO/CS, two corresponding peaks are observed at slightly lower energies of 1044.1 and 1021.1 eV (Figure 6c). This slight shift toward lower energy is attributed to the interaction between CS and ZnO nanoparticles [60].
The O 1s XPS spectrum of ZnO (Figure 6d) shows two peaks centered at 529.7 and 531.6 eV assigned to ions in the ZnO structure, and the water and/or the residual organic species coming from the precursors [61]. As displayed in Figure 6e, the O 1s spectrum of ZnO/CS was deconvoluted into three peaks and appeared at binding energies of 530.1 eV, 531.0 eV, and 532.3 eV, which were assigned to Zn-O, C-O/C=O, and O-H, respectively.
As shown in Figure 6f, the high-resolution XPS curve of carbon in the region C 1s exhibits four characteristic peaks at 284.5, 286.1, and 287.6 eV corresponding to the C-C/C-H, C-N/C-O, and O-C-O/C=O bond, respectively [62]. The N 1s high resolution spectra of ZnO/CS is shown in Figure 6g. The peaks at 400.5 and 399.3 eV were assigned to amino groups (–NH- and –NH2) and the protonated amino groups (NH3+ ) from chitosan [63].
3.7. BET Analysis
The specific surface areas, total pore volume, and pore size of ZnO and ZnO/CS are provided in Table 2. As shown in Table 2, the incorporation of chitosan significantly influences the textural properties of ZnO. The BET surface area increases from 10.7 m2/g for ZnO to 21.7 m2/g for the ZnO/CS composite, indicating that chitosan effectively enhances the surface area. This enhancement can be attributed to the function of chitosan as a supporting matrix that promotes the homogeneous dispersion of ZnO nanoparticles and effectively suppresses their aggregation on the chitosan framework [60]. Similarly, the total pore volume rises from 0.012 to 0.11 cm3/g, while the average pore size decreases from 17.9 nm to 15.0 nm after chitosan incorporation, suggesting the development of a more porous structure upon composite formation. These results demonstrate that the ZnO/CS composite exhibits a more developed mesoporous structure, which is expected to provide a greater number of active sites and facilitate mass transfer during catalytic applications.
3.8. Photocatalytic Degradation
The removal efficiency of TC by the samples is presented in Figure 7. Under dark conditions, the removal efficiencies of TC using CS, ZnO, and ZnO/CS are approximately 30%, 22%, and 45%, respectively. In the absence of the photocatalyst, the photodegradation of TC under light irradiation was very slow, reaching only about 10%.
After 120 min of light irradiation, the removal efficiencies of TC over ZnO and ZnO/CS were 60% and 94%, respectively. Moreover, the rate constant of ZnO incorporated chitosan is 0.024 in comparison to ZnO as 0.008. Therefore, the photocatalytic performance of ZnO has been enhanced with the addition of chitosan. The ZnO/chitosan nanocomposite achieves superior removal efficiency due to interactions between Zn2+ ions and the amino and hydroxyl groups of the chitosan matrix, which narrow the energy bandgap and extend light absorption into the visible range [49,58]. The incorporation of chitosan into the composite structure also effectively inhibits the recombination of photo-generated electron-hole () pairs, thereby extending the charge carrier lifespan to promote the generation of reactive oxygen species (ROS) such as hydroxyl radicals [49]. Additionally, chitosan acts as a substrate that promotes uniform nanoparticle dispersion, prevents agglomeration, and increases surface area, active adsorption sites, and photocatalytic degradation [49].
4. Conclusions
In sumary, a sustainable green approach was successfully developed to synthesize ZnO NPs using lime juice as a natural stabilizing agent, followed by the fabrication of ZnO/CS nanocomposite for visible-light-driven degradation of tetracycline (TC). XRD analysis confirmed the formation of hexagonal wurtzite ZnO with high crystallinity at 500 °C. The integration of chitosan, verified by FTIR and XPS, significantly enhanced the materials properites, increased the BET surface area from 10.7 to 21.7 m2 g−1 and narrowing the optical band gap from 3.18 to 3.03 eV, indicating enhanced visible-light absorption.
Under LED irradiation, the ZnO/CS nanocomposite achieved a superior TC removal efficiency of 94% within 120 min, outperforming pure ZnO (60%). The degradation followed pseudo-first-order kinetics based on the Langmuir–Hinshelwood model, with the rate constant increased from 0.008 to 0.024 min−1. The enhanced performance is attributed to improved adsorption, efficient charge separation, and suppressed electron–hole recombination by strong interfacial interactions between ZnO and chitosan. Overall, the ZnO/CS nanocomposites represent an eco-friendly and highly efficient material for antibiotic remediation wastewater.
Author Contributions
Conceptualization, N.X.D., P.T.M.H., L.T.H. and N.H.D.; methodology, P.T.M.H., T.T.N.Q., L.T.V.H. and P.T.H.T.; validation, N.X.D., L.T.H., P.T.H.T. and L.T.V.H.; formal analysis, N.X.D.,T.T.N.Q., P.T.M.H. and L.T.V.H.; data curation, P.T.M.H.; writing-original draft preparation, N.X.D., P.T.M.H. and L.T.H.; writing-review and editing, N.X.D., P.T.M.H., L.T.H., L.T.V.H. and N.H.D.; visualization, P.T.M.H.; project administration, N.X.D.; funding acquisition, N.X.D. All authors have read and agreed to the published version of the manuscript.
Funding
This research was funded by the Vietnam Ministry of Education and Training under grant number B2024-TDV-10.
Data Availability Statement
All the data for this article can be found within the article itself.
Conflicts of Interest
The authors declare that they have no known competing financial interests or personal relationships that could have appeared to influence the work reported in this paper.
References
- Nguyen, T.D.; Lee, T.; Van Tran, T.; Nguyen, V.H.; Nong, L.X.; Bach, L.G.; Vo, D.-V.N. Multicomponent Photocatalysts for Synergic Removal of Antibiotics in Aqueous Media: A Review. Environ Chem Lett 2023, 21, 935–980. [Google Scholar] [CrossRef]
- Jitae, K.; Nguyen, M.V.; Thi Huong, P. Visible Light-Driven CoMoO4/g-C3N4 Photocatalyst for Removal of Antibiotic Contaminant from Wastewater. Mater. Chem. Phys. 2025, 334, 130433. [Google Scholar] [CrossRef]
- Tweir, R.; Zyoud, A.H.; Zyoud, S.H.; Nassar, H.; Zyoud, S.H.; Qamhieh, N.; Helal, M.H.S.; Hilal, H.S. Adsorption of Tetracycline from Contaminated Water Using ZnO, Montmorillonite, and ZnO/Montmorillonite Composites: Adsorption Kinetics and the Role of pHzcp in Adsorption Capacity. Clays Clay miner. 2025, 73, e29. [Google Scholar] [CrossRef]
- Wen, A.; Wang, H.; Yuan, S.; Yu, H.; Guo, Y.; Yao, W. Underestimation of Tetracycline Antibiotic Residues in Chicken Meat: The Role of Protein Binding. Food Chem. 2025, 463, 141057. [Google Scholar] [CrossRef]
- Ohore, O.E.; Zhang, J.; Zhou, S.; Sanganyado, E.; Gu, J.-D.; Yang, G. Tetracycline and Quinolone Contamination Mediate Microbial and Antibiotic Resistant Gene Composition in Epiphytic Biofilms of Mesocosmic Wetlands. Water Res. 2024, 267, 122484. [Google Scholar] [CrossRef]
- Tang, Z.; Hu, C.; Zhang, R.; Yu, J.; Cai, L.; Yang, Z.; Wang, X.; Wu, S.; Liu, D. Investigation of the Photocatalytic Activity of Magnetically Recoverable G-C3N4/CoFe2O4 /Bi2MoO6 Particles for Purifying Tetracycline Antibiotics: Synthesis, Characterization, Ecotoxicity Analysis, and Plant Toxicity Test. RSC Adv. 14, 15302–15318. [CrossRef]
- Zheng, T.-H.; Zhang, Z.-Z.; Liu, Y.; Zou, L.-H. Recent Progress in Catalytically Driven Advanced Oxidation Processes for Wastewater Treatment. Catalysts 2025, 15. [Google Scholar] [CrossRef]
- Recent Progress on the Removal of Antibiotic Pollutants Using Photocatalytic Oxidation Process: Critical Reviews in Environmental Science and Technology: Vol 52, No 8. Available online: https://www.tandfonline.com/doi/abs/10.1080/10643389.2020.1859289 (accessed on 3 February 2026).
- Ahmed, M.A.; Mohamed, A.A. Recent Progress in Semiconductor/Graphene Photocatalysts: Synthesis, Photocatalytic Applications, and Challenges. RSC Adv. 2023, 13, 421–439. [Google Scholar] [CrossRef] [PubMed]
- Wang, J.; Chen, R.; Xiang, L.; Komarneni, S. Synthesis, Properties and Applications of ZnO Nanomaterials with Oxygen Vacancies: A Review. Ceram. Int. 2018, 44, 7357–7377. [Google Scholar] [CrossRef]
- Swain, M.; Mishra, D.; Sahoo, G. A Review on Green Synthesis of ZnO Nanoparticles. Discov. Appl. Sci. 2025, 7, 997. [Google Scholar] [CrossRef]
- Raha, S.; Ahmaruzzaman, M. ZnO Nanostructured Materials and Their Potential Applications: Progress, Challenges and Perspectives. Nanoscale Adv. 2022, 4, 1868–1925. [Google Scholar] [CrossRef]
- Alhujaily, M.; Albukhaty, S.; Yusuf, M.; Mohammed, M.K.A.; Sulaiman, G.M.; Al-Karagoly, H.; Alyamani, A.A.; Albaqami, J.; AlMalki, F.A. Recent Advances in Plant-Mediated Zinc Oxide Nanoparticles with Their Significant Biomedical Properties. Bioengineering 2022, 9, 541. [Google Scholar] [CrossRef] [PubMed]
- Agarwal, H.; Venkat Kumar, S.; Rajeshkumar, S. A Review on Green Synthesis of Zinc Oxide Nanoparticles—An Eco-Friendly Approach. Resour.-Effic. Technol. 2017, 3, 406–413. [Google Scholar] [CrossRef]
- M, P.; T, G.; H, S.; Ea, D.; Ea, S.; Am, H.; Us, A.; M, S.-N. Green Synthesis of Nanomaterials by Using Plant Extracts as Reducing and Capping Agents. Environ. Sci. Pollut. Res. 31 24768–24787.
- Mahiuddin, M.; Ochiai, B. Comprehensive Study on Lemon Juice-Based Green Synthesis and Catalytic Activity of Bismuth Nanoparticles | ACS Omega. ACS Omega 7, 35626–35634. [CrossRef]
- Edreese, A.; Sarah, A.; Faheem, A.; Nishat, A.; Mohammed, A.-H.; Garwin, K.S. Green Synthesis of Silver Nanoparticles and Their Reduced Graphene Oxide Nanocomposites as Antibacterial Agents: A Bio-Inspired Approach. Acta Metall. Sin. 30, 45–52.
- Alvarado, J.A.; Anaya Conzalez, G.S.; Arce-Plaza, A.; Reyes-Carmona, S. New Approach in Effective and Reproducible Green Synthesis of Pure ZnO Nanoparticles Using Lemon Juice with Less Solvent and without Strong Base Chemical Precursor. Ceram. Int. 2025, 51, 18348–18355. [Google Scholar] [CrossRef]
- Tran, V.V.; Nu, T.T.V.; Jung, H.-R.; Chang, M. Advanced Photocatalysts Based on Conducting Polymer/Metal Oxide Composites for Environmental Applications. Polymers 2021, 13, 3031. [Google Scholar] [CrossRef]
- Akhtar, M.; Shahzadi, S.; Arshad, M.; Akhtar, T.; Janjua, M.R.S.A. Metal Oxide-Polymer Hybrid Composites: A Comprehensive Review on Synthesis and Multifunctional Applications. RSC Adv. 15, 18173–18208. [CrossRef]
- Hydrothermally Assisted Synthesis of Magnetic Iron Oxide-Chitosan Nanocomposites: Electrical and Biological Evaluation. Biointerface Res. Appl. Chem. 2021, 12, 2229–2241. [CrossRef]
- El-Araby, A.; Janati, W.; Ullah, R.; Ercisli, S.; Errachidi, F. Chitosan, Chitosan Derivatives, and Chitosan-Based Nanocomposites: Eco-Friendly Materials for Advanced Applications (a Review). Front Chem. 2024, 11, 1327426. [Google Scholar] [CrossRef]
- El-Gamel, N.E.A.; Medany, S.S.; Hefnawy, M.A. Synthesis of NiCo2O4 Supported on Chitosan for Potential Adsorption of Copper Ions in Water Samples. Sci. Rep. 2025, 15, 14402. [Google Scholar] [CrossRef]
- A. Ahmed, M.; A. Mahmoud, S.; A. Mohamed, A. Interfacially Engineered Metal Oxide Nanocomposites for Enhanced Photocatalytic Degradation of Pollutants and Energy Applications. RSC Adv. 2025, 15, 15561–15603. [Google Scholar] [CrossRef]
- Anaya-Esparza, L.M.; Ruvalcaba-Gómez, J.M.; Maytorena-Verdugo, C.I.; González-Silva, N.; Romero-Toledo, R.; Aguilera-Aguirre, S.; Pérez-Larios, A.; Montalvo-González, E. Chitosan-TiO2: A Versatile Hybrid Composite. Materials 2020, 13. [Google Scholar] [CrossRef]
- Sultan, A. Biopolymer-Assisted Hydrothermal Synthesis of Manganese Cobalt Spinel Oxide (MnCo2O4) Using Cellulose and Chitosan for Enhanced Catalytic Performance. Polymers 2025, 17, 3138. [Google Scholar] [CrossRef]
- Muinde, V.M.; Onyari, J.M.; Wamalwa, B.; Wabomba, J.N. Adsorption of Malachite Green Dye from Aqueous Solutions Using Mesoporous Chitosan–Zinc Oxide Composite Material. Environ. Chem. Ecotoxicol. 2020, 2, 115–125. [Google Scholar] [CrossRef]
- Spoială, A.; Ilie, C.-I.; Dolete, G.; Croitoru, A.-M.; Surdu, V.-A.; Trușcă, R.-D.; Motelica, L.; Oprea, O.-C.; Ficai, D.; Ficai, A.; et al. Preparation and Characterization of Chitosan/TiO2 Composite Membranes as Adsorbent Materials for Water Purification. Membranes 2022, 12, 804. [Google Scholar] [CrossRef] [PubMed]
- Purnama, B.; Suwandi, A.D.; Hartono, R.; Tri Bawono, S.A.; Utari, U.; Aldila, H.; Rahwanto, A.; Kusumandari, K. Annealing Temperature Dependence on Magnetic Properties, Crystalline Structure and Photocatalyst Activity of Coprecipitated Cobalt Ferrite (CoFe2O4) Synthesised from Natural Iron Sand. J. Phys. Sci. 2023, 34, 75–89. [Google Scholar] [CrossRef]
- Goswami, M.; Adhikary, N.C.; Bhattacharjee, S. Effect of Annealing Temperatures on the Structural and Optical Properties of Zinc Oxide Nanoparticles Prepared by Chemical Precipitation Method. Optik 2018, 158, 1006–1015. [Google Scholar] [CrossRef]
- Patterson, A.L. The Scherrer Formula for X-Ray Particle Size Determination. Phys. Rev. 1939, 56, 978–982. [Google Scholar] [CrossRef]
- Katiyar, A.; Kumar, N.; Srivastava, P.; Shukla, R.K.; Srivastava, A. Structural and Physical Parameters of Sol-Gel Spin Coated ZnO Thin Films: Effect of Sol Concentration. Mater. Today Proc. 2020, 29, 1098–1103. [Google Scholar] [CrossRef]
- Othman, A.A.; Osman, M.A.; Ibrahim, E.M.M.; Ali, M.A. Sonochemically Synthesized ZnO Nanosheets and Nanorods: Annealing Temperature Effects on the Structure, and Optical Properties. Ceram. Int. 2017, 43, 527–533. [Google Scholar] [CrossRef]
- Omri, K.; Najeh, I.; Dhahri, R.; El Ghoul, J.; El Mir, L. Effects of Temperature on the Optical and Electrical Properties of ZnO Nanoparticles Synthesized by Sol–Gel Method. Microelectron. Eng. 2014, 128, 53–58. [Google Scholar] [CrossRef]
- Narayanan, G.N.; Ganesh, R.S.; Karthigeyan, A. Effect of Annealing Temperature on Structural, Optical and Electrical Properties of Hydrothermal Assisted Zinc Oxide Nanorods. 2016, 598, 39–45. [Google Scholar] [CrossRef]
- Ali, M.E.A.; Aboelfadl, M.M.S.; Selim, A.M.; Khalil, H.F.; Elkady, G.M. Chitosan Nanoparticles Extracted from Shrimp Shells, Application for Removal of Fe(II) and Mn(II) from Aqueous Phases. Sep. Sci. Technol. 2018, 53, 2870–2881. [Google Scholar] [CrossRef]
- Hu, X.; Jia, X.; Zhi, C.; Jin, Z.; Miao, M. Improving the Properties of Starch-Based Antimicrobial Composite Films Using ZnO-Chitosan Nanoparticles. Carbohydr. Polym. 2019, 210, 204–209. [Google Scholar] [CrossRef] [PubMed]
- El-Meliegy, E.; Abu-Elsaad, N.I.; El-Kady, A.M.; Ibrahim, M.A. Improvement of Physico-Chemical Properties of Dextran-Chitosan Composite Scaffolds by Addition of Nano-Hydroxyapatite. Sci. Rep. 2018, 8, 12180. [Google Scholar] [CrossRef]
- Ahmad, N.; Sultana, S.; Faisal, S.M.; Ahmed, A.; Sabir, S.; Khan, M.Z. Zinc Oxide-Decorated Polypyrrole/Chitosan Bionanocomposites with Enhanced Photocatalytic, Antibacterial and Anticancer Performance. [CrossRef]
- Green Synthesis, Structural Characterization and Photocatalytic Activities of Chitosan-ZnO Nano-composite | Journal of Inorganic and Organometallic Polymers and Materials | Springer Nature Link. Available online: https://link.springer.com/article/10.1007/s10904-021-01988-1 (accessed on 11 February 2026).
- Pawariya, V.; De, S.; Dutta, J. Synthesis and Characterization of a New Developed Modified-Chitosan Schiff Base with Improved Antibacterial Properties for the Removal of Bismarck Brown R and Eosin Y Dyes from Wastewater. Carbohydr. Polym. Technol. Appl. 2023, 6, 100352. [Google Scholar] [CrossRef]
- Fahmy, T.; Sarhan, A. Characterization and Molecular Dynamic Studies of Chitosan–Iron Complexes. Bull. Mater. Sci. 2021, 44, 142. [Google Scholar] [CrossRef]
- Lazăr, A.-I.; Șelaru, A.; Croitoru, A.-M.; Motelica, L.; Oprea, O.-C.; Trușcă, R.-D.; Ficai, D.; Văireanu, D.-I.; Ficai, A.; Dinescu, S. Conductive Chitosan–Graphene Oxide Scaffold with Applications in Peripheral Nerve Tissue Engineering. Polymers 2025, 17, 2398. [Google Scholar] [CrossRef]
- Habtoor, S.S.; Basri, H.B.; Zaini, M.; Rahmawati, A.; Shah, T. Ex Situ Synthesis and Characterization of Chitosan-ZnO Nanocomposites Using ZnO Nanoparticles Prepared by the Precipitation Method. AIMS Mater. Sci. 2025, 12, 686–702. [Google Scholar] [CrossRef]
- García-García, D.J.; Pérez-Sánchez, G.F.; Hernández-Cocoletzi, H.; Sánchez-Arzubide, M.G.; Luna-Guevara, M.L.; Rubio-Rosas, E.; Krishnamoorthy, R.; Morán-Raya, C. Chitosan Coatings Modified with Nanostructured ZnO for the Preservation of Strawberries. Polymers 2023, 15, 3772. [Google Scholar] [CrossRef]
- K., S.S.; M.p., I.; G.r., R. Mahua Oil-Based Polyurethane/Chitosan/Nano ZnO Composite Films for Biodegradable Food Packaging Applications. Int. J. Biol. Macromol. 2019, 124, 163–174. [Google Scholar] [CrossRef]
- S, K.; B, K.; Ajfn, S.; J, K. Bio-Based (Chitosan/PVA/ZnO) Nanocomposites Film: Thermally Stable and Photoluminescence Material for Removal of Organic Dye. Carbohydr. Polym. 2019, 205, 559–564. [Google Scholar] [CrossRef]
- Gasti, T.; Dixit, S.; Hiremani, V.D.; Chougale, R.B.; Masti, S.P.; Vootla, S.K.; Mudigoudra, B.S. Chitosan/Pullulan Based Films Incorporated with Clove Essential Oil Loaded Chitosan-ZnO Hybrid Nanoparticles for Active Food Packaging. Carbohydr. Polym. 2022, 277, 118866. [Google Scholar] [CrossRef] [PubMed]
- Bashal, A.H.; Riyadh, S.M.; Alharbi, W.; Alharbi, K.H.; Farghaly, T.A.; Khalil, K.D. Bio-Based (Chitosan-ZnO) Nanocomposite: Synthesis, Characterization, and Its Use as Recyclable, Ecofriendly Biocatalyst for Synthesis of Thiazoles Tethered Azo Groups. Polymers 2022, 14, 386. [Google Scholar] [CrossRef]
- Kachare, K.S.; Shendage, S.S.; Vhanbatte, S.B.; Mai, F.D.; Ghule, A.V. Synthesis, Characterization, and Antibacterial Study of Chitosan–Zinc Oxide Nanocomposite-Coated Superhydrophobic Cotton Fabric. RSC Adv. 2024, 14, 33774–33783. [Google Scholar] [CrossRef]
- Selim, Y.A.; Azb, M.A.; Ragab, I.; HM Abd El-Azim, M. Green Synthesis of Zinc Oxide Nanoparticles Using Aqueous Extract of Deverra Tortuosa and Their Cytotoxic Activities. Sci. Rep. 2020, 10, 3445. [Google Scholar] [CrossRef]
- Dakroury, G.A.; El-Shazly, E.A.A.; Hassan, H.S. Preparation and Characterization of ZnO/Chitosan Nanocomposite for Cs(I) and Sr(II) Sorption from Aqueous Solutions. J. Radioanal. Nucl. Chem. 2021, 330, 159–174. [Google Scholar] [CrossRef]
- Ali, S.A.; Ali, E.S.; Hamdy, G.; Badawy, M.S.E.M.; Ismail, A.R.; El-Sabbagh, I.A.; El-Fass, M.M.; Elsawy, M.A. Enhancing Physical Characteristics and Antibacterial Efficacy of Chitosan through Investigation of Microwave-Assisted Chemically Formulated Chitosan-Coated ZnO and Chitosan/ZnO Physical Composite. Sci. Rep. 2024, 14, 9348. [Google Scholar] [CrossRef]
- Darwish, M.S.A.; Mostafa, M.H.; Hussein, L.I.; Abdaleem, A.H.; Elsawy, M.A. Preparation, Characterization, Mechanical and Biodegradation Behavior of Polypropylene—Chitosan/ZnO Nanocomposite. Polym.-Plast. Technol. Mater. 2021, 1–11. [Google Scholar] [CrossRef]
- Nguyen, N.T.; Nguyen, N.T.; Nguyen, V.A. In Situ Synthesis and Characterization of ZnO/Chitosan Nanocomposite as an Adsorbent for Removal of Congo Red from Aqueous Solution. Adv. Polym. Technol. 2020, 2020, 1–8. [Google Scholar] [CrossRef]
- Rana, S.B.; Bhardwaj, V.K.; Singh, S.; Singh, A.; Kaur, N. Influence of Surface Modification by 2-Aminothiophenol on Optoelectronics Properties of ZnO Nanoparticles. J. Exp. Nanosci. 2014, 9, 877–891. [Google Scholar] [CrossRef]
- Halomoan, I.; Yulizar, Y.; Surya, R.M.; Apriandanu, D.O.B. Facile Preparation of CuO-Gd2Ti2O7 Using Acmella Uliginosa Leaf Extract for Photocatalytic Degradation of Malachite Green. Mater. Res. Bull. 2022, 150, 111726. [Google Scholar] [CrossRef]
- Aadnan, I.; Zegaoui, O.; Daou, I.; da Silva, J.C.E. Synthesis and Physicochemical Characterization of a ZnO-Chitosan Hybrid-Biocomposite Used as an Environmentally Friendly Photocatalyst under UV-A and Visible Light Irradiations. J. Environ. Chem. Eng. 2020, 8, 104260. [Google Scholar] [CrossRef]
- Mitra, M.; Abbas, H.J.M.; Fatemeh, R.; Mehdi, D. Facile Fabrication of Ternary MWCNTs/ZnO/Chitosan Nanocomposite for Enhanced Photocatalytic Degradation of Methylene Blue and Antibacterial Activity. 12, 5927. [CrossRef]
- Nithya, A.; Jothivenkatachalam, K. Chitosan Assisted Synthesis of ZnO Nanoparticles: An Efficient Solar Light Driven Photocatalyst and Evaluation of Antibacterial Activity. J. Mater. Sci. Mater. Electron 2015, 26, 10207–10216. [Google Scholar] [CrossRef]
- Frankcombe, T.J.; Liu, Y. Interpretation of Oxygen 1s X-Ray Photoelectron Spectroscopy of ZnO. Chem. Mater. 2023, 35, 5468–5474. [Google Scholar] [CrossRef]
- Hasan, K.; Joseph, R.G.; Patole, S.P.; Al-Qawasmeh, R.A. Development of Magnetic Fe3O4-Chitosan Immobilized Cu(II) Schiff Base Catalyst: An Efficient and Reusable Catalyst for Microwave Assisted One-Pot Synthesis of Propargylamines via A3 Coupling. Catal. Commun. 2023, 174, 106588. [Google Scholar] [CrossRef]
- Gieroba, B.; Sroka-Bartnicka, A.; Kazimierczak, P.; Kalisz, G.; Lewalska-Graczyk, A.; Vivcharenko, V.; Nowakowski, R.; Pieta, I.S.; Przekora, A. Spectroscopic Studies on the Temperature-Dependent Molecular Arrangements in Hybrid Chitosan/1,3-β-D-Glucan Polymeric Matrices. Int. J. Biol. Macromol. 2020, 159, 911–921. [Google Scholar] [CrossRef] [PubMed]
Figure 1.
(a). XRD patterns of as-prepared and annealed ZnO NPs at 300 oC, 400 oC, 500 oC, 600 oC, and 700 oC; (b). Shifting of prominent peaks for (100), (002), and (101) crystal planes towards lower diffraction angle (2) with the increasing annealing temperature for as-prepared and annealed ZnO-NPs at 300◦C, 400 ◦C, 500 ◦C, 600 ◦C, and 700 ◦C.
Figure 1.
(a). XRD patterns of as-prepared and annealed ZnO NPs at 300 oC, 400 oC, 500 oC, 600 oC, and 700 oC; (b). Shifting of prominent peaks for (100), (002), and (101) crystal planes towards lower diffraction angle (2) with the increasing annealing temperature for as-prepared and annealed ZnO-NPs at 300◦C, 400 ◦C, 500 ◦C, 600 ◦C, and 700 ◦C.
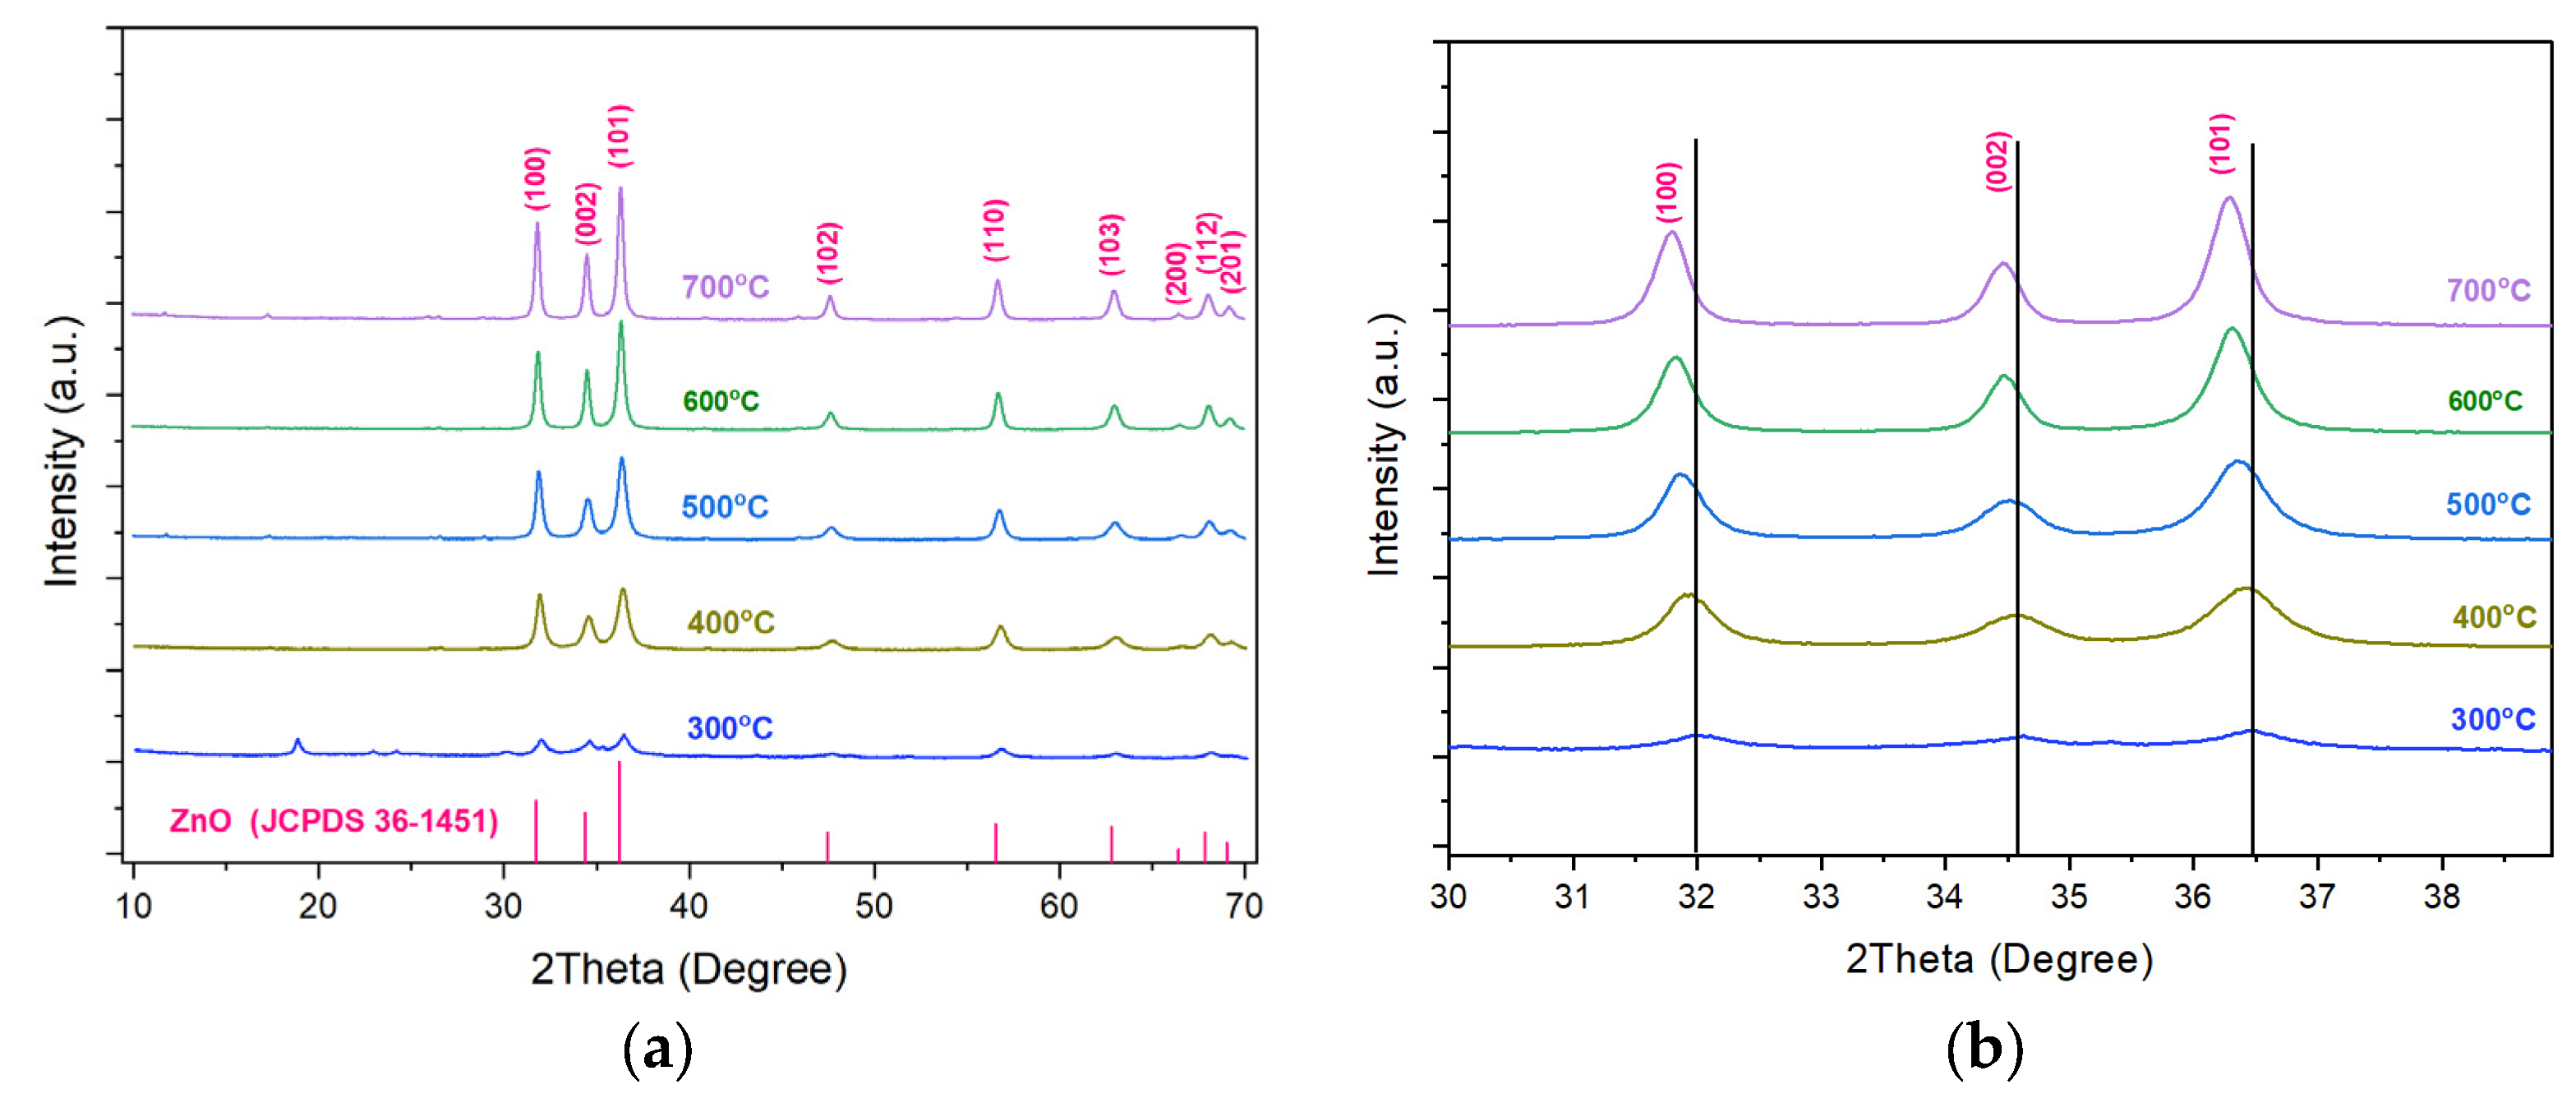
Figure 2.
XRD The XRD patterns of CS, ZnO/CS nanocomposite, and ZnO.
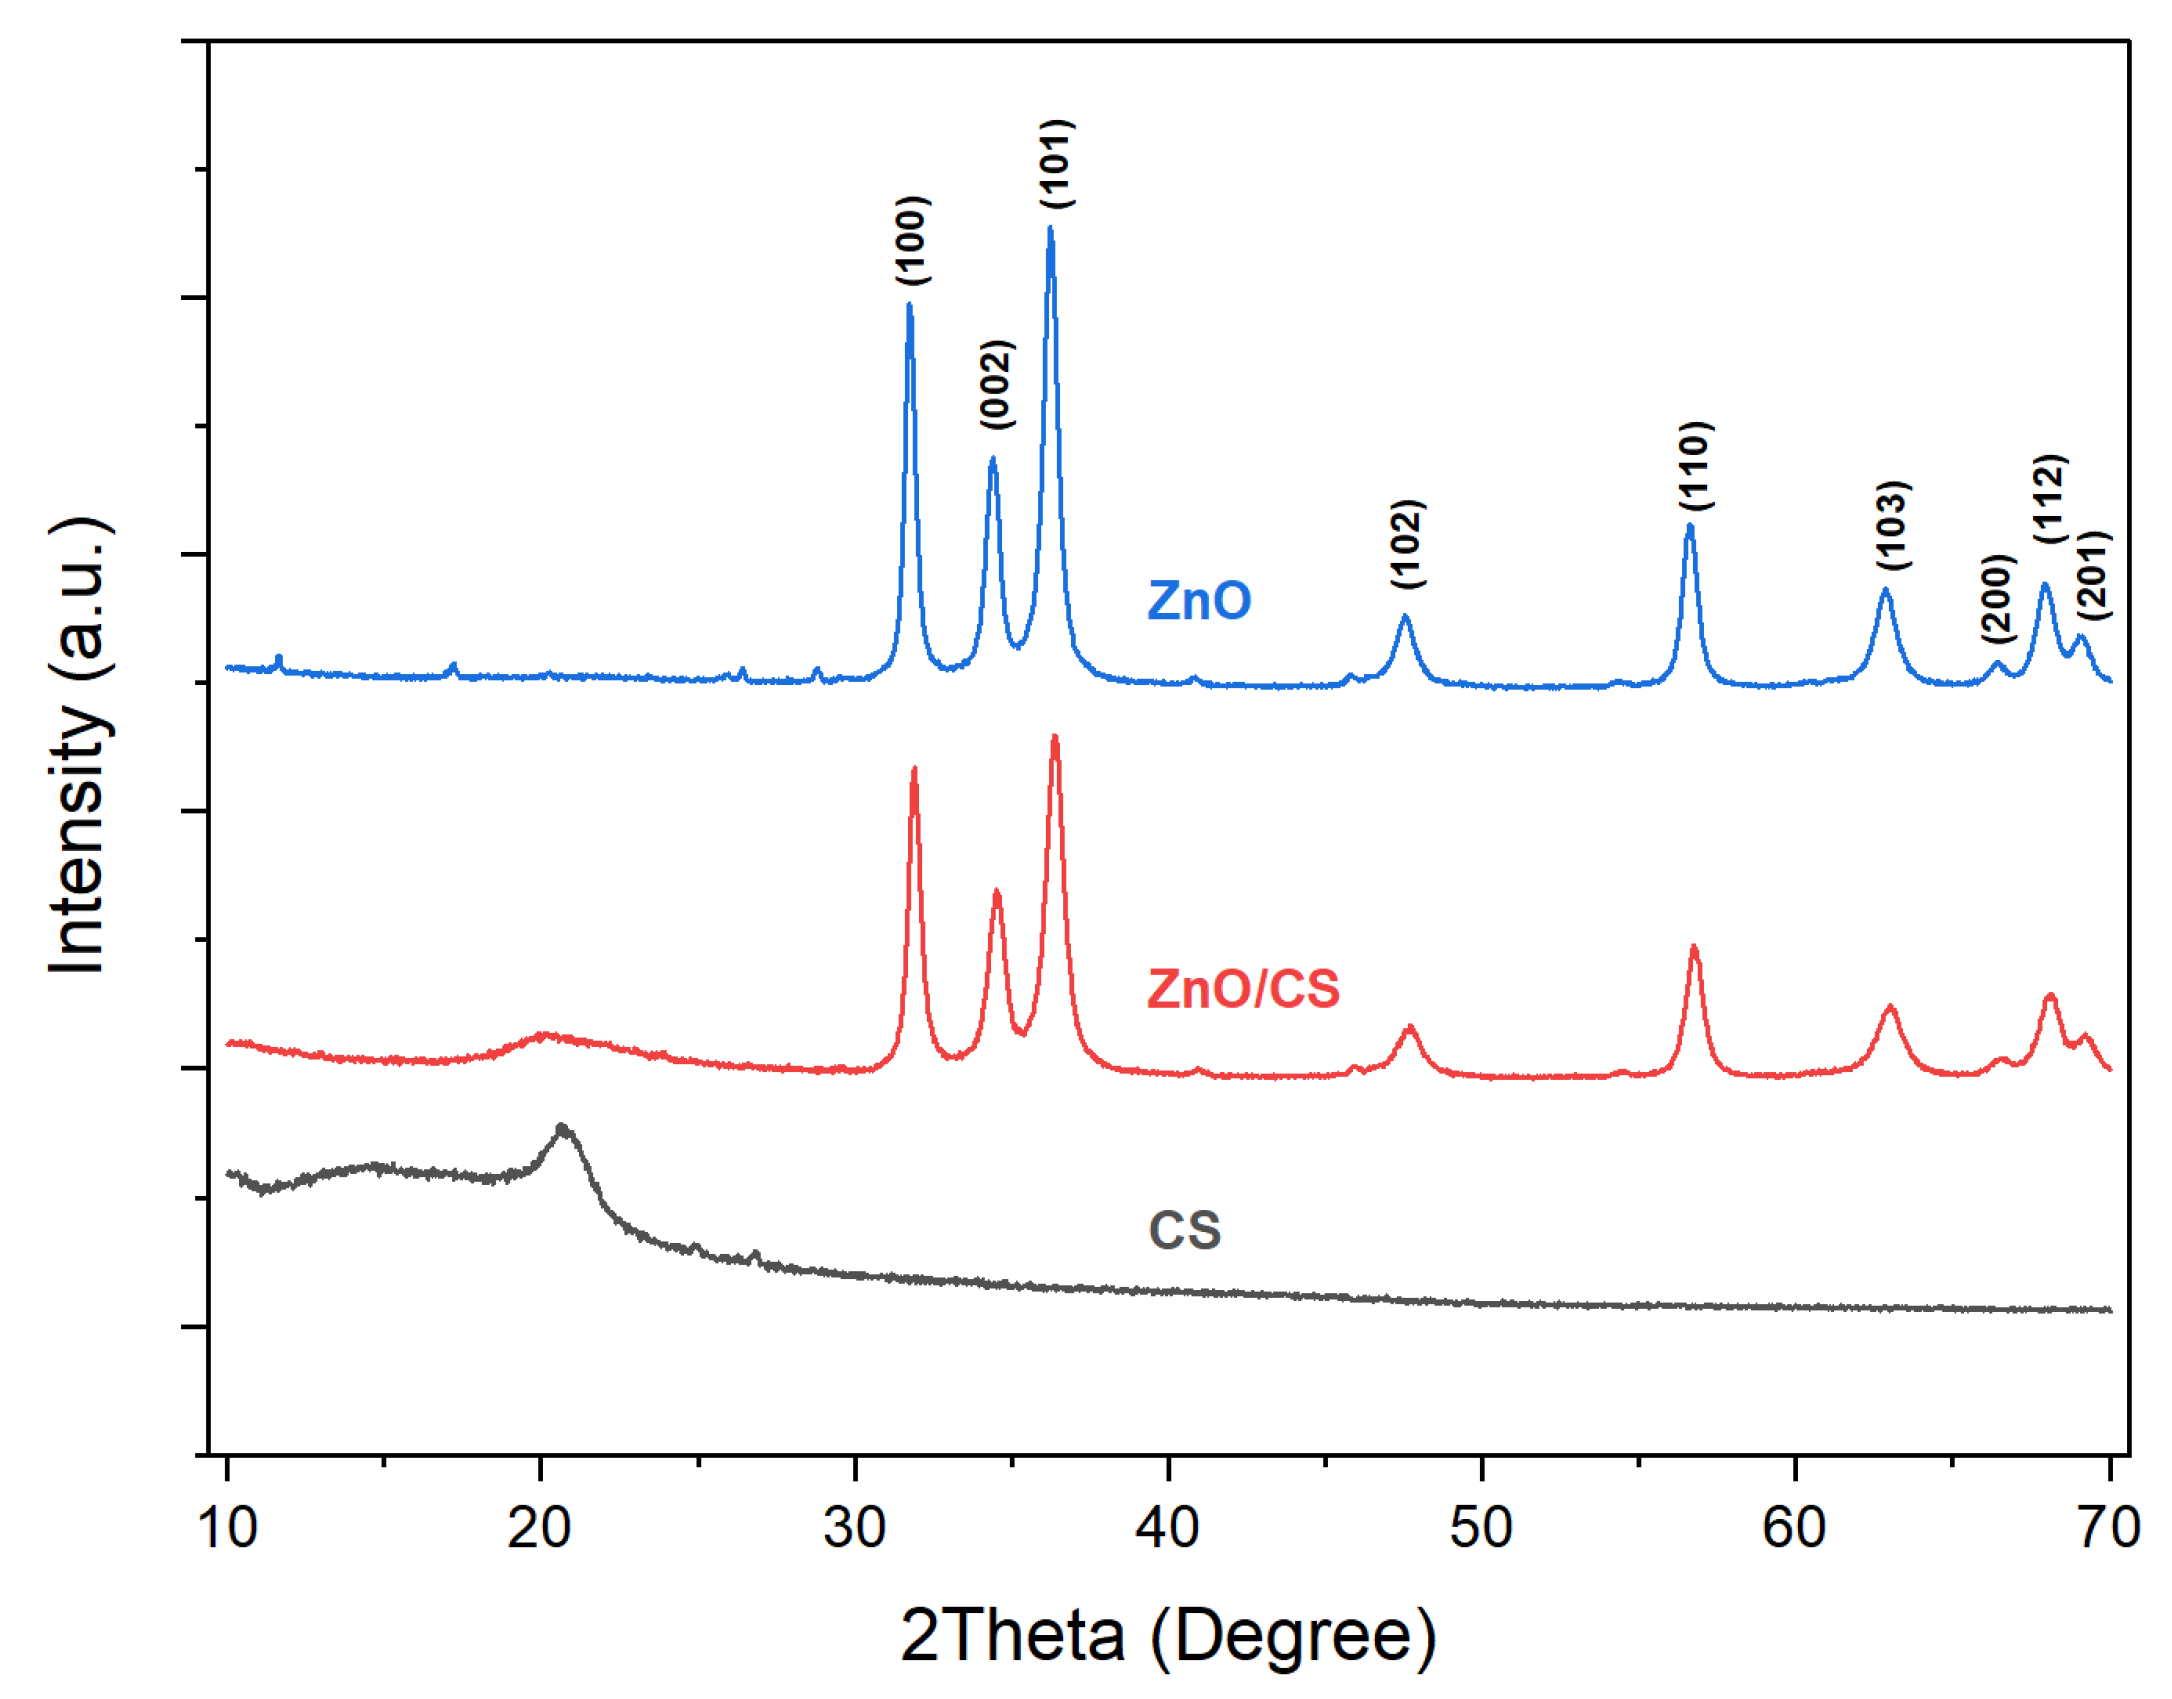
Figure 4.
(a) FESEM and (b) EDS of ZnO NPs; (c) FESEM and (d) EDS of ZnO/CS nanocomposite. (Insets are the corresponding TEM images).
Figure 4.
(a) FESEM and (b) EDS of ZnO NPs; (c) FESEM and (d) EDS of ZnO/CS nanocomposite. (Insets are the corresponding TEM images).
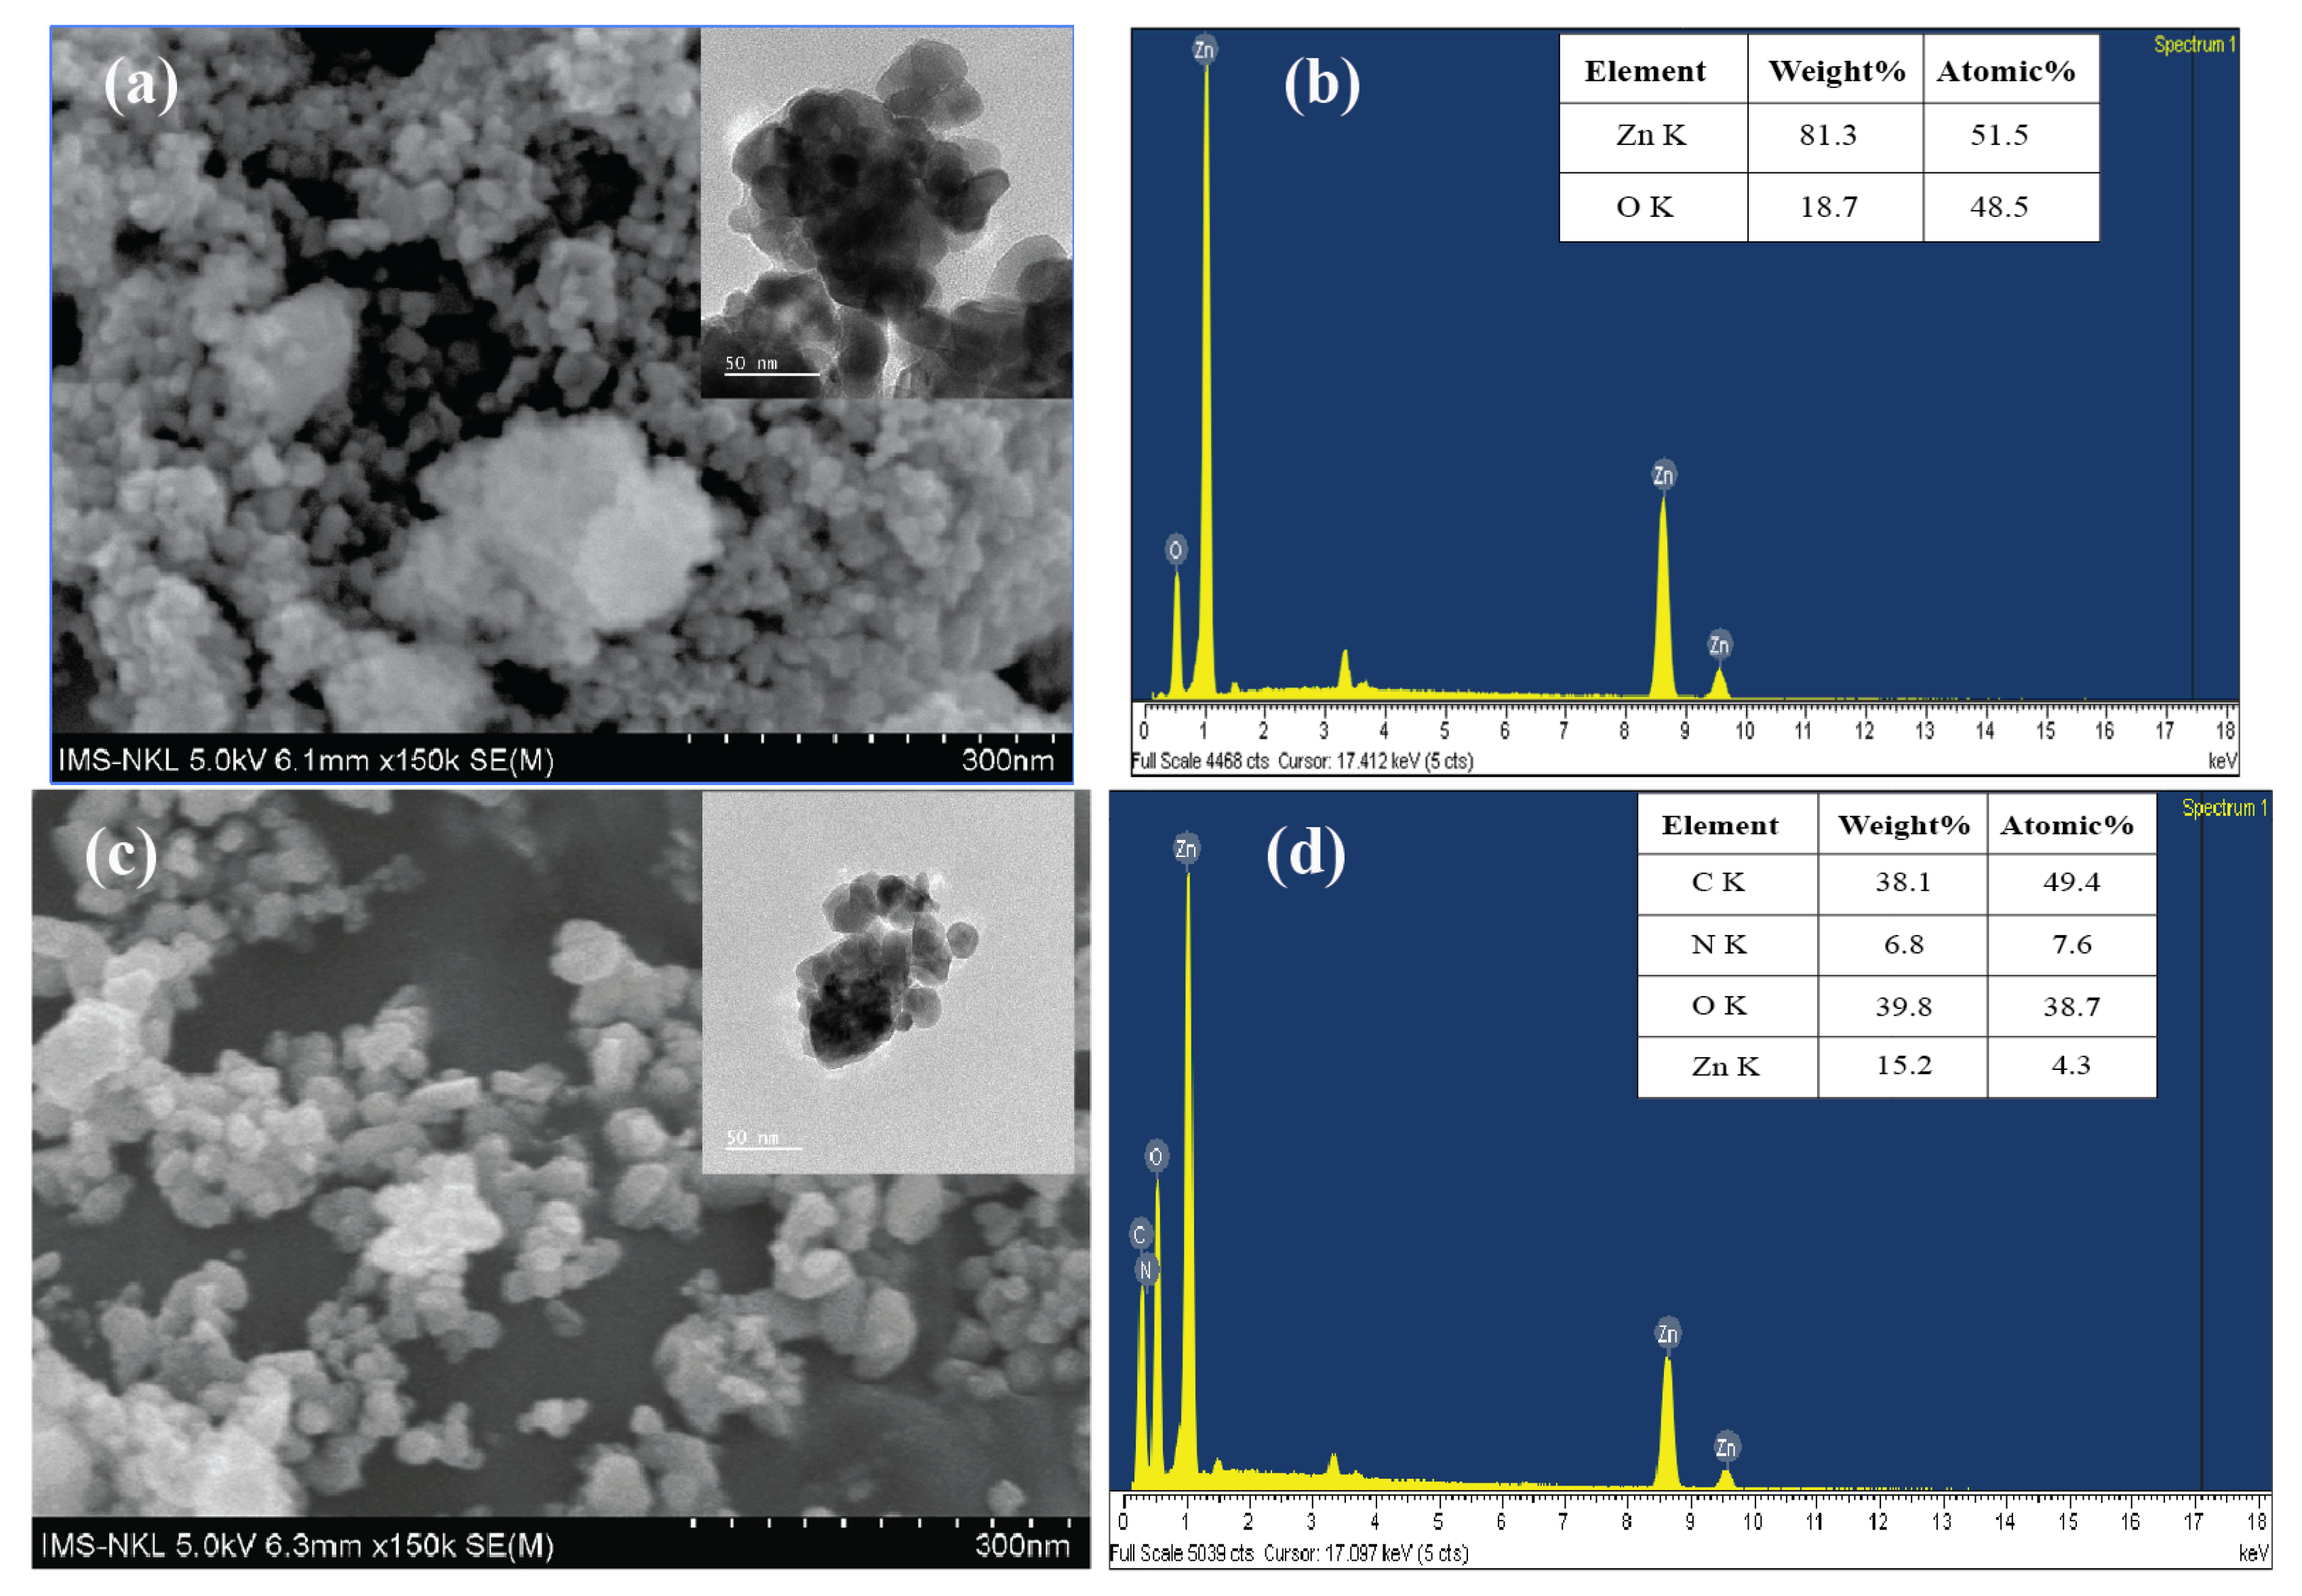
Figure 5.
UV-VIS diffuse reflectance spectrum of ZnO, ZnO/CS (a) and the corresponding Kubelka–Munk transformed reflectance spectrum (b).
Figure 5.
UV-VIS diffuse reflectance spectrum of ZnO, ZnO/CS (a) and the corresponding Kubelka–Munk transformed reflectance spectrum (b).
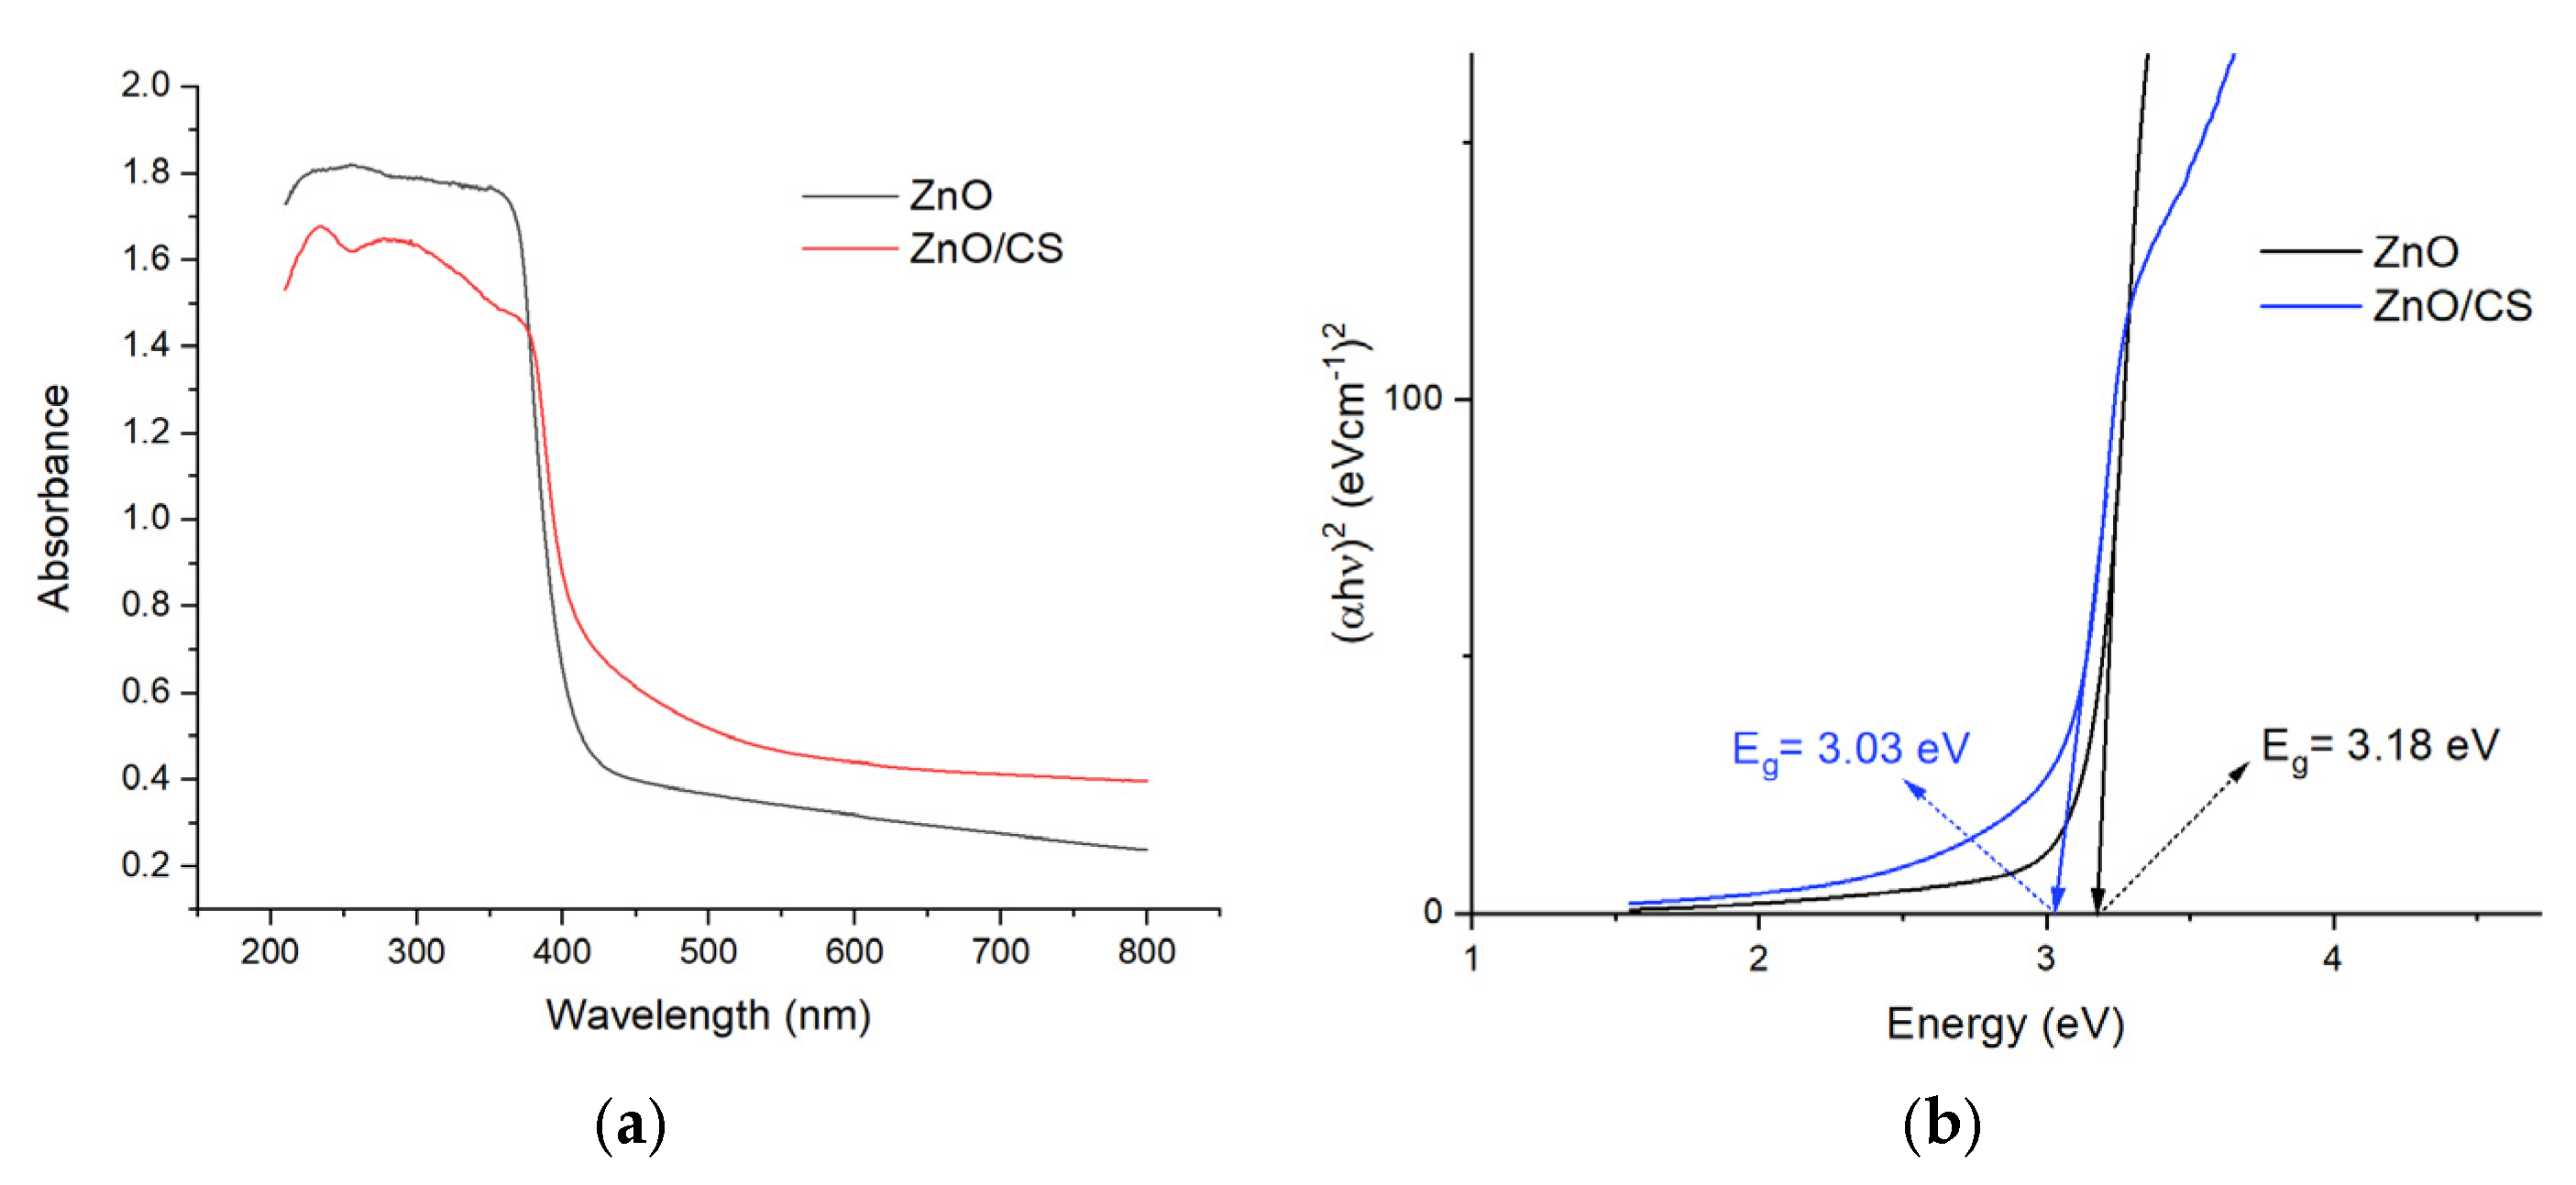
Figure 6.
XPS spectra of ZnO/CS; a) full range, b) Zn 2p (ZnO), c) Zn 2p (ZnO/CS), d) O 1s (ZnO), e) O 1s (ZnO/CS), f) C 1s (ZnO/CS), g) N 1s (ZnO/CS).
Figure 6.
XPS spectra of ZnO/CS; a) full range, b) Zn 2p (ZnO), c) Zn 2p (ZnO/CS), d) O 1s (ZnO), e) O 1s (ZnO/CS), f) C 1s (ZnO/CS), g) N 1s (ZnO/CS).
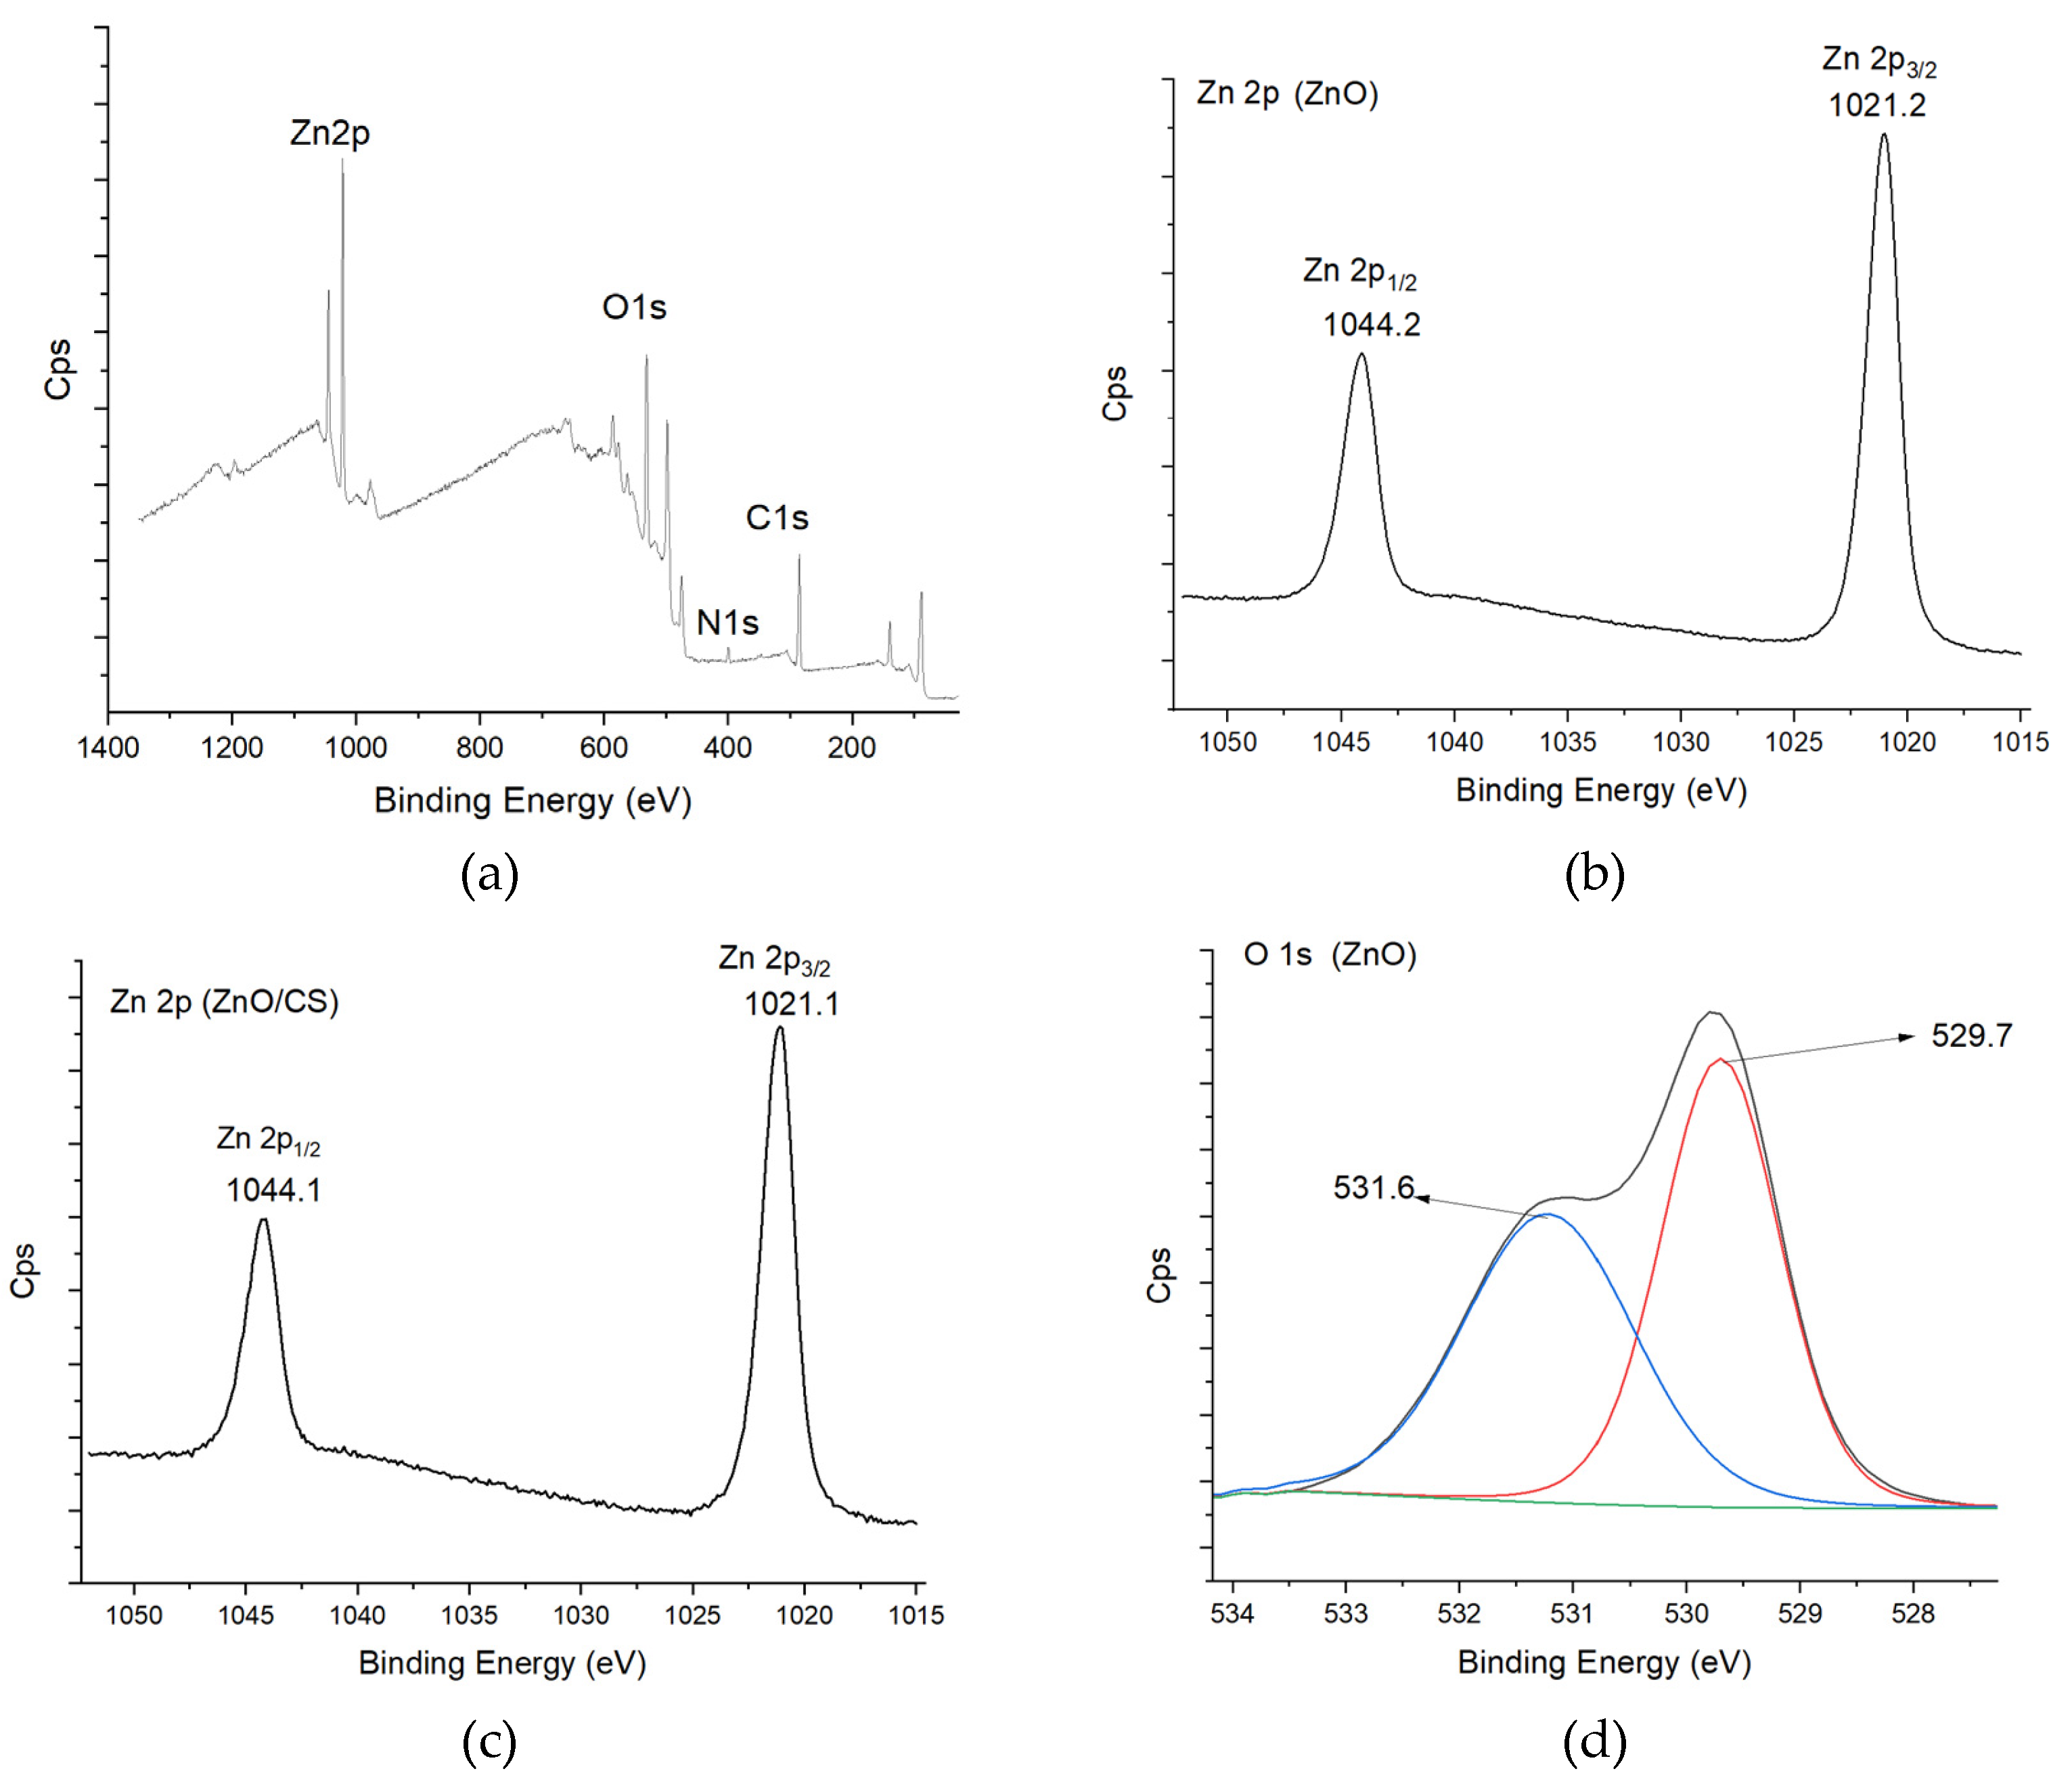
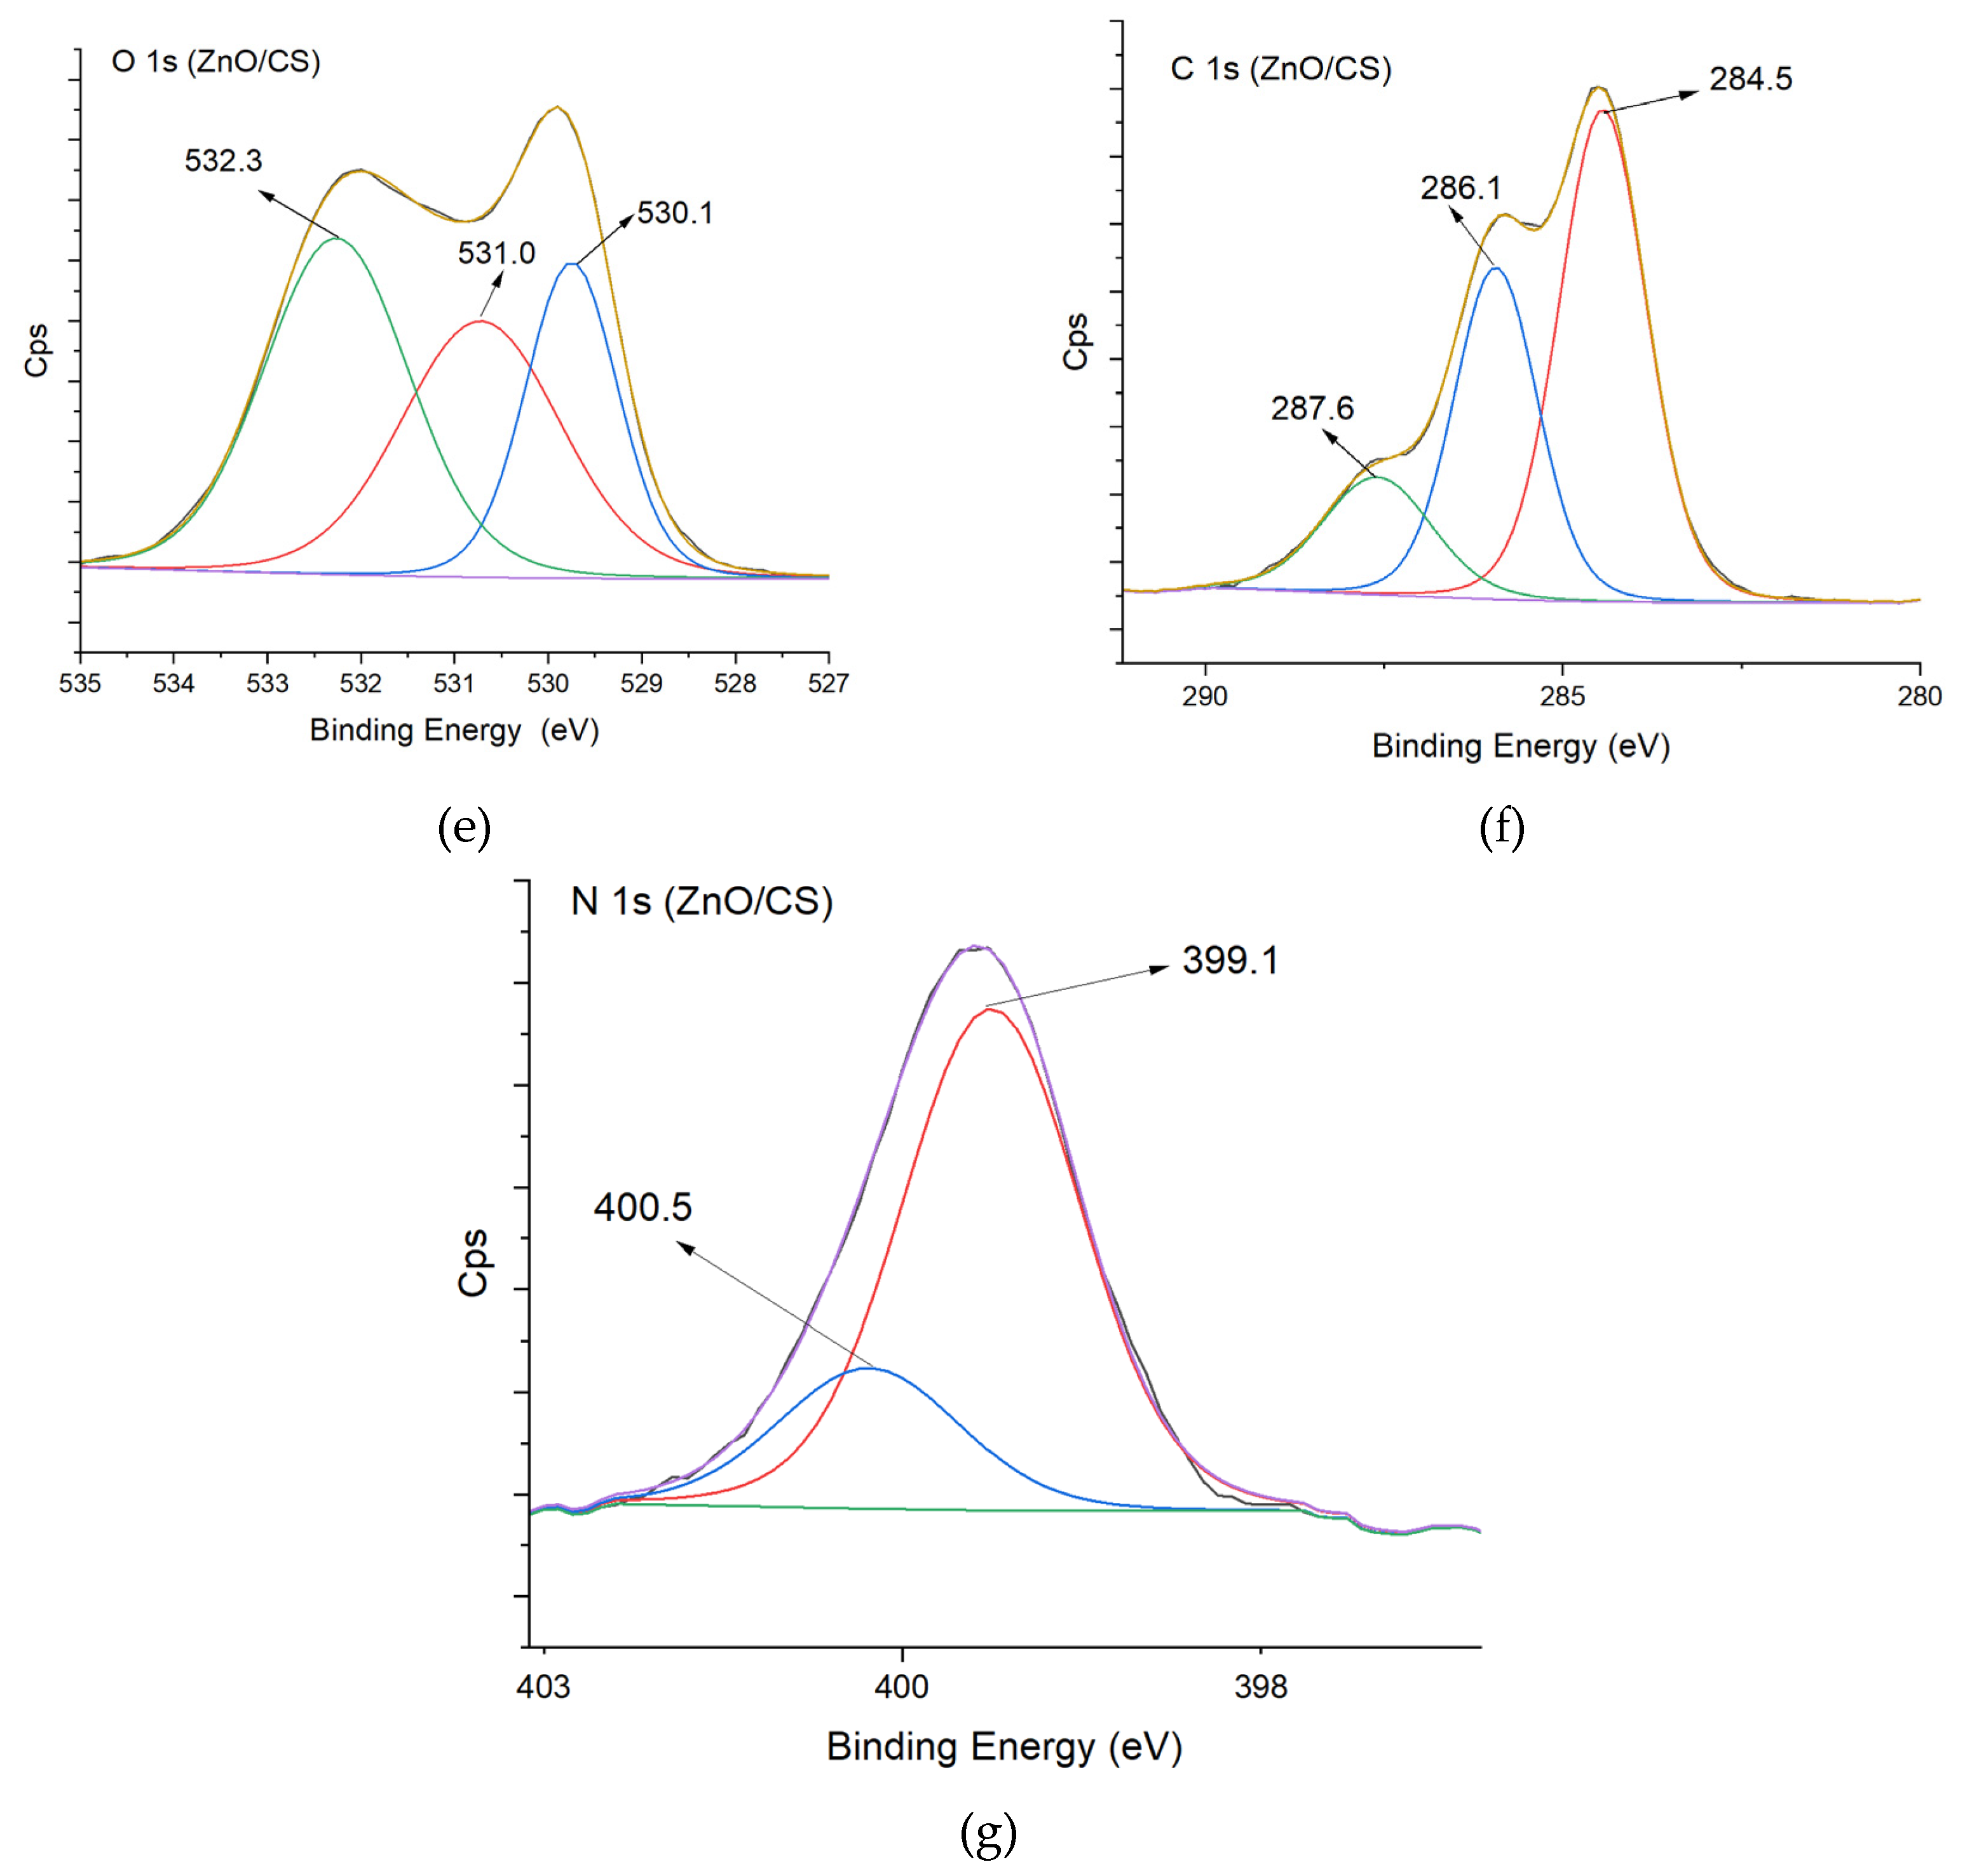
Figure 7.
(a) Photocatalytic degradation of tetracycline (TC) over ZnO, and ZnO/CS, (b) Pseudo-first-order kinetic plots for ZnO and ZnO/CS.
Figure 7.
(a) Photocatalytic degradation of tetracycline (TC) over ZnO, and ZnO/CS, (b) Pseudo-first-order kinetic plots for ZnO and ZnO/CS.
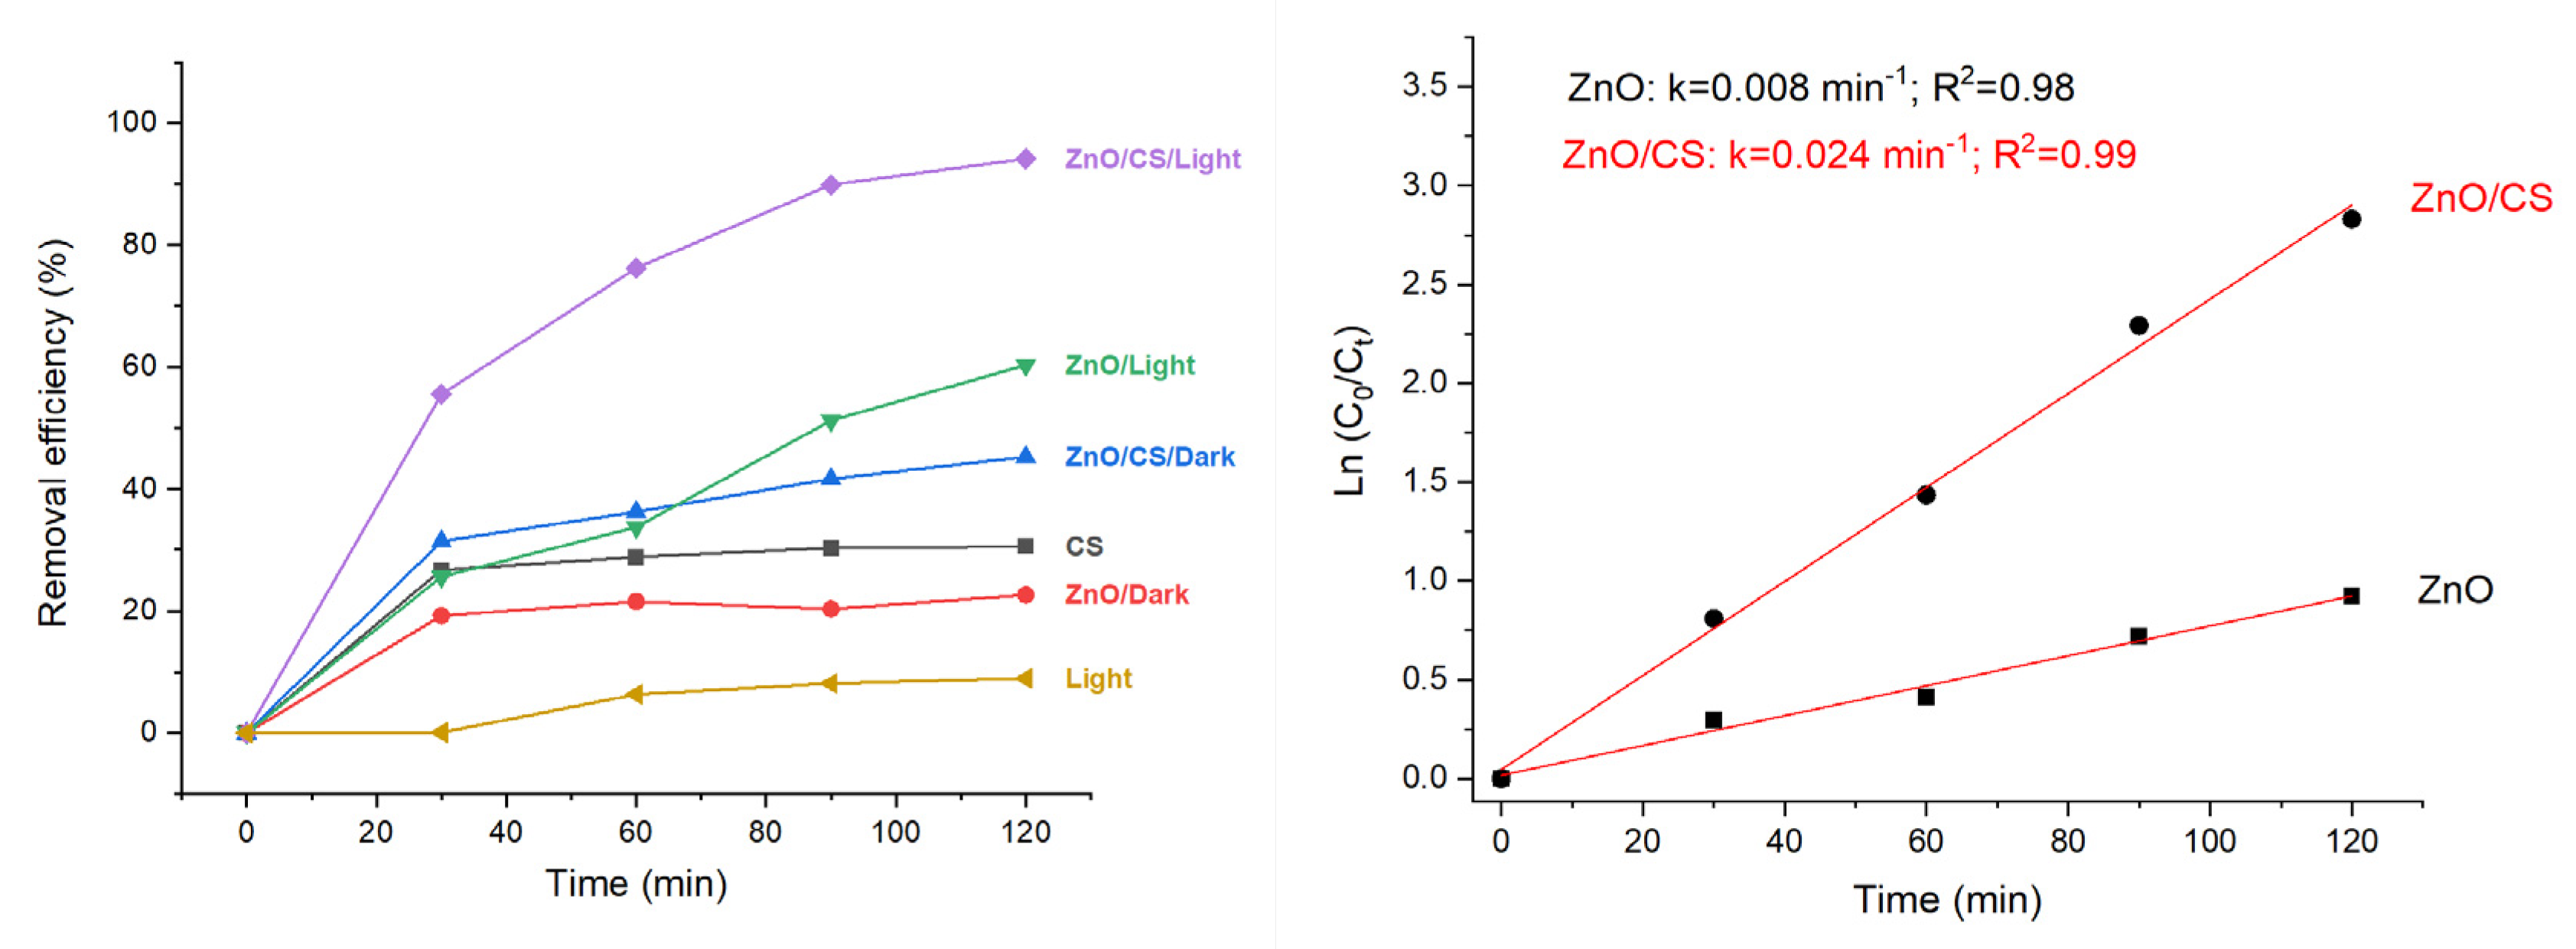

Table 1.
The crystallite size (D), lattice parameter (a), cell volume (V), and the X-ray density () of ZnO nanoparticles at different annealing temperatures obtained from X-ray diffraction data.
Table 1.
The crystallite size (D), lattice parameter (a), cell volume (V), and the X-ray density () of ZnO nanoparticles at different annealing temperatures obtained from X-ray diffraction data.
| Annealing temperature ( | D(nm) |
Lattice parameters ( |
V | ||
| 300 | 6.5 | - | - | - | |
| 400 | 11.2 | 3.2339 | 5.1852 | 46.96 | 5.75 |
| 500 | 13.9 | 3.2408 | 5.1910 | 47.22 | 5.72 |
| 600 | 18.7 | 3.2428 | 5.1983 | 47.34 | 5.71 |
| 700 | 21.6 | 3.2468 | 5.2012 | 47.48 | 5.69 |
Table 2.
The BET surface area, pore volumes, and pore sizes of ZnO, ZnO/CS.
| Material | BET surface area (m2/g) |
Pore volume (cm3/g) |
Pore size (nm) |
| ZnO | 10.7 | 0.012 | 17.9 |
| ZnO/CS | 21.7 | 0.11 | 15.0 |
Disclaimer/Publisher’s Note: The statements, opinions and data contained in all publications are solely those of the individual author(s) and contributor(s) and not of MDPI and/or the editor(s). MDPI and/or the editor(s) disclaim responsibility for any injury to people or property resulting from any ideas, methods, instructions or products referred to in the content. |
© 2026 by the authors. Licensee MDPI, Basel, Switzerland. This article is an open access article distributed under the terms and conditions of the Creative Commons Attribution (CC BY) license (http://creativecommons.org/licenses/by/4.0/).
Copyright: This open access article is published under a Creative Commons CC BY 4.0 license, which permit the free download, distribution, and reuse, provided that the author and preprint are cited in any reuse.


