Submitted:
02 April 2026
Posted:
07 April 2026
You are already at the latest version
Abstract
Hexokinase 2 (HK2) catalyzes the first committed step of glucose metabolism - the conversion of glucose to glucose-6-phosphate – directing carbon flux into an array of metabolic pathways such as glycolysis, pentose phosphate pathway, amino acid biosynthesis and others. Given its prominent role in glucose metabolism, it is critical we understand the regulation of HK2 to appreciate its role in normal physiological function as well as disease states like cancers. Herein we establish a fundamental link between cell survival mechanism and metabolic regulation by demonstrating myeloid cell leukemia 1 (MCL1) directly binds and enhances HK2 enzymatic activity through interactions with reverse Bcl-2 homology motifs (rBH3) on HK2. Consequently, we observe significant reductions in glucose-derived metabolites and impaired cellular metabolic plasticity with disruption of the HK2-MCL1 interaction. These findings establish a novel mechanism by which anti-apoptotic proteins can directly regulate glucose metabolism.
Keywords:
hexokinase 2 (HK2)
; MCL1
; metabolism
; metabolomics
; NMR
; cancer
; non-small cell lung cancer (NSCLC)
1. Introduction
Control of cellular metabolism is essential for homeostasis, and its dysregulation is a hallmark of various disease states, especially cancers [1,2]. Cancers utilize dysregulated metabolism as both the energy source and building blocks for sustained anabolic processes necessary for rapid cell growth [3,4]. At the center of cellular metabolism is the hexokinase family of proteins. These proteins are responsible for the conversion of glucose to glucose-6-phosphate (G6P) trapping glucose in the cell and serving as feeder substrate for multiple downstream metabolic pathways [5]. While there are five hexokinases (HK1-4, and Hexokinase Domain Containing Protein 1 or HKDC1), it is HK2 that is primarily expressed in cancers and is implicated in driving the Warburg Effect [6,7,8,9]. Unsurprisingly, increased HK2 expression has been shown to increase tumor burden, promote proliferation, metastasis and worsen prognosis [9,10,11].
Structurally, HK2 is comprised of two domains, the N- and C-terminal domains (NTD and CTD respectively) linked via a helical linker [12]. Both domains contain a catalytic core responsible for binding and coordinating glucose and ATP to form G6P [13]. Unlike other HK family members, HK2 utilizes both domains for catalysis, which enables it to have the fastest enzymatic rate [13]. This makes HK2 an ideal choice for rapidly growing cancerous cells [7]. Furthermore, these domains also serve as regulatory sites, containing: (1) mitochondrial localization sequences, important for aiding mitochondrial stability; (2) phosphorylation sites which regulate mitochondrial localization; (3) the allosteric feedback inhibition site of G6P [5,12,14,15,16]. Despite these advances in our understanding of HK2, little is known about direct protein regulators of HK2. Herein, we identify a novel regulatory mechanism of HK2 through a direct binding interaction with myeloid cell leukemia-1 (MCL1) which enhances HK2 catalysis. MCL1 is a pro-survival member of the B-Cell lymphoma 2 (Bcl-2) protein family [17]. Canonically MCL1 prevents apoptosis by binding and sequestering pro-death Bcl-2 homology 3 (BH3)-containing proteins (e.g., BAK, BAX, BIM, etc.) [18,19].
We have previously reported that MCL1 binds a novel reversal of the canonical BH3 (rBH3) motif, mediating non-canonical functions beyond the Bcl-2 family including participation in transcriptional regulation (via p73), RNA metabolism (via PTBP1) and cell cycle progression (via CDKN2C) [20,21,22,23]. Although a reversal of the native BH3 motif, the rBH3 maintains key consensus hydrophobic and acidic residues with the native BH3 motif preserving MCL1’s binding capacity [20]. Like these interacting partners, HK2 has also been found to contain rBH3 motifs in the NTD and CTD, providing a novel mechanism by which MCL1 can regulate HK2’s catalytic function. While prior work demonstrated MCL1 and HK2 form a complex at the mitochondrial membrane with Voltage Dependent Anion Channel (VDAC), the molecular regulatory mechanism remained unsolved [24]. This work shows MCL1 directly binds to HK2 via NTD and CTD localized rBH3 motifs, altering HK2 enzymatic turnover. Disrupting this interaction impairs cellular glucose metabolism, establishing a new regulatory axis linking cellular survival mechanisms and metabolic regulation.
2. Materials and Methods
2.1. Cell Culture
H1299 and A549 cells were maintained in a humidified environment with 5% CO2 in 1g/L glucose DMEM (Corning) supplemented with 10% FBS (Corning) and 100 units/mL each of penicillin and streptomycin, and 0.25µg/mL of Fungizone antimycotic (Life Technologies, Grand Island, NY). U2OS and NCI-H23 cells were passaged in RPMI 1640 (Corning) supplemented with 10% FBS (Corning) and 100 units/mL each of penicillin and streptomycin, and 0.25µg/mL of Fungizone antimycotic. Cell lines were obtained from ATCC and validated with short tandem repeat analysis at the Heflin Center Genomics Core Facility at UAB.
2.2. Recombinant Protein Purification
Using the New England BioLabs transformation protocol, MCL1, SUMO1, HK2 and D209A/D657A HK2 constructs were transformed into BL21 (DE3) E. Coli. The HK2 construct used was a gift from Cheryl Arrowsmith (Addgene plasmid # 25529). Competent bacteria were grown in 500mL cultures (250mL per flask) with kanamycin selection at 37 °C until an optical density (OD600) of 0.5-0.7 was reached. At this point protein expression was induced with 1mM final concentration Isopropyl-β-D-1thiogalactopyranoside (IPTG, Fisher Bioreagents). For MCL1 and SUMO1, OD600 optical density was measured for several hours until a plateau was reached. For HK2 constructs, after induction, flasks were placed in an 18 °C incubator for 18hrs. After, for all constructs, cells were harvested via centrifugation at 4700xg. Pellets obtained were frozen at -80 °C for future purification. For purification, pellets were resuspended in 20mL of protein lysis buffer (MCL1 and SUMO - 50mM HEPES and 150mM NaCl at pH 7.4; HK2 constructs – 100mM Tris-HCl, 150mM NaCl, 5mM Imidazole, 3mM β-mercaptoethanol (BME) at pH 7.4). Once resuspended, the lysate was supplemented with two EDTA-free mini protease inhibitor tablets (Pierce, A32955) and lysozyme (0.25mg/mL). Lysis was achieved via probe sonication for 7min on ice. Cell debris was subsequently pelleted at 14000xg and supernatant was filtered through a 0.45µm filter (Millex). Protein was purified on a BioRad NGC FPLC (BioRad Laboratories, Hercules, CA, USA) system using nickel chromatography (1mL HisTrap, GE Healthcare) followed by gel filtration. For MCL1 and SUMO1 a 16/60 Sephacryl S-100 (GE Healthcare) column was used. For HK2 constructs a 16/60 Sephacryl S-200 (GE Healthcare) column was used. SDS-PAGE analysis was used to confirm protein identity and purity. All protein constructs were validated with Sanger Sequencing. HK2 constructs were stored in a final buffer of 50mM HEPES, 150mM NaCl, 3mM BME, pH 7.4 and froze at -80 °C until ready for use. MCL1 and SUMO were stored in a final buffer of 50mM HEPES, 150mM NaCl pH 7.4 at 4 °C until ready for use.
2.3. Competitive FPA
80µL of titrated recombinant HK2 (100pM to 300nM final for HK2, 100pM to 3µM final for D209A/D657A HK2) was added to a black untreated 96-well microplate (ThermoScientific) with 10µL 10x MCL1 (final concentration 100nM) [21]. These proteins were incubated for 20min and shaken at 300rpm to allow for binding. Subsequently, 10µL of 10x F-BAK (final concentration 10nM) was added per well. The plate was then covered with an opaque lid and allowed to shake for an additional hour. After incubation, the plate was read using the FP-Fluorescein setting (1.0s, CW lamp filter-F485, emission filter, F535) on a Perkin Elmer Victor X5 plate reader. The buffer used for all assays was 50mM HEPES, 150mM NaCl, pH 7.4. All experiments were completed in technical and biological triplicate. All data plotted in Figure 1 is one representative assay of a technical triplicate.
2.4. Split GFP Cloning
MCL1-GFP1-10 was constructed through amplification of MCL1 plasmid using MCL1-GFP1-10 forward and reverse primers. Amplified products were ligated into the BamHI linearized pcDNA3.1-GFP1-10-HiFi vector via HiFi Assembly. HK2-GFP11 was generated through amplification of FLAG-HK2 plasmid using HK2-GFP11 primers. Amplified products were ligated into the BamHI linearized pcDNA3.1-GFP11-HiFi vector via HiFi Assembly. GFP-HiFi vectors were generated by insertion of GFP1-10 or GFP11 between HindIII and BamHI restriction sites of pcDNA3.1. All ligations were transformed into DH5α E. coli. Indicated constructs were (co)-transfected in U2OS cells with polyethyleneimine (PEI) at a 1:1 ratio of DNA (µg) to 1 mg/mL PEI stock (µL).
Primers (5’-3’)
MCL1-GFP1-10 Forward:
AGTCCAGTGTGGTGGAATTCGGCGGCggtggttcaggaTCTAAGGGCGAAGAACTGTTC
MCL1-GFP1-10 Reverse:
ACGGGCCCTCTAGACTCGAGTCACTTTTCATTCGGATCTTTTGA
HK2-Forward:
TTGGTACCGAGCTCGGATCCatgattgcctcgcatctgcttgcctac
HK2-Reverse:
TTCCACCACACTGGAtcgctgtccagcctcacggatg
2.5. Immunoprecipitation (IP)
H1299 cells were seeded at 2.5 x 10⁵ cells in 6-well plate 24 hours prior to transfections. Two micrograms of pcDNA3.1 plasmid DNA (containing FLAG vector or FLAG-HK2) was mixed with OptiMEM, P3000 and L3000 for 5 minutes at room temperature. 1g/L glucose DMEM media +2.5% FBS was aspirated off and replaced with fresh media. After incubation the transfection reagent was added onto the cells and placed into the incubator for 48 hours. Cells were harvested via trypsin dissociation. Cell lysates were lysed in Peirce IP Buffer supplemented with 1x Halt Protease Inhibitor Cocktail with EDTA (ThermoScientific). 250µg of cell lysates as quantified by Bicinchoninic acid assay (BCA) were incubated with 5µg of recombinant MCL1 for 1hr at 4 °C. After this, 20µL of anti-FLAG magnetic beads were added to each sample along with BSA (0.1% final) and incubated rotating at 4 °C for 1hr. Immune complexes were washed three times with Peirce IP buffer. Each sample was denatured from the magnetic beads with 4x Laemmli sample buffer containing BME and boiled at 95 °C for 10 minutes. Proteins were analyzed via western blot as described below.
2.6. Western Blot Analysis
Cells were collected via trypsin dissociation and lysed in 1x RIPA lysis buffer supplemented with 1x Halt Protease Inhibitor Cocktail with EDTA (ThermoScientific). Sample amounts were quantified using BCA. Each sample was denatured with 4x Laemmli sample buffer containing BME at 95 °C for 10 minutes. 20ng of lysates were run on a SDS polyacrylamide gel electrophoresis at 150V for 45 minutes and transferred to a PVDF membrane using a TransBlot Turbo semi-dry transfer system at 25V and 1.3A for 7min. Membranes were blocked in 5% w/v nonfat milk in phosphate-buffered saline + 0.01% tween (PBST) for 1 hour. Primary antibodies were incubated at 4 °C overnight. Blots were then washed with PBST. Secondary antibodies were incubated for 1hr at room temperature and washed with PBST. All western blots were visualized with ECL reagent and imaged on a Bio-Rad ChemiDoc MP imaging system.
2.7. Primary Antibodies
All primary antibodies were diluted 1:1000 in 1% milk-PBST. HK2: anti-HK2 rabbit mAb (C64G5, CST); MCL1: anti-MCL1 rabbit mAb (D2W9E, CST); FLAG: anti-FLAG rabbit mAb (D6W5B, CST)
2.8. Secondary Antibodies
Secondary antibodies were diluted in 1% milk to 1:2000. Rabbit: goat anti-rabbit IgG-HRP (CST).
2.9. HK2 Enzyme Kinetics
HK2 reaction rate was measured spectroscopically by coupling the reaction of HK2 to glucose-6-phosphate dehydrogenase (G6PDH). Rate of HK2 was monitored via rate of NADPH production (ε340 = 6220M-1cm-1) using a Perkin Elmer Victor X5 plate reader (CW lamp filter F-485, absorbance filter F-340). Enzymatic reactions were performed at 25 °C in 50mM HEPES, 150mM NaCl (pH 7.4), 20mM MgCl2, 3mM NADP+ and 2.5µU/µL G6PDH (Fisher Scientific) at different glucose (0.03mM - 2mM) and ATP (0.075mM - 4mM) concentrations in untreated 96-well plates. MCL1 and SUMO titrations to the reaction were performed at various concentration ratios from 1:1 protein:HK2 to 10:1 protein:HK2. All data were plotted in Microsoft Excel to determine initial enzyme velocity. Each biological replicate’s reaction rate represents an average rate obtained from a technical duplicate. Michaelis-Menten parameters were calculated using Prism GraphPad v. 8 enzyme kinetics module. Error bars were calculated for biological triplicates of each reaction.
2.10. MTS Assay Kit for Cell Dose Response
Cells were seeded in a 96-well plate in RPMI 1640 (1×) (- Phenol Red) (Corning) with 2.5% FBS. Cells were placed into a humidified atmosphere of 5% CO2 at 37 °C for 8hr and then dosed on a 9-point dose–response curve with a final DMSO concentration of 0.25%. After 72hrs, cells were treated with 10µL of MTS assay reagent (ab197010) and incubated at 37 °C for 1hr. The 96-well plate was read on a PerkinElmer Victor X5 Multimode Plate Reader at 490nm. Cell dose responses can be found in Supplemental Figure 1A-C.
2.11. Nuclear Magnetic Resonance (NMR)
2D [1H-15N]-TROSY-HSQC spectra were acquired using a Bruker 850MHz magnet at the Central Alabama High Field NMR Facility. Samples prepared the day of collection with 35µM 15N-MCL1 or 35µM 15N-MCL1:38.5µM HK2 (1:1.1) in 50mM HEPES, 150mM NaCl, pH 7.4, supplemented with sodium azide, TCEP (Fisher Bioreagents) and deuterium oxide (99%, Cambridge Isotope Laboratories, Inc). Spectra were analyzed using Computer-Aided Resonance Assignment (CARA). Peak lists generated in CARA were exported to Microsoft Excel for the CSP quantification, calculation of mean and standard of deviation. CSP were calculated using the formula: √(ΔδH2 + (ΔδN/5)2) [25]. Any peaks exhibiting a significant CSP (≥1SD) were mapped to the space filled model of MCL1 in PyMOL using 2PQK. The BIM peptide was removed to display the BH3 binding pocket.
Metabolomics NMR data were collected using a Bruker 850MHz magnet at the Central Alabama High Field NMR facility. Samples prepared from metabolite extraction were resuspended in 210µL of 100mM Na2HPO4, 0.02% sodium azide, 500µM DSS in deuterium oxide. 200µL of resuspension were added to a 3mm NMR tube and spectra were collected immediately. NOESYGPPR1D (1H-NMR) and zgpg30 (13C-NMR) were collected for each sample. HSQCETGPSI (2D [1H-13C]-HSQC) were collected on select control samples for further confirmation of metabolite peak identity. Spectra were initially processed in Bruker Topspin (Bruker Inc.) before exporting to Chenomx NMR Suite v.8 (Chenomx, Inc.) for quantification and identification of metabolites. 13C-NMR area under the curve (A.U.C) measurements, which is directly proportional to concentration of the metabolite, were performed in Bruker Topspin and normalized to viable cell count. All metabolites were identified using a combination of Human Metabolome Database (HMDB) reference spectra, Biological Magnetic Resonance Bank (BMRB), 2D [1H-13C]-HSQC NMR and 850 MHz reference databases present in Chenomx NMR Suite. Example spectra with labelled metabolites and chemical shifts can be found in Supplemental Figures 2-3 and Supplemental Table 1. A schematic of 13C incorporation into downstream glucose metabolites can be found in Supplemental Figure 4.
2.12. Metabolite Preparation and Harvest
H1299 cells were seeded in 5.5mM glucose (Fisher Scientific), 2.05mM L-glutamine (Gibco) with 2.5% dialyzed FBS (Corning) DMEM (Gibco) in a treated 10cm dish. NCI-H23 cells were seeded in 5.5mM glucose (Fisher Scientific), 2.05mM L-glutamine (Gibco), 1mM sodium pyruvate (Gibco) with 2.5% dialyzed FBS (Corning) DMEM (Gibco) in a treated 10cm dish. Sodium pyruvate was added to aid with cell adherence of NCI-H23 cells. After 2 days, cells were washed with 10mL DPBS followed by changing media to 5.5mM [U-13C] glucose (99%, Cambridge Isotope Laboratories, Inc), 2.05mM L-glutamine with 2.5% dialyzed FBS. At this point cells were treated with MCL1 inhibitor S63845 or DMSO (control) and maintained for 24hrs. For harvest, cell media was removed, and cells were washed with ice cold DPBS (10mL). DPBS was removed and cells were quenched with ice cold 80:20 methanol: molecular grade water (5mL) and scraped. Plates were subsequently washed with an additional 2mL of methanol: molecular grade water and placed in dark conical tubes. The metabolite slurry was vortexed for 15sec followed by 15min incubation on ice. 5mL of ice-cold chloroform was then added to the aqueous solution and vortexed for 15sec followed by 15min incubation on ice. Samples were centrifuged at 14000xg for 15min at 4 °C. Top aqueous layer was subsequently removed. 5mL of ice-cold molecular grade water was added to the samples prior to being snap frozen in liquid nitrogen. Samples were subsequently lyophilized at -86 °C before NMR sample preparation. After acquisition of 1H-NMR, samples were snap frozen and lyophilized to maintain sample integrity prior to resuspension and collection of 13C-NMR. Matched samples were used to collect trypan blue cell viability counts.
2.13. Cellular Proliferation Curves
H1299 and A549 cells were seeded in 5.5mM glucose, 2.05mM L-glutamine with 2.5% dialyzed FBS DMEM in a treated 6-well dish and grown in a humidified environment with 5% CO2. For non-glucose depleted growth curves, cells were allowed to adhere for 6hrs followed by treatment with either 0.25% DMSO (vehicular control) or S63845. Cell counts were subsequently collected every 24hrs for 3 days via trypsin dissociation and washed with DPBS. Viability and counts were assessed using a Bio-Rad Automated Cell Counter (Bio-Rad Laboratories, Hercules, CA, USA) with equal parts cells and trypan blue. For glucose depleted curves, cells were seeded as above and allowed to adhere for 18hrs. Following this time, cell media was removed, cells were washed with DPBS and 2.05mM L-glutamine with 2.5% dialyzed FBS DMEM was added to the cells for 6hrs. On completion of this time, cells were washed and supplemented with 5.5mM glucose, 2.05mM L-glutamine with 2.5% dialyzed FBS DMEM and either vehicular control, vehicular control with 5mM pyruvic acid, S63845 or matched concentration S63845 with 5mM pyruvic acid. Cell counts and viability were repeated as above for 3 days.
2.14. Reagents
S63845(Chemietek): MCL1 inhibitor. All other reagents described above.
2.15. Statistical Analysis
All experiments were performed in biological triplicate except H1299 DMSO controls for 13C-NMR which were biological duplicate due to loss of one sample during the second lyophilization step. Data is expressed as mean ± SD. Differences between two data sets were calculated using the two-tailed unpaired Student t-test with P < 0.05 considered statistically significant. Differences between three or more data sets were calculated using one-way ANOVA with Tukey’s Post Hoc testing with P < 0.05 considered statistically significant. Statistical analyses were performed in Prism (GraphPad Inc.) or Microsoft Excel. *P < 0.05, **P < 0.01, ***P < 0.001.
3. Results
3.1. MCL1-HK2 Binding Occurs via the BH3-Binding Cleft
We previously established MCL1 binds to and modulates protein function through a naturally occurring rBH3 motif found in other cellular proteins (p73, CDKN2C and PTBP1) [21,22,23]. BLAST sequence analysis of the human proteome revealed HK2 contains putative rBH3 motifs within both its NTD and CTD (Table 1). Strikingly, key acidic residues of the rBH3, for HK2 D209 and D657, - which we demonstrated to be important for MCL1 binding - are contained within the catalytic cores of HK2 [12]. These aspartic acid residues are essential for the coordination of the 6’-hydroxyl group of glucose with the γ-phosphate of ATP [26]. Alanine substitution at these positions renders HK2 catalytically inactive despite preserving tertiary structure [13].
We previously demonstrated MCL1 binds other rBH3 containing proteins (p73 and PTBP1) through its BH3-binding cleft [20,21,22,23]. To determine whether HK2 similarly targets the BH3-binding cleft, we performed competitive fluorescence polarization assay (FPA) with recombinant HK2 and MCL1 [27]. Following established methods, we incubated MCL1 with increasing concentrations of HK2 [21,23]. Subsequently we added 10nM of a FITC-labelled BAK peptide (F-BAK) - a native ligand of MCL1 - to determine HK2’s ability to outcompete F-BAK [21]. HK2 displaced F-BAK from the BH3-binding cleft of MCL1 with a KD of less than 10nM (below limit of detection), confirming high-affinity binding interaction (Figure 1A).
We next conducted 1H-15N-TROSY HSQC using matched 15N-labelled MCL1 samples with and without HK2 (ratio HK2:MCL1 – 1.1:1) to identify binding residues. In brief, comparative analysis of mapped amide peaks of MCL1 before and after HK2 addition revealed significant changes in chemical environment (e.g., chemical shift perturbation) for select amide peaks of MCL1 (Supplemental Figure 5) [28]. Chemical shift perturbation was calculated using δΔppm shifts in an iterative approach to determine significantly shifted residues (defined as ≥1σ δΔppm shift) (Figure 1B) [29]. Mapping these significantly shifted residues on the crystal structure of MCL1 (2PQK) revealed most residues were clustered with the BH3-binding cleft of MCL1 (ex. V249, M250, R263, I294, F318, H320), consistent with other rBH3-mediated interactions (Figure 1B-C). Notably, R263 – which forms a critical salt bridge in BH3 motif binding - was also perturbed by HK2, mirroring other rBH3 proteins [21,23,29].
3.2. The rBH3 Motifs Mediate HK2-MCL1 Binding
Having localized the HK2-MCL1 binding to the BH3 cleft, we next investigated if rBH3 motifs of HK2 mediate the binding interaction. Prior studies of rBH3 proteins demonstrated that alanine substitution of the acidic residue of the rBH3 motif significantly weakens binding [21,22,23]. Thus, we generated double rBH3 mutant D209A/D657A HK2 and assessed binding interaction with FPAs as before. D209A/D657A HK2 significantly weakened MCL1 binding affinity (KD = 44.2 ± 10.6nM) compared to WT-HK2 (KD ≤ 10nM), confirming rBH3 motifs are essential for interaction (Figure 1D).
3.3. HK2 and MCL1 Bind in a Cellular Context
Having confirmed binding in an in-vitro context, we investigated if HK2 and MCL1 bind in-cellulo. First, we verified intracellular proximity between HK2 and MCL1 through a split GFP reporter system [30]. We tagged MCL1 with GFP1-10 tag (MCL1-GFP1-10) and HK2 with GFP11 peptide (HK2-GFP11) to assess proximity. As previously described when GFP1-10 protein and GFP11 peptide are within 15Å, the holo-GFP protein is formed, and fluorescence is observed [30]. Transient transfection of U2OS cells with MCL1-GFP1-10 and HK2-GFP11 yielded cytoplasmic fluorescence confirming MCL1 and HK2 co-localize within a distance compatible with direct binding (Figure 2A). To validate HK2-MCL1 binding, we employed co-immunoprecipitation (Co-IP). We transiently transfected non-small cell lung cancer (NSCLC) H1299 cells with FLAG-HK2 or FLAG control for 48hrs prior to lysate collection. We analyzed MCL1 protein presence through Co-IP western blot. We observed FLAG-HK2 robustly pulled down MCL1, confirming interaction between the proteins in a cellular context (Figure 2B).
3.4. MCL1 Enhances HK2 Catalytic Activity
Since the rBH3 motifs mediating HK2-MCL1 binding are contained within HK2’s catalytic core, we investigated the functional consequences of this interaction. Using established Michaelis-Menten enzyme kinetics assays, we monitored HK2’s activity by coupling G6P production with NADPH via G6PDH (Figure 3A) [31,32]. We titrated MCL1 against a fixed concentration of HK2 which revealed a striking increase in catalysis. We observed a 35.1 ± 2.5% (P = 0.0003) increase in HK2 turnover (Kcat) when compared to HK2 alone (MCL1:HK2 = 5:1) without impacting substrate affinity (KM) (Figure 3B-D).
To rule out non-specific protein interactions driving this effect, we titrated matched concentrations of small ubiquitin-like modifier 1 (SUMO) against HK2. We chose SUMO as a negative control because it has not been characterized to bind HK2. Under matched SUMO concentrations (SUMO:HK2 = 5:1) we observed an insignificant change in Kcat (6.2 ± 0.4%, P = 0.3589) or KM when compared to HK2 only, though higher SUMO concentrations induced artificial changes (Supplemental Figure 6A). Notably, the D209A/D657A mutant HK2 could not be analyzed due to lack of catalytic activity as expected (Supplemental Figure 6B) [13]. These results demonstrate MCL1 binding potentiates HK2 activity despite engaging with residues critical for catalysis [33].
3.5. MCL1 and HK2 Form a Glucose Metabolic Regulatory Axis
Having established MCL1 binding enhances HK2 catalysis in-vitro, we investigated next if this effect carried into a cellular context. We treated HK2/MCL1 expressing NSCLC cell lines H1299 and NCI-H23 with either the BH3 binding cleft inhibitor S63845 (which we previously identified blocks rBH3 interactions) or vehicular control (Figure 4A) [22,23,34,35,36]. We then used nuclear magnetic resonance (NMR) metabolomics to assess glucose metabolism. Based on our in-vitro enzymatic studies, we hypothesized MCL1 inhibition would decrease HK2 driven metabolism. We assessed a variety of glucose and non-glucose related metabolites using 1H-NMR in H1299 cells (Table 2). We observed significant reductions in HK2 associated metabolites in glycolysis (lactic acid, NADH); citric acid cycle (TCA) (NADH, citric acid, isocitrate); oxidative phosphorylation (ATP/ADP ratio); and pentose phosphate pathway (PPP) (NADPH/NADP+ ratio) (Figure 4B-H). Notably, despite being often derived from G6P, non-essential amino acids (alanine, glycine, glutamine, glutamic acid and serine) showed no significant reduction in levels on 1H-NMR (Supplemental Table 2). We observed similar patterns of metabolic change in NCI-H23 cells (Supplemental Figure 7A-B).
To confirm metabolic changes observed were associated with HK2 activity rather than a global reduction of metabolism, we analyzed non-glucose associated metabolites across multiple pathways. We assessed phenylalanine metabolism (tyrosine), essential amino acids metabolism (valine, isoleucine, leucine and phenylalanine), and amino acid and lipid related metabolism (methylmalonic acid, o-phosphocholine) which remained unchanged (Table 2, Supplemental Table 2). This ruled out non-specific metabolic suppression. Trypan blue viability assays confirmed cell viability remained greater than 93%, ruling out decreased cell viability as the cause of the metabolic changes observed (Supplemental Figure 7A-D).
To confirm HK2-mediated glucose metabolism was the cause of the observed metabolic changes, we conducted 13C-NMR tracer studies using the [U-13C] glucose we supplemented the cell’s media with. As hypothesized, we observed significant reductions in the concentrations of 13C labelled lactic acid (C3) and PPP-related ATP ribose sugar (C4) compared to vehicular controls (Figure 5A). Furthermore, while not showing significant changes in 1H-NMR, 13C-NMR showed significantly impaired non-essential amino acid biosynthesis as shown by decrease in the concentrations of 13C in amino acids serine (C1), glutamic acid (C4), glutamine (C4) and proline (C4) (Figure 5B).
Our 1H-NMR and 13C-NMR tracer studies confirm that MCL1 inhibition significantly reduces glucose metabolism as shown by a reduction in metabolites in all major glucose-utilizing pathways [37]. These findings together are consistent with impairment of HK2 catalysis upon MCL1 dissociation as shown by reduction in glucose derived metabolites, unchanged non-glucose associated metabolites and preserved cell viability.
3.6. The MCL1-HK2 Axis Mediates Metabolic Plasticity Under Glucose Stress
Our metabolomics findings established MCL1-HK2 comprise a glucose metabolic regulatory axis. To investigate its functional consequences, we assessed cellular proliferation. We initially treated H1299 and A549 cells with S63845, a BH3 mimetic that ablates rBH3 binding, or vehicular control in 1g/L glucose containing DMEM media and measured proliferation over a 3-day period with trypan blue. Consistent with prior studies in NSCLC, proliferation was not impacted (Supplemental Figure 8A-D) [38].
Strikingly, when cells were subjected to glucose stress, as simulated by glucose deprivation for 6hrs prior to S63845 treatment, we observed a 42.8 ± 11.7% reduction in proliferation (P = 0.030) in H1299 cells with no impact on viability (Figure 6A-B). To mechanistically link this phenotype to HK2 impairment, we employed a metabolic rescue. Supplementation of media with 5mM pyruvic acid (which bypasses HK2-dependent glycolysis) restored proliferation in S63845 treated cells (-0.7% ± 0.2%, P = 0.998 versus vehicular control) (Figure 6A, 6E) [39]. Importantly, pyruvic acid treatment did not significantly impact proliferation in control cells, demonstrating the specificity of this rescue (Supplemental Figure 10A-D). These trends were reflected in the A549 cell line as well (Figure 6C-D). These data demonstrate that the HK2-MCL1 axis is essential for metabolic adaptation to glucose stress.
4. Discussion
This work establishes a novel, non-canonical function for the pro-survival protein MCL1 as a direct regulator of HK2 through an rBH3 mediated interaction. Through binding FPA studies and NMR chemical shift perturbation analysis, we localized binding to the BH3-binding cleft of MCL1. Mutational analysis of HK2 localized the binding interaction to its rBH3 motifs. We demonstrated the molecular consequence of binding is a 35.1% increase in HK2 turnover (Kcat). This was carried into a cellular metabolic phenotype, where we observed significantly impaired glucose metabolism, aligning with an impairment in HK2 function. Finally, we observed a functional consequence of the HK2-MCL1 axis is reduced glucose metabolic plasticity as observed by a significant reduction in proliferation under glucose stress. More broadly, this rBH3-mediated interaction represents a key integration point between cell survival mechanisms and metabolic regulation.
Our findings also reveal a surprising functional consequence of HK2-MCL1 interaction. We hypothesize MCL1 binding to HK2 would result in occlusion of an active site as MCL1’s size would likely obstruct substrate access to at least one domain’s essential catalytic residues (D209 and/or D657). However, despite this, we observe a significant increase in HK2 activity. This presents an intriguing question, how mechanistically does MCL1 enact this effect? There are multiple (non-exclusive) hypotheses by which this could occur including: (1) allosteric activation of HK2, whereby MCL1 induces a confirmation change in the opposite catalytic site (2) same-sided activation whereby MCL1 optimizes activity directly in the bound catalytic site (3) MCL1 binding relieves substrate inhibition. Substrate inhibition relief could not be assessed due to the coupled nature of the assay used. Further mutational analysis of HK2 and a HK2-MCL1 complex structure may help answer these questions.
Our work in the context of others also sheds light on how MCL1 carefully regulates bioenergetics. By binding HK2, MCL1 enhances glycolytic flux while simultaneously enhancing oxidative phosphorylation downstream through binding ATP synthase as demonstrated by Perciavalle, et al. [40]. Thus, MCL1 inhibition creates synergistic metabolic stress whereby upstream glycolytic and TCA flux are significantly decreased and coupled with significant reductions in ATP synthesis potential [41]. This dual mechanism could be particularly devastating to cancers, whose reliance on glucose (e.g., Warburg Effect) and increased bioenergetic demands make them vulnerable to such coordinated impairment [42,43]. Bioenergetic crisis or “metabolic catastrophe” may heighten the effect of MCL1 inhibitors in highly glycolytic tumors that are dependent on MCL1 survival [41].
Our metabolic rescue studies with pyruvic acid supplementation also reveal a potential mode of resistance to MCL1 inhibitors. Prior work by the DeBerardinis group observed heterogeneous metabolism in NSCLC tumors whereby the hypoxic core of the tumor relies more on glycolytic metabolism, while lactic acid driven oxidative metabolism sustains the tumor edge [44,45,46]. Since lactic acid can be readily converted to pyruvic acid via lactic acid dehydrogenase (LDH), our data suggests tumors could exploit this pathway to bypass HK2 impairment brought by MCL1 inhibition [36]. It would be interesting to see if this mechanistically occurs in acquired resistance cell models and if so, this could be reversed using an LDH inhibitor.
Finally, our findings may provide insights into the cardiotoxicity observed in clinical trials of MCL1 inhibitors [47]. Cardiomyocytes are particularly vulnerable to MCL1 inhibition due to unique metabolic constraints including: (1) the heart utilizes HK2 to meet its glucose metabolic demands (2) MCL1 inhibition impairs autophagy giving the heart limited metabolic adaptation options (3) the high energy demands of hearts which require constant ATP production by ATP synthase to maintain contractility [48,49,50]. Therefore, we hypothesize MCL1 inhibition creates a severe metabolic insult to the heart, which when combined with limited metabolic adaptation ability and apoptosis promotion results in cardiomyocyte death. Taken together, this suggests a potential strategy to improve MCL1 inhibitors would be to develop next generation inhibitors that spare MCL1 binding to HK2 while still promoting apoptosis.
Supplementary Materials
The following supporting information can be downloaded at the website of this paper posted on Preprints.org, S1: MTS Assay 3 Day Dose Response Curves of Cell Lines Treated with S63845. S2: 1H-NMR Spectra with Labels Detailing Position of Metabolites. Table S1: NMR Table Detailing Chemical Shift Information Used to Identify and Quantify Analyzed Metabolites. S3: Representative 13C-NMR Spectra and Table of Chemical Shift Information. S4: 13C Label Incorporation Scheme. S5: Overlayed 2D [1H-15N]-TROSY HSQC of MCL1 and MCL1 + HK2. S6: Summary of Michaelis-Menten Kinetics for HK2. Table S2: 1H-NMR Metabolites from Non-Essential and Other Non-Glucose Derived Metabolites. S7: NCI-H23 Cell Metabolomics Reveal Similar Patterns of Metabolic Perturbation as H1299 Cells. S8: Cell Counts and Viability of Cells Used for Metabolomics Analysis. S9: S63845 Does Not Significantly Impact Proliferation Without Glucose Deprivation. S10: 5mM Pyruvic Acid Treatment Does Not Significantly Impact Proliferation.
Author Contributions
R.L. and W. J. P. conceptualization; R.L., A.A., and W. J. P. methodology; R.L. formal analysis; R.L., A.A., M.H., N.J.L. investigation; R.L. writing–original draft; R.L. and W. J. P.: writing–review & editing; R.L., A.A., M.H., N.J.L. visualization; W. J. P. supervision; W. J. P. project administration; W. J. P. funding acquisition.
Funding
This work was supported, in part, by funding from the National Institutes of Health grants R01GM117391 (to W. J. P.) and National Institutes of Health grants T32GM008361 (to R.L.). The content is solely the responsibility of the authors and does not necessarily represent the official views of the National Institutes of Health.
Acknowledgments
We would like to acknowledge Christine Carico for her insight in drafting and writing, Lochlain Corliss for assisting in the collection of fluorescence imaging, Ron Shin for assistance with NMR pulse sequences and Samuel F. Chang for providing technical support in the operation of the Perkins Elmer Victor X5 plate reader.
Conflicts of Interest
The authors declare no conflicts of interest.
Abbreviations
The following abbreviations are used in this manuscript:
| HK2 | Hexokinase 2 |
| MCL1 | Myeloid Cell Leukemia 1 |
| G6P | Glucose-6-Phosphate |
| BH3 | Bcl-2 Homology 3 |
| rBH3 | Reverse Bcl-2 Homology 3 |
| NTD | N-Terminal Domain |
| CTD | C-Terminal Domain |
| FPA | Fluorescence Polarization Assay |
| F-BAK | FITC-labelled BAK Peptide |
| CSP | Chemical Shift Perturbation |
| SUMO | Small Ubiquitin-like Modifier 1 |
| NSCLC | Non-small Cell Lung Cancer |
| TCA | The Citric Acid Cycle |
| PPP | Pentose Phosphate Pathway |
| A.U.C | Area Under the Curve |
References
- Hanahan, D. & Weinberg, R.A. Hallmarks of cancer: the next generation. Cell 144, 646-674 (2011).
- Wilson, D.F. & Matschinsky, F.M. Metabolic Homeostasis in Life as We Know It: Its Origin and Thermodynamic Basis. Front Physiol 12, 658997 (2021). [CrossRef]
- Warburg, O. & Minami, S. Versuche an Überlebendem Carcinom-gewebe. Klinische Wochenschrift 2, 776-777 (1923). [CrossRef]
- Vander Heiden, M.G., Cantley, L.C. & Thompson, C.B. Understanding the Warburg effect: the metabolic requirements of cell proliferation. Science 324, 1029-1033 (2009). [CrossRef]
- Wilson, J.E. Hexokinases. Rev Physiol Biochem Pharmacol 126, 65-198 (1995).
- Farooq, Z., Ismail, H., Bhat, S.A., Layden, B.T. & Khan, M.W. Aiding Cancer’s “Sweet Tooth”: Role of Hexokinases in Metabolic Reprogramming. Life (Basel) 13 (2023). [CrossRef]
- Pedersen, P.L. Warburg, me and Hexokinase 2: Multiple discoveries of key molecular events underlying one of cancers’ most common phenotypes, the “Warburg Effect”, i.e., elevated glycolysis in the presence of oxygen. J Bioenerg Biomembr 39, 211-222 (2007). [CrossRef]
- Wilson, J.E. Isozymes of mammalian hexokinase: structure, subcellular localization and metabolic function. J Exp Biol 206, 2049-2057 (2003). [CrossRef]
- Li, R. et al. A pan-cancer analysis of the role of hexokinase II (HK2) in human tumors. Scientific Reports 12, 18807 (2022). [CrossRef]
- Ciscato, F., Ferrone, L., Masgras, I., Laquatra, C. & Rasola, A. Hexokinase 2 in Cancer: A Prima Donna Playing Multiple Characters. Int J Mol Sci 22 (2021). [CrossRef]
- Patra, K.C. et al. Hexokinase 2 is required for tumor initiation and maintenance and its systemic deletion is therapeutic in mouse models of cancer. Cancer Cell 24, 213-228 (2013). [CrossRef]
- Nawaz, M.H. et al. The catalytic inactivation of the N-half of human hexokinase 2 and structural and biochemical characterization of its mitochondrial conformation. Biosci Rep 38 (2018). [CrossRef]
- Ardehali, H. et al. Functional organization of mammalian hexokinase II. Retention of catalytic and regulatory functions in both the NH2- and COOH-terminal halves. J Biol Chem 271, 1849-1852 (1996).
- Robey, R.B. & Hay, N. Mitochondrial hexokinases: guardians of the mitochondria. Cell Cycle 4, 654-658 (2005). [CrossRef]
- Roberts, D.J. & Miyamoto, S. Hexokinase II integrates energy metabolism and cellular protection: Akting on mitochondria and TORCing to autophagy. Cell Death Differ 22, 248-257 (2015). [CrossRef]
- Rodriguez-Saavedra, C. et al. Moonlighting Proteins: The Case of the Hexokinases. Front Mol Biosci 8, 701975 (2021). [CrossRef]
- Thomas, L.W., Lam, C. & Edwards, S.W. Mcl-1; the molecular regulation of protein function. FEBS Lett 584, 2981-2989 (2010). [CrossRef]
- Chipuk, J.E., Moldoveanu, T., Llambi, F., Parsons, M.J. & Green, D.R. The BCL-2 family reunion. Mol Cell 37, 299-310 (2010). [CrossRef]
- Michels, J., Johnson, P.W.M. & Packham, G. Mcl-1. The International Journal of Biochemistry & Cell Biology 37, 267-271 (2005).
- Placzek, W.J. et al. Identification of a novel Mcl-1 protein binding motif. J Biol Chem 286, 39829-39835 (2011). [CrossRef]
- Widden, H., Kaczmarczyk, A., Subedi, A., Whitaker, R.H. & Placzek, W.J. MCL1 binds and negatively regulates the transcriptional function of tumor suppressor p73. Cell Death Dis 11, 946 (2020). [CrossRef]
- Whitaker, R.H. & Placzek, W.J. MCL1 binding to the reverse BH3 motif of P18INK4C couples cell survival to cell proliferation. Cell Death Dis 11, 156 (2020). [CrossRef]
- Carico, C., Cui, J., Acton, A. & Placzek, W.J. Polypyrimidine tract binding protein 1 (PTBP1) contains a novel regulatory sequence, the rBH3, that binds the prosurvival protein MCL1. J Biol Chem 299, 104778 (2023). [CrossRef]
- Catalano, G. et al. MCL1 regulates AML cells metabolism via direct interaction with HK2. Metabolic signature at onset predicts overall survival in AMLs’ patients. Leukemia 37, 1600-1610 (2023). [CrossRef]
- Placzek, W.J., Almeida, M.S. & Wuthrich, K. NMR structure and functional characterization of a human cancer-related nucleoside triphosphatase. J Mol Biol 367, 788-801 (2007). [CrossRef]
- Zeng, C., Aleshin, A.E., Hardie, J.B., Harrison, R.W. & Fromm, H.J. ATP-binding site of human brain hexokinase as studied by molecular modeling and site-directed mutagenesis. Biochemistry 35, 13157-13164 (1996). [CrossRef]
- Lea, W.A. & Simeonov, A. Fluorescence polarization assays in small molecule screening. Expert Opin Drug Discov 6, 17-32 (2011). [CrossRef]
- Liu, G. et al. High-quality NMR structure of human anti-apoptotic protein domain Mcl-1(171-327) for cancer drug design. PLoS One 9, e96521 (2014). [CrossRef]
- Denis, C., Sopkova-de Oliveira Santos, J., Bureau, R. & Voisin-Chiret, A.S. Hot-Spots of Mcl-1 Protein. J Med Chem 63, 928-943 (2020). [CrossRef]
- Bignon, C., Gruet, A. & Longhi, S. Split-GFP Reassembly Assay: Strengths and Caveats from a Multiparametric Analysis. Int J Mol Sci 23 (2022). [CrossRef]
- Ferreira, J.C. et al. Linker residues regulate the activity and stability of hexokinase 2, a promising anticancer target. J Biol Chem 296, 100071 (2021). [CrossRef]
- Cayanis, E. & Balinsky, D. Comparative kinetic properties of human hexokinases. International Journal of Biochemistry 6, 741-749 (1975). [CrossRef]
- Fersht, A. Structure and mechanism in protein science : a guide to catalysis and protein folding. (W.H. Freeman, 1999).
- Kotschy, A. et al. The MCL1 inhibitor S63845 is tolerable and effective in diverse cancer models. Nature 538, 477-482 (2016). [CrossRef]
- Placzek, W.J. et al. A survey of the anti-apoptotic Bcl-2 subfamily expression in cancer types provides a platform to predict the efficacy of Bcl-2 antagonists in cancer therapy. Cell Death Dis 1, e40 (2010). [CrossRef]
- Wang, H. et al. Inhibition of glycolytic enzyme hexokinase II (HK2) suppresses lung tumor growth. Cancer Cell Int 16, 9 (2016).
- Voet, D., Voet, J. G. Biochemistry, Edn. 4. (John Wiley & Sons, Inc., Hoboken, NJ; 2010).
- Munkhbaatar, E. et al. MCL-1 gains occur with high frequency in lung adenocarcinoma and can be targeted therapeutically. Nat Commun 11, 4527 (2020). [CrossRef]
- Bennett, N.K. et al. Defining the ATPome reveals cross-optimization of metabolic pathways. Nat Commun 11, 4319 (2020). [CrossRef]
- Perciavalle, R.M. et al. Anti-apoptotic MCL-1 localizes to the mitochondrial matrix and couples mitochondrial fusion to respiration. Nat Cell Biol 14, 575-583 (2012). [CrossRef]
- Carter, B.Z. et al. Targeting MCL-1 dysregulates cell metabolism and leukemia-stroma interactions and resensitizes acute myeloid leukemia to BCL-2 inhibition. Haematologica 107, 58-76 (2022). [CrossRef]
- Jin, S., DiPaola, R.S., Mathew, R. & White, E. Metabolic catastrophe as a means to cancer cell death. Journal of Cell Science 120, 379-383 (2007). [CrossRef]
- Guo, W. et al. Hexokinase 2 Depletion Confers Sensitization to Metformin and Inhibits Glycolysis in Lung Squamous Cell Carcinoma. Front Oncol 10, 52 (2020). [CrossRef]
- Faubert, B. et al. Lactate Metabolism in Human Lung Tumors. Cell 171, 358-371 e359 (2017). [CrossRef]
- Yang, W. et al. A method for the identification of lactate metabolism-related prognostic biomarkers and its validations in non-small cell lung cancer. Scientific Reports 15, 5812 (2025). [CrossRef]
- Hensley, Christopher T. et al. Metabolic Heterogeneity in Human Lung Tumors. Cell 164, 681-694 (2016). [CrossRef]
- Yuda, J. et al. Selective MCL-1 inhibitor ABBV-467 is efficacious in tumor models but is associated with cardiac troponin increases in patients. Commun Med (Lond) 3, 154 (2023). [CrossRef]
- Thomas, R.L. et al. Loss of MCL-1 leads to impaired autophagy and rapid development of heart failure. Genes Dev 27, 1365-1377 (2013). [CrossRef]
- McCommis, K.S., Douglas, D.L., Krenz, M. & Baines, C.P. Cardiac-specific Hexokinase 2 Overexpression Attenuates Hypertrophy by Increasing Pentose Phosphate Pathway Flux. Journal of the American Heart Association 2, e000355 (2013). [CrossRef]
- Wang, X. et al. Deletion of MCL-1 causes lethal cardiac failure and mitochondrial dysfunction. Genes Dev 27, 1351-1364 (2013). [CrossRef]
Figure 1.
MCL1 Directly Binds HK2 via the rBH3 Motif. A) Competitive FPA consisting of 100nM recombinant MCL1, 10nM F-BAK and increasing concentrations of recombinant HK2. C) Chemical shift perturbation analysis of 2D [1H-15N]-TROSY HSQC spectra of 35µM 15N-MCL1 + 10% D2O or 35µM 15N-MCL1 + 38.5µM HK2 + 10% D2O. Chemical shift perturbation (CSP) was calculated using the equation Δδ ppm = √(ΔδH2 + (ΔδN/5)2) for each amino acid of MCL1. The cyan line indicates a CSP of greater than 1 standard of deviation (SD) from the mean, the magenta line represents a CSP of greater than 2 SD of the mean. D) Mapped chemical shift perturbations on a space filled model of MCL1. Left represents the front view of MCL1 where a majority of CSPs fell within the BH3 binding cleft of MCL1 (highlighted in the red box). The right represents the 180° rotation of MCL1 where minimal CSP was appreciated. Cyan residues represent 1 SD CSP, magenta represents 2 SD CSP. D) Competitive FPA consisting of 100nM recombinant MCL1, 10nM F-BAK and increasing concentrations of recombinant rBH3 mutated D209A/D657A HK2.

Figure 2.
MCL1 Binds HK2 in a Cellular Context. A) Representative images of U2OS cells transfected with either MCL1-GFP1-10 alone or MCL1-GFP1-10 + HK2-GFP11. Immunofluorescence was analyzed on an Olympus IX83 at 60x magnification and analyzed in ImageJ for protein localization. B) Co-immunoprecipitation (Co-IP) of FLAG-HK2 or FLAG control transiently transfected H1299 cells. Co-IP was performed with anti-FLAG magnetic beads. Western Blot analysis was used to analyze FLAG tagged HK2 construct protein expression and pulldown of recombinant MCL1.

Figure 3.
MCL1 Positively Increases HK2 Enzymatic Turnover Without Impacting Substrate Affinity. A) Schematic of the coupled assay used in Michaelis-Menten enzymatic analysis of HK2. Created with Biorender. B) Plot of the velocity of HK2 at varying concentrations of ATP with a fixed concentration of glucose with and without 250nM MCL1 or 250nM SUMO. Each point represents a triplicate of experimental data, and the line is the best fit calculation for a Michaelis-Menten Plot. C) One-way ANOVA statistical analysis on the calculated Kcat values generated from Figure 2B. D) Summary of Michaelis-Menten parameters obtained for HK2 only, HK2 + 250nM MCL1 and HK2 + 250nM SUMO. Each value and error were calculated from an average triplicate ATP and glucose Michaelis-Menten plots.

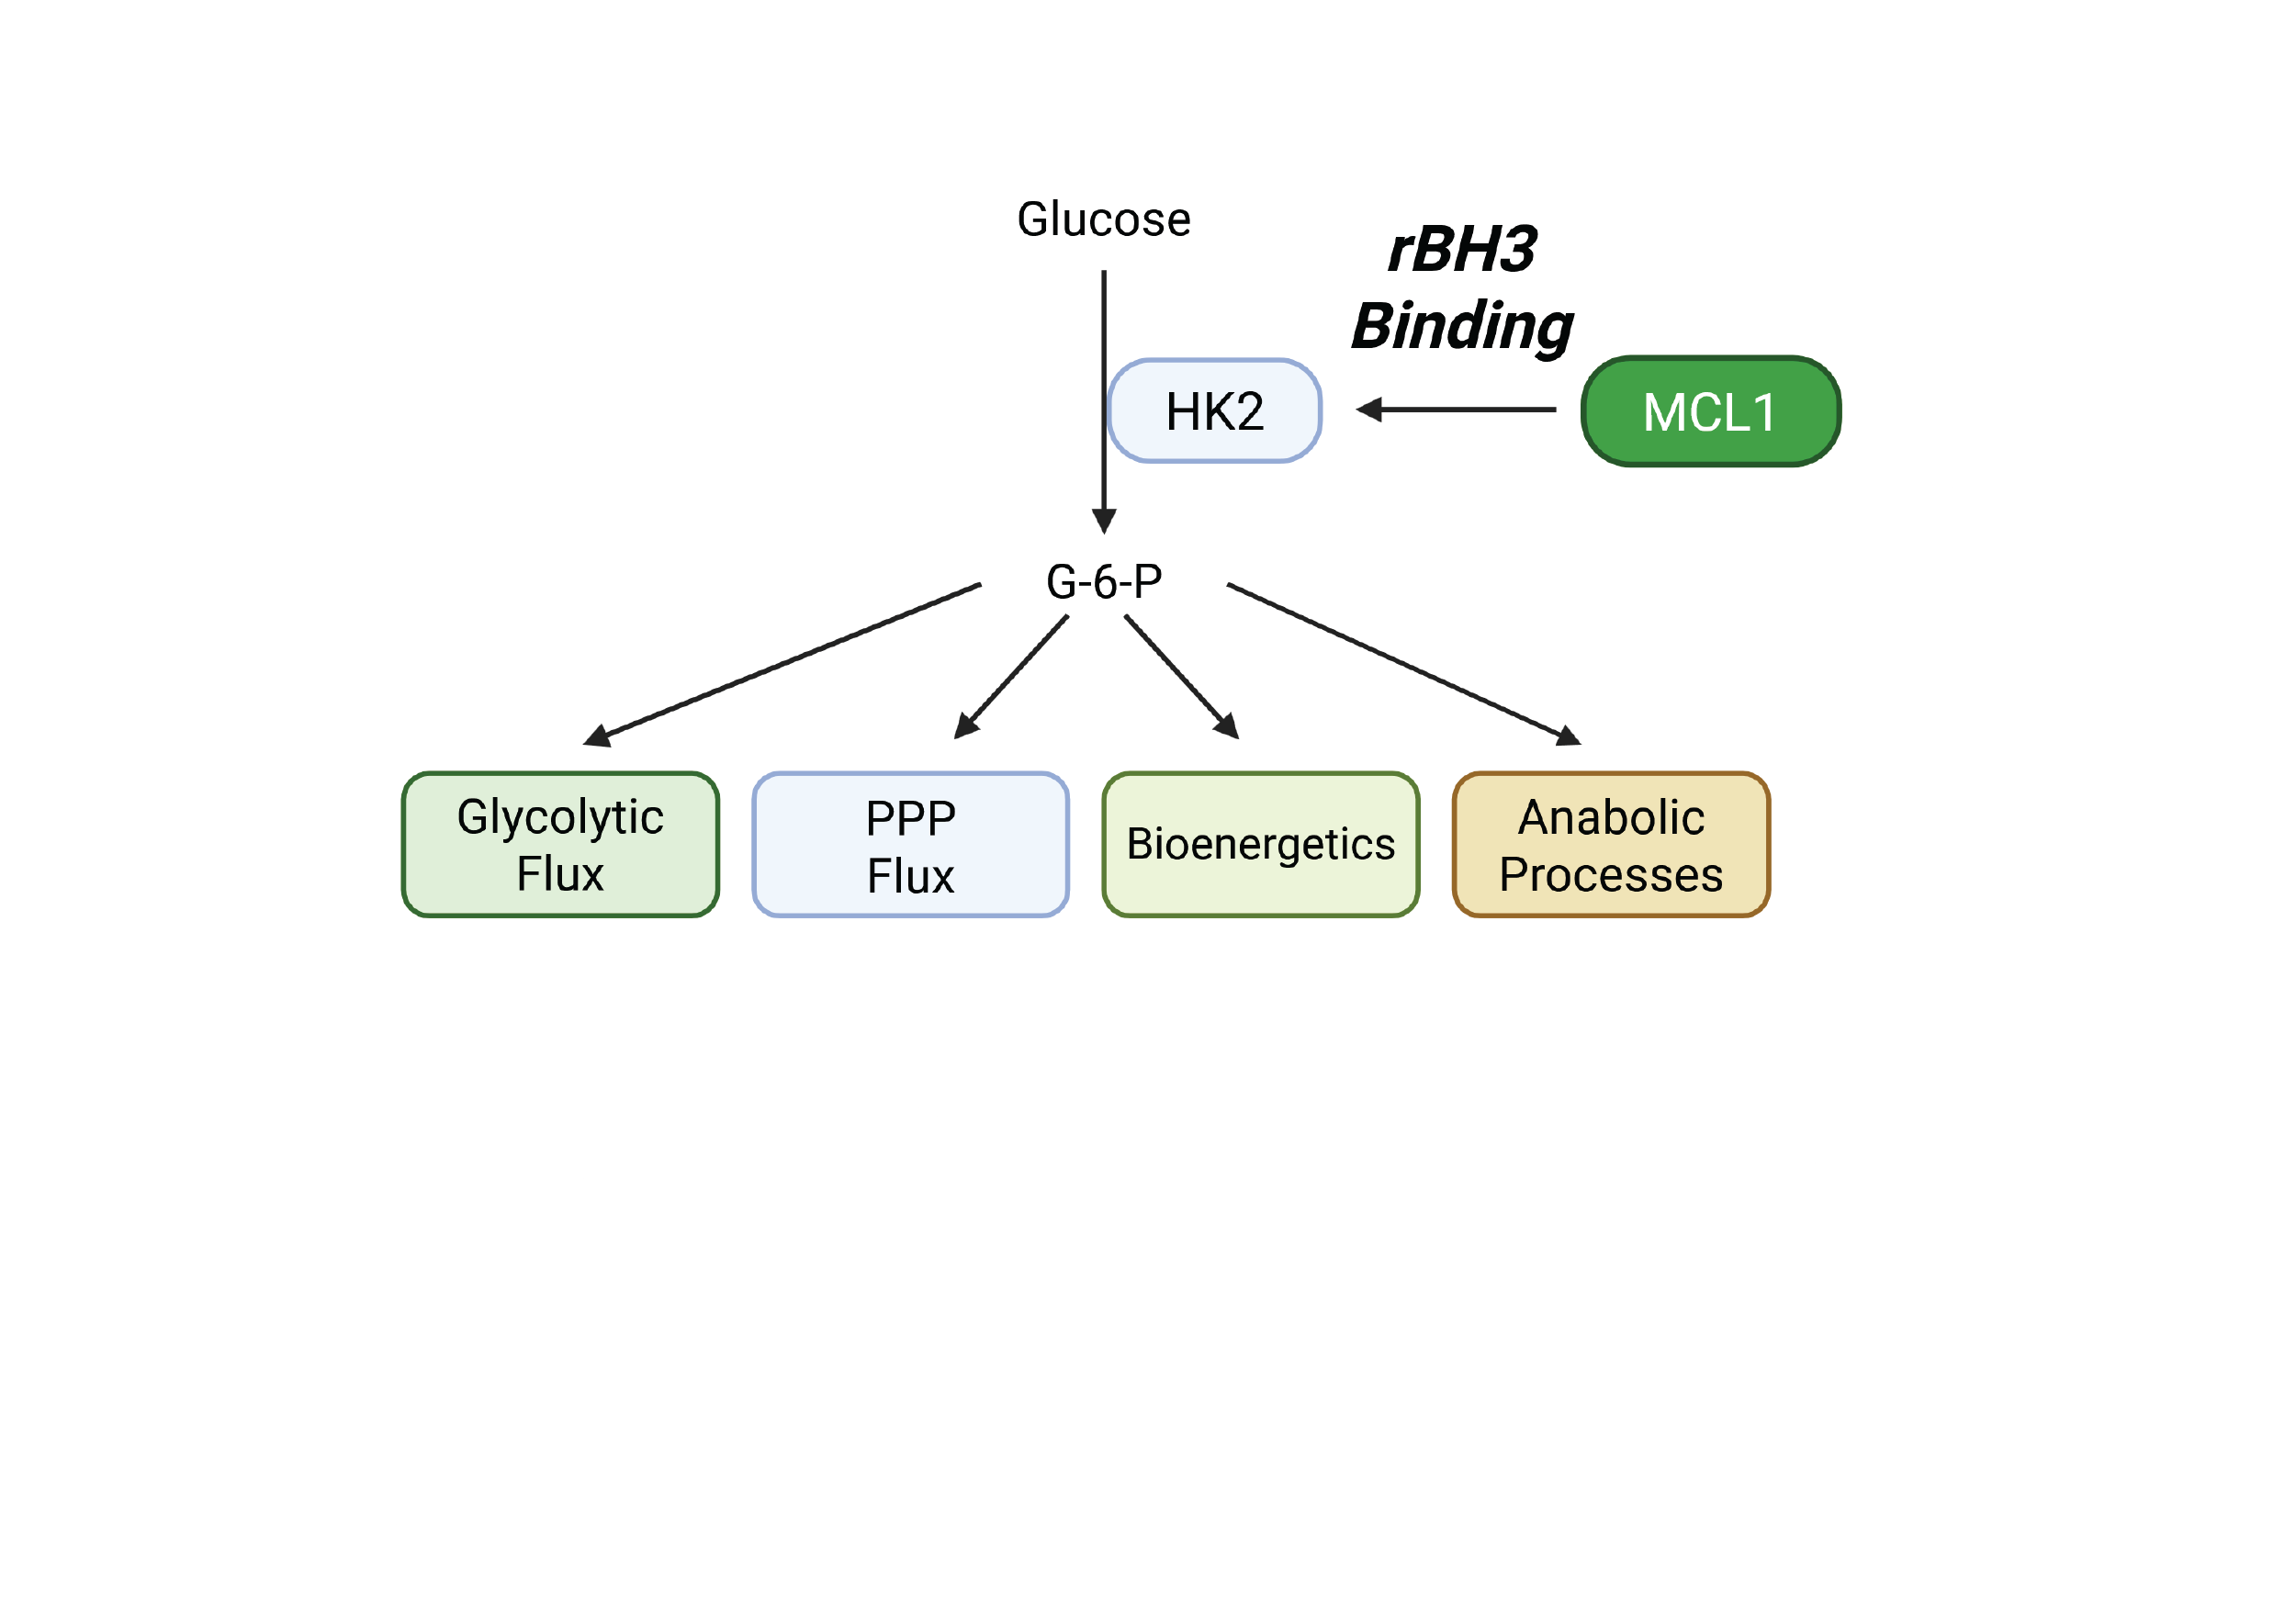
Figure 4.
1H-NMR Reveals Decreased Metabolites, Cellular Energetics and Redox Metabolites. A) Simplified schematic of how HK2 feeds into glycolysis, TCA, oxidative phosphorylation, PPP and amino acid biosynthesis. B-E) Student’s t-test summary of indicated metabolites harvested from H1299 cells; graphs were generated from Table 2. Metabolites showed significant decreases in S63845 treated groups when compared to DMSO vehicular control. Each metabolite and error are representative of a triplicate. F-H). Student’s t-test on the ratio calculation of energetic and redox metabolites from Table 2 as indicated. Average and error bars represent a triplicate for each ratio. Figure 4A created with Biorender.

Figure 5.
[U-13C] Glucose Tracer Analysis Confirms 1H-NMR Findings and Reveals Decreased Amino Acid Biosynthesis. A-B) 13C metabolite analysis of 5µM S63845 treatment in H1299 cells. 13C-NMR was collected in 100mM Na2HPO4 + 0.02% NaN3 + 500µM DSS in D2O. Concentrations of indicated metabolites were quantified using area under the curve (A.U.C) of 13C peak intensity measurements as calculated in Bruker Topspin. A.U.C was normalized to viable cell count. Each plot represents a mean and error for the indicated metabolite.

Figure 6.
Ablation of MCL1/HK2 Cellular Binding Results in Decreased Metabolic Plasticity. A) Proliferation curves of H1299 cells treated with vehicular control, 1µM MCL1 inhibitor S63845 or 1µM S63845 in media supplemented with 5mM pyruvic acid to rescue impaired HK2 driven glycolysis. Black arrow represents the start of glucose depletion to simulate glucose metabolic stress (6hrs). Grey arrow represents reintroduction of glucose as well as treatment with indicated group. B) Viability and cell count of H1299 cells on day 3 after treatment as assessed by trypan blue. C) Proliferation curves of A549 cells treated with vehicular control, 500nM S63845 or 500nM S63845 in media supplemented with 5mM pyruvic acid. Black arrow represents the start of glucose depletion to simulate glucose metabolic stress (6hrs). Grey arrow represents reintroduction of glucose as well as treatment with indicated group. D) Viability and cell count of A549 cells on day 3 after treatment as assessed by trypan blue. Error bars were calculated for biological triplicate. E) Schematic of how pyruvic acid rescues impaired HK2 glycolysis. Figure 6E created with Biorender.


Table 1.
HK2 Contains a Putative rBH3 motif. Sequence alignment between the canonical BH3 motif, previously characterized reverse BH3 (rBH3) motifs and motif containing proteins and HK2’s putative rBH3 motifs contained within the NTD and CTD of the protein. Phi represents a generic hydrophobic residue.
 |
Table 2.
1H-NMR Reveals Decreased Metabolites in Pathways Downstream of HK2. Glucose derived metabolite abundance changes with 5µM S63845 treatment in H1299 cells. On day 2 cells were given fresh media and treated with 5µM S63845 or vehicular control and grown for 24hr. Metabolites were extracted, and 1H-NMR was collected in 100mM Na2HPO4 + 0.02% NaN3 + 500µM DSS in D2O. Metabolites were quantified in Chenomx. Metabolite concentrations were normalized to viable cell count.
 |
Disclaimer/Publisher’s Note: The statements, opinions and data contained in all publications are solely those of the individual author(s) and contributor(s) and not of MDPI and/or the editor(s). MDPI and/or the editor(s) disclaim responsibility for any injury to people or property resulting from any ideas, methods, instructions or products referred to in the content. |
© 2026 by the authors. Licensee MDPI, Basel, Switzerland. This article is an open access article distributed under the terms and conditions of the Creative Commons Attribution (CC BY) license.
Copyright: This open access article is published under a Creative Commons CC BY 4.0 license, which permit the free download, distribution, and reuse, provided that the author and preprint are cited in any reuse.


