Submitted:
02 April 2026
Posted:
03 April 2026
You are already at the latest version
Abstract
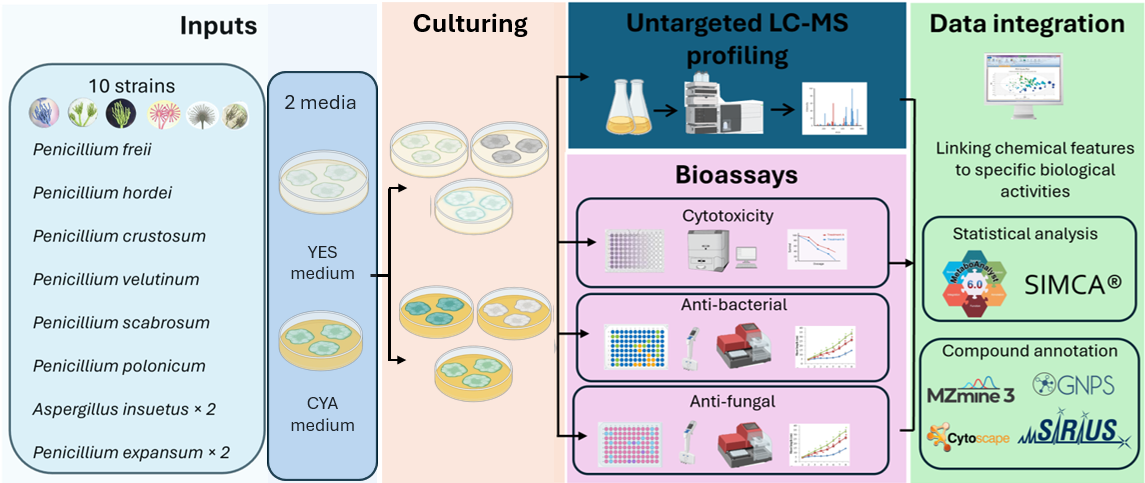
Fungi represent a prolific source of structurally diverse secondary metabolites, yet the extent to which culture conditions reshape the metabolic profile and functional bioactivity remains incompletely understood. In this exploratory study, ten fungal strains cultivated in Yeast Extract Sucrose (YES) and Czapek Yeast Autolysate (CYA) media were analysed using untargeted LC-HRMS metabolomics. This was then combined with multivariate statistical modelling to evaluate medium-dependent metabolic variation and its relation to cytotoxic, antibacterial and antifungal activities. Global metabolic profiling revealed moderate but statistically significant medium-associated metabolite variation, with discriminant metabolites predominantly enriched under CYA conditions. Putative structural annotation suggested patterns consistent with differential regulation of isoprenoid-derived sterols, terpenoids, alkaloid-like metabolites and aromatic polyketides. While antimicrobial activities displayed a heterogeneous, strain-dependent pattern with limited correlation to individual metabolites, cytotoxic activity co-varied with metabolite composition in OPLS regression modelling. Sterols and terpenoid-related features emerged as major contributors to cytotoxicity. Given the absence of biological replication and the limited sample size inherent to this pilot study, all findings should be considered hypothesis-generating and interpreted within an exploratory framework. These results suggest that nutrient composition influences biosynthetic pathway activation while functional outcomes remain strongly dependent on strain-specific metabolic capacity. This work provides a systematic framework and targeted hypothesis for future investigations into condition-dependent fungal chemical diversity in natural product discovery.
Keywords:
fungal secondary metabolism
; untargeted metabolomics
; OPLS regression
; metabolitebioactivity association
; cytotoxic activity
; molecular networking
1. Introduction
Fungi are among the richest sources of structurally diverse metabolites, many of which have led to clinically relevant compounds with antimicrobial, anticancer, and immunomodulatory effects. Despite the characterization of over 30,000 fungal secondary metabolites to date, genomic analyses consistently indicate that this number represents only a fraction of their true biosynthetic potential [1]. The majority of these biosynthetic gene clusters remain silent or poorly expressed under standard laboratory conditions, highlighting the importance of cultivation strategies to explore chemical diversity. Recent reports indicate the uncovering of chemo-diversity in fungal species is now increasing with trends showing 553 novel fungal metabolites reported in 2023 [2] to 907 metabolites in 2024 [3]. This included polyketides, terpenoids and alkaloids as dominant structural classes. However, studies show that even for well-studied Aspergillus and Penicillium genera, 80-90% of metabolites remain uncharacterized, and 84% of BGCs are understudied, suggesting that their metabolic capacity remains underexplored [1,2,4]. Importantly, the challenge is not only discovery of new metabolites, but also systematic identification of culture conditions that activate distinct pathways and integrating them into functional bioactivity [5].
Secondary metabolism in fungi is highly responsive to environmental and nutritional changes. In laboratory conditions, variations in medium composition, carbon and nitrogen sources and cultivation parameters can also strongly influence metabolite production. This concept underlies the ‘One Strain Many Compounds’- OSMAC approach, which exploits changes in culture conditions to induce a diverse chemical profile and might activate otherwise silent biosynthetic pathways from a single strain. Though medium variation alters metabolite abundance, the extent to which these changes translate to measurable bioactivity output remains poorly understood.
Untargeted high-resolution mass spectrometry (HRMS) based metabolomics provides a powerful approach to address this gap. By combining comprehensive feature detection, multivariate statistical modeling, and molecular networking, metabolomics enables systematic comparisons of fungal extracts across culture conditions. Utilising integrative statistical approaches like PCA, OPLS-DA and regression modelling allows discrimination of medium-dependent metabolic variation and facilitates the identification of metabolites associated with functional outcomes like cytotoxicity or antimicrobial activity.
In this exploratory study, untargeted LC-HRMS metabolomics and multivariate statistical analysis were applied to ten fungal extracts in two commonly used media, YES and CYA. As each strain-medium combination was cultivated as a single replicate, this study is exploratory in design, and all statistical analyses are intended to identify patterns and prioritise candidate metabolites for future hypothesis-driven work. Our objectives were to evaluate (i) the influence of culture medium and species identity on metabolic profile, (ii) identify discriminating metabolite families associated with medium-dependent variation, and (iii) investigate the relationship between metabolic composition and measured cytotoxic, antibacterial and antifungal activities. By integrating metabolomics-guided investigation, this work aims to provide a systematic framework for understanding how cultivation conditions, specifically different media, shape the fungal secondary metabolism and how these changes link to functional bioactivity in the context of natural product discovery.
2. Results and Discussion
2.1. Retention Time Distribution of Metabolic Features Between Culture Media
Fungal strains were grown on two common culture media: Yeast Extract Sucrose (YES) and Czapek Yeast Autolysate (CYA), to evaluate the influence of media composition on metabolic output. YES is a nutrient-rich medium containing readily available simple sugars and amino acids, whereas CYA provides a more complex carbon source and a defined nutrient balance. These contrasting nutrient environments are known to modulate secondary metabolism in fungal culture.
Untargeted LC-HRMS detected approximately 756 metabolic features across all extracts after removing signals present in medium control and quality control samples. To examine the distribution of chemical diversity across chromatographic space and to compare medium-dependent differences, detected features were grouped into 1-min retention time (RT) intervals. They were further classified as (i) unique to YES, (ii) unique to CYA or (iii) shared between both media. As shown in Figure 1, the retention time distribution of features varies markedly across two cultural media. CYA extracts consistently exhibited a higher number of unique features across most RT intervals, particularly within a 3-6 min elution window. This region typically corresponds to metabolites of intermediate polarity, suggesting broader induction of metabolic pathways under CYA cultivation. In contrast, YES extracts displayed features across full chromatographic range but at a lower counts per interval compared to CYA. Features detected in both media were present throughout the retention time range, indicating a shared core metabolome, though there were fewer than the CYA-specific features across the start to mid-late retention interval (0-7 min).
Notably, CYA-specific features extended into mid-late retention time regions, suggesting the presence of less polar or structurally complex metabolites as in reverse phase chromatography. These patterns may reflect the enhanced production of media-responsive secondary metabolites under CYA cultivation. While YES-specific features were represented relatively early to mid retention time interval associated with polar metabolites. Although retention time alone does not confirm compound polarity, these trends suggest differential regulation of metabolite classes in response to nutrient composition. Overall, the RT analysis suggests that culture medium not only influences the number of features but also their chromatographic distribution, indicating shifts in the chemical profile of fungal metabolome.
2.2. Multivariate Analysis of Metabolic Profile
Unsupervised principal component analysis (PCA) was performed on a normalised LC-MS dataset to assess global metabolomic variation among fungal extracts in two culture conditions (YES vs CYA). The first two principal components explained 12.5% (PC1) and 9.9% (PC2) of total variance, capturing ~22.4% of overall metabolic variation (Figure 2).
Partial separation between YES and CYA extracts was observed along PC1, indicating medium-associated differences in the global metabolite profile. This variation was statistically supported by permutation multivariate analysis of variance (PERMANOVA), which revealed a significant medium effect (F=4.35, R2 = 0.07, p=0.017). However, a relatively low R2 value indicates the culture medium accounts for a quite small proportion (~7%) of total metabolic variance. Such a pattern is common in untargeted LC-MS datasets, where hundreds of features contribute to high-dimensional variation distributed across multiple principal components [6,7]. For example, in Penicillium roqueforti populations, the first two principal components accounted for only ~33% of total variance, with substantial variation distributed across later components [8]. In the complex fungal metabolome, variance often reflects the overlapping influence of medium composition, as also observed in this study, along with strain-level biosynthetic capacity and shared core metabolic pathways rather than a single dominant driver [9,10,11].
Species identity did not form clearly distinct clusters within the PCA space. Extracts belonging to the same species did not consistently group, suggesting taxonomic identity was not the primary driver of principal axes variation captured by PC1 and PC2, either medium accounted for 7% of metabolic variance. The remaining variance likely reflects overlapping contribution of shared fungal core metabolome and strain-level biosynthetic differences. Overall, samples were interspersed, indicating substantial shared chemical space across taxa. However, certain strains displayed more distant positioning in the score plot, like Penicillium expansum (RD31, RD38) and Penicillium scabrosum (RD39) grown on CYA, appeared separated from the centre cluster. These deviations likely reflect a strain-specific metabolic profile or a differential response to medium conditions rather than analytical outliers. Similar observations have been reported in fungal metabolomics studies where individual strains exhibit different metabolic profiles within an overall medium influence framework [12]. In a study of 23 actinomycete isolates, six PCA outliers were identified with a unique metabolic profile, which further yielded previously unreported compounds, supporting the view that positional deviation is genuine metabolic distinctness rather than an analytical artefact [13]. Overall, the multivariate analysis indicates that culture medium exerts a statistically detectable but moderate influence on the fungal metabolome studied here. Substantial variation arises from intrinsic biological differences and shared metabolite production across strains.
Supervised multivariate methods (PLS-DA/OPLS-DA) were explored to enhance seperation but these models did not yield robust predictive performance, consistent with the moderate overlap observed in PCA scores and the limited sample size. This outcome aligns with previous reports demonstrating medium effects as detectable but not overwhelmingly strong relative to strain-specific metabolic variability. For example, studies on Fusarium verticillioides have demonstrated that different media selectively favour the production of particular mycotoxin profiles, without achieving complete separation of the overall metabolome [14]. These observations support the interpretation that medium effects are often pathway or compound-specific rather than uniformly altering the global metabolomic profile. Accordingly, the supervised models described in the following sections are used for variable selection and pattern exploration rather than as confirmatory classifiers.
2.3. Media Discriminant Metabolites
To identify specific metabolites contributing to medium-associated differences, an orthogonal partial least squares discriminant analysis (OPLS-DA) model was constructed with medium as the class variable. Although the overall predictive performance of the model was moderate, the OPLS-DA framework remained useful for identifying variables contributing to medium-associated variation, particularly when combined with univariate statistical filtering. Features contributing to class separation were selected based on variable importance in projection (VIP) threshold of more than 1.0.
Model robustness was confirmed by permutation testing (100 permutations; R2 intercept = 0.245 and Q2 intercept =-0.612) and cross-validation ANOVA (CV-ANOVA; F=91.24 and p <0.05), indicating statistically significant class discrimination and absence of model overfitting (Figure 3). It is noted that the R2 intercept of 0.245, while acceptable, reflects residual structure in the permuted data, likely due to the small sample size rather than genuine overfitting, and is interpreted cautiously. To further refine the discriminant variables and incorporate univariate statistical validation, a volcano plot was generated using a p-value threshold of <0.05 and a fold change (FC)≥1.5. Combining both multivariate (VIP) and univariate criteria identified 26 features that were significantly altered between media.
Volcano plot analysis revealed striking asymmetry in feature distribution, with the majority of significant altered features enriched in the CYA medium compared to the YES medium, as shown in Figure 4. Only a limited subset of features was upregulated in YES medium. Hierarchical clustering of selected features demonstrated clear separation of samples according to culture medium, with tight clustering of replicate samples, supporting analytical reproducibility (Figure 5). Notably, most discriminant features exhibited higher relative abundance in CYA extracts, consistent with the OPLS-DA model.
2.3.1. Putative Structural Annotations of Discriminant Metabolites
The 26 discriminant features were subjected to putative structural annotations using GNPS molecular networking and SIRIUS with CSI:FingerID in-silico prediction. Annotations allowed classification into major biosynthetic families (Table S1). Putatively annotated features included structure consistent with Roquefortine C, a griseofulvin-related metabolite, Fiscalin E analogue, and Tryhistatin-like compounds.
Several of these alkaloid-derived metabolites have been previously reported to exhibit antimicrobial activity, cytotoxic and neuroactive properties in fungal cultures. For example, Fiscaline E derivatives have demonstrated cytotoxic and antimicrobial activities [15,16,17] while Roquefortine C is a well-characterised indole alkaloid with reported cytotoxic and neurotoxic properties [18,19,20]. Although structural annotations are putative in the present study at confidence Level 2-3 based on spectral similarity and in-silico fragmentation pattern and require further confirmation. All annotation levels follow Schymanski et al. [21]. Also, the literature review presented here cannot be directly attributed to these features without further validation. Their enrichment within medium-specific subnetworks suggests possible activation of biosynthetic pathways associated with nitrogen-containing secondary metabolites during CYA cultivation and represents a hypothesis for targeted follow-up investigation.
2.3.2. Chemical Class Distribution of Discriminant Metabolites
Classification of discriminant metabolites revealed that isoprenoid-derived compounds represented the largest proportion of altered features, followed by fatty acid-derived lipids and nitrogen-containing secondary metabolites (Figure 6). The enrichment of sterol and lipid related metabolites in CYA extracts suggests that this medium preferentially promotes pathways associated with membrane-associated secondary metabolism and terpenoid biosynthesis. Such pathway regulation is consistent with known nutrient-dependent control of fungal secondary metabolism, in which carbon and nitrogen availability modulate biosynthetic gene cluster expression through global regulatory networks [22,23].
2.3.3. Molecular Networking
The overall metabolic profile of 10 fungal extracts was organised into a GNPS molecular network, revealing diverse structural metabolite families (Figure 7). Major clusters correspond to terpenoid-related metabolites, alkaloid-like compounds, coumarin-type compounds, glycerophospholipids, and benzenoid derivatives. The feature annotation analyses were supported by SIRIUS and GNPS-based structural analysis, with all assignments representing putative identifications at confidence level 2-3.
A prominent CYA enriched cluster comprised nitrogen containing secondary metabolites, including features putatively consistent with Fiscalin E or analogues, Roquefortine C or related compounds and Tryhistatin like structures. Several coumarin-like and benzenoid metabolites also displayed CYA enrichment, suggesting coordinated activation of aromatic and alkaloid biosynthetic pathway under CYA cultivation.
In the YES-enriched cluster, along with terpenoid and lipid families, a cluster representing aromatic polyketide-related metabolites was observed. These metabolites are putatively identified as phloroglucinol-type scaffolds with neighbouring phenylpropanoid-like structures (coumarins/chromones). The antifungal metabolite griseofulvin [24] and its related analogue formed a small cluster with relatively comparable abundance in both media.
Collectively, these findings indicate that nutrient composition influences coordinated biosynthetic pathways rather than affecting individual metabolites. The structural clustering observed in molecular networking supports class-level distribution derived from in-silico annotation. This also reinforces that medium composition reshapes the global fungal metabolome in a pathway-specific manner.
2.4. Association Between Metabolic Profiles and Bioactivity
2.4.1. Bioactivity Pattern Across Media
Cytotoxic, antibacterial and antifungal activity were evaluated across all the fungal extracts to determine whether medium induced metabolic shifts correspond to measurable differences in functional bioactivity. Because antibacterial and antifungal assays involved multiple test organisms, Z-score normalisation was applied to these datasets to enable standardised comparison across strains (Table S2).
Hierarchical clustering of bioactivity profiles shown in Figure 8 revealed that activity patterns were predominantly strain-dependent rather than strictly medium-dependent. While cultivation medium influenced the intensity of response, species-specific inclination was more distinct.
Elevated cytotoxicity (Z >1) was observed in both YES and CYA derived extracts, indicating cytotoxic potential was not completely associated with one medium. P. expansum strains from two distinct ecological origins (RD28/RD31 and RD35/RD38) exhibited comparable activity in both media, suggesting an intrinsic cytotoxic potential of the strain independent of culture media. Similarly, one A. insuetus strain pair (RD27/RD30) demonstrated activity under both media conditions. In contrast, the second A. insuetus pair (RD34/RD37) showed activity in only YES medium, despite duplicate experimental validation, indicating a genuine medium-strain interaction rather than technical variability.
These observations indicate that cytotoxic potential reflects strain specific metabolic response to nutrient conditions and not a uniform media-driven effect, though this hypothesis requires confirmation in replicated studies.
Antifungal responses showed clear enhancement under YES conditions among strains exhibiting measurable activity. Notably, P. expansum strains (RD28/ RD 35) cultivated on YES medium showed higher antifungal activity compared to their CYA counterparts (RD31/ RD38). A similar pattern was observed for A. insuetus strains, where YES-derived extracts (RD27/ RD34) displayed antifungal activity whereas CYA extracts (RD30/RD37) showed minimal to no activity. Although P. velutinum cultivated on CYA medium (RD24) exhibited moderate antifungal activity, the overall profile favoured YES medium for induction of antifungal metabolites in responsive species. These findings tentatively suggest that YES medium may preferentially stimulate biosynthetic pathways associated with antifungal secondary metabolites in selected strains. One possible explanation is that yeast-derived components present in YES extract including cell wall constituents such as β-glucans and mannoproteins may act as biological signals triggering a competitive antifungal response in the producing strains, analogues to interspecies chemical signaling mechanisms documented in fungal co-culture systems [25,26]. This hypothesis remains speculative in present study and required direct experimental testing, for example through fractionation of yeast extract components or co-culture experimental designs.
In contrast, antibacterial activity was more heterogeneous and did not exhibit a consistent medium-associated pattern. Elevated antibacterial responses were observed in both YES and CYA extracts, depending on species. For A. insuetus, moderate activity was detected in both YES and CYA extracts, depending on ecological origin, indicating strain-level variability. Notably, P. hordei cultivated in CYA medium (RD11) displayed strong antibacterial activity, while its YES culture (RD8) showed no activity. Similarly, P. freii (RD12/RD9) demonstrated moderate activity with variation between media. This again suggests that antibacterial effects are likely governed by strain-specific biosynthetic capacity rather than a uniform nutrient-driven condition.
Overall, bioactivity clustering did not strictly follow medium identity alone but reflected an interaction between culture medium and species-specific metabolic potential. While medium clearly influenced the metabolic production as demonstrated in earlier multivariate analyses, the direction and intensity of its functional effects varied across strains. Interestingly, P. expansum and A. insuetus emerged as consistent bioactive species across multiple assays, suggesting a robust secondary metabolite reservoir capable of responding to environmental nutrient stimuli. These findings align with the established model of fungal metabolism, in which the nutrient environment shapes the secondary metabolism by acting as a regulatory trigger, influencing the activation and expression of biosynthetic pathways. However, the specific profile and abundance of bioactive compounds produced, which determine its phenotypic bioactivity, depend on the strain’s intrinsic genetic and biosynthetic potential [27]. Such medium-strain interactions are well documented in fungal metabolomics, where nutrient composition modulates the secondary metabolite gene cluster activation while species identity determines the available biosynthetic repertoire [22,28,29]. Thus, bioactivity outcome in this dataset appears to reflect medium-influenced expression of strain-specific biosynthetic pathways rather than uniform induction of bioactive compounds across all strains, a hypothesis that requires validation through follow-up studies with biological replication.
2.4.2. Relation Between Medium Discriminant Features and Bioactivity
Hierarchical clustering was performed using 26 selected features, restricted to strains exhibiting measurable cytotoxic or antimicrobial activity (Figure 9). This allowed evaluation of discriminant metabolites co-localising with bioactive phenotypes across strains.
To determine whether the metabolites discriminating YES and CYA media extracts were linked to measured bioactivity, Spearman correlation analysis was performed between the 26 identified discriminant features and the measured cytotoxic, antibacterial, and antifungal responses. Although most discriminant features were enriched in CYA media, the bioactivity profile did not uniformly favour CYA extracts. Therefore, correlation analysis was conducted without assuming directional media dependence.
Overall, correlation coefficients between identified metabolites and antibacterial and antifungal activity were predominantly weak (Figure 10). No single metabolite demonstrated a strong, consistent positive association across antimicrobial activity. These findings suggest that antimicrobial bioactivity in this dataset is unlikely to be driven by single or few dominant metabolites but may reflect synergistic effects among multiple metabolites, phenomena usually observed in fungal secondary metabolism. For instance, studies on the entomopathogenic fungus Metarhizium robertsii have demonstrated that collective production of multiple classes of secondary metabolites enables the fungus to combat different bacteria more effectively than the metabolites produced by individual biosynthetic gene clusters alone, operating through additive and synergistic mechanisms [30].
For antifungal activity, feature F_411.325183 (putatively annotated as C28 oxidized sterol derivative, such as ergosterol peroxide) displayed significance (p=0.04); though this should be interpreted cautiously given the absence of FDR correction across multiple comparisons. However, the absence of strong correlation coefficients means the antifungal activity cannot be linearly predictable from individual feature abundance alone. This aligns with the understanding that antifungal activity arises from multiple metabolite interactions rather than isolated compounds.
A significant negative correlation was observed between F_411.325183 (oxidized sterol-like feature) and F_375.3042615 (putatively annotated as polyunsaturated terpenoid/carotenoid related hydrocarbon). Both metabolite classes originate from same cellular isoprenoid pathway [31]. In fungi, this pathway branches towards sterol biosynthesis and carotenoid/terpenoid production via phytoene synthase dependent route [32]. This inverse production pattern is consistent with differential regulation or competition for precursors across the isoprenoid branch under the tested conditions. Carotenoids function as antioxidants involved in quenching of reactive oxygen species (ROS) [31,32], whereas sterols are structural membrane components susceptible to oxidative modification. Oxidised sterol products have been linked to stress-responsive cellular and membrane remodeling processes [33,34]. Thus, the observed negative correlation may reflect pathway-level regulatory balancing under the tested cultivation conditions. However, it is important to note that oxidized sterol can also be produced through non-enzymatic oxidation during cultivation, extraction, or storage. Therefore, the observed relationship should be interpreted cautiously as an exploratory indication of possible branch regulation rather than definitive metabolic flux diversion.
Although Spearman correlation did not identify significant features across bioactivity endpoints, a limited number of features exhibited a trend towards association with cytotoxic activity. Feature F_717.5214 (putatively classified as a glycerophospholipid-related metabolite) and F_518.2397 (putatively annotated as Fiscalin E analogue) displayed marginal uncorrected p-value (p=0.06) (Figure S1). While these values do not meet conventional statistical standards (p<0.05), the known biological activity of fiscalin-type alkaloids in prior studies as neuroprotective [35,36] and cytotoxic properties [16,37,38], supports the probability of this candidate association. Nonetheless, given the exploratory nature of this analysis and limited sample size, findings need to be interpreted cautiously.
Importantly, no feature demonstrated consistent associations across multiple bioactivity assays. This suggests that while medium-dependent metabolites contribute to functional variation, bioactivity cannot be associated with a single feature in a simple linear manner. Instead, the data support a model in which nutrient-induced pathway regulation reshapes the metabolite profile. Also, bioactivity outcomes reflect strain-specific metabolome together with coordinated secondary metabolite expression.
2.4.3. OPLS Regression Modeling for Cytotoxic Activity
To determine whether cytotoxic activity could be quantitatively explored in relation to metabolite variation across extracts, an OPLS regression model was built with cytotoxic activity as the Y variable and full LC-MS feature matrix as the X variable. Given the exploratory design of this study, this model was employed as a variable prioritisation tool rather than a predictive instrument.
The OPLS model demonstrated high explanatory power (R2= 0.983) relative to Q2 (0.0591) indicating the model explains the majority of the variance within the dataset while its predictability is limited. This discrepancy could be attributed to fitting high-dimensional metabolomics data (756 features) against a small sample size (n= 20), where model captures structured biological variance but lacks sufficient observations for robust cross-validation. Permutation testing (100 permutations) and CV-ANOVA (p < 0.05) supported that model captures genuine structured variance within this dataset (Figure 11). This pattern is frequently observed in metabolomics studies with small sample sizes and high-dimensional feature matrix, where models can capture structured variance within the dataset but exhibit modest cross-validated performance [39,40]. Therefore, the regression model was interpreted mainly as a tool for variable prioritisation tool rather than as a predictive model for cytotoxic activity, an approach common with standard practice in metabolomics where PLS models are frequently employed to identify relevant features rather than for external prediction [41]. These results suggested cytotoxic activity to be media-associated under the studied conditions, although predictive robustness remains to be confirmed in larger replicated studies.
Identification of cytotoxicity -associated features
Variable Importance in Projection (VIP) scores were used to identify features contributing most strongly to the regression model. Using a conservative threshold of VIP ≥1.7, sixteen features were selected as primary contributors to cytotoxic activity (Table S3).
A bar plot of top VIP features (Figure 12) classified these metabolites into major biosynthetic classes. Annotation of top 15 contributors (Table S3) revealed isoprenoid-derived sterols and terpenoids represented dominant chemical class followed by polyketide derived aromatic metabolites. Multiple VIP features corresponded to sterol derivatives, including oxidised sterol-like structure, prenol-lipid derivatives, and sesquiterpenoid-type metabolites.
The predominance of sterol and terpenoid derivates suggests that activation of isoprenoid metabolism may underlie the observed cytotoxic phenotype. Sterols and polycyclic terpenoids are among the most bioactive reported classes of natural products in fungi [42,43]. Their lipophilicity and membrane affinity properties allow integration into mitochondrial membrane, where they can disrupt membrane potential, promote cytochrome release and trigger intrinsic cell apoptosis [44,45,46]. In addition to membrane disrupters, several sterols and terpenoids are also known modulators of oxidative stress. Their interaction with mitochondrial electron transport components may increase ROS production, amplifying oxidative damage and induce apoptosis [47,48]. Oxidised sterol derivates like ergosterol peroxide-like compounds have been associated with ROS-mediated cytotoxic effect in tumour models [49,50]. The structural features observed among the annotated VIP features including oxidized sterol cores, conjugated system and hydrophobic side chains are consistent with pharmacophores commonly reported in cytotoxic natural product [5]. Importantly, no primary metabolites were identified among the top VIP contributors, reinforcing that cytotoxicity in this study is driven by specialised secondary metabolism rather than central metabolism. While direct mechanistic validation was beyond the scope of present study, the chemical classes identified align with established cytotoxic mechanism reported for fungal derived sterols and terpenoids. These findings represent targeted hypotheses for future bioassay-guided investigation.
Comparable regression models were constructed for antibacterial and antifungal activity but did not achieve acceptable validation criteria. This contrast suggests that cytotoxic activity exhibits a more rational quantitative relationship with metabolite composition within this dataset, whereas antimicrobial responses may arise from more heterogeneous or synergistic metabolic interactions. Altogether, these findings indicate that while medium alone does not uniformly influence bioactivity patterns, the cytotoxicity activity in particular is associated with quantitative shifts in isoprenoid-related secondary metabolites in this exploratory study. Nutrient-dependent modulation of sterol and terpenoids may therefore represent a key biochemical factor underlying the observed cytotoxic responses.
2.5. Limitations of the Study
This study has some limitations that should be considered when interpreting the results. Due to the origin of the provided extracts, biological replicates were unavailable, limiting the assessment of intra-strain variability and potentially affecting the robustness of the multivariate model. As a result, this study is explicitly exploratory in design, and all conclusions should be regarded as hypothesis-generating rather than definitive. Although OPLS regression demonstrated high explanatory capacity for cytotoxicity, predictive performance was modest, reflecting the challenges of modeling high-dimensional metabolomics data with relatively small sample sizes. The substantial R2/Q2 gap reflects the underdetermined nature of dataset (756 features against 20 observations) and should be interpreted as evidence of biological signal, and the model was used exclusively for variable prioritisation. Metabolite annotations were based on spectral similarity and in silico prediction (Level 2/3 confidence) and therefore require further structural confirmation. Finally, bioactivity-metabolite relationships were inferred from statistical associations rather than direct functional validation. Future studies will include biological replication, targeted quantification, and mechanistic assays to confirm relationships and refine understanding of nutrient-dependent metabolic regulation in fungi.
3. Materials and Methods
3.1. Fungal Strains and Culture Conditions
Fungal strains used in this study were obtained from IBT culture collection, Department of Biotechnology and Biomedicine, Technical University of Denmark (IBT Culture Collection). The strains included multiple isolates of Penicillium and Aspergillus spp. from distinct ecological origins. Detailed strain identifiers and isolation sources are provided in the Table 1.
The isolates were cultivated and extracted prior to this study. Extraction was performed according to the protocol described below.
The strains were cultivated on 50 mm Petri Dishes on two media, CYA (yeast extract 5.0 g, Czapek dox broth 35.0 g, agar 20.0 g, MilliQ water 885 mL) and YES (yeast extract 20.0 g, sucrose 150.0 g, MgSO4.7H2O, agar 20.0 g, MilliQ water 885 mL). They were incubated for ten days at 25 °C. Then, the fungus and agar were cut into pieces (approx. 5 x 5 mm) and transferred to 50 mL Falcon tubes. 10 mL of ethyl acetate-isopropanol (3:1) containing 1% formic acid was added to the Falcon tubes, which were then placed in an ultrasonic bath for 60 min. The extracts were transferred to 15 mL Falcon tubes and were centrifuged (at 45000 x g and 4 °C for 15 min) to precipitate the spores and separate the water (residual water from the agar) in a different phase. The organic supernatant was transferred to 8 mL vials, where the extracts were dried under nitrogen flow at room temperature.
Note: Each sample was cultivated only once due to limited material availability. Thus, this study is exploratory in nature and focuses on comparative metabolomic and bioactivity patterns rather than inferential statistical testing.
3.2. LC-MS Acquisition and Sample Preparation
Untargeted metabolomic profiling was performed using high-performance liquid chromatography coupled with high-resolution mass spectrometry (HPLC-HRMS). A Bruker Maxis II® electrospray ionisation quadrupole time-of-flight (ESI Q-TOF) instrument coupled with Agilent 1290 Quat pump reverse phase HPLC system was used for metabolomic profiling. 10µL of sample were injected into HPLC system with flow rate 1mL/min through Agilent C18 2.7 µm 2.1 × 100 mm column. Capillary voltage of 4.5kV, nebuliser gas at 4.5 bar and dry temperature at 220˚C were maintained. The column was washed with blank (100% methanol) and standardised reserpine (C33H40N2O9) used as a calibration standard for the system.
All LC-MS samples were prepared using methanol and Milli-Q water depending on their solubility. Final concentrations of 0.3 mg/mL was used for crude fungal extracts.
3.3. Data Processing and Molecular Networking
Raw LC-MS data were converted to mzXML format using the Bruker software export option and processed using Mzmine v 4.8.30 [51] using the following paramters: Mass detection (RT autorange, centroid); Chromatogram builder (MS level 1; minimum absolute height 1.0 × 10³; m/z tolerance 10 ppm; minimun consecutive scans 4); Peak deconvolution (Local minimum feature resolver; chromatographic threshold 75%; peak duration 0.0-1.0 min); Isotopic peaks grouper (m/z tolerance 10 ppm; RT tolerance 0.02 min); Data alignment (Join aligner; m/z tolerance 5 ppm; RT tolerance 0.15 min); Gap filing (Same RT and m/z range gap filler; m/z tolerance 5 ppm). Feature tables containing m/z ratio, retention time and peak area were exported for multivariate analysis.
A molecular network was created with the Feature-Based Molecular Networking (FBMN) workflow [52] on GNPS (https://gnps.ucsd.edu,site accessed on 10 January 2026) [53]. The mass spectrometry data were first processed with MZMINE2 and the results were exported to GNPS for FBMN analysis. The data was filtered by removing all MS/MS fragment ions within +/- 17 Da of the precursor m/z. MS/MS spectra were window filtered by choosing only the top 6 fragment ions in the +/- 50 Da window throughout the spectrum. The precursor ion mass tolerance was set to 0.02 Da and the MS/MS fragment ion tolerance to 0.02 Da. A molecular network was then created where edges were filtered to have a cosine score above 0.7 and more than 6 matched peaks. Further, edges between two nodes were kept in the network if and only if each of the nodes appeared in each others respective top 10 most similar nodes. Finally, the maximum size of a molecular family was set to 100, and the lowest scoring edges were removed from molecular families until the molecular family size was below this threshold. The spectra in the network were then searched against GNPS spectral libraries [53,54]. The library spectra were filtered in the same manner as the input data. All matches kept between network spectra and library spectra were required to have a score above 0.7 and at least 6 matched peaks. The DEREPLICATOR was used to annotate MS/MS spectra [55]. The molecular networks were visualized using Cytoscape v3.10.4 software [56].
3.4. Feature Annotations
SIRIUS v 6.3.3 [57] was used for annotation of top features. The parameters for the SIRIUS computation were set as default. SIRIUS and ZODIAC [58] were used for molecular formula identification, in which a zodiac score >= 50% was considered. CSI: Finger ID [59] was used for fingerprint prediction and CANOPUS [60,61,62] for compound class prediction where only compound class prediction with probability >= 60% was considered. The databases were used for structure search in SIRIUS as follows: GNPS (https://gnps.ucsd.edu accessed on 10 January 2026), COCONUT [63], ChEMBL [64], Natural products [65,66] and PubChem [67].
3.5. Bioactivity Screening
3.5.1. Cytotoxic Activity
All the fungal extracts were tested by MTT method to evaluate their cytotoxicity against human hepatoma cell line (HepG2). ED50 (50% effective dose) values are summarised in Table S2. Human cancer cell lines were purchased from American Type Culture Collection (ATCC HB-8065). Extracts were assayed in duplicate as 10-point curves with 1/200 dilution starting at 20 μg/mL. HepG2 cells were seeded at 8000 cells/well in 384-well plates (Corning 3701) and incubated overnight at 37 °C and 5% CO2. Nanoliters of the corresponding concentrations of pure compounds were added by means of a Beckman Echo 550 [68] and cells were further incubated for 72 hours. MMS (methylmethanesulfonate, Sigma-Aldrich 129925), 2 mM, was used as positive control, and DMSO 0.5% was used as the negative control. Finally, MTT dye (thiazolyl blue tetrazolium bromide, ACROS Organics 158990050, 0.5 mg/mL) was added to each well, cells were incubated for 2–3 h, supernatant was removed, 20 μL of DMSO (100%) was added, and absorbance was measured at 570 nm. The results obtained were analyzed using Genedata Screener software (Genedata Inc., Basel, Switzerland).
3.5.2. Antibacterial Activity
Antibacterial activity was performed against Acinetobacter baumannii ATCC 19606, methicillin-resistant Staphylococcus aureus (MRSA MB5393), and Pseudomonas aeruginosa ATCC 5919. All assays were performed in duplicate.
Inoculum preparation: frozen bacterial stocks were streaked onto appropriate agar plates and incubated overnight at 37 °C to obtain isolated colonies. Single colonies were inoculated into liquid culture media and incubated overnight at 37 °C with shaking (220 rpm). For A. baumannii ATCC 19606 and P. aeruginosa ATCC 5919, cultures were prepared in Mueller-Hinton II (MH2) broth. For MRSA MB5393, cultures were prepared in Brain Heart Infusion (BHI) broth. Overnight cultures were diluted in fresh medium to obtain final inoculum concentrations of approximately 5-6 × 10⁵ CFU/mL for A. baumannii and P. aeruginosa, and approximately 1.1 × 10⁶ CFU/mL for MRSA.
Procedure: for each well of a sterile 96-well microtiter plate, 10 µL of fungal extract was dispensed, followed by 90 µL of standardised bacterial inoculum (final volume: 100 µL per well).
Antibiotic controls used were aztreonam for A. baumannii and P. aeruginosa and vancomycin for MRSA. Two-fold serial dilutions of control antibiotics were prepared to generate standard curves. Blank wells contained medium only, and growth controls contained inoculum with vehicle (DMSO) only.
Plates were centrifuged briefly (1 min, 1000 rpm) and absorbance was measured at 612 nm at time zero (T0) using a microplate spectrophotometer. Plates were incubated statically at 37 °C for approximately 20 h. After incubation, plates were gently shaken and absorbance was measured again (Tf).
Percentage growth inhibition was calculated as follows:
3.5.3. Antifungal Activity
Antifungal activity was assesed against Aspergillus fumigatus ATCC 46645, Candida albicans ATCC 64124 and Candida auris ATCC 13225. All assays were performed in duplicate.
Yeast assays (C. albicans and C. auris): frozen yeast stocks were streaked onto Sabouraud Dextrose Agar (SDA) plates and incubated at 35-37 °C for 24 h. Colonies were harvested and suspended in RPMI-1640 medium buffered with HEPES. Optical density at 660 nm was adjusted to approximately 0.25-0.28 and further diluted (1:100) to obtain the working inoculum.
For the assay, 10 µL of extract solution were dispensed into 96-well plates, followed by 90 µL of yeast inoculum (final volume 100 µL per well).
Amphotericin B was used as a positive control with two-fold serial dilutions. Plates were centrifuged briefly and read at 612 nm at T0. Plates were incubated statically at 37 °C for approximately 24-30 h. Final absorbance (Tf) was recorded, and percentage inhibition was calculated as described above.
Filamentous fungus assay (A. fumigatus): A. fumigatus was cultured on Potato Dextrose Agar (PDA). Conidia were harvested and suspended in RPMI-1640 medium. The inoculum concentration was adjusted to approximately 2.5 × 10⁴ CFU/mL. For the assay, 10 µL of extract and 90 µL of conidial suspension were dispensed per well. Plates were incubated statically at 37 °C for 30 h.
Resazurin (final concentration 0.002%) was used as a metabolic viability indicator. Fluorescence was measured using excitation at 570 nm and emission at 600 nm. Growth inhibition was calculated relative to controls.
All the fungal extracts prepared at a concentration of 6.25 mg/mL and dissolved in 100% DMSO were used for bioactivity screening.
3.6. Multivariate and Predictive Modeling
Multivariate analysis were performed in Simca v 14.0 (Umetrics, Umeå, Sweden). Principal Component Analysis (PCA), Orthogonal Partial Least Squares - discriminant analysis (OPLS-DA), OPLS/PLS regression were used to explore metabolome patterns. To reduce the analytical variablity, data was normalized in SIMCA 14.0, log10 transformation and Pareto scaling was applied prior to statistical analysis. Model quality was evaluated using R2 (explained variance) and Q2 (predictive ability) values, and cross-validated using permutation testing with 100 iterations, in addition to running Cross Validation ANOVA (CV-ANOVA). Heatmaps, volcano plots and corelation plots were produced using Metaboanalyst 6.0 [69].
4. Conclusions
This study demonstrates that culture medium influences the fungal metabolome at a pathway level of ten fungal strains studied here, while bioactivity outcome remains strongly strain dependent. These findings are presented as hypothesis-generating observations arising from a pilot dataset lacking biological replication and should be interpreted within that explicit exploratory framework. Untargeted LC-HRMS metabolomics revealed medium-specific shifts in metabolite families, particularly within isoprenoid-derived sterols, terpenoids and nitrogen-containing secondary metabolites. Although multivariate separation between YES and CYA extracts was moderate, discriminant analysis identified metabolite clusters selectively enriched in CYA nutrient conditions. Importantly, cytotoxic activity co-varied with metabolite composition, with sterol and terpenoid-related features emerging as major contributors in regression modelling. These findings are consistent with established mechanisms linking membrane-active and redox-modulating secondary metabolites to cytotoxic effects. In contrast, antibacterial and antifungal activities displayed weaker associations with individual metabolites, supporting that antimicrobial activity likely arises from strain-specific metabolite combinations. The hypothesis generating observations requiring future validation includes YES-associated induction of antifungal metabolites, a putative contribution of fiscalin-type alkaloids and oxidised sterols to cytotoxicity, competitive isoprenoid branch regulation, and synergistic origins of antimicrobial activity. Future transcriptomic profiling of these strains under YES and CYA conditions would enable direct investigation of BGCs underlying observed metabolic shifts, particularly the differentially regulated isoprenoid and nitrogen-containing metabolite pathways identified here. Collectively, this work highlights the role of nutrient-driven metabolic regulation and intrinsic biosynthetic capacity in shaping functional outcomes in fungal metabolism. By integrating cultivation strategies with statistical modelling, this study provides a systematic framework and a set of targeted hypotheses for future investigations in condition-dependent fungal chemical diversity and its implications for fungal natural product discovery.
Supplementary Materials
The following supporting information can be downloaded at the website of this paper posted on Preprints.org, Figure S1: Spearman rank corelation p-value matrix between media-discriminant metabolite features and measured bioactivity endpoints.; Table S1: Putative structural annotations of top media-discriminant metabolic features identified by OPLS-DA, volcano plot filtering (p < 0.05 raw, FC ≥ 1.5), and SIRIUS/GNPS-based in silico annotation.; Table S2: Z-score normalised bioactivity profile of fungal extracts across cytotoxic, antibacterial and antifungal activities; Table S3: Top variable importance in projection (VIP) features from OPLS regression modelling of cytotoxic activity (VIP ≥ 1.70), with putative structural annotations.
Author Contributions
Conceptualization, R.D. and G.P.; methodology, R.D., A.R., P.S., and T.M.; software, G.P.; validation, R.D. and R.V.A.; formal analysis, R.D.; investigation, R.D.; resources, A.R. and T.L, M.J.; data curation, R.D.; writing—original draft preparation, R.D.; writing—review and editing, R.D., G.P., R.V.A., P.S., T.M., R.E., and M.J.; visualization, R.D.; supervision, R.E and M.J.; project administration, R.E and M.J.; funding acquisition, R.E and M.J. All authors have read and agreed to the published version of the manuscript.
Funding
We acknowledge the support of United Kingdom Research and Innovation (UKRI) and the Horizon Europe Guarantee Fund for the HOTBIO project, a Marie Skłodowska-Curie Action Doctoral Network and the support UKRI Biotechnology and Biological Sciences Research Council BBSRC ALERT-22 Grant BB/X019802/1.
Institutional Review Board Statement
Not applicable.
Informed Consent Statement
Not applicable.
Data Availability Statement
The data that supports the findings of this study are available from the corresponding author, MJ, upon reasonable request.
Acknowledgments
We gratefully acknowledge Russell Gray from the Marine Biodiscovery Centre for his continued support and Hanan Al-Adilah from Environment and Life Sciences Research Centre, Kuwait Institute for Scientific Research, Kuwait; for her assistance. We are especially grateful to Georgia Karyofyllidou (MEDINA) for her continuous support, motivation, and invaluable help throughout this work.
Conflicts of Interest
The authors declare no conflicts of interest.
Abbreviations
The following abbreviations are used in this manuscript:
| MDPI | Multidisciplinary Digital Publishing Institute |
| DOAJ | Directory of open access journals |
| TLA | Three letter acronym |
| LD | Linear dichroism |
References
- Riedling OL, Rokas A.2025.mGem: How many fungal secondary metabolites are produced by filamentous fungi? Conservatively, at least 1.4 million. mBio16:e01381-25. [CrossRef]
- Shi Y, Ji M, Dong J, Shi D, Wang Y, Liu L, Feng S, Liu L. New bioactive secondary metabolites from fungi: 2023. Mycology. 2024 Jun 11;15(3):283-321. PMID: 39247896; PMCID: PMC11376311. [CrossRef]
- Bao, M., Shi, Y., Gong, X., Guo, Y., Wang, J., Chen, X., & Liu, L. (2025). New bioactive secondary metabolites from fungi: 2024. Mycology, 16(3), 961–987. [CrossRef]
- Wang C, Wang C, Liu Y, Yue Y, Lu X, Wang H, Ying Y, Chen J.2024.Targeted discovery of polyketides with antioxidant activity through integrated omics and cocultivation strategies. Appl Environ Microbiol90:e01603-24. [CrossRef]
- Newman, D. J., & Cragg, G. M. (2020). Natural Products as Sources of New Drugs over the Nearly Four Decades from 01/1981 to 09/2019. Journal of Natural Products, 83(3), 770–803. [CrossRef]
- Eva Gorrochategui, Joaquim Jaumot, Sílvia Lacorte, Romà Tauler, Data analysis strategies for targeted and untargeted LC-MS metabolomic studies: Overview and workflow, TrAC Trend in Analytical Chemistry, Volume 82, 2016, pages 425-442, ISSN 0165-9936.
- Marion Brandolini-Bunlon, Benoit Jaillais, Mohamed Hanafi. PLSDA versus PCA on barycenters, applied to metabolomics in a context of discrimination. Chimiométrie XXIV, Société Française de Statistiques - Groupe Chimiométrie, Feb 2024, Nantes, France. ⟨hal-04485970⟩.
- Crequer, E., Coton, E., Cueff, G. et al. Different metabolite profiles across Penicillium roqueforti populations associated with ecological niche specialisation and domestication. IMA Fungus 15, 38 (2024). [CrossRef]
- Worley B, Powers R. Multivariate Analysis in Metabolomics. Curr Metabolomics. 2013;1(1):92-107. PMID: 26078916; PMCID: PMC4465187. [CrossRef]
- de Jesus VET, Alvarenga Y, Boffo EF, Geris R. Mycobolome of Phialomyces Macrosporus Across OSMAC-Based Assorted Culture Media. Chem Biodivers. 2024 Nov;21(11):e202401547. Epub 2024 Sep 18. PMID: 39136586. [CrossRef]
- Emile Gluck-Thaler, Sajeet Haridas, Manfred Binder, Igor V Grigoriev, Pedro W Crous, Joseph W Spatafora, Kathryn Bushley, Jason C Slot, The Architecture of Metabolism Maximizes Biosynthetic Diversity in the Largest Class of Fungi, Molecular Biology and Evolution, Volume 37, Issue 10, October 2020, Pages 2838–2856. [CrossRef]
- Crits-Christoph, A., Robinson, C.K., Barnum, T. et al. Colonization patterns of soil microbial communities in the Atacama Desert. Microbiome 1, 28 (2013). [CrossRef]
- Lu, Q.-P., Huang, Y.-M., Liu, S.-W., Wu, G., Yang, Q., Liu, L.-F., Zhang, H.-T., Qi, Y., Wang, T., Jiang, Z.-K., Li, J.-J., Cai, H., Liu, X.-J., Luo, H., & Sun, C.-H. (2021). Metabolomics Tools Assisting Classic Screening Methods in Discovering New Antibiotics from Mangrove Actinomycetia in Leizhou Peninsula. Marine Drugs, 19(12), 688. [CrossRef]
- Groppi, E., Haddad, M., Cristofoli, V., Vansteelandt, M., & Gadea, A. (2025). Unveiling the Substrate-Dependent Dynamics of Mycotoxin Production in Fusarium verticillioides Using an OSMAC-Metabolomics Approach. Chemistry & Biodiversity, 22(1). [CrossRef]
- I. Costa, D.J. Barbosa, M.E. Sousa, R. Silva, P31-29 Neuroprotective Potential of Fiscalin Derivatives: Targeting β-Amyloid Aggregation, Iron Toxicity, and Acetylcholinesterase in Alzheimer’s Disease, Toxicology Letters, Volume 411, Supplement, 2025, Pages S421-S422, ISSN 0378-4274. [CrossRef]
- Wang, S., Huang, Y., Wang, S., Gong, H., He, Q., Zhang, D., … Song, Y. (2025). Fiscalin B exerts an anticancer effect through mitochondria-modulated apoptosis and cell cycle arrest in human hepatocellular carcinoma. Natural Product Research, 1–8. [CrossRef]
- Bessa LJ, Buttachon S, Dethoup T, Martins R, Vasconcelos V, Kijjoa A, Martins da Costa P. Neofiscalin A and fiscalin C are potential novel indole alkaloid alternatives for the treatment of multidrug-resistant Gram-positive bacterial infections. FEMS Microbiol Lett. 2016 Aug;363(15):fnw150. Epub 2016 Jun 5. PMID: 27268269. [CrossRef]
- Rasmussen RR, Rasmussen PH, Larsen TO, Bladt TT, Binderup ML. In vitro cytotoxicity of fungi spoiling maize silage. Food Chem Toxicol. 2011 Jan;49(1):31-44. Epub 2010 Sep 15. PMID: 20837087. [CrossRef]
- Scott, P.M., Merrien, MA. & Polonsky, J. Roquefortine and isofumigaclavine A, metabolites fromPenicillium roqueforti. Experientia 32, 140–142 (1976). [CrossRef]
- Wagener RE, Davis ND, Diener UL.1980.Penitrem A and Roquefortine Production by Penicillium commune. Appl Environ Microbiol39. [CrossRef]
- Schymanski, E. L., Jeon, J., Gulde, R., Fenner, K., Ruff, M., Singer, H. P., & Hollender, J. (2014). Identifying Small Molecules via High Resolution Mass Spectrometry: Communicating Confidence. Environmental Science & Technology, 48(4), 2097–2098. [CrossRef]
- Brakhage, A. Regulation of fungal secondary metabolism. Nat Rev Microbiol 11, 21–32 (2013). [CrossRef]
- Bode, H. B., Bethe, B., Höfs, R., & Zeeck, A. (2002). Big Effects from Small Changes: Possible Ways to Explore Nature’s Chemical Diversity. ChemBioChem : A European Journal of Chemical Biology., 3(7), 619–627.
- “Go.drugbank” (https://go.drugbank.com/drugs/DB00400 – accessed on 3 January 2026).
- H. Nützmann, Y. Reyes-Dominguez, K. Scherlach, V. Schroeckh, F. Horn, A. Gacek, J. Schümann, C. Hertweck, J. Strauss, & A.A. Brakhage, Bacteria-induced natural product formation in the fungus Aspergillus nidulans requires Saga/Ada-mediated histone acetylation, Proc. Natl. Acad. Sci. U.S.A. 108 (34) 14282-14287. (2011). [CrossRef]
- V. Schroeckh, K. Scherlach, H. Nützmann, E. Shelest, W. Schmidt-Heck, J. Schuemann, K. Martin, C. Hertweck, & A.A. Brakhage, Intimate bacterial–fungal interaction triggers biosynthesis of archetypal polyketides in Aspergillus nidulans, Proc. Natl. Acad. Sci. U.S.A. 106 (34) 14558-14563, (2009) . [CrossRef]
- Rokas, Antonis and Mead, Matthew E. and Steenwyk, Jacob L. and Raja, Huzefa A. and Oberlies, Nicholas H.Biosynthetic gene clusters and the evolution of fungal chemodiversity,Nat. Prod. Rep.,year 2020,volume 37,7, page868-878,The Royal Society of Chemistry”, . [CrossRef]
- Keller, N.P. Fungal secondary metabolism: regulation, function and drug discovery. Nat Rev Microbiol 17, 167–180 (2019). [CrossRef]
- Juliane Macheleidt, Derek J. Mattern, Juliane Fischer, Tina Netzker, Jakob Weber, Volker Schroeckh, Vito Valiante, Axel A. Brakhage. 2016. Regulation and Role of Fungal Secondary Metabolites. Annual Review Genetics. 50:371-392. [CrossRef]
- Sun Y,Chen B,Li X,Yin Y, Wang C,,2022.Orchestrated Biosynthesis of the Secondary Metabolite Cocktails Enables the Producing Fungus to Combat Diverse Bacteria. mBio13:e01800-22. [CrossRef]
- Sandmann G. Carotenoids and Their Biosynthesis in Fungi. Molecules. 2022 Feb 21;27(4):1431. PMID: 35209220; PMCID: PMC8879039. [CrossRef]
- Avalos J, Carmen Limón M. Biological roles of fungal carotenoids. Curr Genet. 2015 Aug;61(3):309-24. Epub 2014 Oct 5. PMID: 25284291. [CrossRef]
- Jason R. Nielson, Eric K. Fredrickson, T. Cameron Waller, Olga Zurita Rendón, Heidi L. Schubert, Zhenjian Lin, Christopher P. Hill, Jared Rutter,Sterol Oxidation Mediates Stress-Responsive Vms1 Translocation to Mitochondria,Molecular Cell,Volume 68, Issue 4,2017,Pages 673-685.e6,ISSN 1097-2765. [CrossRef]
- Yukuyama, M. N., Fabiano, K. C., Inague, A., Uemi, M., Lima, R. S., Diniz, L. R., … & Miyamoto, S. (2025). Comparative study of ergosterol and 7-dehydrocholesterol and their endoperoxides: Generation, identification, and impact in phospholipid membranes and melanoma cells. Photochemistry and Photobiology, 101(4), 960-978. [CrossRef]
- Wong, S. M., Musza, L. L., Kydd, G. C., Kullnig, R., Gillum, A. M., & Cooper, R. (1993). Fiscalins: New substance P inhibitors produced by the fungus neosartorya fischeri taxonomy, fermentation, structures, and biological properties. The Journal of Antibiotics, 46(4), 545-553.
- Barreiro, S.; Silva, B.; Long, S.; Pinto, M.; Remião, F.; Sousa, E.; Silva, R. Fiscalin Derivatives as Potential Neuroprotective Agents. Pharmaceutics 2022, 14, 1456. [CrossRef]
- Long, S.; Resende, D.I.S.P.; Kijjoa, A.; Silva, A.M.S.; Pina, A.; Fernández-Marcelo, T.; Vasconcelos, M.H.; Sousa, E.; Pinto, M.M.M. Antitumor Activity of Quinazolinone Alkaloids Inspired by Marine Natural Products. Mar. Drugs 2018, 16, 261. [CrossRef]
- Long, S.; Resende, D.I.S.P.; Kijjoa, A.; Silva, A.M.S.; Fernandes, R.; Xavier, C.P.R.; Vasconcelos, M.H.; Sousa, E.; Pinto, M.M.M. Synthesis of New Proteomimetic Quinazolinone Alkaloids and Evaluation of Their Neuroprotective and Antitumor Effects. Molecules 2019, 24, 534. [CrossRef]
- Anwardeen, N.R., Diboun, I., Mokrab, Y. et al. Statistical methods and resources for biomarker discovery using metabolomics. BMC Bioinformatics 24, 250 (2023). [CrossRef]
- M. Grootveld, in Metabolic Profiling: Disease and Xenobiotics, ed. M. Grootveld, The Royal Society of Chemistry, 2014, pp. 1-34.
- Suyun Xu, Caihong Bai, Yanli Chen, Lingling Yu, Wenjun Wu, Kaifeng Hu, Comparing univariate filtration preceding and succeeding PLS-DA analysis on the differential variables/metabolites identified from untargeted LC-MS metabolomics data,Analytica Chimica Acta,Volume 1287,2024,342103,ISSN 0003-2670. [CrossRef]
- Galindo-Solís, J.M.; Fernández, F.J. Endophytic Fungal Terpenoids: Natural Role and Bioactivities. Microorganisms 2022, 10, 339. [CrossRef]
- Jiang, M.; Wu, Z.; Guo, H.; Liu, L.; Chen, S. A Review of Terpenes from Marine-Derived Fungi: 2015–2019. Mar. Drugs 2020, 18, 321. [CrossRef]
- Li, J., Qin, Y., Li, M. et al. Bio-SS-TS as a Targeted Antitumor Drug Exerts an Anti-Liver Cancer Effect by Enhancing Mitochondria-Dependent Apoptosis. Biol Proced Online 27, 11 (2025). [CrossRef]
- Ezhilarasan, D. and Ditty, M. J (2021). β-sitosterol induces reactive oxygen species-mediated apoptosis in human hepatocellular carcinoma cell line. Avicenna Journal of Phytomedicine, 11(6), 541-550. [CrossRef]
- Awad, A.B., Roy, R., & Fink, C.S. (2003). β-sitosterol, a plant sterol, induces apoptosis and activates key caspases in MDA-MB-231 human breast cancer cells. Oncology Reports, 10, 497-500. [CrossRef]
- Trachootham, D., Alexandre, J. & Huang, P. Targeting cancer cells by ROS-mediated mechanisms: a radical therapeutic approach?. Nat Rev Drug Discov 8, 579–591 (2009). [CrossRef]
- Fulda, S., Galluzzi, L. & Kroemer, G. Targeting mitochondria for cancer therapy. Nat Rev Drug Discov 9, 447–464 (2010). [CrossRef]
- Jianxin Guo, Ming Huang and Shuang Hou et al. Therapeutic Potential of Terpenoids in Cancer Treatment: Targeting Mitochondrial Pathways. Cancer Reports. 2024. Vol. 7(9). [CrossRef]
- Kyong Suk Nam, Young Su Jo, Young Ho Kim, Jin Won Hyun, Ha Won Kim, Cytotoxic activities of acetoxyscirpenediol and ergosterol peroxide from Paecilomyces tenuipes, Life Sciences,Volume 69, Issue 2,2001,Pages 229-237,ISSN 0024-3205. [CrossRef]
- Pluskal, T., Castillo, S., Villar-Briones, A. et al. MZmine 2: Modular framework for processing, visualizing, and analyzing mass spectrometry-based molecular profile data. BMC Bioinformatics 11, 395 (2010). [CrossRef]
- Nothias, LF., Petras, D., Schmid, R. et al. Feature-based molecular networking in the GNPS analysis environment. Nat Methods 17, 905–908 (2020). [CrossRef]
- Wang, M., Carver, J., Phelan, V. et al. Sharing and community curation of mass spectrometry data with Global Natural Products Social Molecular Networking. Nat Biotechnol 34, 828–837 (2016). [CrossRef]
- Horai, H., Arita, M., Kanaya, S., Nihei, Y., Ikeda, T., Suwa, K., Ojima, Y., Tanaka, K., Tanaka, S., Aoshima, K., Oda, Y., Kakazu, Y., Kusano, M., Tohge, T., Matsuda, F., Sawada, Y., Hirai, M. Y., Nakanishi, H., Ikeda, K., & Akimoto, N. (2010). MassBank: a public repository for sharing mass spectral data for life sciences. Journal of Mass Spectrometry JMS., 45(7), 703–714. [CrossRef]
- Mohimani, H., Gurevich, A., Shlemov, A. et al. Dereplication of microbial metabolites through database search of mass spectra. Nat Commun 9, 4035 (2018). [CrossRef]
- Shannon P, Markiel A, Ozier O, Baliga NS, Wang JT, Ramage D, Amin N, Schwikowski B, Ideker T. Cytoscape: a software environment for integrated models of biomolecular interaction networks. Genome Res. 2003 Nov;13(11):2498-504. PMID: 14597658; PMCID: PMC403769. [CrossRef]
- Dührkop, K., Fleischauer, M., Ludwig, M. et al. SIRIUS 4: a rapid tool for turning tandem mass spectra into metabolite structure information. Nat Methods 16, 299–302 (2019). [CrossRef]
- Ludwig, M., Nothias, LF., Dührkop, K. et al. Database-independent molecular formula annotation using Gibbs sampling through ZODIAC. Nat Mach Intell 2, 629–641 (2020). [CrossRef]
- K. Dührkop, H. Shen, M. Meusel, J. Rousu, & S. Böcker, Searching molecular structure databases with tandem mass spectra using CSI:FingerID, Proc. Natl. Acad. Sci. U.S.A. 112 (41) 12580-12585. (2015) . [CrossRef]
- Kim, H. W., Wang, M., Leber, C. A., Nothias, L.-F., Reher, R., Kang, K. B., van der Hooft, J. J. J., Dorrestein, P. C., Gerwick, W. H., & Cottrell, G. W. (2021). NPClassifier: A Deep Neural Network-Based Structural Classification Tool for Natural Products. Journal of Natural Products, 84(11), 2795–2807. [CrossRef]
- Djoumbou Feunang, Y., Eisner, R., Knox, C. et al. ClassyFire: automated chemical classification with a comprehensive, computable taxonomy. J Cheminform 8, 61 (2016). [CrossRef]
- Dührkop, K., Nothias, LF., Fleischauer, M. et al. Systematic classification of unknown metabolites using high-resolution fragmentation mass spectra. Nat Biotechnol 39, 462–471 (2021). [CrossRef]
- Venkata Chandrasekhar, Kohulan Rajan, Sri Ram Sagar Kanakam, Nisha Sharma, Viktor Weißenborn, Jonas Schaub, Christoph Steinbeck, COCONUT 2.0: a comprehensive overhaul and curation of the collection of open natural products database, Nucleic Acids Research, Volume 53, Issue D1, 6 January 2025, Pages D634–D643. [CrossRef]
- Mendez D, Gaulton A, Bento AP, et al. ChEMBL: towards direct deposition of bioassay data. Nucleic Acids Research. 2019 Jan;47(D1):D930-D940. PMID: 30398643; PMCID: PMC6323927. [CrossRef]
- Ella F Poynton, Jeffrey A van Santen, Matthew Pin, Marla Macias Contreras, Emily McMann, Jonathan Parra, Brandon Showalter, Liana Zaroubi, Katherine R Duncan, Roger G Linington, The Natural Products Atlas 3.0: extending the database of microbially derived natural products, Nucleic Acids Research, Volume 53, Issue D1, 6 January 2025, Pages D691–D699. [CrossRef]
- Jeffrey A van Santen, Ella F Poynton, Dasha Iskakova, Emily McMann, Tyler A Alsup, Trevor N Clark, Claire H Fergusson, David P Fewer, Alison H Hughes, Caitlin A McCadden, Jonathan Parra, Sylvia Soldatou, Jeffrey D Rudolf, Elisabeth M-L Janssen, Katherine R Duncan, Roger G Linington, The Natural Products Atlas 2.0: a database of microbially-derived natural products, Nucleic Acids Research, Volume 50, Issue D1, 7 January 2022, Pages D1317–D1323. [CrossRef]
- Sunghwan Kim, Jie Chen, Tiejun Cheng, Asta Gindulyte, Jia He, Siqian He, Qingliang Li, Benjamin A Shoemaker, Paul A Thiessen, Bo Yu, Leonid Zaslavsky, Jian Zhang, Evan E Bolton, PubChem 2025 update, Nucleic Acids Research, Volume 53, Issue D1, 6 January 2025, Pages D1516–D1525. [CrossRef]
- Thomas A. Mackenzie, José R. Tormo, Bastien Cautain, Germán Martínez, Isabel Sánchez, Olga Genilloud, Francisca Vicente, Maria C. Ramos,Acoustic droplet ejection facilitates cell-based high-throughput screenings using natural products,SLAS Technology,Volume 29, Issue 3,2024,100111,ISSN 2472-6303. [CrossRef]
- Zhiqiang Pang, Yao Lu, Guangyan Zhou, Fiona Hui, Lei Xu, Charles Viau, Aliya F Spigelman, Patrick E MacDonald, David S Wishart, Shuzhao Li, Jianguo Xia, MetaboAnalyst 6.0: towards a unified platform for metabolomics data processing, analysis and interpretation, Nucleic Acids Research, Volume 52, Issue W1, 5 July 2024, Pages W398–W406, Carotenoids and Their Biosynthesis in Fungi.
Figure 1.
Retention time distribution of LC-MS features by medium condition. Each bar represents the count of features unique to YES extract (blue), unique to CYA extract (yellow) and shared between both media (grey) in each group.
Figure 1.
Retention time distribution of LC-MS features by medium condition. Each bar represents the count of features unique to YES extract (blue), unique to CYA extract (yellow) and shared between both media (grey) in each group.

Figure 2.
PCA score plot labelled of 10 fungal metabolic profiles grown on medium CYA and YES. Samples are colored by cultivation medium, with green for CYA and blue for YES.
Figure 2.
PCA score plot labelled of 10 fungal metabolic profiles grown on medium CYA and YES. Samples are colored by cultivation medium, with green for CYA and blue for YES.

Figure 3.
(a) Supervised OPLS-DA score plot (b) permutation testing (100 permutations) (c) CV-ANOVA results of the model.
Figure 3.
(a) Supervised OPLS-DA score plot (b) permutation testing (100 permutations) (c) CV-ANOVA results of the model.

Figure 4.
Volcano plot showing differential altered metabolites between CYA and YES extracts. Parameters selected p-value <0.05 RAW and FC ≥1.5.
Figure 4.
Volcano plot showing differential altered metabolites between CYA and YES extracts. Parameters selected p-value <0.05 RAW and FC ≥1.5.

Figure 5.
Hierarchical clustering heatmap of relative intensities of the top 25 significantly altered features across YES and CYA extracts.
Figure 5.
Hierarchical clustering heatmap of relative intensities of the top 25 significantly altered features across YES and CYA extracts.

Figure 6.
Bar graph showing broad chemical class distribution of top discriminant features.

Figure 7.
GNPS molecular network of fungal metabolome. Nodes represent MS/MS features; edges indicate spectral similarity (cosine score threshold applied). Node color reflects log2 fold change (YES vs CYA), with red indicating YES enrichment and blue indicating CYA enrichment. Major annotated clusters corresponding to steroidal, terpenoid, coumarin-like, lipids, terpenoids and alkaloid clusters are highlighted.

Figure 8.
Bioactivity heatmap across fungal strains and media. Z-score normalised bioactivity profiles (cytotoxic, antifungal, antibacterial) for all extracts.
Figure 8.
Bioactivity heatmap across fungal strains and media. Z-score normalised bioactivity profiles (cytotoxic, antifungal, antibacterial) for all extracts.

Figure 9.
Hierarchical clustering heatmap showing the relative abundance of top media-discriminant metabolites in strains exhibiting measurable bioactivity.
Figure 9.
Hierarchical clustering heatmap showing the relative abundance of top media-discriminant metabolites in strains exhibiting measurable bioactivity.

Figure 10.
Spearman correlation heatmap between selected metabolites and bioactivity. Positive and negative correlations are indicated by color gradients.
Figure 10.
Spearman correlation heatmap between selected metabolites and bioactivity. Positive and negative correlations are indicated by color gradients.

Figure 11.
OPLS regression model constructed using cytotoxic activity as the Y-variable. (a) score plot and (b) permutation validation plot and (c) CV-ANOVA.
Figure 11.
OPLS regression model constructed using cytotoxic activity as the Y-variable. (a) score plot and (b) permutation validation plot and (c) CV-ANOVA.

Figure 12.
Bar plot of the VIP scores from OPLS regression model of top 15 cytotoxic-associated metabolites grouped by major biosynthetic class.
Figure 12.
Bar plot of the VIP scores from OPLS regression model of top 15 cytotoxic-associated metabolites grouped by major biosynthetic class.


Table 1.
Strain information with the details of isolation.
| Species | IBT code |
Extract code |
Medium | Country | Place | Source |
|---|---|---|---|---|---|---|
| Penicillium polonicum | 36874 | RD3 RD6 |
YES CYA |
Denmark |
DTU Campus Lyngby |
Soil |
| Penicillium hordei | 36516 | RD8 RD11 |
YES CYA |
Denmark |
Greenhouse |
Wheat soil; Rhizosphere |
| Penicillium freii | 35771 | RD9 RD12 |
YES CYA |
Denmark |
Greenhouse |
Soil at wheat plant; Bulk soil |
|
Penicillium crustosum |
36822 |
RD16 RD19 |
YES CYA |
Denmark |
DTU Campus Lyngby |
Soil |
|
Penicillium velutinum |
32349 |
RD21 RD24 |
YES CYA |
Malaysia |
Puncak alam forest |
- |
|
Aspergillus insuetus |
28304 |
RD27 RD30 |
YES CYA |
Canada |
Ottawa |
Indoor air |
|
Aspergillus insuetus |
28267 |
RD34 RD37 |
YES CYA |
Canada |
Ontario |
Indoor air |
|
Penicillium expansum |
36840 |
RD28 RD31 |
YES CYA |
Denmark |
DTU Campus Lyngby |
Soil |
|
Penicillium expansum |
35795 |
RD35 RD38 |
YES CYA |
Denmark |
Greenhouse |
Soil at wheat plant; Bulk soiL |
|
Penicillium scabrosum |
36689 |
RD36 RD39 |
YES CYA |
Denmark |
Skanderborg, 8660 |
Forest soil |
*Notes: Species and strain identifiers were obtained from the IBT Culture Collection (Technical University of Denmark). Isolation source refers to the original substrate or environment from which the strain was obtained.
Disclaimer/Publisher’s Note: The statements, opinions and data contained in all publications are solely those of the individual author(s) and contributor(s) and not of MDPI and/or the editor(s). MDPI and/or the editor(s) disclaim responsibility for any injury to people or property resulting from any ideas, methods, instructions or products referred to in the content. |
© 2026 by the authors. Licensee MDPI, Basel, Switzerland. This article is an open access article distributed under the terms and conditions of the Creative Commons Attribution (CC BY) license.
Copyright: This open access article is published under a Creative Commons CC BY 4.0 license, which permit the free download, distribution, and reuse, provided that the author and preprint are cited in any reuse.


