

Submitted:
02 April 2026
Posted:
02 April 2026
You are already at the latest version
Abstract
Rapid solidification by melt‑spinning produces aluminum alloys with extremely refined microstructures but also introduces strong structural gradients across the ribbon thickness. In this work, the microstructural evolution of a rapidly solidified Al‑Cu‑Li‑Mg‑Sc‑Zr alloy was investigated during model homogenization using in‑situ STEM heating experiments and correlated with bulk electrical‑resistivity measurements. The as‑cast ribbons exhibit two distinct solidification zones: a near‑contact region consisting of columnar cells containing fine Cu‑rich spherical precipitates, and a central region composed of larger eutectic cells enriched in Al₂Cu and Al₇Cu₂Fe phases.
Stepwise in‑situ annealing between 200 °C and 550 °C reveals a sequence of transformations, including matrix depletion due to precipitation of strengthening phases, coarsening and dissolution of primary phases, and the formation of Al₃(Sc,Zr) dispersoids. Above 500 °C, rapid dissolution of primary phases followed by their coagulation into a limited number of stable grain‑boundary particles eliminates the original two‑zone structure and results in a fully homogenized ribbon. Ex‑situ annealing confirms that the resulting microstructure is uniform across the ribbon thickness and enables consistent precipitation strengthening during artificial aging. Microhardness measurements from both ribbon surfaces reveal identical peak‑aged hardness, validating the effectiveness of the short‑time homogenization strategy for rapidly solidified Al‑Cu‑Li‑Mg-based alloys.
Keywords:
Al-Cu-Li-Mg-based alloy
; melt spinning
; in-situ annealing
; homogenization
; microhardness
1. Introduction
Al-Cu-Li-Mg-Sc-Zr alloys are high-strength, low-density materials widely employed as structural components in the aerospace industry [1]. The current generation of Al–Cu–Li alloys uses a high Cu/Li ratio to promote the precipitation of the Al₂Cu (θ′) and Al₂CuLi (T₁) strengthening phases [2,3,4]. Both phases form coherent or semi-coherent platelets within the aluminum matrix and significantly contribute to the mechanical strength of these alloys. Homogeneous precipitation of the T₁ phase is further enhanced by Mg additions [5], while Zr is primarily introduced as a grain refiner [6].
Conventional alloy preparation relies on ingot casting followed by complex thermomechanical treatment to achieve the desired shape and mechanical properties. This processing route requires long homogenization times (greater than 12 h) at high temperatures (above 500 °C), which limits the use of certain alloying elements such as Sc [7,8,9]. Sc is a potent strengthening and grain-refining addition to aluminum alloys [10], primarily due to the formation of the Al₃Sc phase [11]. However, the diffusion coefficient of Sc in aluminum is relatively high compared to that of other grain refiners, such as Zr [6]. Its high diffusivity promotes coarsening of Al₃Sc precipitates, ultimately reducing their beneficial effects. Co-alloying with Zr mitigates this issue through the formation of core–shell Al₃(Sc,Zr) precipitates, which exhibit significantly lower coarsening rates than binary Al₃Sc particles [12]. Nevertheless, even these ternary precipitates have been observed to coarsen beyond their coherency limit under homogenization conditions typical for ingot-cast Al–Cu–Li–Mg–Zr-based alloys [13].
Powder metallurgy represents a promising alternative processing route for Al–Cu–Li-based alloys. Recent studies show that materials produced by powder metallurgy can exhibit superior mechanical properties compared to those prepared by conventional casting and thermomechanical processing [14,15]. Aluminum powders can be generated using various rapid-solidification methods, with gas atomization being the most widely used owing to its ability to produce spherical powder particles [16]. However, gas atomization also suffers from drawbacks, particularly oxidation of droplets during processing, which degrades the properties of consolidated products [17,18]. Therefore, materials prepared by alternative rapid solidification methods, including melt-spun alloys, are often consolidated through powder-metallurgy techniques.
Melt spinning produces thin alloy ribbons by ejecting molten metal through a narrow nozzle onto a rapidly rotating, water-cooled wheel or roll made from a highly conductive material [19]. The intense heat extraction results in solidification rates as high as 10⁷ K·s⁻¹. Heat-transfer coefficients in rapid-solidification techniques exceed those in strip-casting or ingot-casting by several orders of magnitude [20]. When heat extraction is sufficiently rapid, the solidification-front velocity approaches atomic diffusion rates, enabling diffusionless or near-diffusionless solidification [20,21]. Gusakova et al. describe such solidification in three characteristic zones:
- Zone 1 — glassy, fully diffusionless material in which all solutes remain trapped in a supersaturated matrix.
- A transition zone — near-diffusionless solidification, resulting in cellular structures with solute-gradient profiles and primary phases at cell boundaries
- A final zone — where further reduction in solidification-front velocity leads to regular eutectic solidification.
This zonal structure has been reported in multiple melt-spun Al-based alloys [20]. Materials produced in this way typically require homogenization either before or after milling and consolidation. Existing homogenization models relate homogenization time t to cell size or dendrite-arm spacing (DAS) [22] according to:
where D₀ is the pre-exponential factor in the diffusion coefficient, Q is the activation energy for diffusion, R is the gas constant (8.314 J·K⁻¹·mol⁻¹), and T is the homogenization temperature. Homogenization modeling usually focuses on Cu because it is the principal strengthening solute that must be redistributed during heat treatment, along with Li and Mg. However, Li and Mg diffuse much faster than Cu (for example, the diffusion coefficients at 450 °C for Cu, Li, and Mg are 1.27·10-20 m²·s⁻¹, 3·10-20 m²·s⁻¹, and 15·10-20 m²·s⁻¹, respectively [6,23]). Rapid solidification produces materials with smaller cells or dendrites [24], substantially reducing homogenization time. In dilute alloys where typical eutectic dendrites do not form, eutectic-cell size (ECS) can be used instead of DAS.
Reducing homogenization time can mitigate detrimental effects of conventional processing, such as Li-depleted surface layers and coarsening of Al₃(Sc,Zr) precipitates. However, research on rapidly solidified Al–Cu–Li–Mg–Zr alloys remains limited, particularly for melt-spun systems [25,26]. Furthermore, diffusionless solidification does not guarantee uniform formation of eutectic cells throughout the material, suggesting that homogenization behavior may differ between zones of a melt-spun ribbon.
In this study, ribbons of an Al–Cu–Li–Mg–Sc–Zr alloy were annealed in situ in a scanning transmission electron microscope (STEM). This approach simulates homogenization annealing and enables real-time, high-resolution monitoring of microstructural evolution at various stages of heat treatment. Particular attention is paid to the transformation and dissolution of primary phases and the precipitation of Al₃(Sc,Zr) particles. Local STEM observations are correlated with in-situ resistivity measurements on bulk samples. Automated crystal-orientation mapping (ACOM-TEM) is used to identify the structure of coarse particles.
2. Materials and Methods
The chemical composition of the alloy is listed in Table 1. The feedstock for the melt-spun ribbons was prepared by mixing a commercial AA2195 alloy with an Al–2 wt.% Sc master alloy and pure aluminum. The composition of the input material was determined from three optical emission spectroscopy (OES) measurements using a Q4 TASMAN spectrometer (Bruker, Billerica, Massachusetts, US).
The molten feedstock was preheated to 1000 °C before casting. Boron-nitride casting nozzles were positioned 0.22 mm above the copper wheel, which was rotated at 1500 rpm. The nozzle opening measured 10 × 0.55 mm². Due to inherent instabilities in the melt-spinning process, the resulting ribbons varied in thickness from 15 µm to 60 µm. A schematic of the melt-spun ribbon, including principal directions and the roll-side surface, is shown in Figure 1.
Characterization of the ribbons at the meso- and microscale was carried out using a Thermo Fisher Apreo 2S SEM (Thermo Fisher Scientific Inc., Waltham, Massachusetts, US) and a Zeiss Auriga Compact SEM (Zeiss, Jena, Germany). Both microscopes were equipped with EDAX/Ametek EDS detectors (EDAX/Ametek, Berwyn, Pennsylvania, US) for elemental-distribution mapping. EDS maps were processed using the EDAX Apex software. For SEM analysis, multiple ribbons were embedded in resin and polished using SiC papers, followed by final polishing with OPS colloidal silica suspension (Struers, Copenhagen, Denmark).
In-situ annealing experiments were conducted in a JEOL 2200 FS scanning transmission electron microscope (JEOL, Tokyo, Japan) using a heating holder operated with a stepwise heating rate of 50 °C every 5 min. The microscope was equipped with a JEOL Centurio EDS detector and a Nanomegas ASTAR ACOM-TEM system (Nanomegas, Brussels, Belgium). TEM samples were prepared either by electrolytic polishing of ribbon segments for in-plane observations or by focused ion beam (FIB) milling in the Zeiss Auriga system for preparing cross-sections near the ribbon surface.
In-situ electrical-resistivity measurements were performed on H-shaped specimens using the four-point method. The samples were approximately 1 cm wide and 10 cm long. Heating during the measurement was carried out at a rate of 1 °C/min. Resistivity was calculated from current and voltage measurements obtained using KEITHLEY instrumentation (KEITHLEY, Solon, Ohio, US).
Microhardness measurements were conducted using a Q10A+ microhardness tester (Qness, Mammelzen, Germany). A 20 g load was applied with a dwell time of 10 s. Artificial aging was performed in a silicone-oil bath at 180 °C. Microhardness was measured “on-edge” in the TD/ND plane during aging, and peak-aged states were additionally evaluated by indenting both surfaces of the ribbons.
3. Results
3.1. As-Cast State
The microstructure of the as-cast melt-spun ribbon can be divided into two primary regions (Figure 2a). The first region is located near the surface that was in contact with the water-cooled wheel during casting (Zone 2 in [21]). Zone 2 consists of columnar cells with constituent phases precipitated along their boundaries. The interiors of these cells contain fine spherical particles that increase in size (with maximum diameters of approximately 150 nm) with increasing distance from the ribbon surface (Figure 2b).
The second region (Zone 3), situated farther from the wheel side, is composed of eutectic cells similar to those observed in conventionally solidified materials (Figure 2c) [13,27,28]. These eutectic cells contain boundary constituents but no longer exhibit spherical intragranular precipitates. No glassy region associated with fully diffusionless solidification (Zone 1) was identified in the ribbon.
Zone 3 exhibits larger cells and increased interparticle spacing. To estimate the required homogenization time using Equation 1, the eutectic-cell size (ECS) in Zone 3 was determined and taken as the upper bound for homogenization within the ribbon. ECS was calculated using the circular-intercept method [29] and found to be (1.0 ± 0.1) µm, based on five measurements. The corresponding theoretical homogenization time is 15 s. This estimate does not account for finite transformation and dissolution rates of constituent phases or for different diffusion coefficients within intermetallic compounds. Furthermore, the ribbons exhibit microstructural gradients across their thickness, and homogenization is not guaranteed to proceed uniformly in both regions.
Energy-dispersive X-ray spectroscopy (EDS) mapping of Zone 2 cells shows that the spherical precipitates are almost exclusively Cu-rich, while the boundary phases contain both Cu and Fe (Figure 3). These elevated Cu and Fe concentrations are consistent with incoherent Al₂Cu (θ) and Al₇Cu₂Fe phases (Table 2). An increased Mg signal appears at some cell boundaries (Figure 3d), but this originates from nonequilibrium segregation during eutectic solidification and does not indicate the presence of Mg-containing intermetallic compounds.
Because EDS provides only semiquantitative data and the small precipitates are embedded in an Al matrix, which affects quantitative accuracy, ACOM-TEM was performed in the same area. These measurements confirmed the presence of the Al₇Cu₂Fe and Al₂Cu (θ) phases (Figure 4).
STEM micrographs of FIB-prepared cross-sectional lamellae show that only a few spherical precipitates form within grains at the extreme surface of the ribbon (Figure 5a). These features begin to appear consistently at depths of approximately 3 µm. The spherical precipitates in this region measure 30-100 nm in diameter. An in-plane cross-section located slightly deeper within Zone 2, where spherical precipitates reach sizes up to 160 nm, was selected for further in-situ annealing studies (Figure 5b). This sampling location lies within Zone 2 but above the transition to Zone 3.
The larger spherical precipitates are frequently observed to contain brighter cores in BF-STEM images (Figure 6a–c). These bright centers exhibit no enrichment of any elements detectable by EDS and show negative contrast in the Al map (Figure 6d), indicating that they are not composed of pure aluminum. This contrast suggests the presence of Li-rich (most probably AlLi) inclusions, which EDS cannot detect.
3.2. Resistivity Evolution
The evolution of electrical resistivity—expressed as the ratio of the resistivity at temperature T, R(T), to the initial resistivity at room temperature, R₀—and the corresponding resistivity spectrum—defined as the negative normalized derivative of the temperature-dependent resistivity—are shown in Figure 7. For comparison, the resistivity spectrum of pure aluminum is also included (black curve). In aluminum alloys, solute elements dissolved in the matrix are the dominant contributors to electrical resistivity [6]. Changes in solute concentration arising from precipitation or dissolution manifest as deviations from the monotonic increase in resistivity observed for pure aluminum. These deviations appear as inflection points in the resistivity-evolution curve and as peaks or minima in the resistivity spectrum [29].
The resistivity spectrum of the present alloy differs markedly from that of pure aluminum, whose resistivity increases smoothly with temperature due to the absence of microstructural transformations. The first significant decrease in resistivity occurs at approximately 200 °C, indicating the onset of precipitation of strengthening phases within this temperature range, which is consistent with the temperatures typically associated with artificial aging in Al–Cu–Li-based alloys and with the formation of coherent precipitates such as T₁ and θ′ [5,13].
A pronounced peak appears at 300 °C, followed by a local minimum at 350 °C. Nanoscale Sc-containing precipitates may form near 300 °C, causing matrix depletion and producing the observed peak [30]. The subsequent minimum at 350 °C reflects matrix enrichment resulting from the dissolution or redistribution of solute atoms. The most prominent spectral features occur at approximately 450 °C (peak) and 500 °C (minimum). Beyond 500 °C, an additional resistivity increase—reflected by another spectral peak—can be attributed to the dissolution of primary intermetallic phases, a behavior commonly observed in Al-based alloy systems [31]. Partial Li evaporation at elevated temperatures may also contribute.
3.3. In-Situ Annealing
No microstructural changes are observed below 200 °C in either of the examined regions (Figure 8a). Although coherent strengthening precipitates are expected to begin forming in this temperature range, their small size and the short duration of the in-situ experiment prevent them from being directly resolved.
Between 200 °C and 300 °C, platelet-shaped precipitates become visible as they coarsen (Figure 8b). Their morphology varies depending on grain orientation. At 300 °C, several constituent phases undergo coarsening, and new phases appear along cell boundaries. These observations indicate depletion of the supersaturated matrix—consistent with the first major peak in the resistivity spectrum—and may be accompanied by the precipitation of Sc-containing particles.
Between 300 °C and 400 °C, the intragranular spherical precipitates formed during rapid solidification dissolve (Figure 8c). The solute released during this process diffuses toward and enriches the boundary phases, producing the local resistivity minimum observed in the spectrum. Above 450 °C, the boundary phases transform into smaller spherical precipitates (Figure 8d). At approximately 500 °C, these newly formed particles begin to dissolve (Figure 8e), corresponding to the subsequent spectral changes. Continued annealing results in further dissolution of transformed phases and coagulation of released solutes into a small number of coarsening grain-boundary particles (Figure 8f). This coarsening event is responsible for the final major peak in the resistivity spectrum.
Progressive coarsening of Al₃(Sc,Zr) precipitates during in-situ annealing is evident from the increasing graininess visible in the STEM images. This effect becomes noticeable at around 400 °C and intensifies with increasing temperature as homogeneously nucleated particles grow (Figure 9a,b).
Isothermal in-situ annealing at 520 °C confirms the presence of Al₃(Sc,Zr) precipitates (Figure 10a), indicating successful nucleation and growth during earlier heating stages. These precipitates exhibit the characteristic core–shell structure, consisting of a Sc-rich core surrounded by a Zr-rich shell, as verified by EDS mapping (Figure 10b).
Because the heating holder used for in-situ annealing is incompatible with the EDS detector, compositional analysis could not be performed during heating. The sample was therefore cooled in situ before being transferred to an analytical TEM holder. During cooling, reprecipitation of solute atoms occurs (Figure 11a), producing new intragranular precipitates. EDS mapping confirms that the remaining particles are either Al–Cu–Fe-based or Al–Cu-based (Figure 11b,c). Mg is fully homogenized within the analyzed region (Figure 11d). No Li-rich inclusions are detected after cooling.
Selected-area electron-diffraction (SAED) patterns were acquired from different locations within a coalesced grain-boundary particle. The particle contains both a Cu-rich region (Figure 12a) and a Fe-rich inclusion (Figure 12d). SAED analysis reveals that the Cu-rich region corresponds to the Al₂Cu (θ) phase, while the Fe-rich inclusion corresponds to the stable Al₇Cu₂Fe phase (Figure 12b,c,e,f). Because Fe has very low solubility in aluminum, the Fe-rich Al₇Cu₂Fe phase remains undissolved. The θ phase (Al₂Cu) effectively traps Cu released during dissolution of transformed constituents.
3.4. Ex-Situ Annealed States
An experimental annealing procedure was applied to the melt-spun ribbon. The ribbons were annealed at 300 °C, 450 °C, and 530 °C for 5 minutes at each temperature. These temperatures were selected to optimize the microstructure of the material before potential artificial aging, as described in detail by Králik et al. [31]. The annealing duration was kept deliberately short to minimize surface Li evaporation, which would otherwise significantly degrade ribbon properties [32]. While solute homogenization is expected to occur rapidly—within approximately 15 s based on Equation (1)—the high-temperature exposure was extended to 5 minutes to enable transformation of the primary phases, following observations made during in-situ annealing.
The distinct microstructural zones present in the as-cast ribbon (Figure 2a) are no longer visible after annealing (Figure 13). The transformed constituent phases are uniformly distributed across the ribbon thickness, demonstrating that homogenization was successfully achieved.
STEM-EDS mapping of the ex-situ annealed material reveals a phase distribution similar to that observed in the in-situ annealed ribbon (Figure 11). The microstructure contains discrete Cu-rich θ-phase particles and Fe-rich Al₇Cu₂Fe particles, which may locally appear as inclusions within θ-phase regions (Figure 14). Mg is fully homogenized within the matrix (Figure 14d). No bright particle cores—previously attributed to Li-rich inclusions—are observed in the ex-situ annealed material.
The Al₇Cu₂Fe and primary Al₂Cu phases act as sinks for solutes required for precipitation strengthening. However, Cu-containing transformed constituents are commonly observed in standard homogenized ingot-cast materials [33,34]. The aging response of the heat-treated ribbons, therefore, reflects the overall solute enrichment of the matrix.
The material was artificially aged at 180 °C. Microhardness measurements were performed on samples aged for different durations to determine the aging response and identify the peak-aged condition (Figure 15). The initial hardness was (97 ± 4) HV0.02. Hardness gradually increased during aging and reached a peak after 40 h. The peak-aged hardness was measured as (132 ± 6) HV0.02.
The increase in hardness during aging results from the precipitation of strengthening phases from the supersaturated matrix. The principal strengthening precipitates in this alloy system are the T₁ (Al₂CuLi) phase and the θ′ (Al₂Cu) phase. Their presence is confirmed in the peak-aged material (Figure 16a,b). θ′ precipitates appear as plate-shaped particles in three variants on {100}Al_planes. T₁ precipitates form plates in four variants on {111}Al_planes. Diffraction patterns of these precipitates exhibit superlattice reflections corresponding to the defined orientation relationships between precipitates and matrix (Figure 16c,d). The inset diffraction patterns in Figure 16a,b confirm the structures of the observed phases.
Microhardness measurements were also performed on both ribbon surfaces in the homogenized and peak-aged states to assess whether mechanical properties became equivalent on both sides of the ribbon following homogenization. The indentation diagonal was approximately 14 µm. For a Vickers indenter (136° tip angle), the indentation depth is almost 2 µm. Assuming the affected volume extends to 2.5× the indentation depth, the impacted depth is ~5 µm—well below half the ribbon thickness.
The peak-aged microhardness of the originally Zone 2 surface (original wheel side) is (127 ± 8) HV0.02, while the former Zone 3 surface yields (129 ± 6) HV0.02. These values agree with the on-edge measurements within the experimental scatter, indicating that Cu concentration and the precipitation behavior of the strengthening phases are similar on both sides—providing further evidence of successful homogenization.
4. Discussion
Melt-spinning achieves significantly higher solidification rates than standard ingot-casting methods (0.5–10 K·s⁻¹ [36]) and even higher than some continuous-casting techniques such as twin-roll casting (TRC), which typically operates at approximately 1000 K·s⁻¹ [27]. Although the range of solidification rates in these conventional processes is broad, the resulting microstructure consistently consists of eutectic cells with coarse primary-phase particles distributed along their boundaries [31,37]. In contrast, the melt-spun ribbon exhibits the multi-zone structure described by Gusakova et al. [20]. Standard eutectic solidification (Zone 3) appears only in sufficiently thick regions located far enough from the water-cooled roll. The critical thickness for the onset of this zone is approximately 30–35 µm.
In Zone 2, where near-diffusionless solidification dominates, coarse primary phases still form—primarily Al₂Cu (θ) and Al₇Cu₂Fe. Additionally, Li-rich inclusions were detected inside some spherical primary precipitates. These inclusions are most likely the stable binary AlLi (δ) phase, which forms early during solidification because of the high diffusivity of Li; subsequent constituents then precipitate around it. Similar δ-phase formation has been observed in other rapidly solidified Al–Li alloys [38]. The spatial distribution and size of all primary constituents vary significantly across the ribbon thickness, necessitating homogenization. However, the refinement imparted by rapid solidification reduces the required homogenization time to less than one minute [22].
The distribution of primary phases strongly influences transformation kinetics during annealing between 300 °C and 450 °C. Depending on particle size and location, the as-cast constituents transform into smaller spherical precipitates, which subsequently coarsen as the supersaturated matrix becomes depleted. Above 500 °C, some transformed particles dissolve while others undergo additional coarsening. Despite initial structural differences across the ribbon, the overall sequence of transformations during annealing resembles that observed in conventional eutectic systems: primary particles spheroidize, dissolve, and ripen at sufficiently high temperatures, including those containing Li [38]. Dissolution above 500 °C aligns with standard homogenization temperatures reported for Al–Cu–Li systems [23,39]. The rapid dissolution and coarsening processes occurring throughout the ribbon lead to effective homogenization of all transformed phases.
The microstructural evolution observed during in-situ annealing correlates well with the measured resistivity changes, except for possible matrix Li depletion. Although nanoscale Sc-containing precipitates cannot be directly resolved at the imaging scale employed during in-situ experiments, their formation is indirectly suggested by the appearance of fine contrast variations across individual grains (Figure 9). Their presence was later confirmed in isothermally annealed ribbons and by EDS mapping (Figure 10). The precipitate diameters remain below the coherency limit for Al₃(Sc,Zr) (≈ 22 nm) [11].
The microhardness evolution of the melt-spun material matches that of model TRC- and mold-cast alloys of equivalent composition, both in terms of precipitation kinetics and peak-aged hardness [31]. The agreement between on-edge and in-plane hardness measurements within an experimental scatter further indicates that homogenization was effective. Although the peak hardness of the melt-spun ribbon is lower than that of standard AA2195 alloys—which can reach up to 190 HV [40,41,42]—this difference is expected. Commercial alloys generally contain ~50 % higher concentrations of key alloying elements and undergo pre-stretching before artificial aging [34]. Pre-stretching improves the uniformity and volume fraction of T₁ precipitates and provides additional work hardening, thereby enhancing strength.
The melt-spun ribbon itself cannot be pre-deformed by conventional methods such as tensile stretching (due to brittleness) or rolling (due to thickness non-uniformity). Therefore, deformation processing should be applied after powder consolidation. Post-consolidation homogenization may also be beneficial, as it permits longer heat-treatment durations that can further dissolve residual Al₂Cu constituents. Li loss during post-consolidation heat treatment is expected to be significantly lower than during the treatment of thin ribbons. Furthermore, Al₃(Sc,Zr) precipitates have been shown to resist coarsening at 530 °C for at least 30 minutes, for at least 30 minutes, thereby retaining their strengthening effect [31].
5. Conclusions
- The gradient in solidification rate across the ribbon thickness, combined with the rapid transitions between solidification modes during melt-spinning, results in an inherently inhomogeneous as-cast microstructure.
- The primary phases present in the as-cast melt-spun ribbon were identified by EDS mapping and ACOM-TEM as Al₂Cu (θ) and Al₇Cu₂Fe.
- Standard homogenization models indicate that the refined microstructure produced by rapid solidification can be homogenized in less than 1 minute.
- Spatial variations in primary-phase size influence transformation kinetics during annealing between 300 °C and 450 °C.
- Above 500 °C, rapid dissolution and ripening occur regardless of the initial primary-phase size, producing a uniform distribution and size of transformed phases throughout the ribbon.
- The transformed particles retain the same crystal structures as the primary phases observed in the as-cast state.
- Microstructural changes observed locally during in-situ annealing are consistent with bulk behavior, as confirmed by resistivity-evolution measurements.
- SEM observations of the primary-phase distribution, together with mechanical testing on both ribbon surfaces, demonstrate that the applied thermal treatment successfully homogenized the material.
Author Contributions
Conceptualization, methodology and validation, R. K. and M. C.; formal analysis and investigation, R. K. B. K., T. K., and L. B.; resources, T. K., M. C.; writing – original draft preparation and visualization – R. K., T. K., B. K., L. B.; supervision, review and editing, and funding acquisition – M. C.
Funding
This research was funded by the Charles University Grant Agency project number 292522.
Data Availability Statement
Dataset available on request from the authors.
Conflicts of Interest
The authors declare no conflicts of interest.
References
- Rioja, R. J.; Liu, J. The Evolution of Al-Li Base Products for Aerospace and Space Applications. Metall Mater Trans A, 2012, 43, 3325-3337. [CrossRef]
- Lavernia, E. J.; Grant, N. J. Aluminum-Lithium alloys, J Mat Sci, 1987, 22, 1521-1589. [CrossRef]
- Grushko, O.; Ovchinnikov, V.; Ovsyannikov, B. Aluminum-Lithium Alloys: Process Metallurgy, Physical Metallurgy, and Welding. CRC Press: Boca Raton, USA, 2016. [CrossRef]
- Decreus, B.; Deschamps, A.; De Geusser, F. The influence of Cu/Li ratio on precipitation in Al-Cu-Li-x alloys, Acta Mater, 2013, 2207-2218. [CrossRef]
- Cassada, W. A.; Shiflet, G. J.; Starke, E. A. Mechanism of Al2CuLi (T1) Nucleation and Growth, Metall Trans A, 1991, 22, 287-297. [CrossRef]
- Hatch, J. E. Aluminum: Physical properties and metallurgy. American Society for Metals, Metals Park, USA, 1984. ISBN: 9780871701763.
- Deng, Y.; Xu, J.; Chen, J.; Guo, X. Effect of double-step homogenization treatments on the microstructure and mechanical properties of Al–Cu–Li–Zr alloy. Mat Sci Eng A, 2020, 795, 139975. [CrossRef]
- Liu, Q.; Zhu, R.; Li, J.F.; Chen, Y.L.; Zhang, X.H.; Zhang, L.; Zheng, Z. Microstructural evolution of Mg, Ag and Zn micro-alloyed Al–Cu–Li alloy during homogenization. T Nonferr Metal Soc, 2016, 26, 607-619. [CrossRef]
- Tsivoulas, D.; Robson, J. D.; Heterogeneous Zr solute segregation and Al3Zr dispersoid distributions in Al–Cu–Li alloys. Acta Mater, 2015, 93, 73-86. [CrossRef]
- Sun, J.; Song, M.; He, Y. Effects of Sc content on the mechanical properties of Al-Sc alloys. Rare Metals, 2010, 29, 451-455. [CrossRef]
- Royset, J.; Ryum, N. Scandium in Aluminum Alloys. Int Mater Rev, 2005, 50, 19-44. [CrossRef]
- Clouet, E.; Nastar, M.; Sigil, C. Nucleation of Al3Zr and Al3Sc in aluminum alloys: From kinetic Monte Carlo simulations to classical theory. Phys Rev B, 2004, 69, 064109. [CrossRef]
- Suresh, M.; Sharma, A.; More, A. M.; Nayan, N.; Suwas, S. Effect of Scandium addition on evolution of microstructure, texture and mechanical properties of thermo-mechanically processed Al-Li alloy AA2195. J Alloy Compd, 2018, 740, 364-374. [CrossRef]
- Qi, M.; Chen, C.; Wei, J.; Mei, X.; Sun, C.; Su, G.; Zhang, C.; Yan, M.; Yang, F.; Guo, Z. Superior mechanical properties and microstructural evolution of powder metallurgy 2195 Al-Li alloy subjected to hot extrusion. J Alloy Compd, 2023, 962, 171184. [CrossRef]
- Cañadilla, A.; Sanhueza, J.P.; Montalba, C.; Ruiz-Navaz, E. M. Effect of Sintering Temperature on Phase Formation and Mechanical Properties of Al–Cu–Li Alloy Prepared from Secondary Aluminum Powders, Metals, 2024, 14, 12. [CrossRef]
- Gianogolio, D.; Ciftci, N.; Armstrong, S.; Uhlenwinkel, V.; Battezzati, L.; On the Cooling Rate-Microstructure Relationship in Molten Metal Gas Atomization, Metall Mater Trans A, 2021, 52, 3750-3758. [CrossRef]
- Ernts, A. T.; Kerns, P.; Nardi, A.; Brody, H. D.; Dongare, A. M.; Lee, S.-W.; Champagne, V. K.; Suib, S. L.; Aindow, M. Surface states of gas-atomized Al 6061 powders – Effects of heat treatment. Appl Surf Sci, 2020, 534, 147643. [CrossRef]
- Lu, J.; Li, L.; Zhang, H.; Chen, Y.; Luo, L.; Zhao, X.; Guo, F.; Xiao, P. Oxidation behavior of gas-atomized AlCoCrFeNi high-entropy alloy powder at 900–1100 °C. Corros Sci, 2021, 181, 109257. [CrossRef]
- Duwez, P.; Williens, R. H.; Klement, W. Continuous series of Metastable Solid Solutions in Silver-Copper Alloys. J Appl Phys, 1960, 31, 1136. [CrossRef]
- Gusakova, O.; Shepelevich, V.; Alexandrov, D. V.; Starodumov, I. O. Formation of the microstructure of rapidly solidified hypoeutectic Al-Si alloy, The European Physical Journal Special Topics, 2020, 229, 417-425. [CrossRef]
- Gusakova, O. Chemically partitionless crystallization in near-eutectic rapidly solidified Al–12, 6Si–0, 8Mg–0, 4Mn–0, 7Fe–0, 9Ni–1, 8Cu alloy, The European Physical Journal Special Topics, 2023, 232, 1281-1291. [CrossRef]
- Zhang, F.; Shen, J.; Yan, X.; Sun, J.; Sun, X.; Yang, Y. Homogenization heat treatment of 2099 Al-Li alloy, Rare Metals, 2014, 33, 28-36. [CrossRef]
- Li, S.; Wei, B.; Yu, C.; Li, Y.; Xu, G.; Li, Y. Evolution of microstructure and properties during homogenization of the novel Al–Li alloy fabricated by electromagnetic oscillation twin-roll casting, J Mater Research Tech, 2020, 9, 3304-3317. [CrossRef]
- Eskin, D.; Du, Q.; Ruvalcaba, D.; Katgerman, L. Experimental study of structure formation in binary Al–Cu alloys at different cooling rates, Mat Sci Eng A, 2005, 405, 1-10. [CrossRef]
- Kim, D. H.; Cantor, B.; Lee, H. I. Structure and decomposition behaviour of rapidly solidified AI-Cu-Li-Mg-Zr alloys, 1988, 23, 1695-1708. [CrossRef]
- Dutkiewicz, J.; Kabisch, O.; Gille, W.; Simmich, O.; Scholz, R.; Krol, J. Structure Changes and Precipitation Kinetics in Melt Spun and Aged Al–Li–Cu Alloy, Int J Mater Res, 2022, 92, 0229. [CrossRef]
- Slámová, M.; Karlík, M.; Robaut, F.; Sláma, P.; Véron, M. Differences in microstructure and texture of Al–Mg sheets produced by twin-roll continuous casting and by direct-chill casting, Mater Charact, 2002, 49, 231-240. [CrossRef]
- Grydin, O.; Garthe, K.U.; Yuan, X.; Broer, J.; Kessler, O.; Králík, R.; Cieslar, M.; Schaper, M. Numerical and Experimental Investigation of Twin-Roll Casting of Aluminum–Lithium Strips, 2023, Light Metals, 291759. [CrossRef]
- Willis, D. J.; Lake, J. S.; Measurement of grain size using the circle intercept method, Scripta Metall Mater, 1987, 21, 1733-1736. [CrossRef]
- Hájek, M.; Veselý, J.; Cieslar, M. Precision of electrical resistivity measurements. Mat Sci Eng A, 2007, 462, 339-342. [CrossRef]
- Marquis, E. A.; Seidman, D. N. Nanoscale structural evolution of Al3Sc precipitates in Al(Sc) alloys, Acta Mater, 2001, 49, 1909-1919. [CrossRef]
- Králík, R.; Křivská, B.; Bajtošová, L.; Šlapáková, M.; Cieslar, M. Homogenization of twin-roll cast AA8079 aluminum alloy studied by in-situ TEM, T Nonferr Metal Soc, 2022, 32, 2138-2149. [CrossRef]
- Králík, R.; Křivská, B.; Bajtošová, L.; Stolbchenko, M.; Schaper, M.; Grydin, O.; Cieslar, M. Effect of Sc addition on downstream processing of twin-roll cast Al−Cu−Li−Mg−Zr-based alloys, T Nonferr Metal Soc, 2024, 34, 1759-1773. [CrossRef]
- Fink, D.; Hnatowicz, V.; Kvitek, J.; Havranek, V.; Zhou, J. T. External oxidation of aluminium-lithium alloys, Surface and Coating Technology, 1992, 51, 57-64. [CrossRef]
- Fu, R.; Huang, Y.; Liu, Y.; Li, H.; Wang, Z. Influence of homogenization treatment on microstructure and recrystallization behavior of 2195 Al–Li alloy, T Nonferr Metal Soc, 2023, 23, 2255-2271. [CrossRef]
- Jiang, N.; Gao, X.; Zheng, Z. Microstructure evolution of aluminum-lithium alloy 2195 undergoing commercial production, T Nonferr Metal Soc, 2010, 20, 740-745. [CrossRef]
- Nadella, R.; Eskin, D. G.; Du, Q.; Katgerman, L. Macrosegregation in direct-chill casting of aluminium alloys, Prog Mater Sci, 2008, 53, 421-480. [CrossRef]
- Kihoulou, B.; Králík, R.; Bajtošová, L.; Grydin, O.; Stolbchenko, M.; Schaper, M.; Cieslar, M. Near net shape manufacturing of Sheets from Al-Cu-Li-Mg-Sc-Zr alloy, Materials, 2024, 17, 644. [CrossRef]
- Samuel, F. H.; Champier, G. Ageing characteristics of Al-2.5% Li rapidly solidified alloy, J Mater Sci, 1987, 22, 3851-3863. [CrossRef]
- Huang, H.; Xiong, W.; Jiang, Z.; Zhang, J. A Quasi In-Situ Study on the Microstructural Evolution of 2195 Al-Cu-Li Alloy during Homogenization, Materials, 2022, 15, 6573. [CrossRef]
- Gable, B. M.; Zhu, A. W.; Csontos, A. A.; Starke, E. A. The role of plastic deformation on the competitive microstructural evolution and mechanical properties of a novel Al–Li–Cu–X alloy, Journal of Light Metals, 2001, 1, 1-14. [CrossRef]
- Duan, S.; Guo, F.; Zhang, Y.; Chong, K.; Lee, S.; Matsuda, K.; Zou, Y. Effects of texture and precipitates characteristics on anisotropic hardness evolution during artificial aging for an Al–Cu–Li alloy, Mater Design, 2021, 212, 110216. [CrossRef]
Figure 1.
Schematic of the melt-spun ribbons, showing principal directions and the water-cooled roll side relative to the material.
Figure 1.
Schematic of the melt-spun ribbons, showing principal directions and the water-cooled roll side relative to the material.
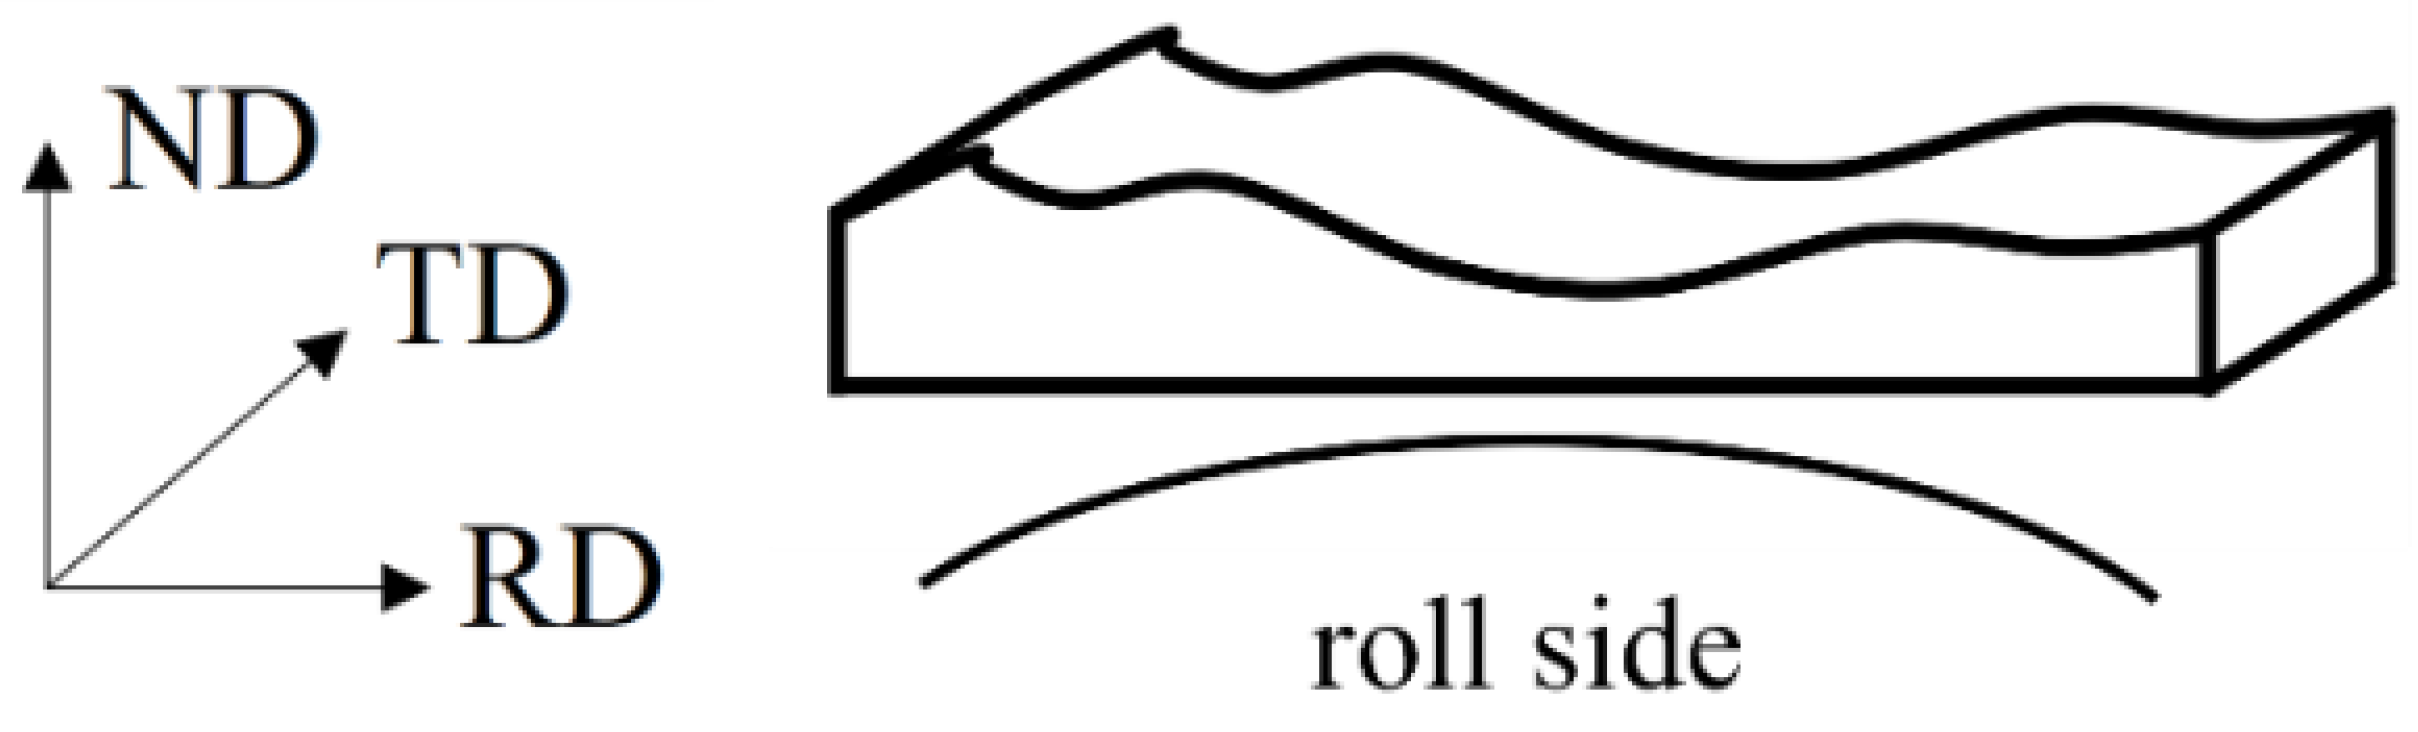
Figure 2.
BSE micrographs of the as-cast ribbon cross-section (a), Zone 2 (b), and Zone 3 (c). Principal directions relative to the ribbon are indicated.
Figure 2.
BSE micrographs of the as-cast ribbon cross-section (a), Zone 2 (b), and Zone 3 (c). Principal directions relative to the ribbon are indicated.
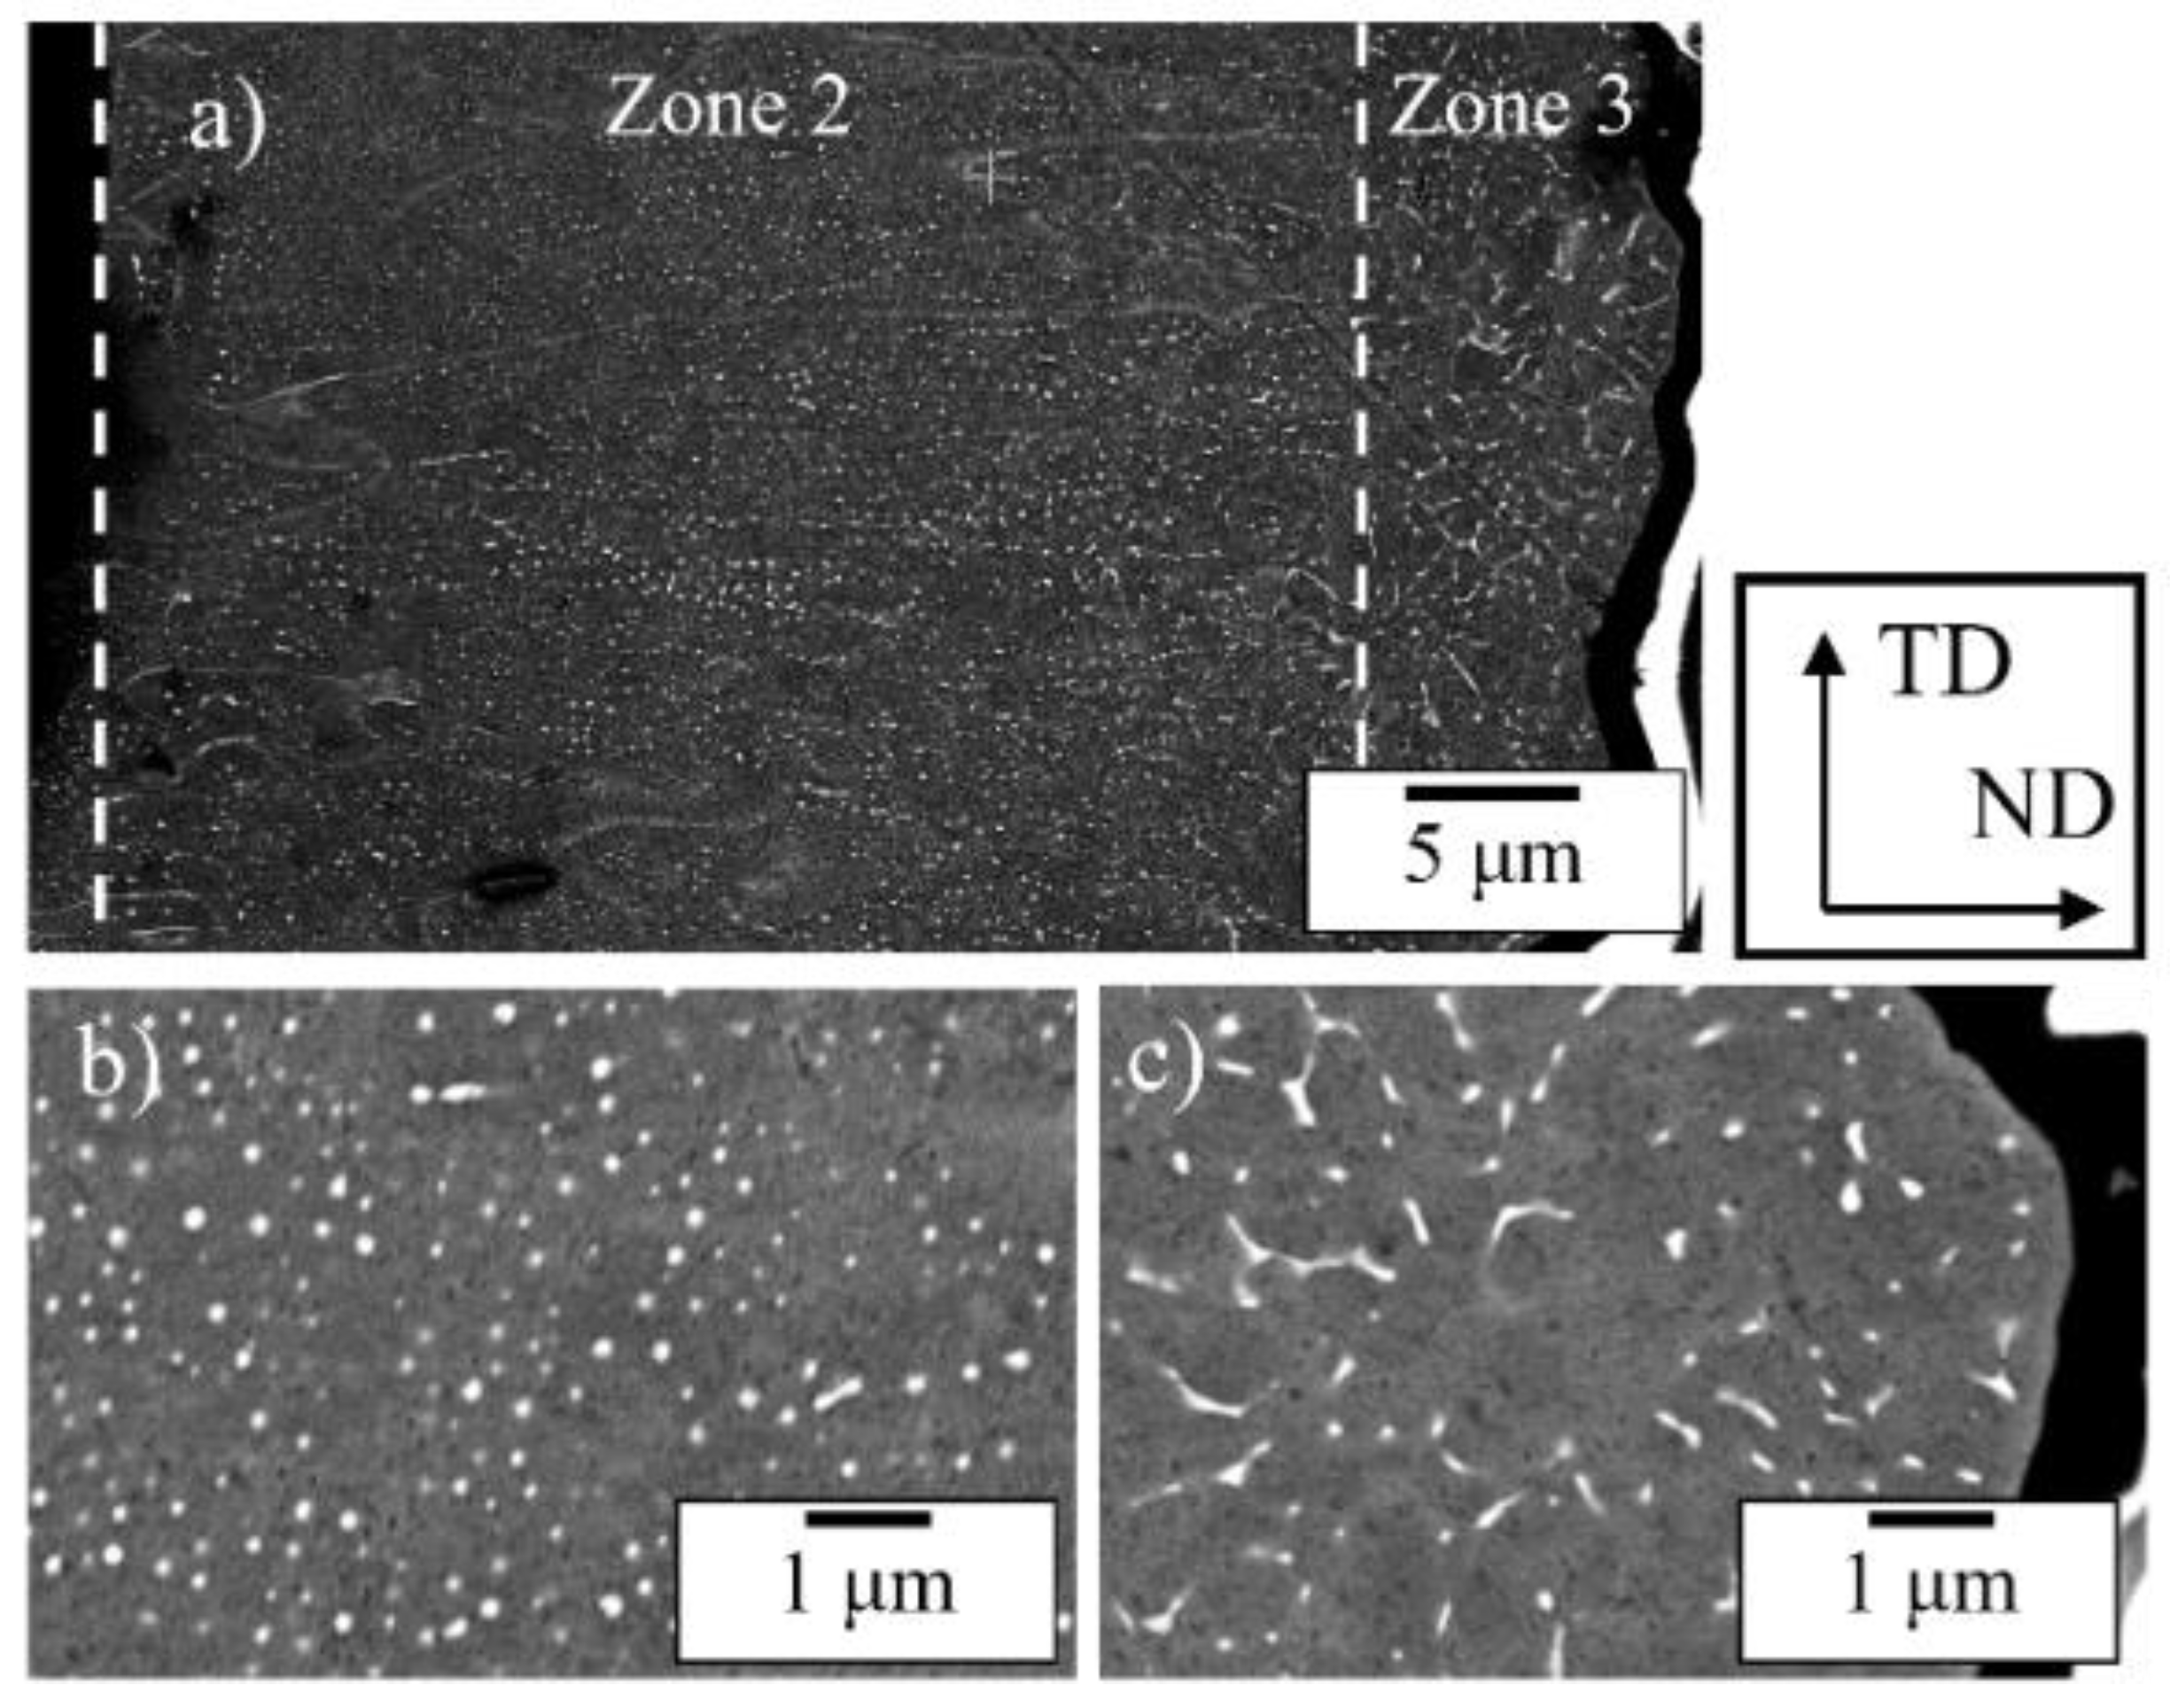
Figure 3.
(a) BF-STEM image of the region analyzed by EDS. (b–d) Elemental maps showing the distribution of Cu, Fe, and Mg. Principal directions relative to the ribbon are indicated.
Figure 3.
(a) BF-STEM image of the region analyzed by EDS. (b–d) Elemental maps showing the distribution of Cu, Fe, and Mg. Principal directions relative to the ribbon are indicated.
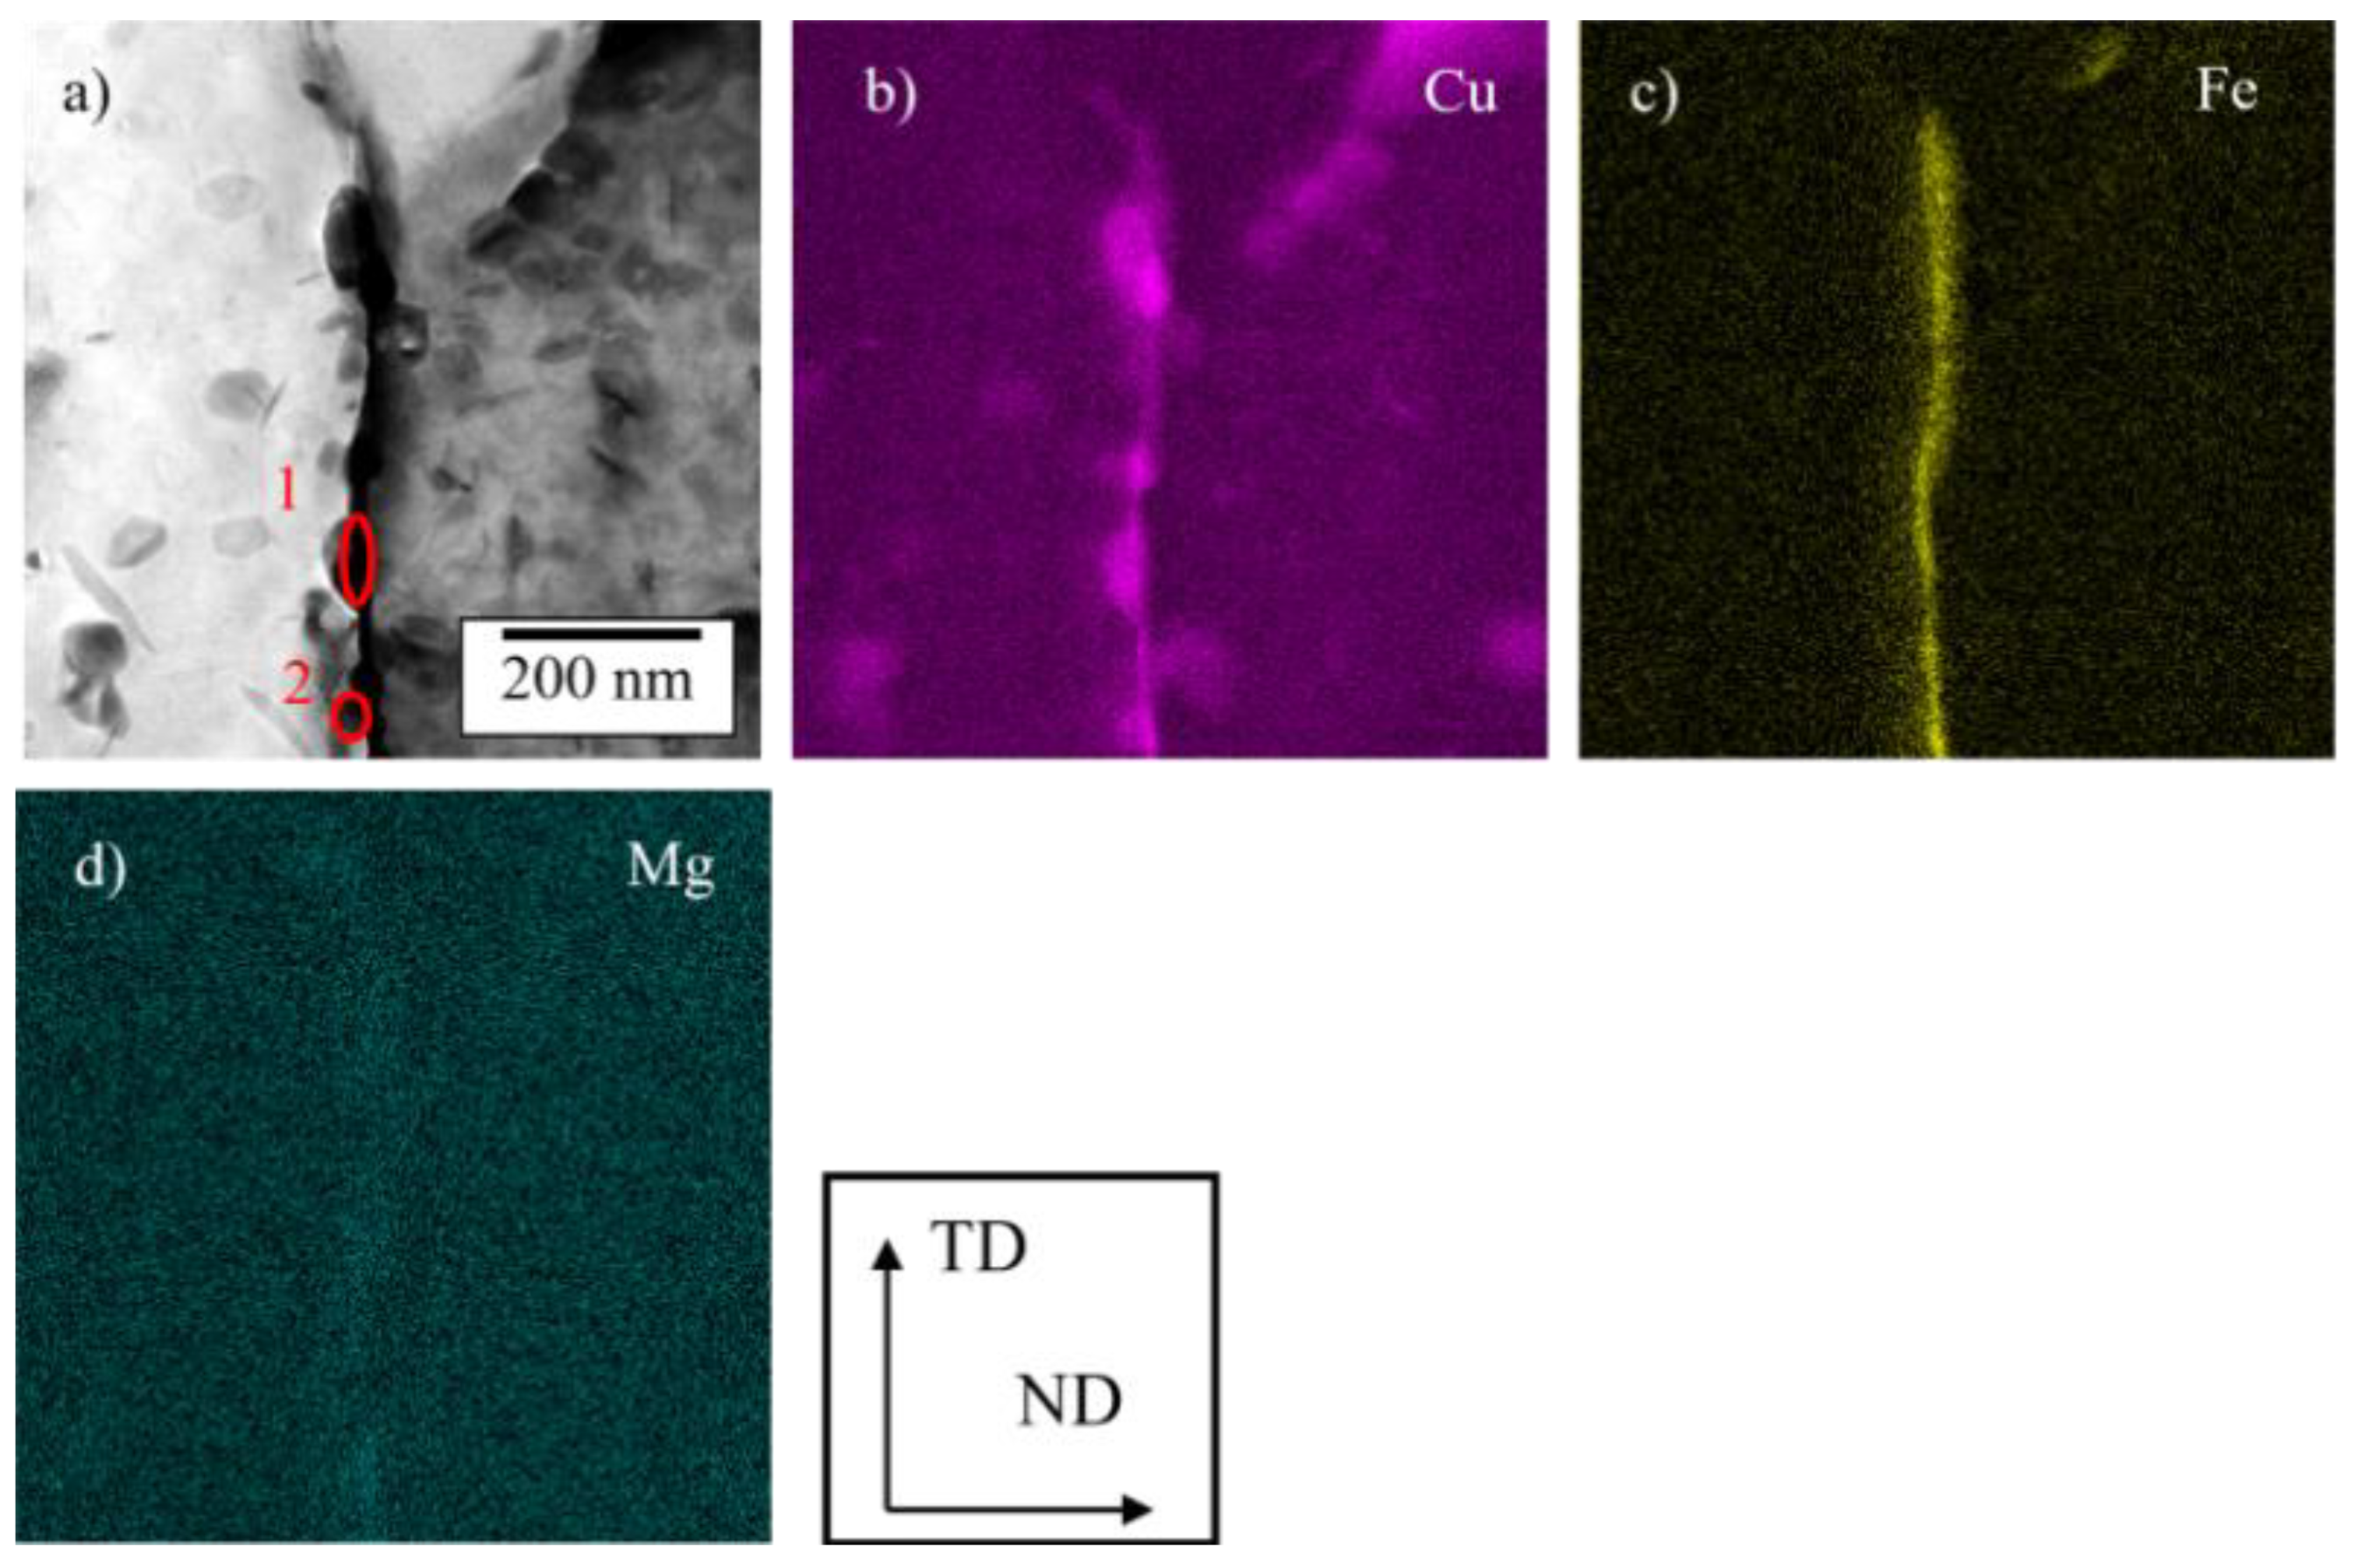
Figure 4.
(a,d) Virtual bright-field STEM images marking the locations where precession electron diffraction patterns were acquired. (b,e) Precession electron-diffraction patterns from the marked points. (c,f) Simulated diffraction patterns for Al₇Cu₂Fe and Al₂Cu (θ), respectively.
Figure 4.
(a,d) Virtual bright-field STEM images marking the locations where precession electron diffraction patterns were acquired. (b,e) Precession electron-diffraction patterns from the marked points. (c,f) Simulated diffraction patterns for Al₇Cu₂Fe and Al₂Cu (θ), respectively.
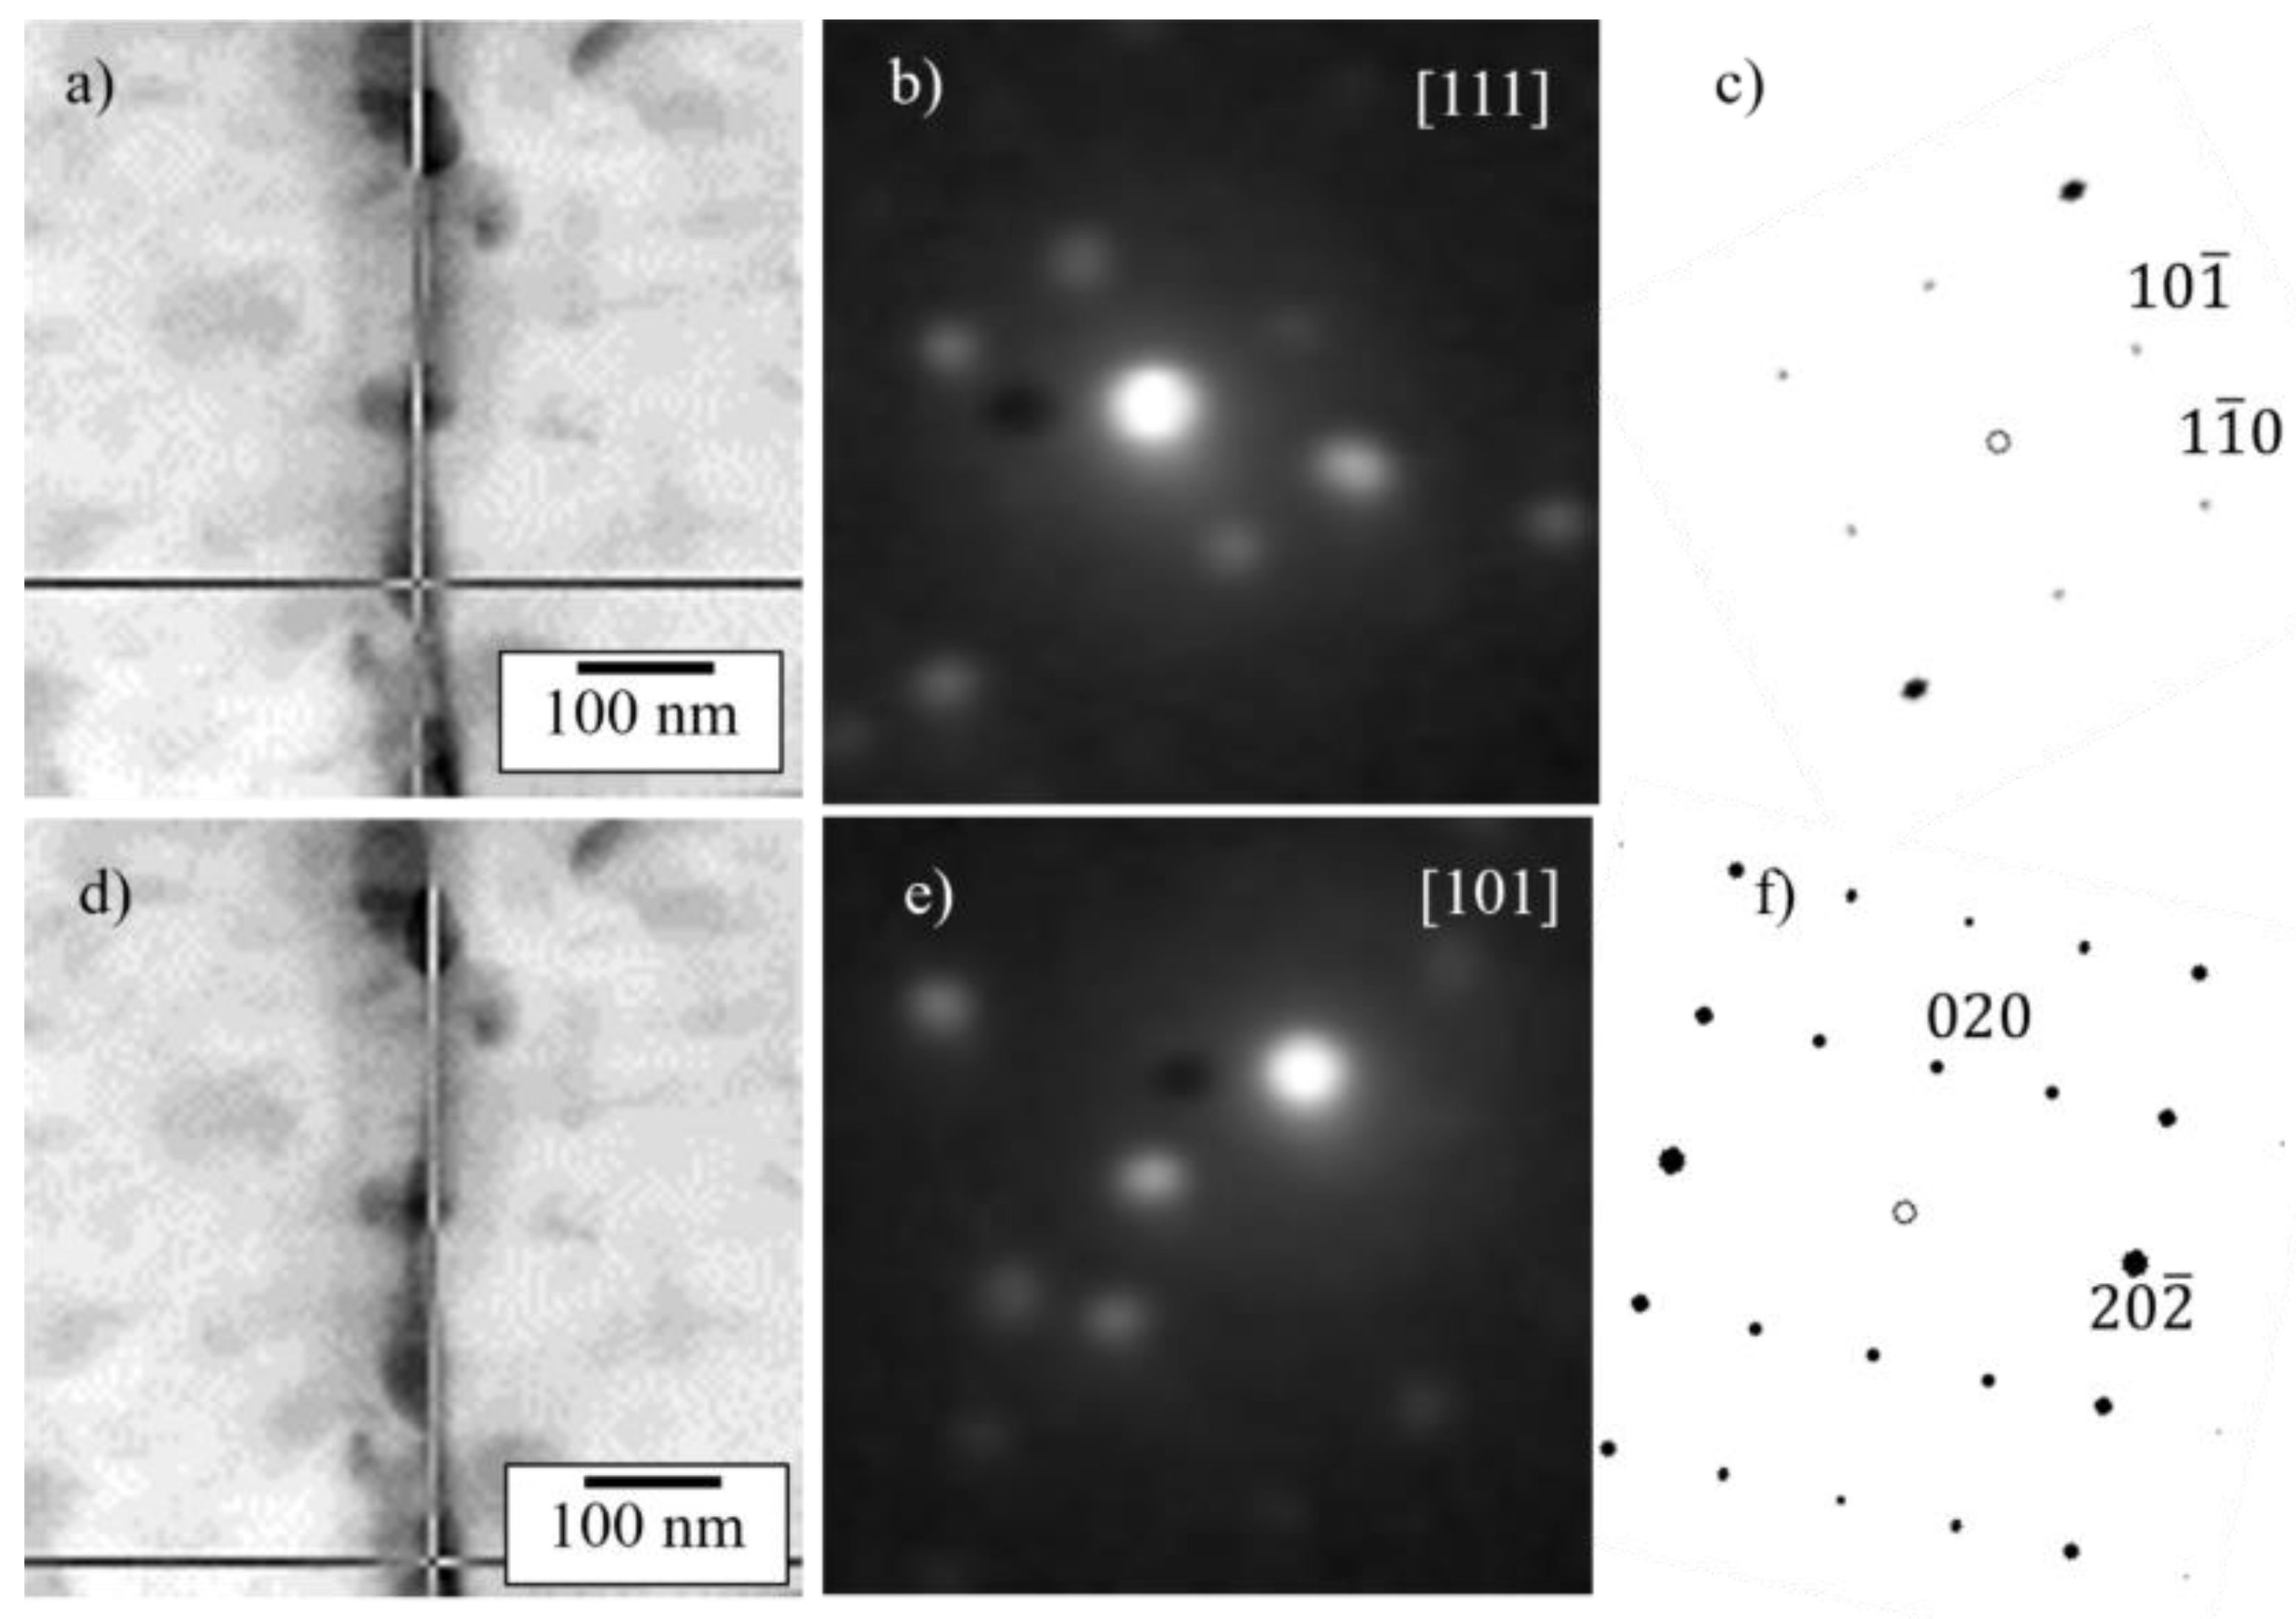
Figure 5.
(a) STEM micrograph of a cross-section near the ribbon surface. (b) In-plane section selected for in-situ annealing experiments.
Figure 5.
(a) STEM micrograph of a cross-section near the ribbon surface. (b) In-plane section selected for in-situ annealing experiments.
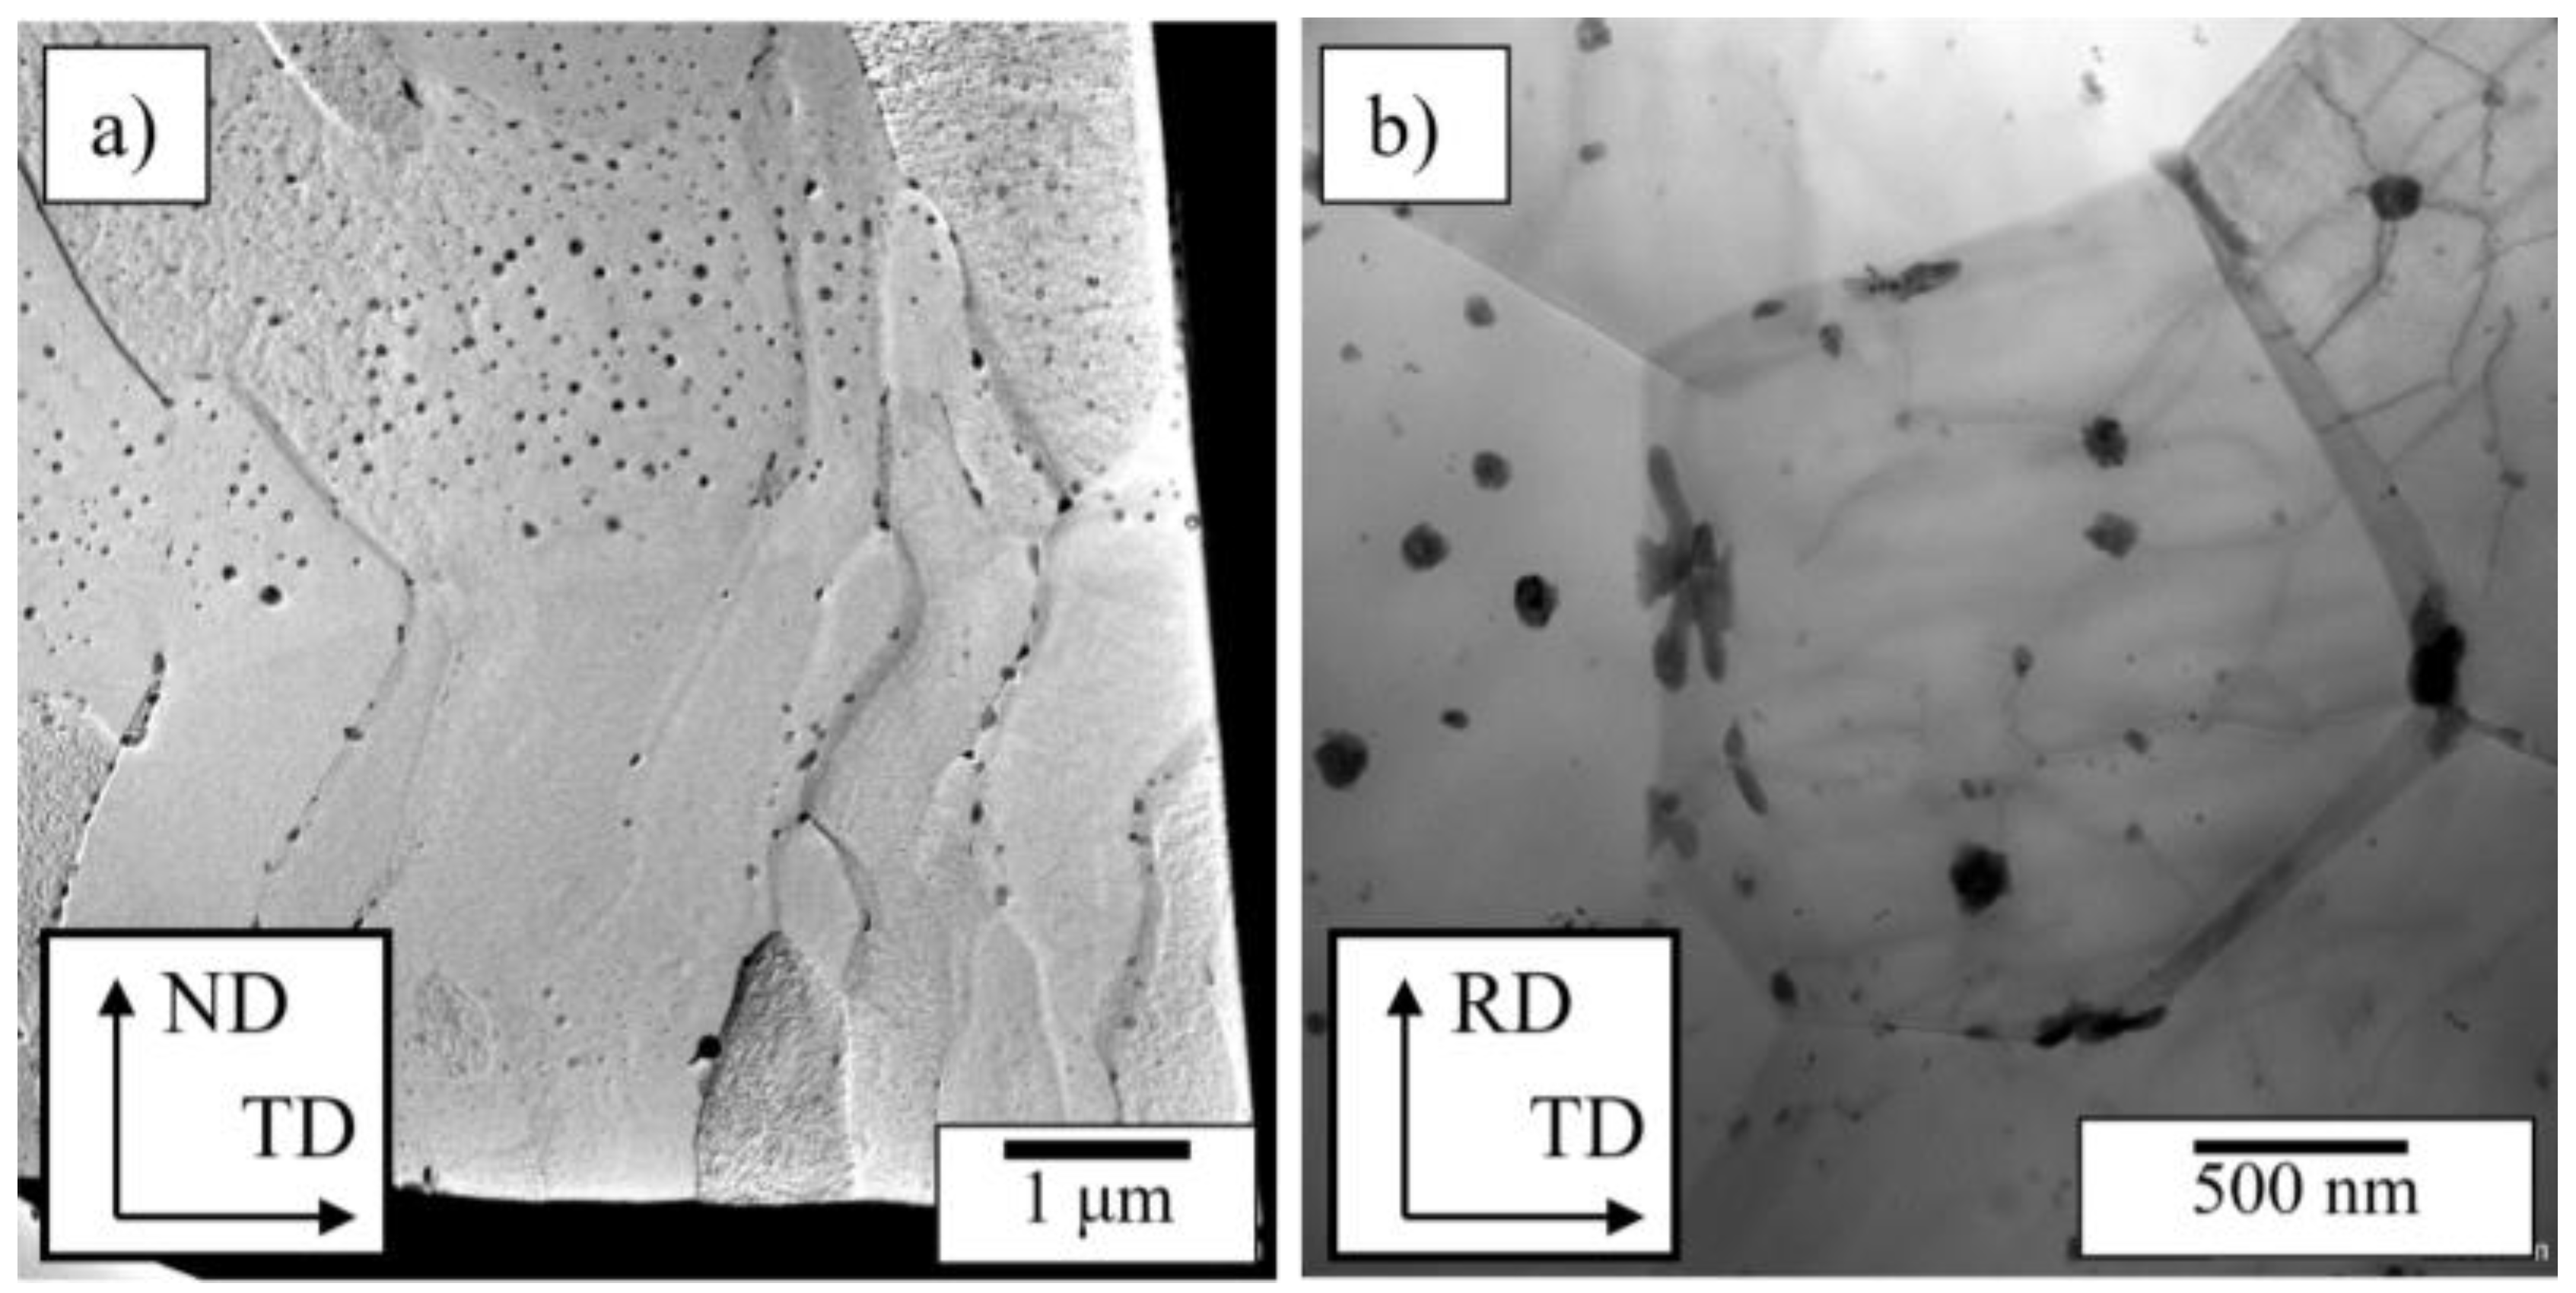
Figure 6.
(a) BF-STEM micrograph of a region of the melt-spun ribbon. (b) Enlarged inset showing Li-rich inclusions inside spherical precipitates (red circles). (c) HAADF-STEM image of the same area. (d) Corresponding Al elemental map showing negative contrast in the Li-rich regions.
Figure 6.
(a) BF-STEM micrograph of a region of the melt-spun ribbon. (b) Enlarged inset showing Li-rich inclusions inside spherical precipitates (red circles). (c) HAADF-STEM image of the same area. (d) Corresponding Al elemental map showing negative contrast in the Li-rich regions.
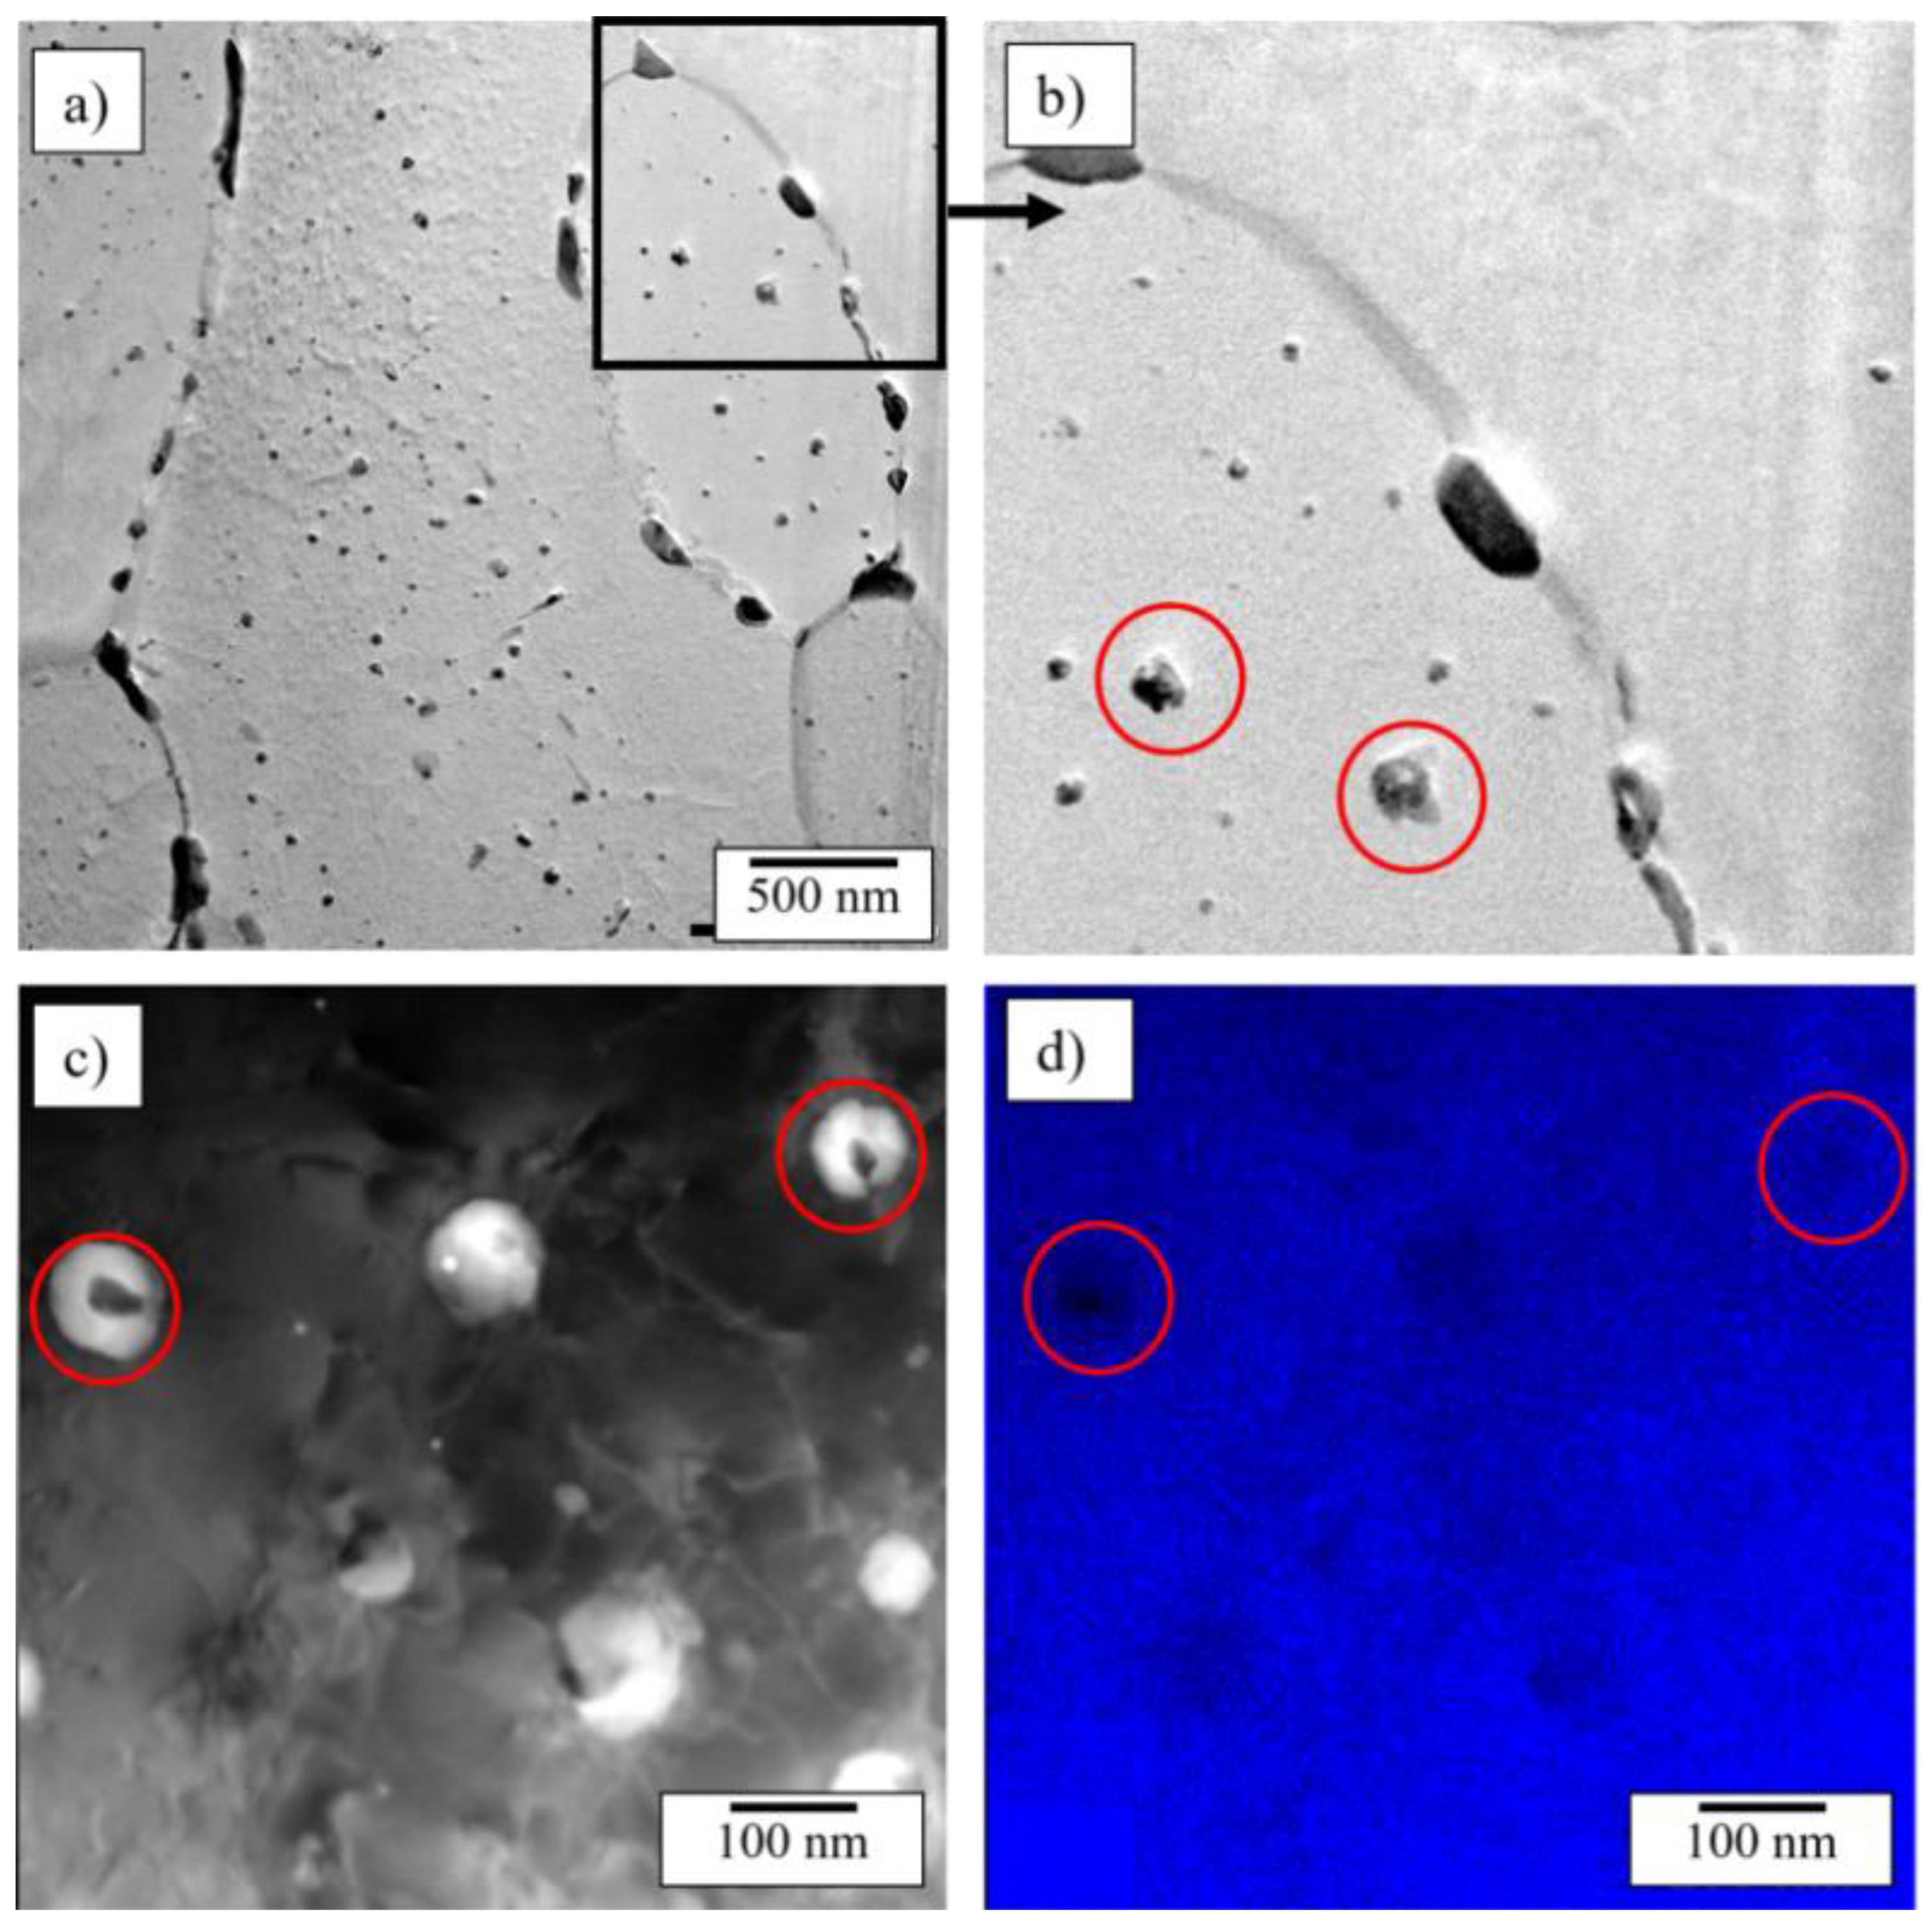
Figure 7.
Resistivity evolution (blue) and resistivity spectrum (red) of the melt-spun ribbons, with the spectrum of pure Al shown for comparison (black).
Figure 7.
Resistivity evolution (blue) and resistivity spectrum (red) of the melt-spun ribbons, with the spectrum of pure Al shown for comparison (black).
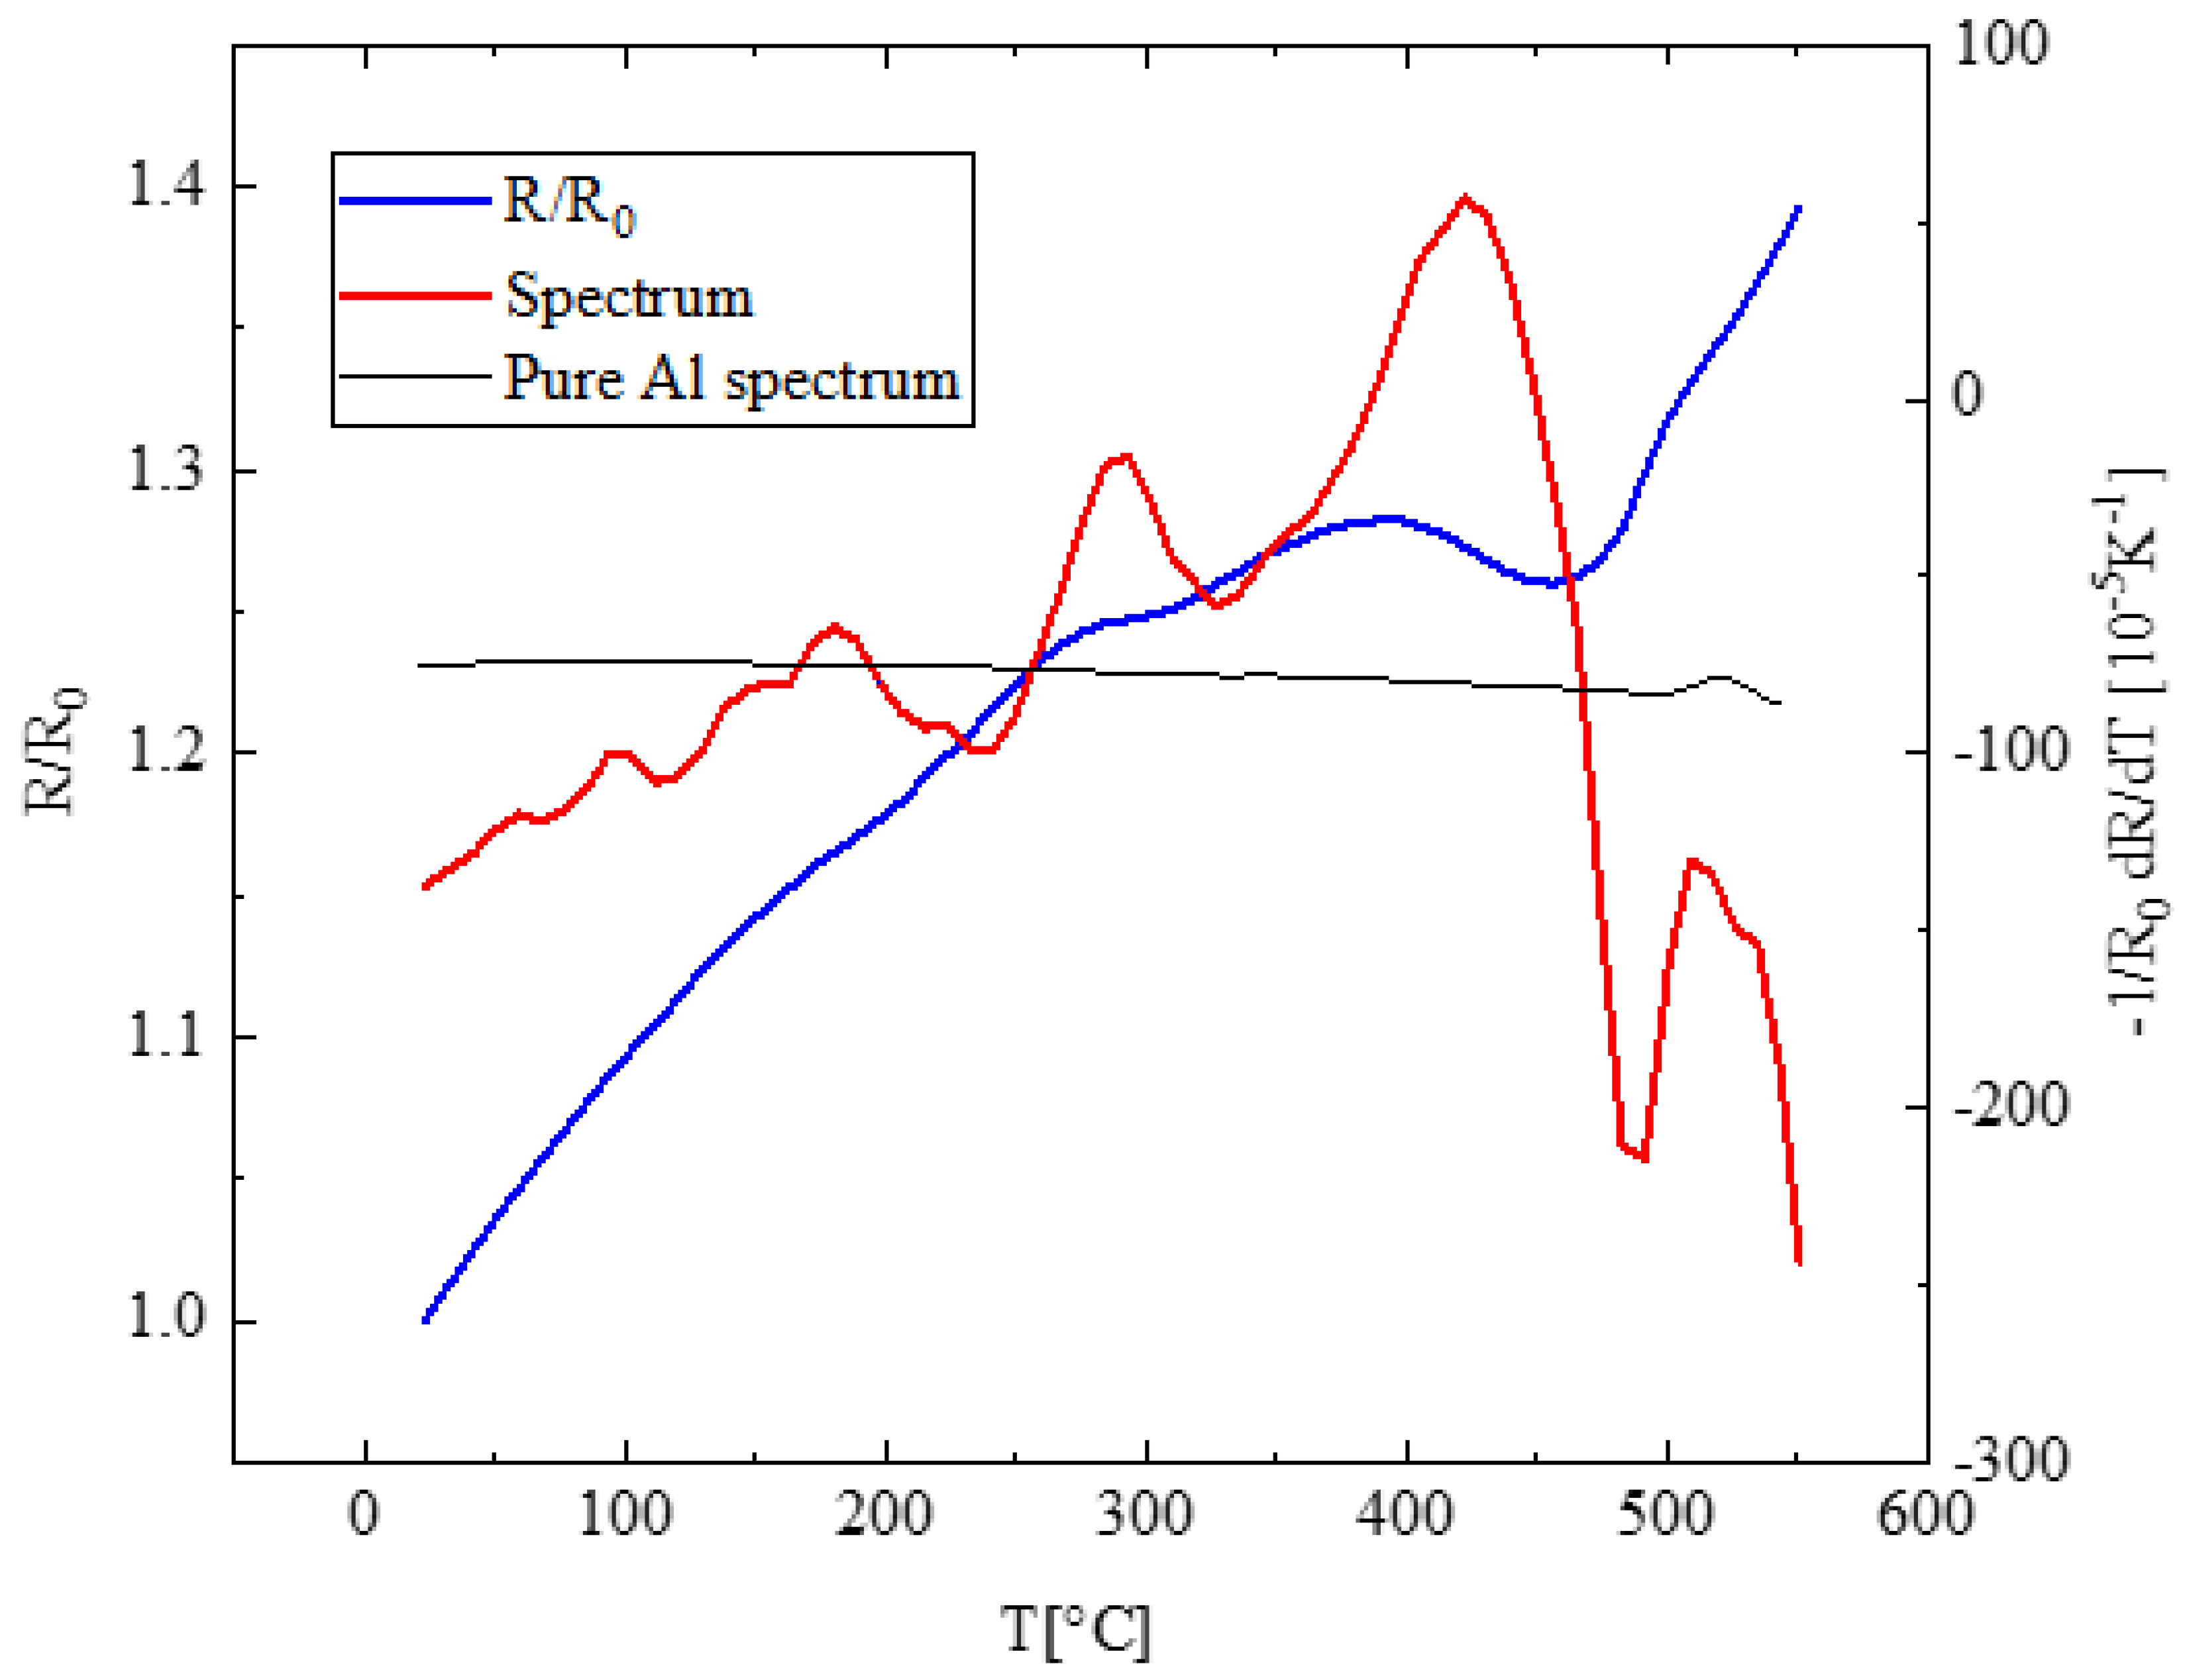
Figure 8.
Microstructural evolution of a selected Zone 2 region during in-situ STEM annealing between 200 °C and 550 °C.
Figure 8.
Microstructural evolution of a selected Zone 2 region during in-situ STEM annealing between 200 °C and 550 °C.
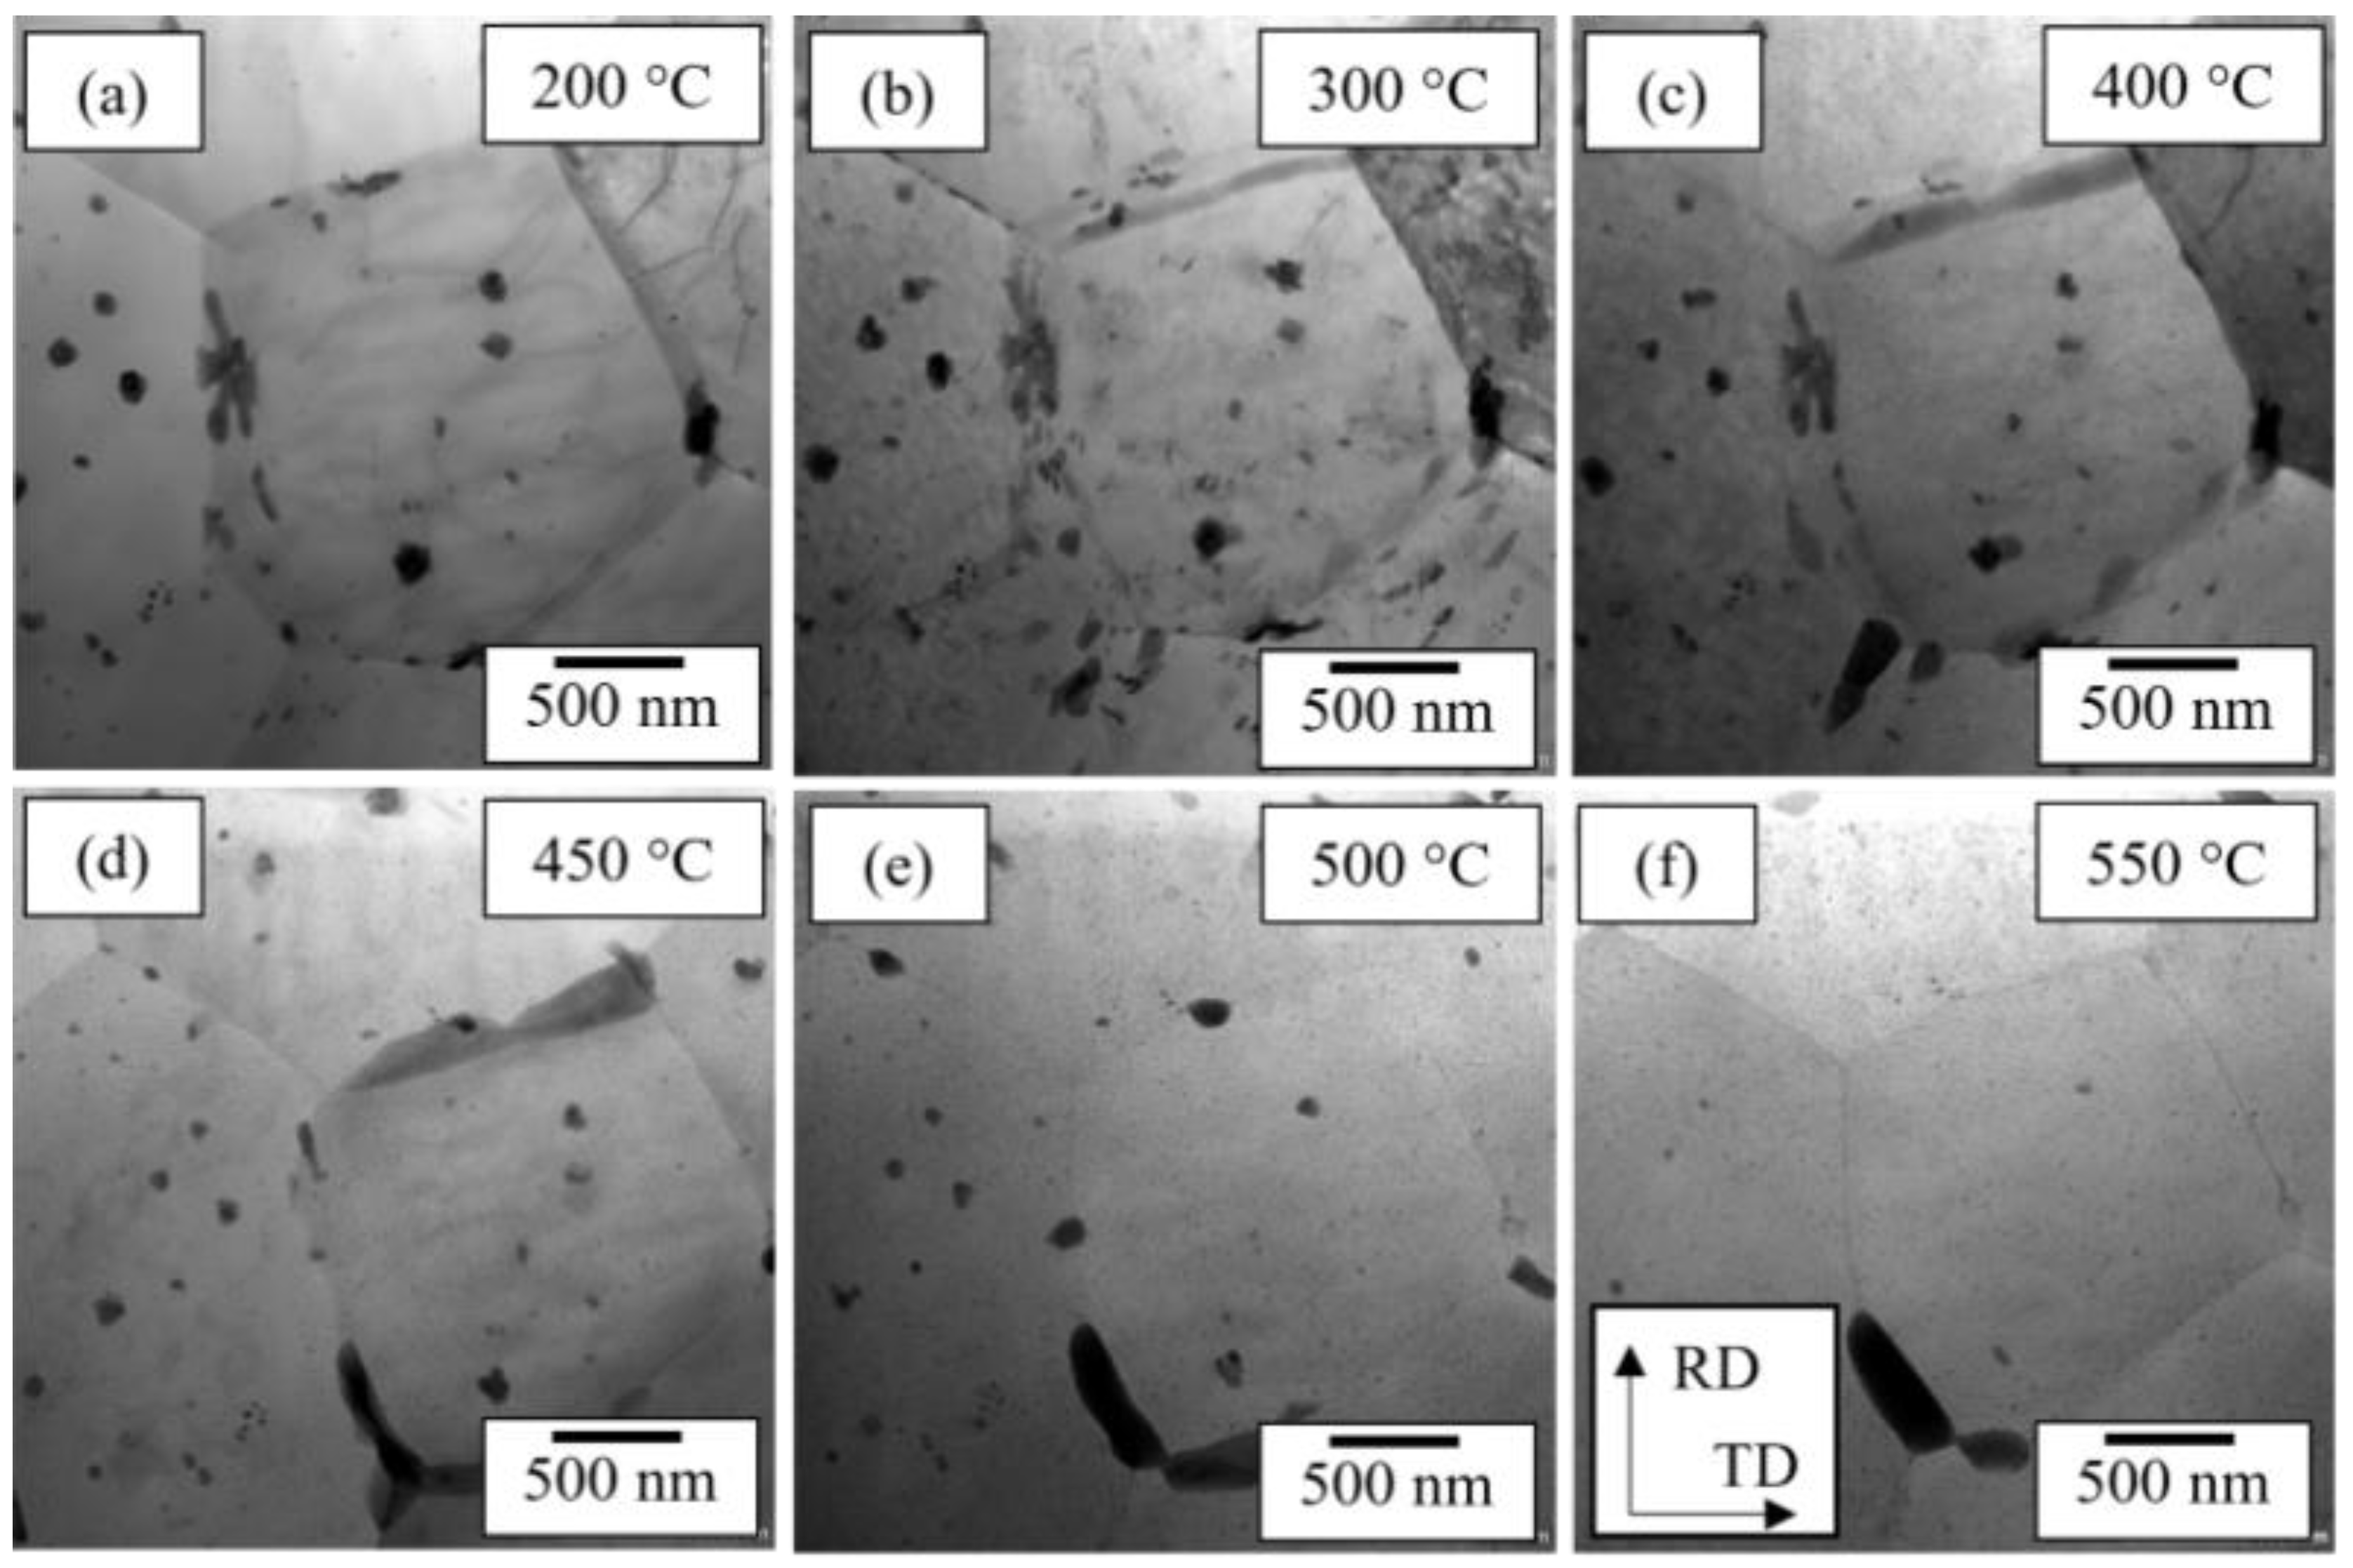
Figure 9.
Al₃(Sc,Zr) particles at 500 °C during in-situ annealing: (a) overview of the analyzed area, (b) magnified view of the zone containing dispersion of Al₃(Sc,Zr) particles.
Figure 9.
Al₃(Sc,Zr) particles at 500 °C during in-situ annealing: (a) overview of the analyzed area, (b) magnified view of the zone containing dispersion of Al₃(Sc,Zr) particles.
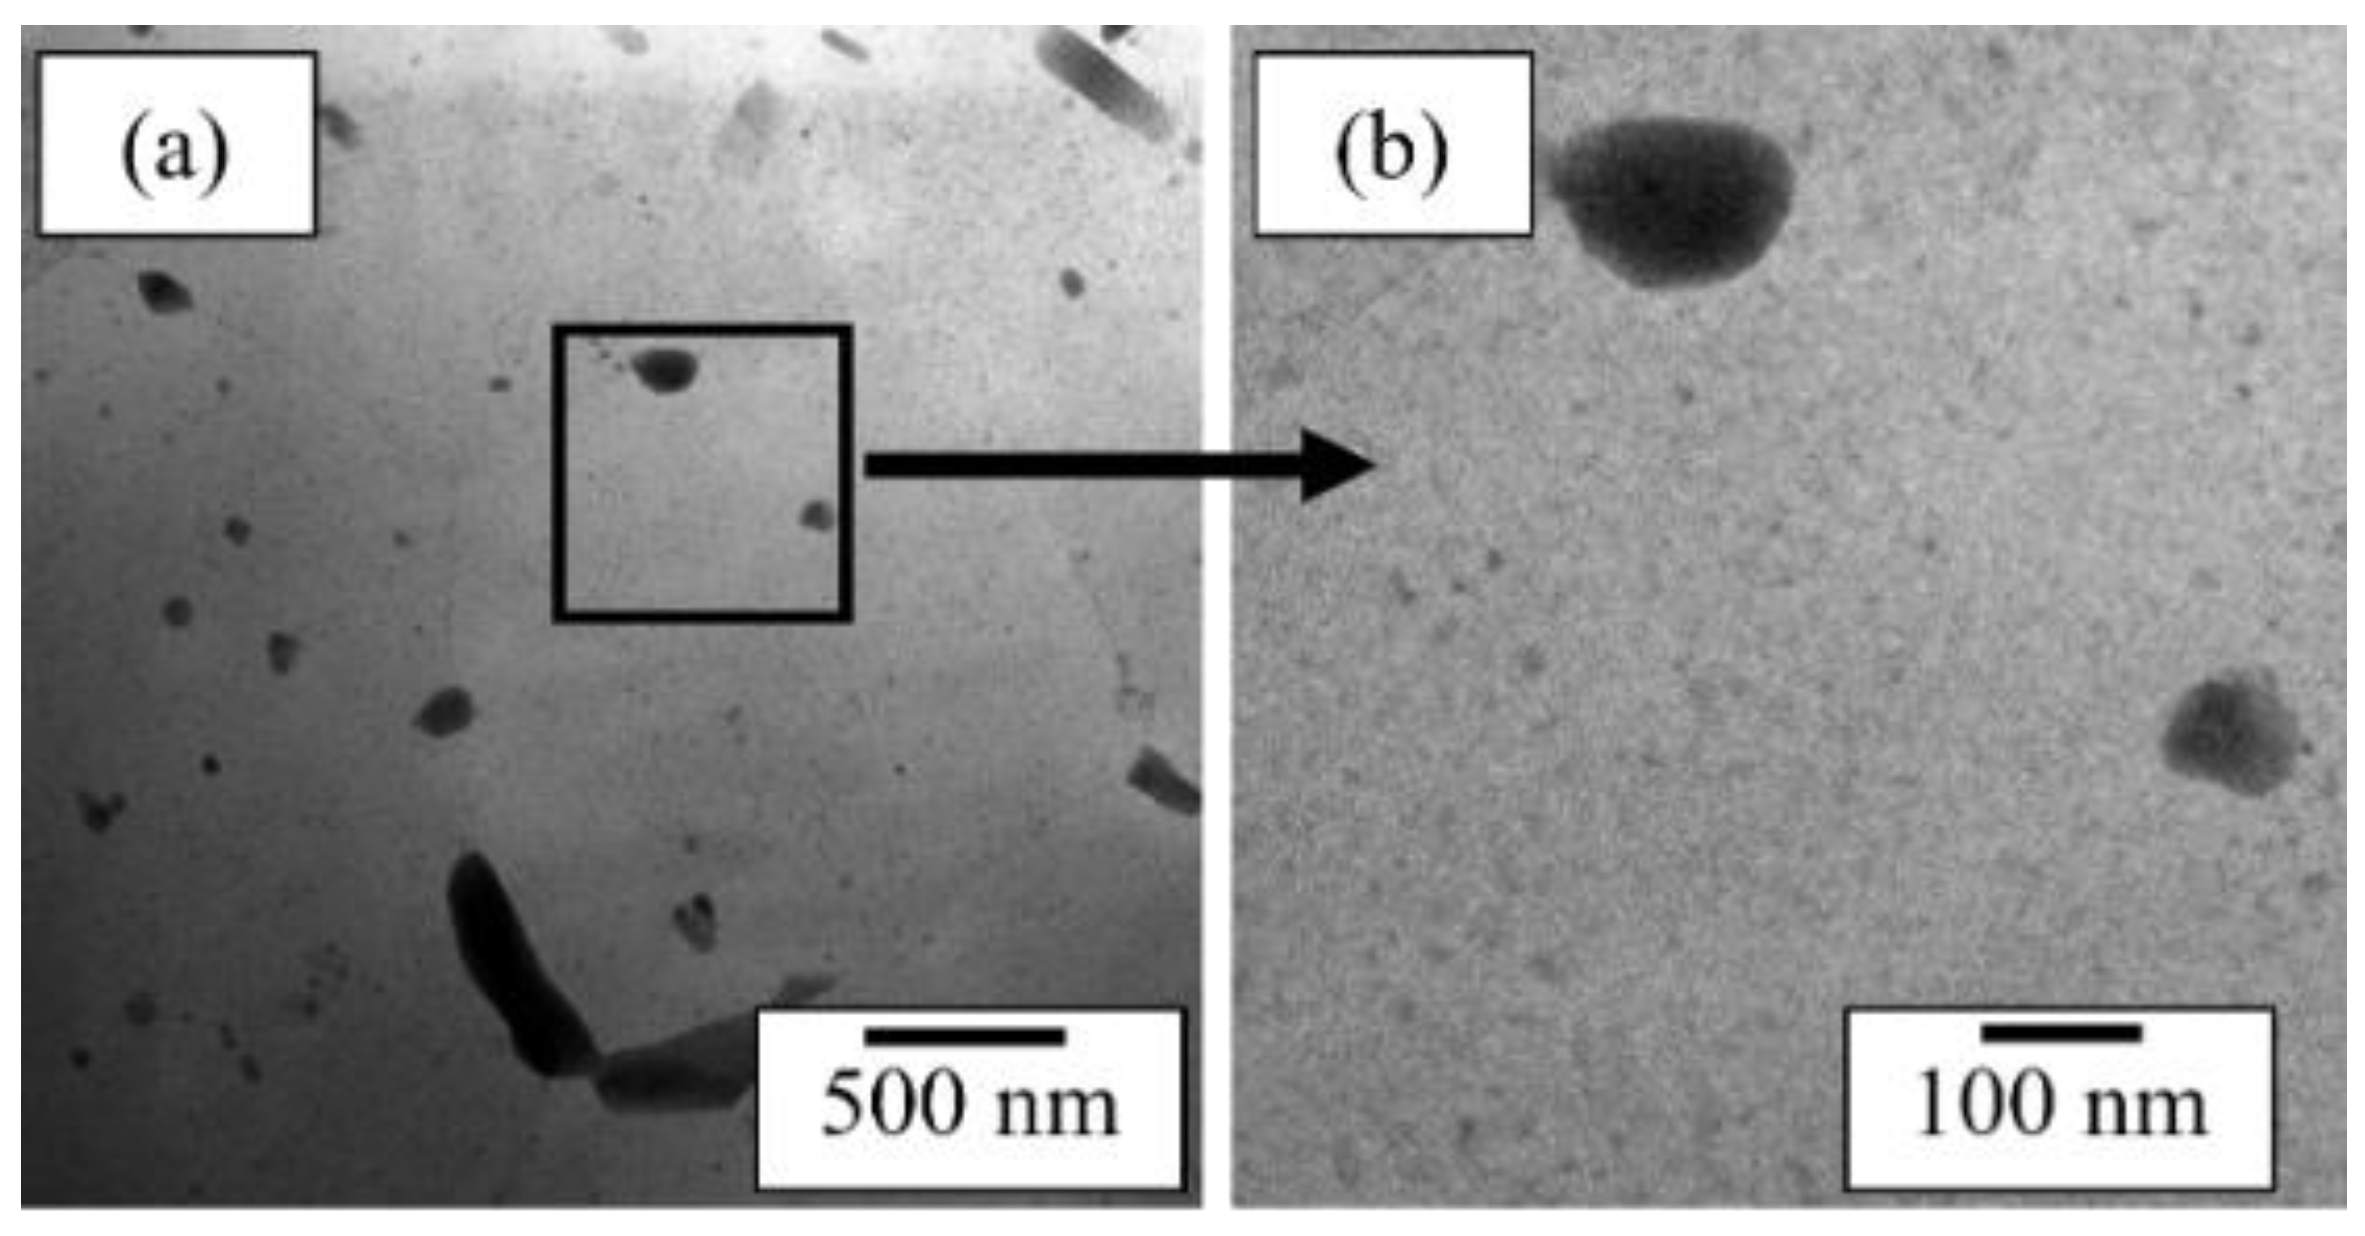
Figure 10.
(a) HAADF-STEM micrograph of Al₃(Sc,Zr) precipitates after 80 min of in-situ annealing at 520 °C. (b) EDS maps showing Sc-rich core and Zr-rich shell in a representative particle.
Figure 10.
(a) HAADF-STEM micrograph of Al₃(Sc,Zr) precipitates after 80 min of in-situ annealing at 520 °C. (b) EDS maps showing Sc-rich core and Zr-rich shell in a representative particle.
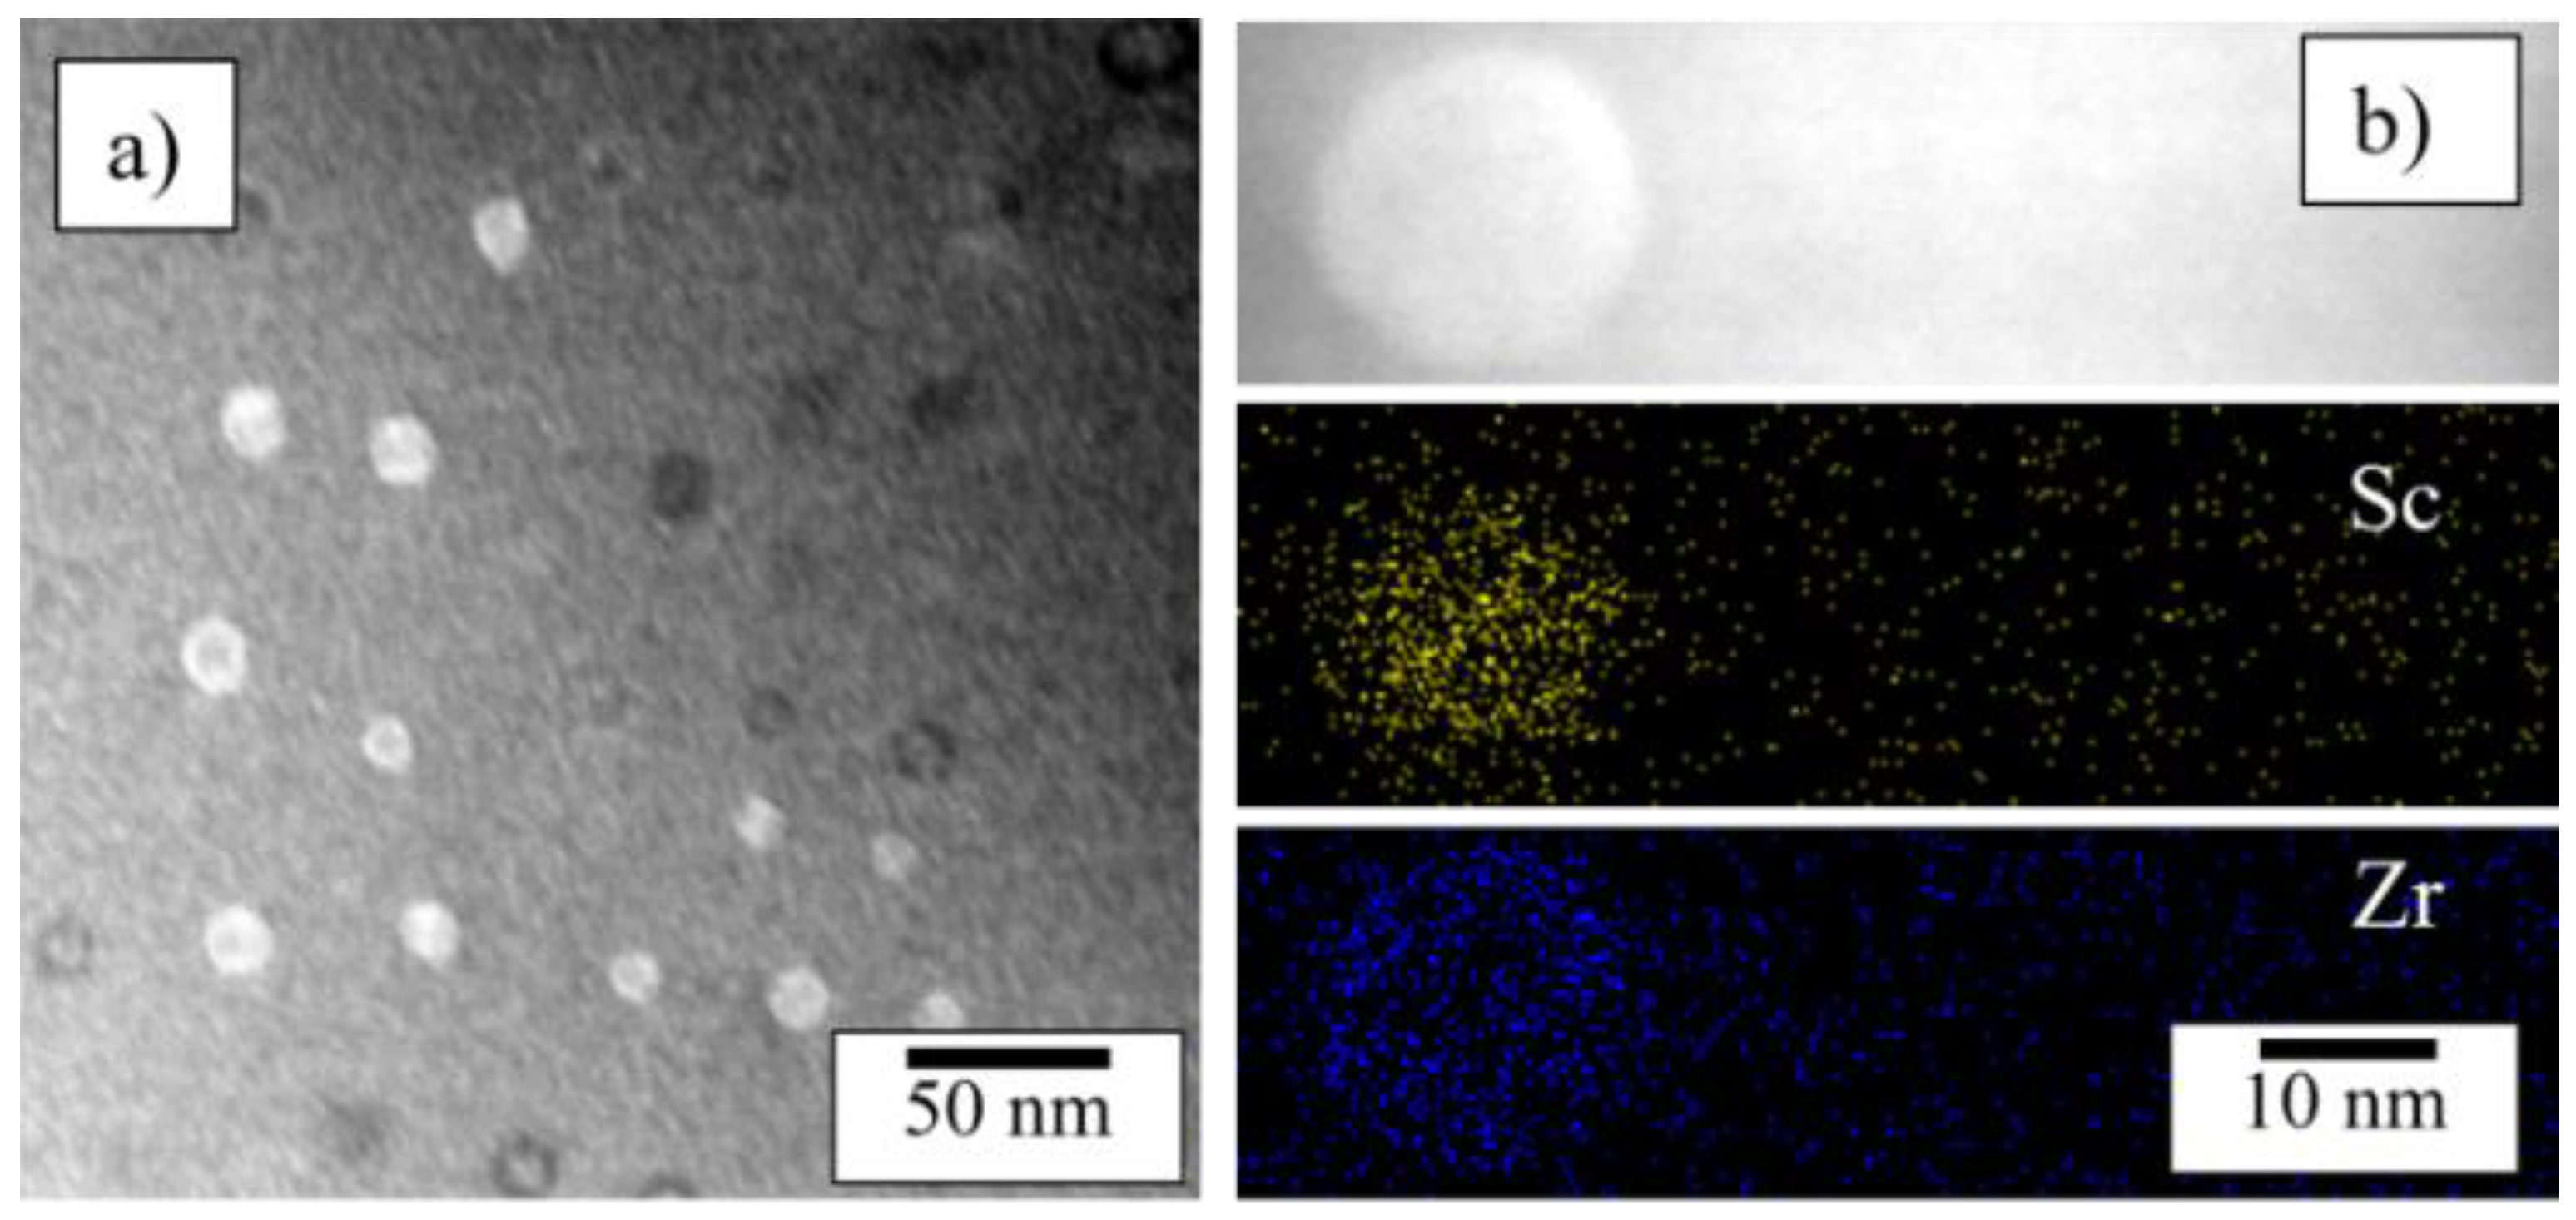
Figure 11.
(a) HAADF-STEM image of the analyzed region after in-situ annealing and cooling. (b–d) EDS maps showing Cu, Fe, and Mg distributions.
Figure 11.
(a) HAADF-STEM image of the analyzed region after in-situ annealing and cooling. (b–d) EDS maps showing Cu, Fe, and Mg distributions.
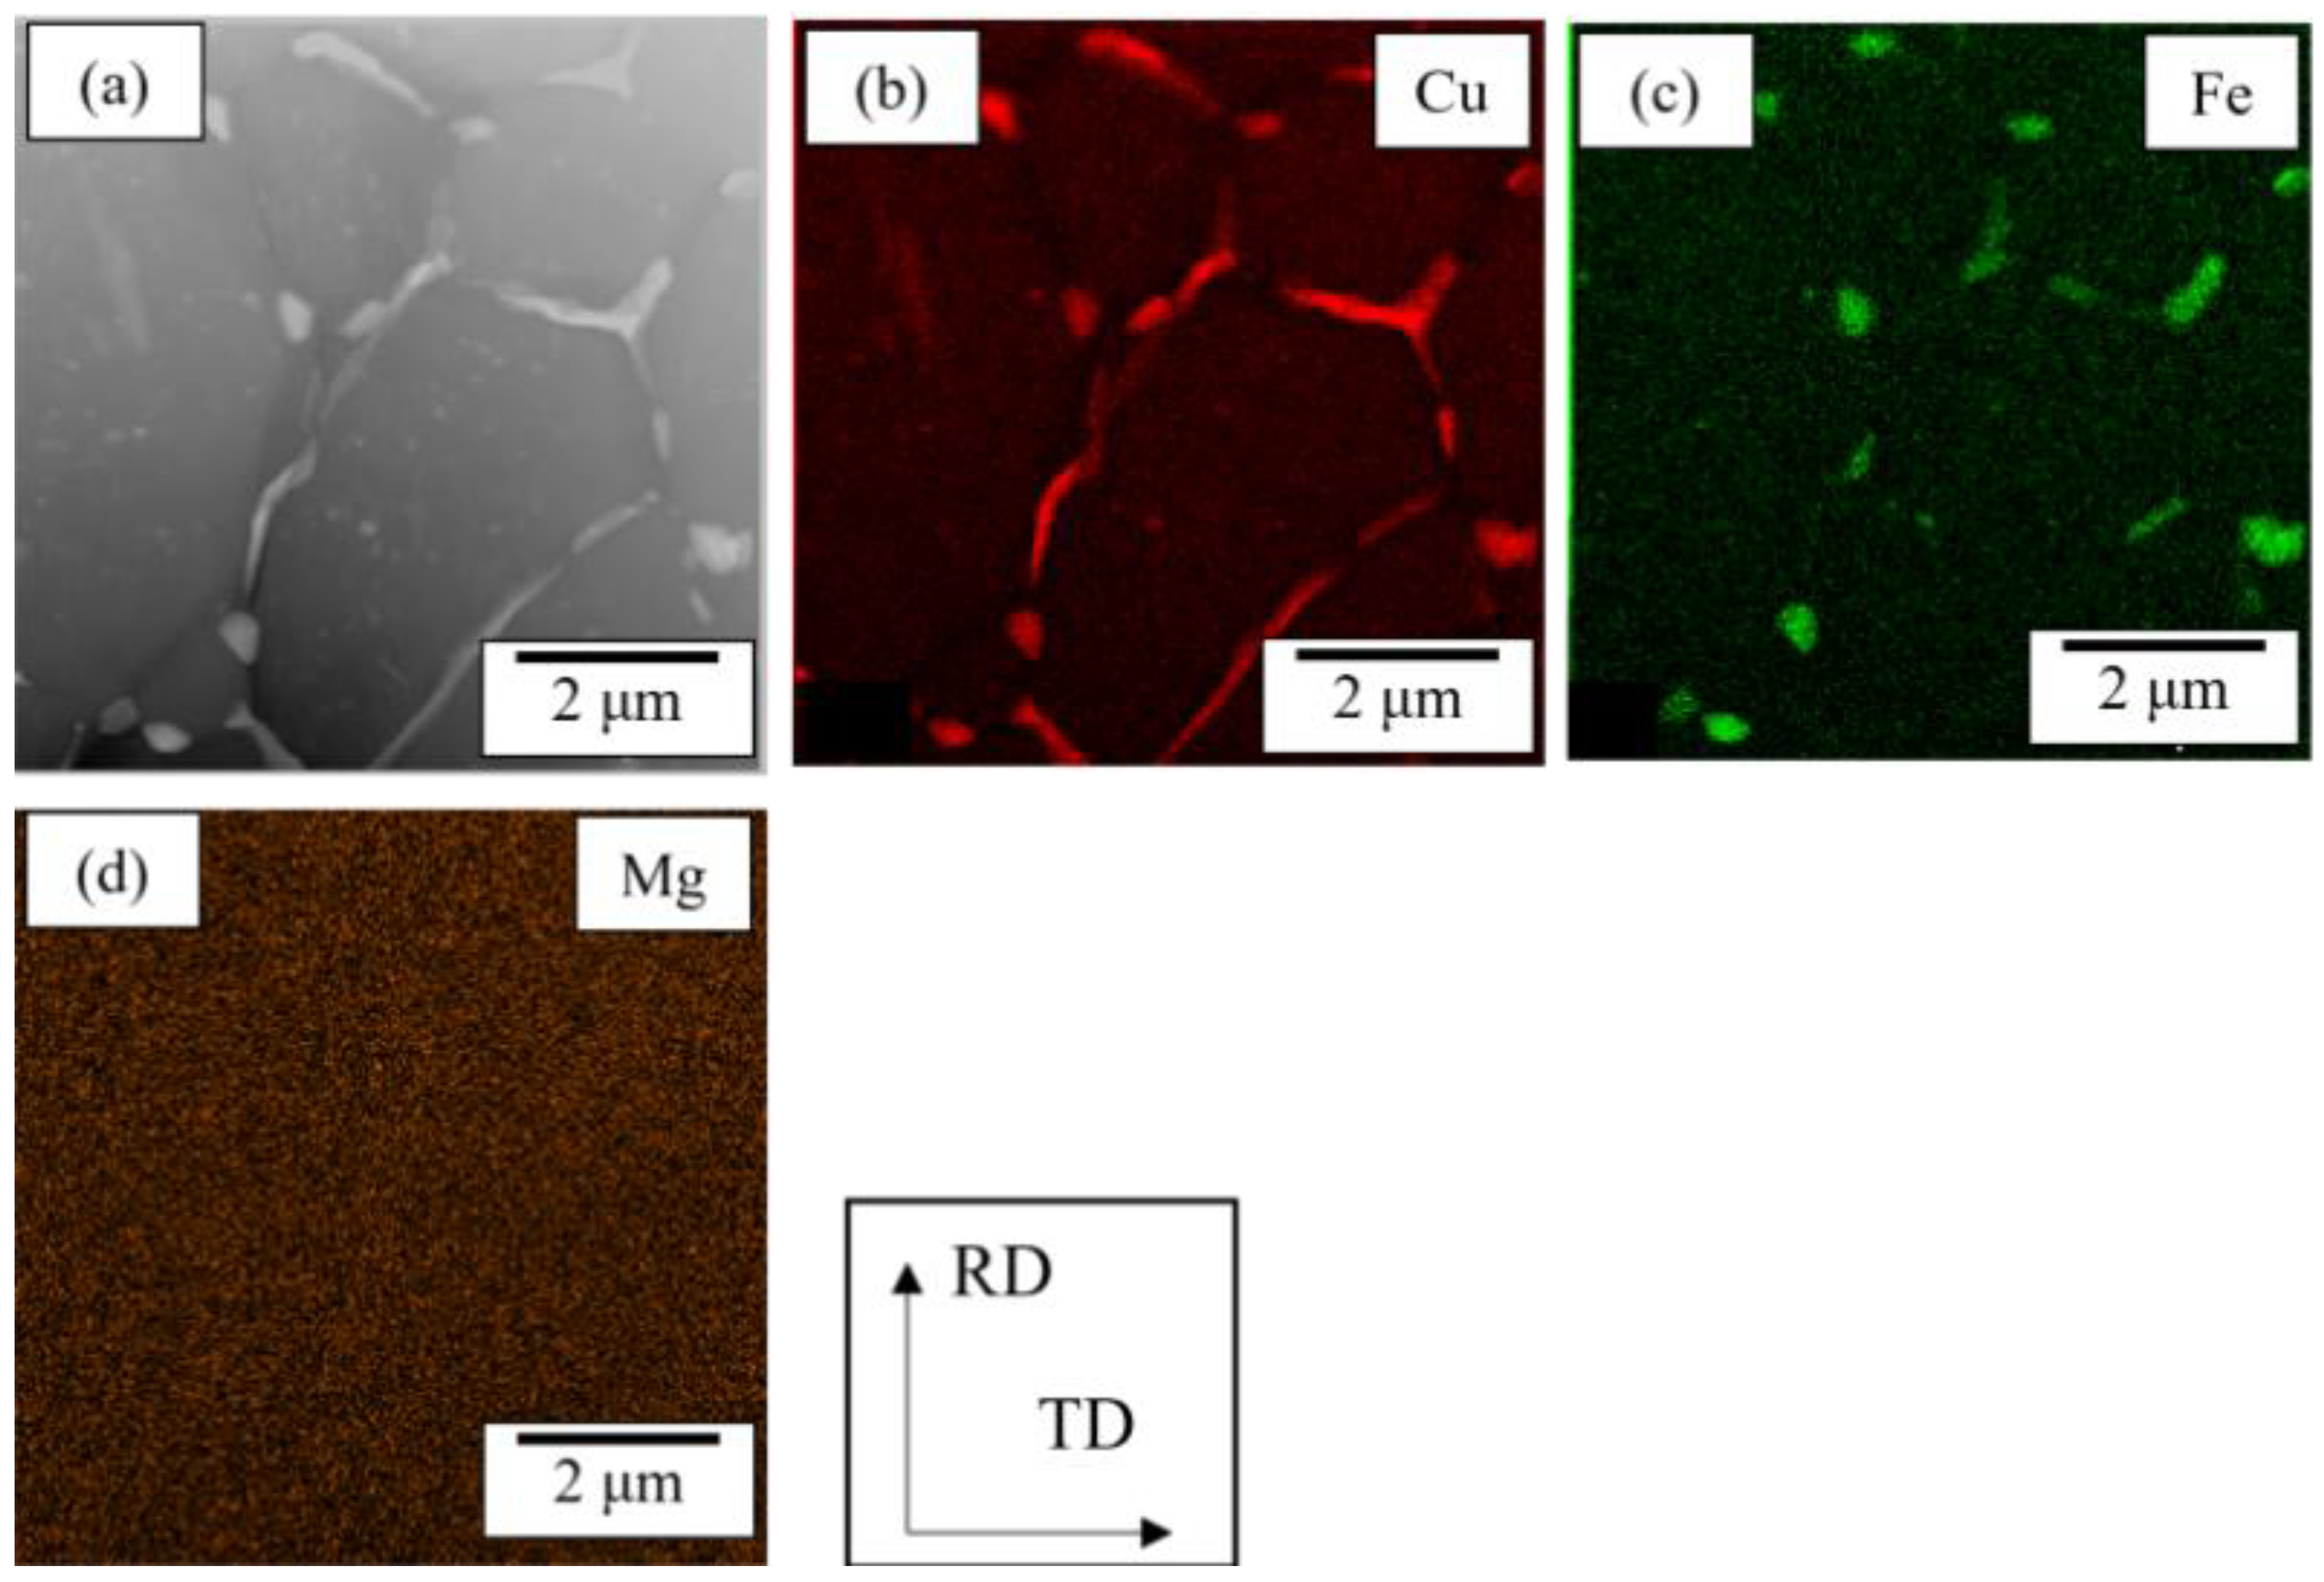
Figure 12.
BF-TEM images of Cu-rich (a) and Fe-rich (d) regions selected for SAED; SAED patterns (b,e) and matching simulated diffraction patterns for Al₂Cu (c) and Al₇Cu₂Fe (f).
Figure 12.
BF-TEM images of Cu-rich (a) and Fe-rich (d) regions selected for SAED; SAED patterns (b,e) and matching simulated diffraction patterns for Al₂Cu (c) and Al₇Cu₂Fe (f).
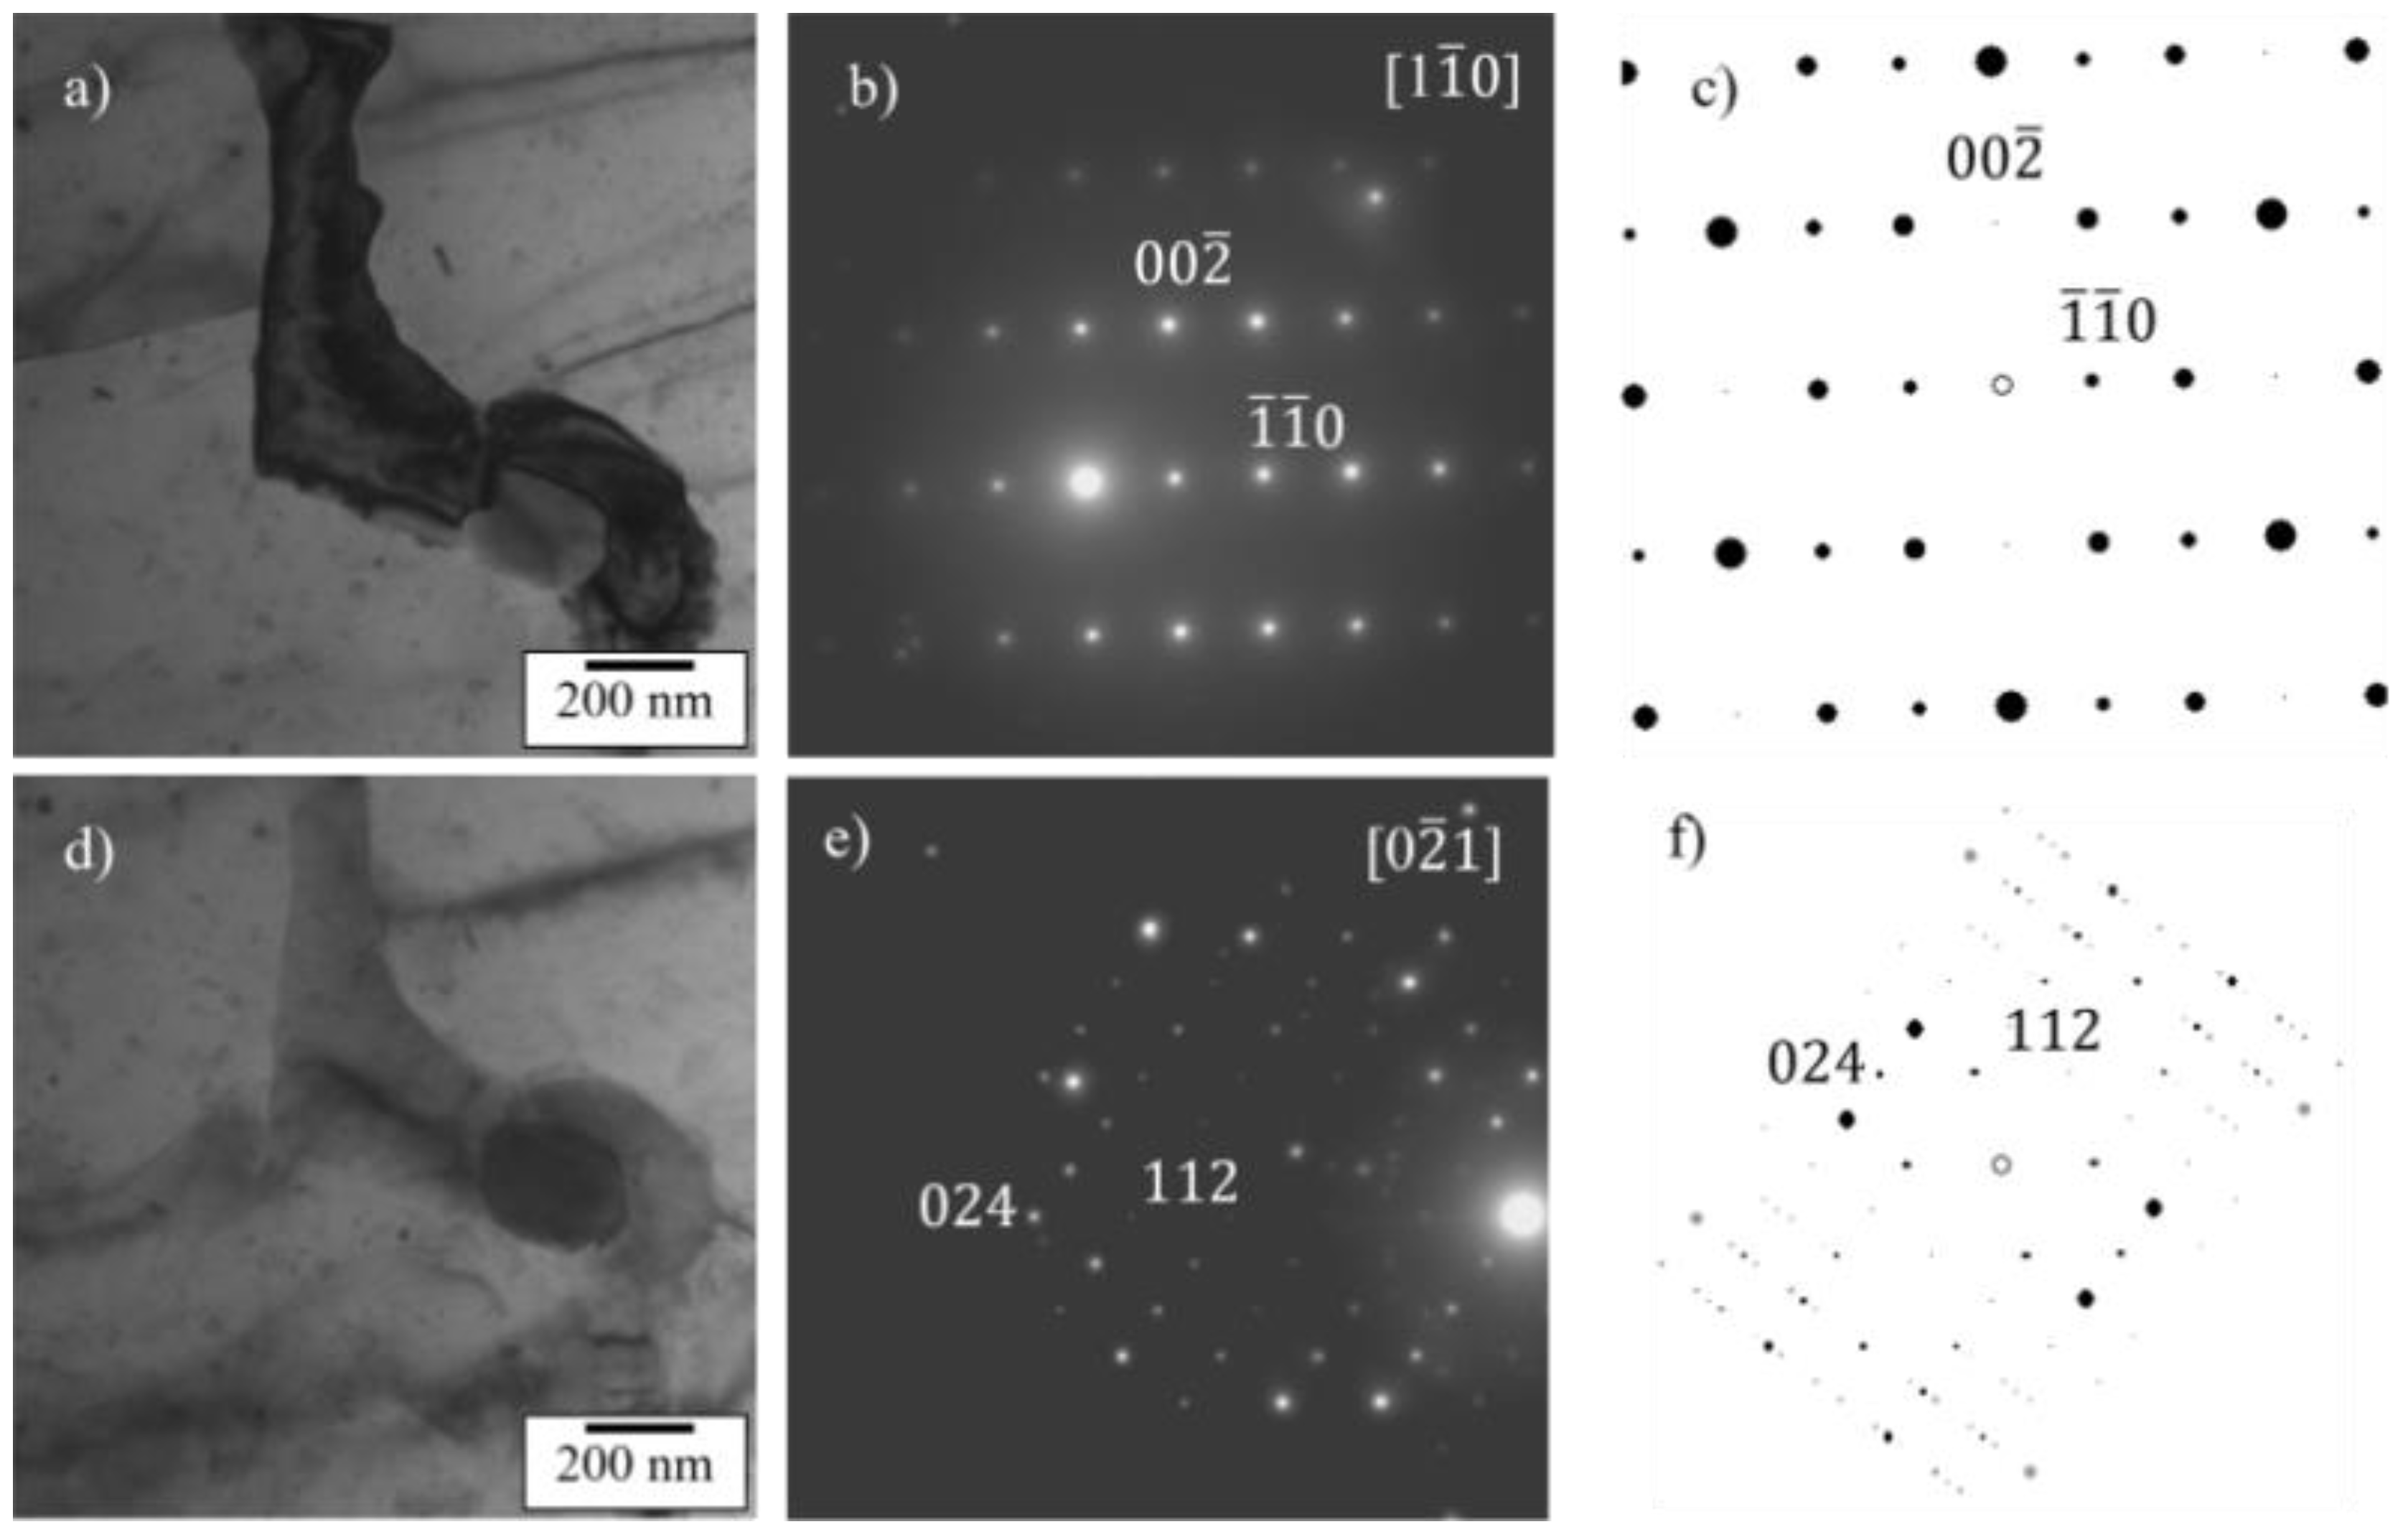
Figure 13.
BSE micrograph of the ribbon cross-section after the model homogenization annealing procedure.
Figure 13.
BSE micrograph of the ribbon cross-section after the model homogenization annealing procedure.
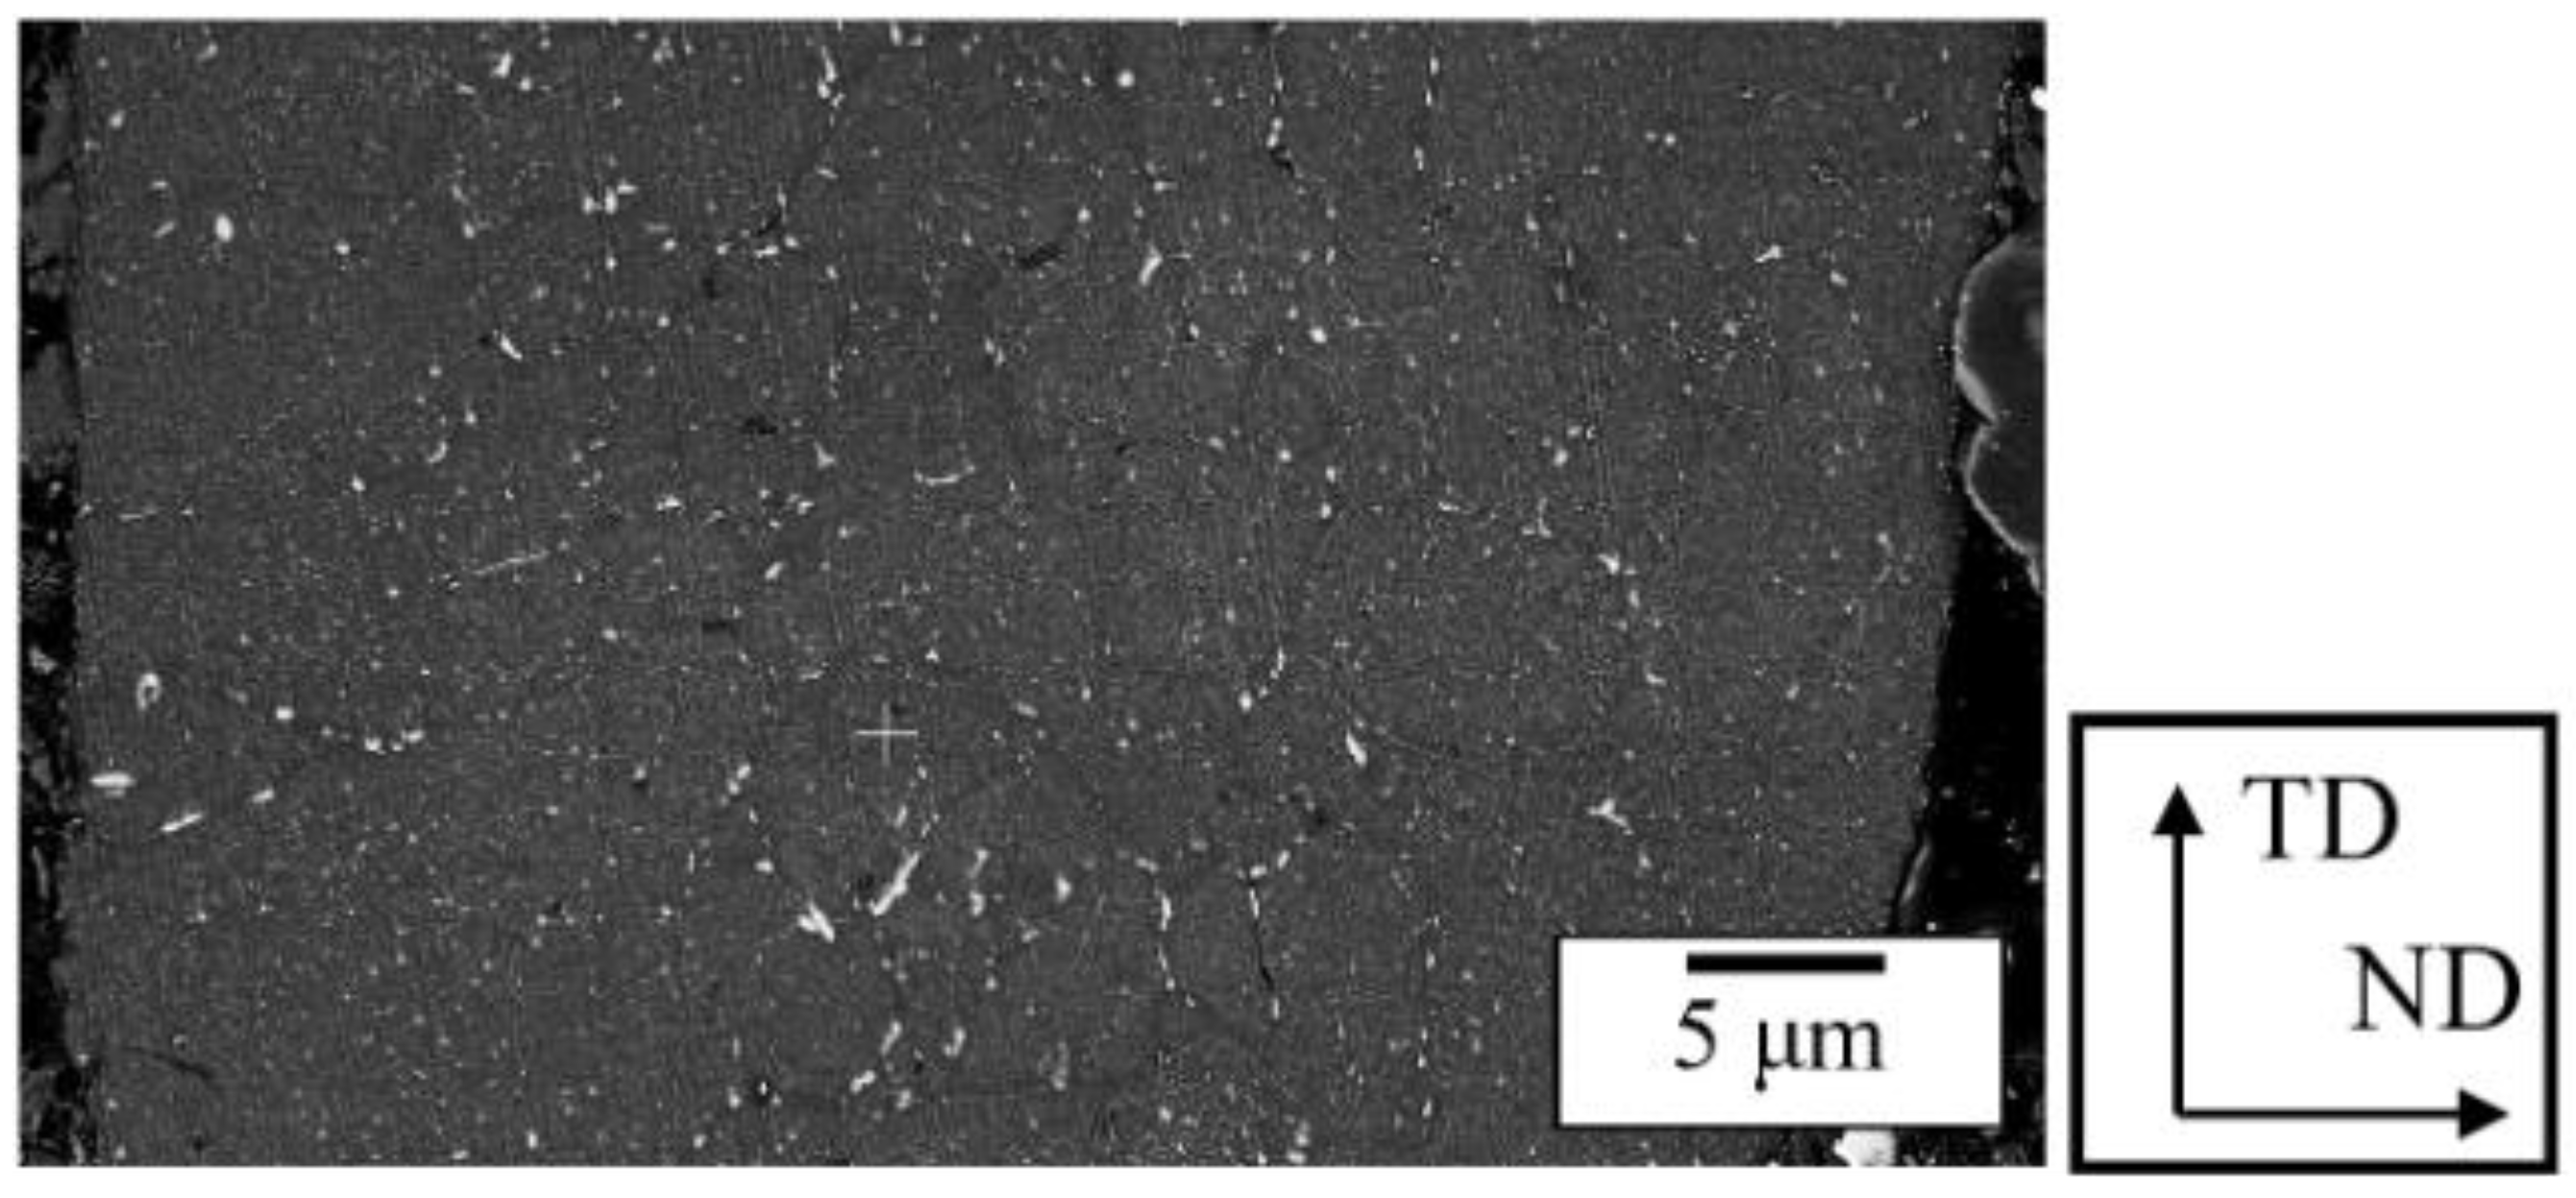
Figure 14.
STEM-EDS mapping of an ex-situ annealed ribbon. (a) BF-STEM micrograph of the mapped area. (b–d) Elemental maps of Cu, Fe, and Mg.
Figure 14.
STEM-EDS mapping of an ex-situ annealed ribbon. (a) BF-STEM micrograph of the mapped area. (b–d) Elemental maps of Cu, Fe, and Mg.
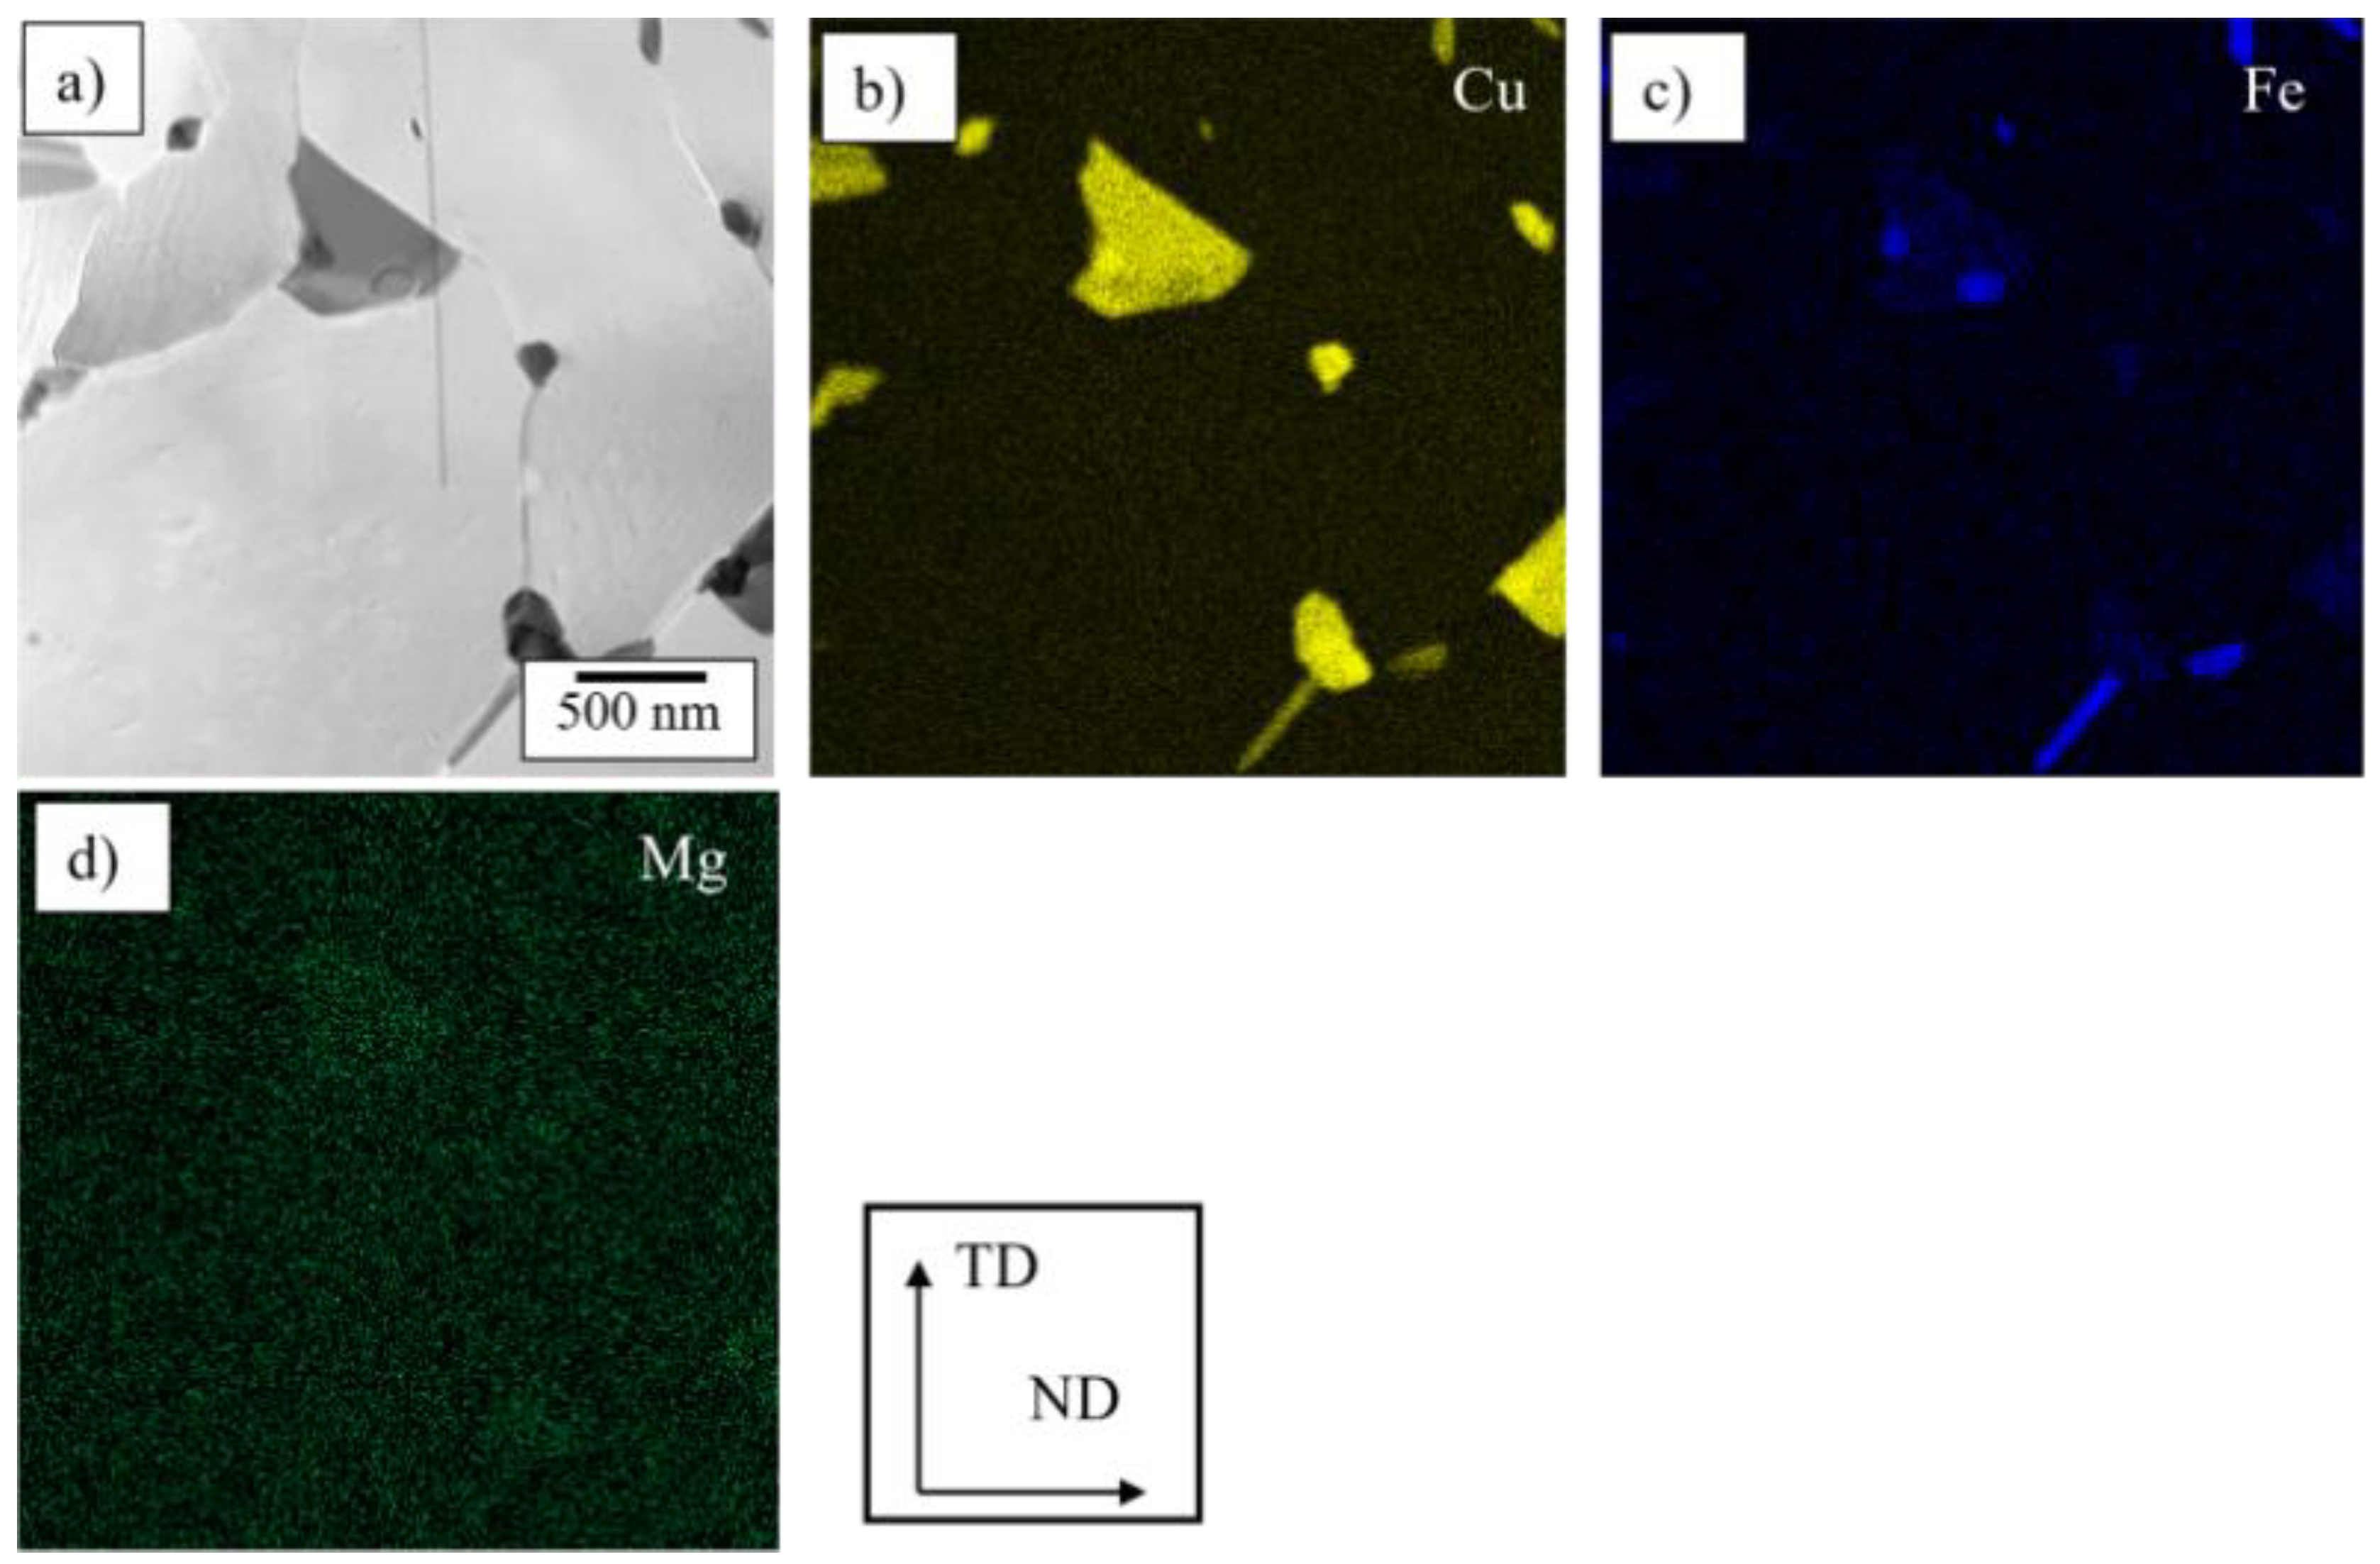
Figure 15.
Microhardness evolution of the melt-spun ribbon during aging at 180 °C. Values represent on-edge measurements averaged across the ribbon.
Figure 15.
Microhardness evolution of the melt-spun ribbon during aging at 180 °C. Values represent on-edge measurements averaged across the ribbon.
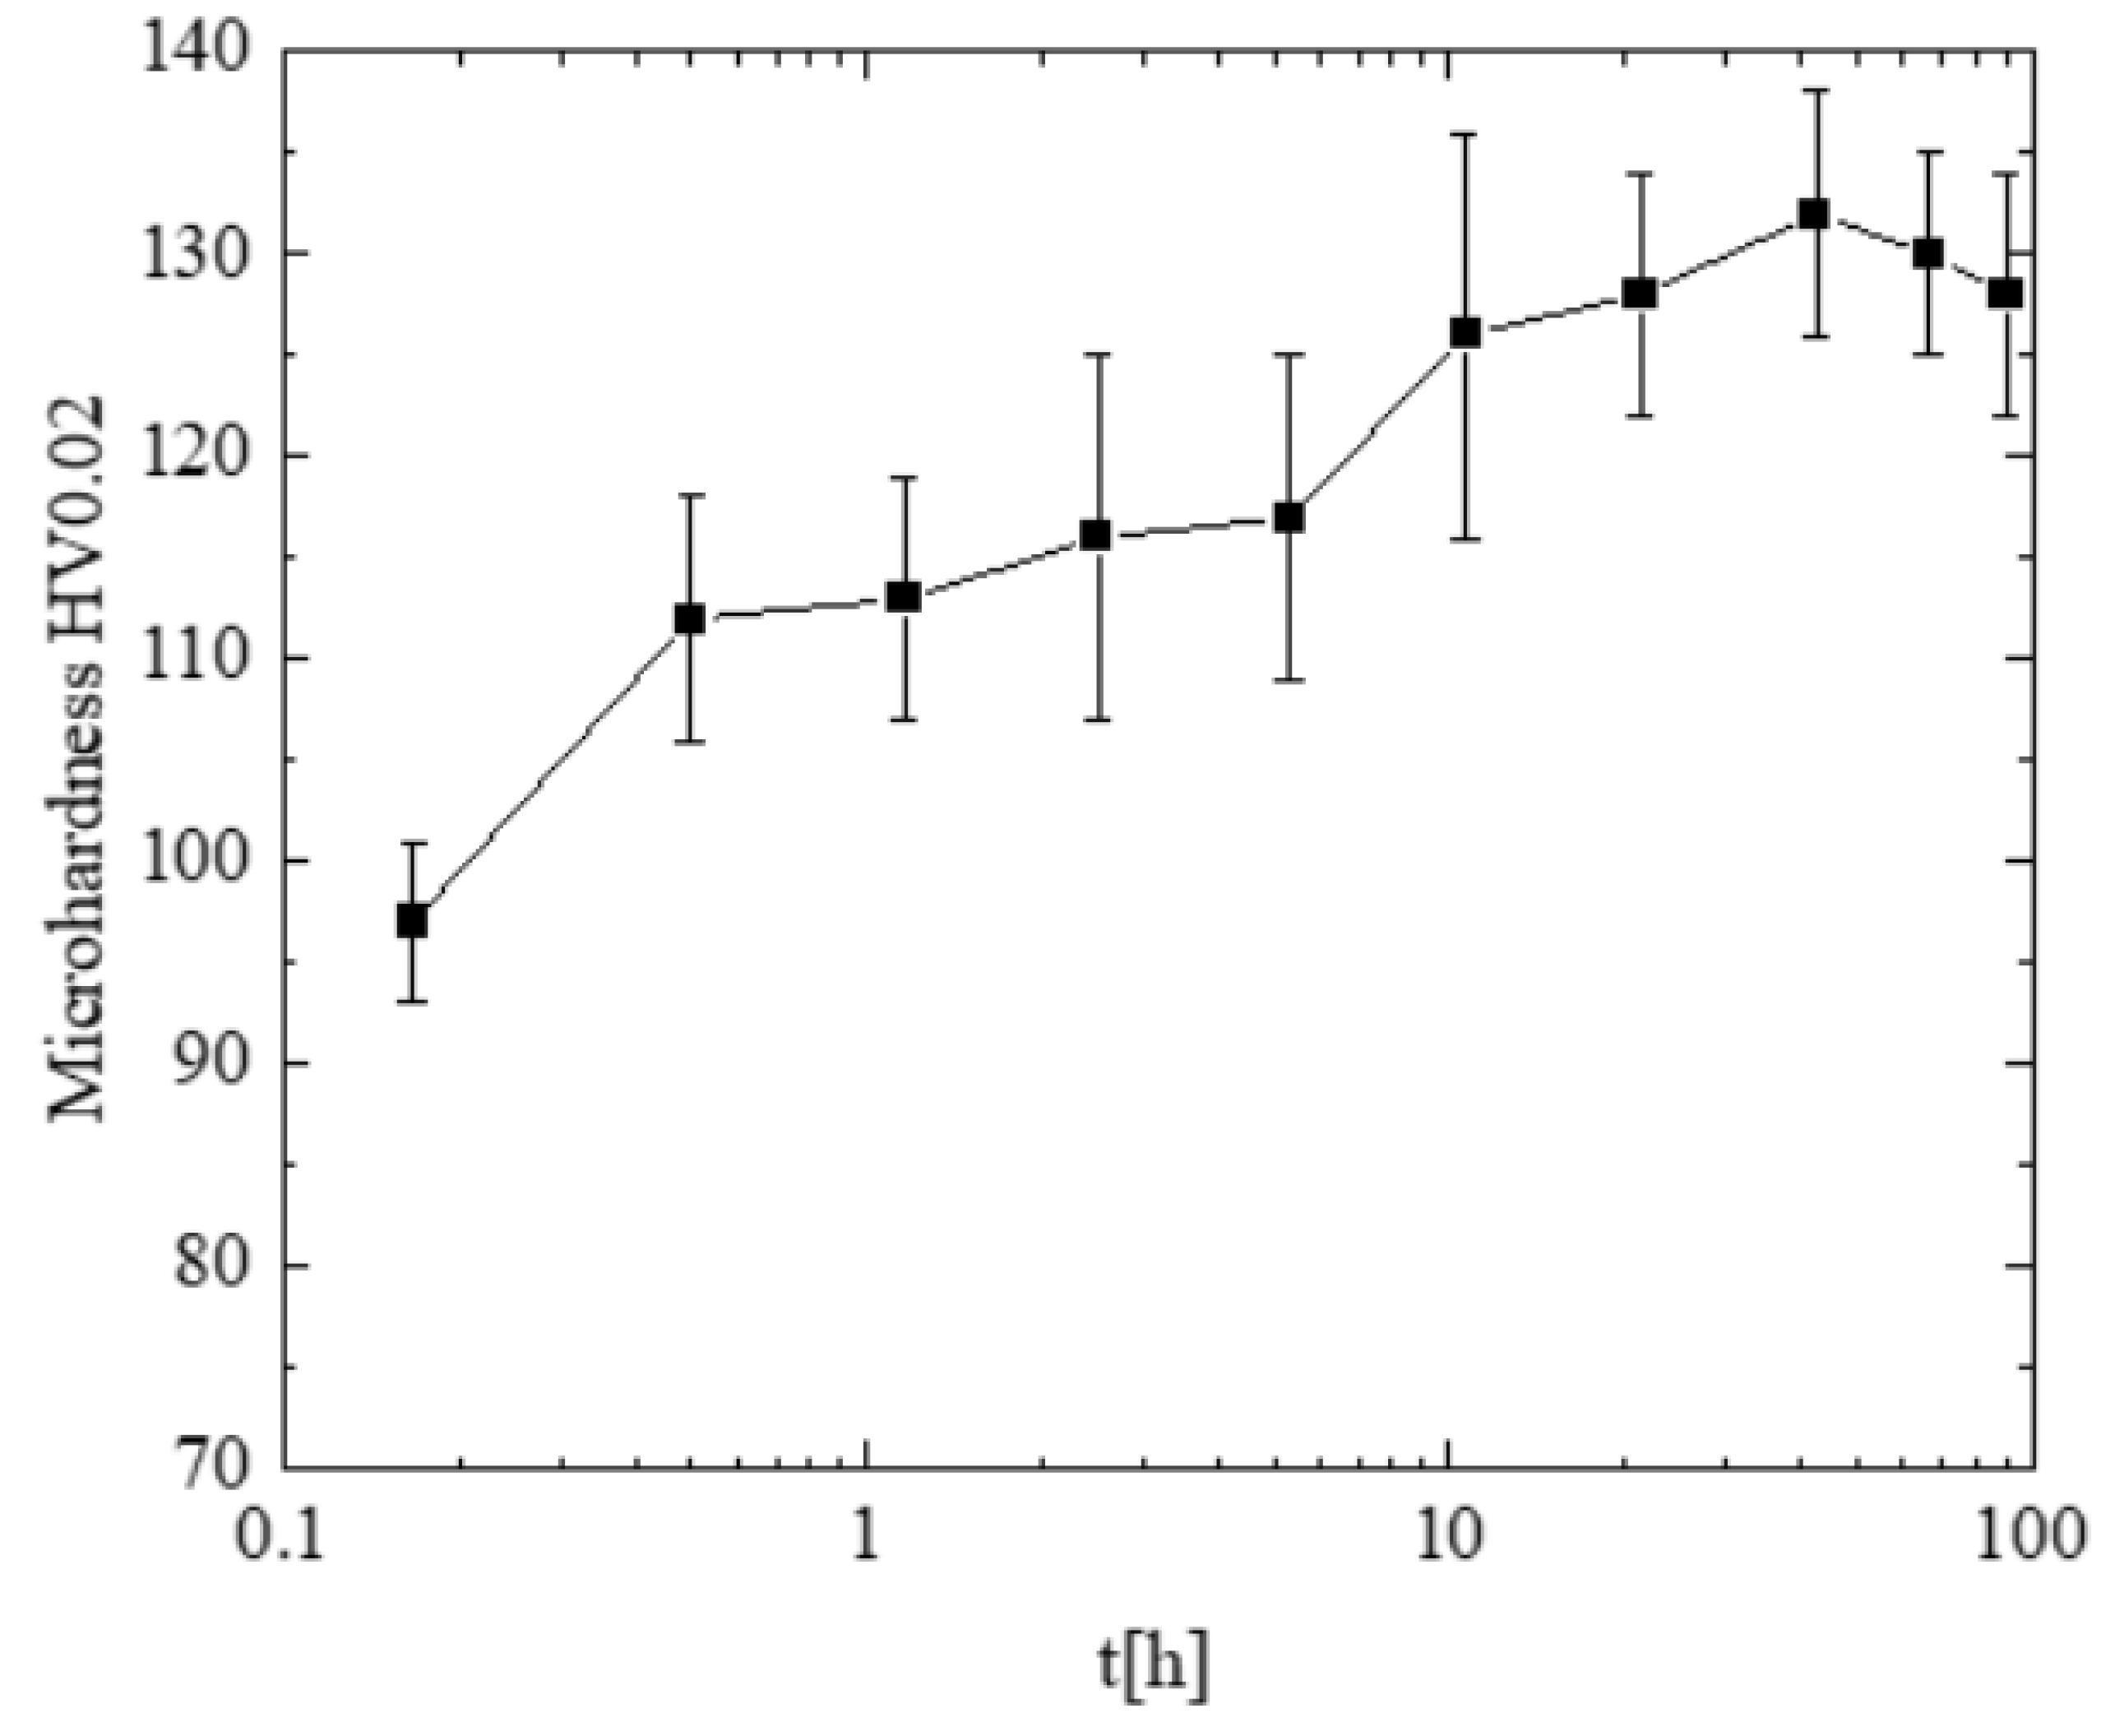
Figure 16.
STEM micrographs of cross-sections of ex-situ annealed and peak-aged ribbons. (a) [110] zone; (b) [100] zone (selected area diffraction patterns in insets). (c–d) Schematic diffraction patterns corresponding to the observed precipitates.
Figure 16.
STEM micrographs of cross-sections of ex-situ annealed and peak-aged ribbons. (a) [110] zone; (b) [100] zone (selected area diffraction patterns in insets). (c–d) Schematic diffraction patterns corresponding to the observed precipitates.
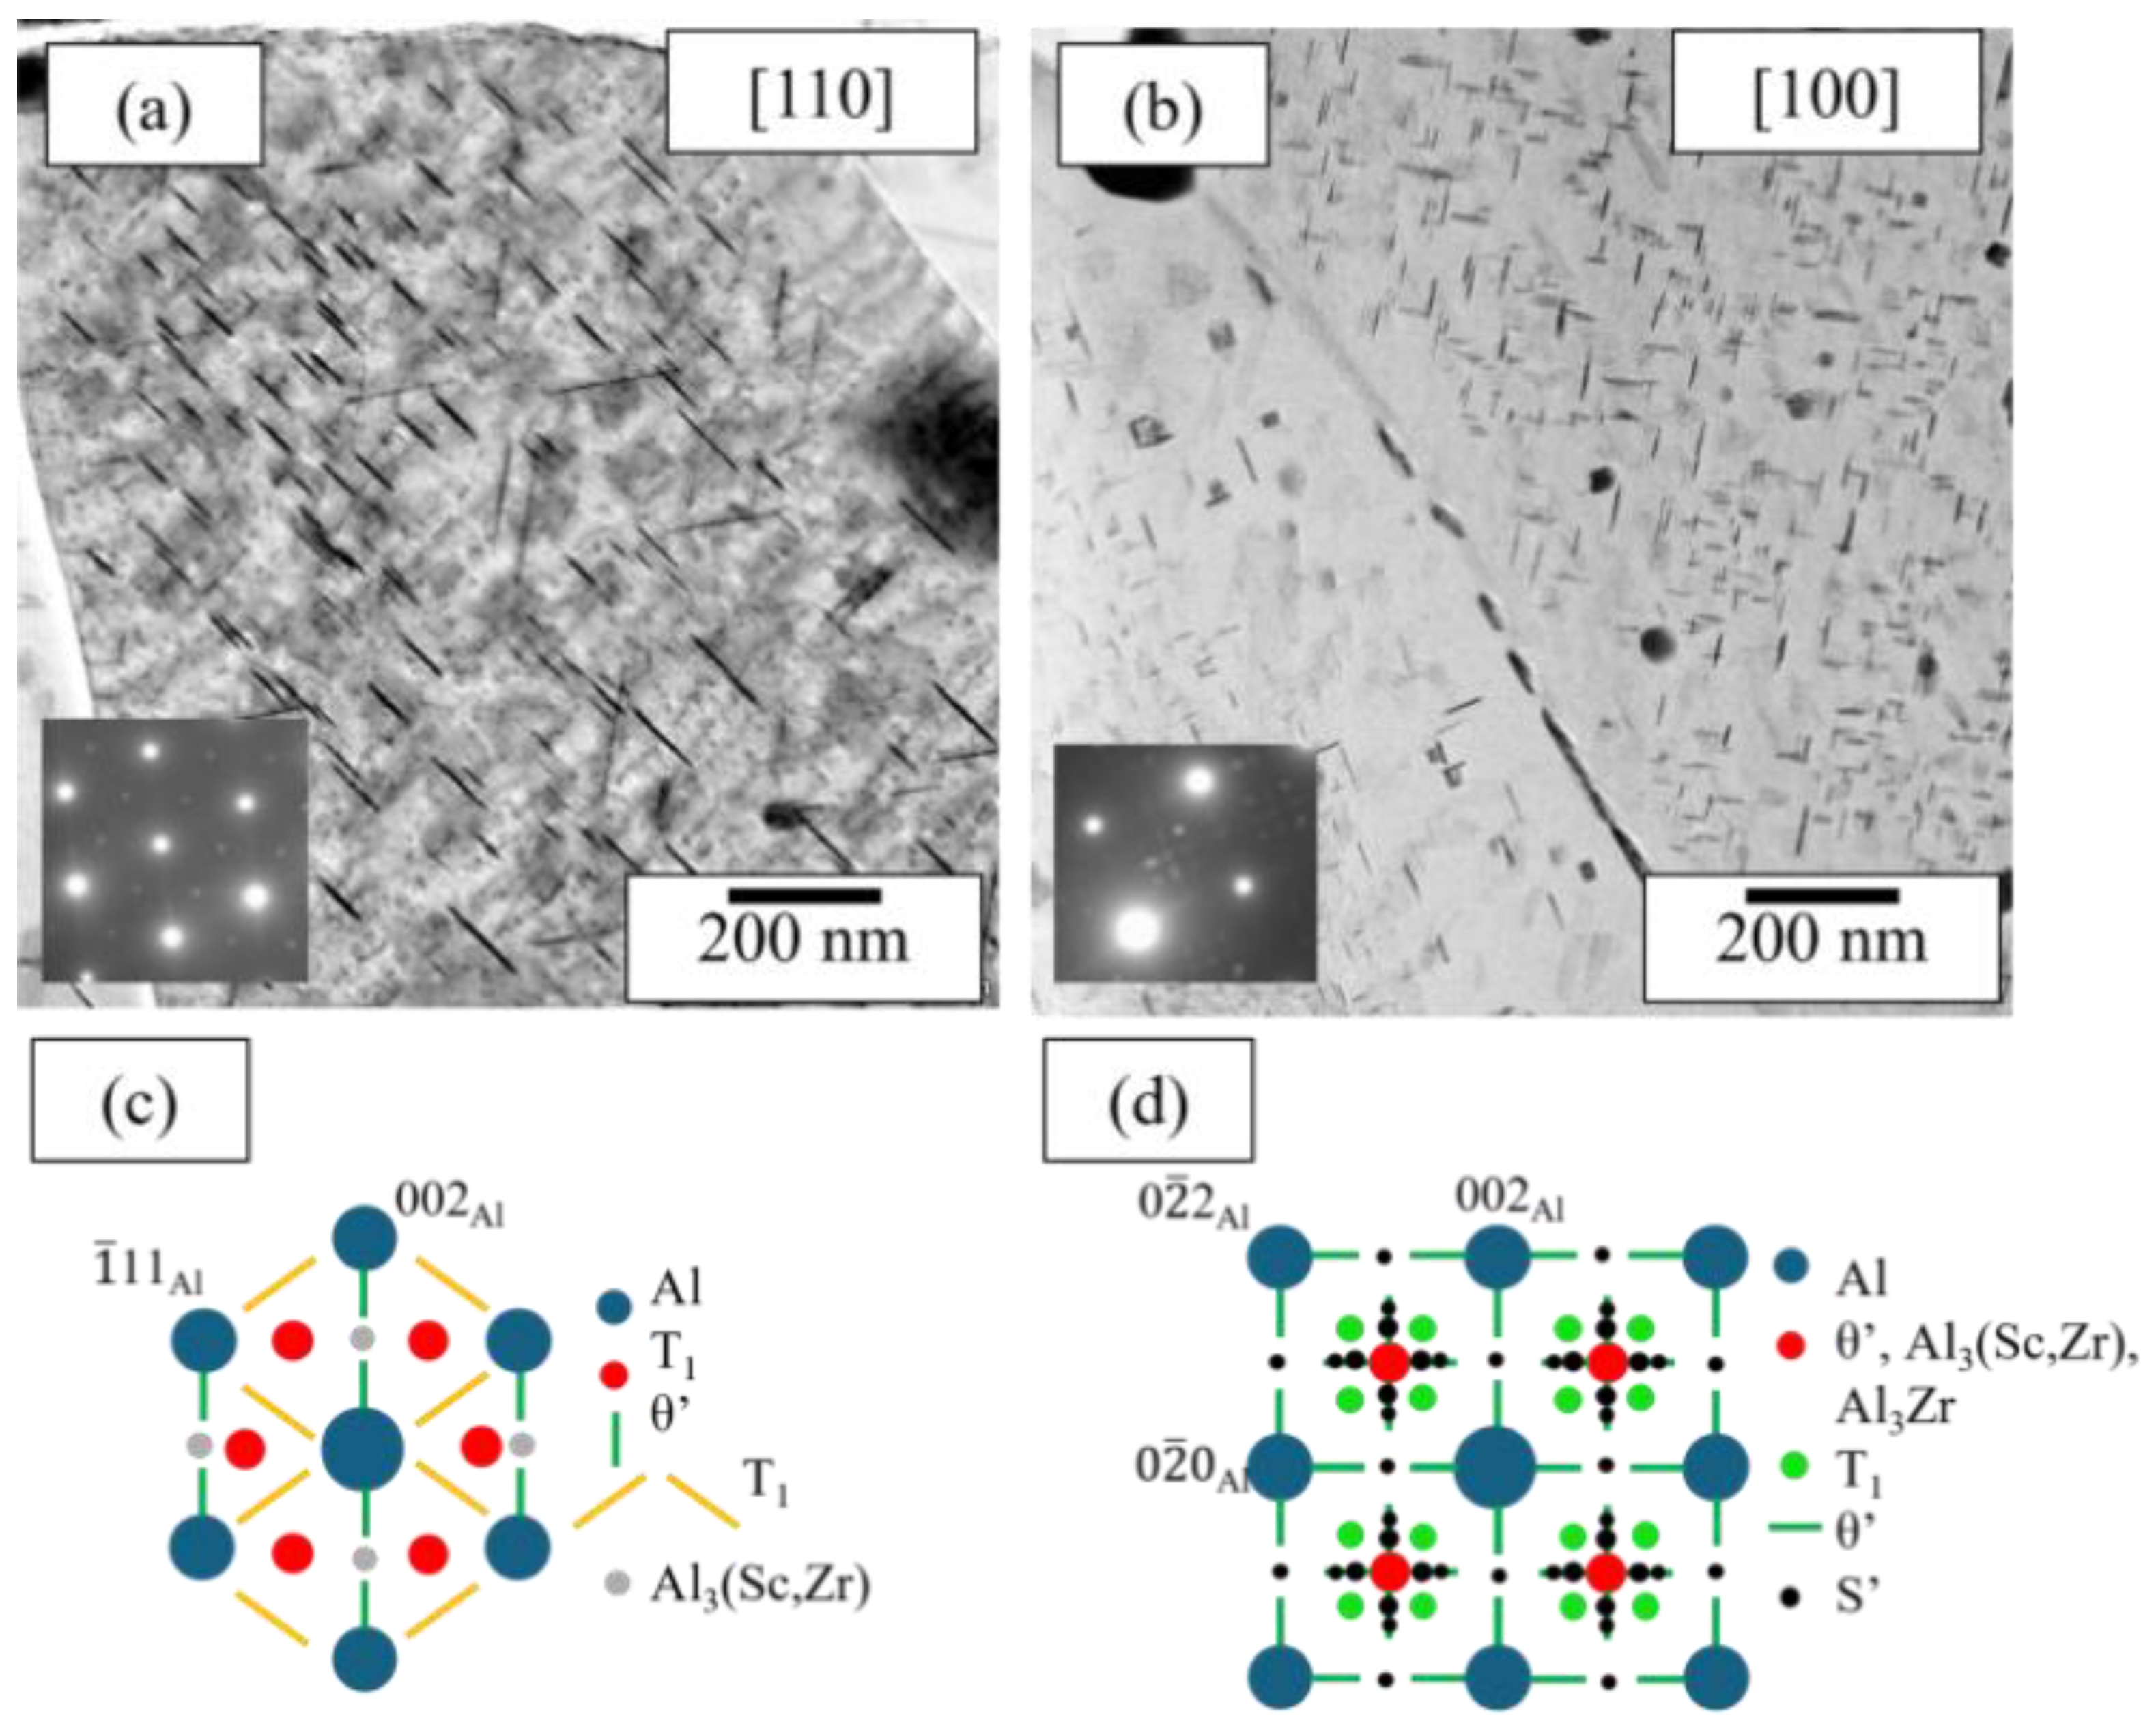

Table 1.
Concentrations of alloying elements in the studied melt-spun ribbon (wt.%). Standard deviations are given in parentheses to the last significant digit.
Table 1.
Concentrations of alloying elements in the studied melt-spun ribbon (wt.%). Standard deviations are given in parentheses to the last significant digit.
| Cu | Li | Mg | Zr | Sc | Ag | Fe | Al |
| 2.60(8) | 0.71(8) | 0.27(2) | 0.12(6) | 0.16(4) | 0.24(7) | 0.10(6) | bal. |
Table 2.
EDS analyses of the particles highlighted in Figure 3 (atomic %).
Table 2.
EDS analyses of the particles highlighted in Figure 3 (atomic %).
| Particle | Al | Cu | Fe |
| 1 | 63.9 | 18.9 | 4.2 |
| 2 | 68.1 | 21.3 | 1.3 |
Disclaimer/Publisher’s Note: The statements, opinions and data contained in all publications are solely those of the individual author(s) and contributor(s) and not of MDPI and/or the editor(s). MDPI and/or the editor(s) disclaim responsibility for any injury to people or property resulting from any ideas, methods, instructions or products referred to in the content. |
© 2026 by the authors. Licensee MDPI, Basel, Switzerland. This article is an open access article distributed under the terms and conditions of the Creative Commons Attribution (CC BY) license.
Copyright: This open access article is published under a Creative Commons CC BY 4.0 license, which permit the free download, distribution, and reuse, provided that the author and preprint are cited in any reuse.


