Preprint
Article

This version is not peer-reviewed.

Horizontal Force Influences on Pickup Acceleration

Submitted:

01 April 2026

Posted:

02 April 2026

You are already at the latest version

Abstract

Background/Objectives: Pickup acceleration refers to acceleration initiated from a non-static start, and can be described as a function of approach, transition, and pickup steps. Given the forward-leaning posture adopted during the transition and pickup steps, it was hypothesized that step horizontal force (SFh) production would be a key determinant of pickup acceleration ability. Methods: Forty-eight male athletes performed four 30 m pickup sprints at LED-guided entry velocities of 1.5 m/s-1 (walking) and 3.0 m/s (jogging), with spatiotemporal data collected via a horizontal linear position transducer. Athletes were grouped as “fast” or “slow” based on maximal acceleration (amax) and were compared at time points/steps using independent t-tests. Results: Across both entries, faster athletes achieved significantly higher amax (~13-17%) and maximum velocity (vmax; ~7-8%). At 1.5 m/s, the faster group produced significantly greater SFh during the Transition and Pickup steps (~34-41%), resulting in longer step lengths (SL; ~12%), higher step acceleration (Sa; ~17-32%), and higher step velocities (Sv; ~4-9%). At 3.0 m/s, SFh and Sa remained greater (p ≤ 0.05) in the faster group (~23-41%; 25-32% respectively) but produced fewer significant kinematic differences. It would seem that “faster” pick-up acceleration is associated with greater SFh across the transition and first pick-up steps; this increase in force clearly influences kinematics during a walking entry, but its influence is less apparent during a jogging entry. It is possible that at higher entry velocities, other technical/mechanical determinants become more important, necessitating a more advanced technological approach to studying pickup acceleration than the one used in this study.

Keywords: 
;  ;  ;  ;  

1. Introduction

In field-based team sports (e.g., soccer, rugby, and football codes), sprint acceleration is a fundamental motor ability that plays a critical role in both offensive and defensive actions. Achieving a high rate of change in velocity (i.e., acceleration) is often a decisive advantage in many competitive situations, making the assessment and enhancement of sprint acceleration a key focus for researchers and practitioners alike [1]. Traditionally, sprint acceleration has been tested from a static start, with outcome measures such as split times and horizontal force (Fh) production used to identify deficiencies, assess competitive levels, and inform training [2]. However, in most team sports, athletes frequently accelerate from non-stationary positions (often more frequently than from a static start), termed “pickup” acceleration, in which a submaximal entry velocity precedes maximal acceleration [3,4].
Pickup acceleration likely shares similarities with static start acceleration while also imposing unique mechanical and technical demands [5]. In static start sprinting, superior acceleration is characterized by greater Fh and an optimal ratio of forces (RF%) [6,17,18], while excessive vertical force early in acceleration biases RF% vertically, increasing flight time and step length at the expense of step frequency and horizontal propulsion [14]. As velocity increases, the force vector progressively tilts more vertically as the athlete transitions from a forward-leaning posture toward upright sprinting, reducing Fh [6,7,29]. Similar mechanical principles may apply during rolling entries, where pickup acceleration studies show that amax and split times decrease with faster entries [8,9,10], likely because the athlete enters the acceleration continuum closer to maximal velocity. To manage these characteristics, pickup acceleration requires athletes to transition smoothly from a submaximal entry velocity to maximal acceleration, often over only a few steps. In the literature, steps have been labeled according to their proximity to the transition point: Approach steps −2 and −1 precede the Transition step (step 0), followed by Pickup steps 1 and 2 [11]. Analyzing step-specific features provides insight into the effectiveness of force application, technical execution, and the progression of acceleration from initial entry to peak velocity; this approach is adopted by these authors for comparative purposes.
The body of pickup acceleration literature thus far has come from two disparate fields, gait analysis and human performance, encompassing walk-to-run gait analysis and jog/run-to-sprint research, respectively. Walk-to-run gait analysis from groups such as Segers, De Smet, and Caekenberghe [5,6,7,8] would be the closest proxy for walking entry pickup acceleration, but while useful in some respects, they have limitations. Typically, these studies used a steady increase in speed [9,10,11] (with only a few [5,6,8] using ‘spontaneous’ accelerations), have been conducted in a lab with lab-grade equipment [8], used non-sporting populations [6,8], or reported only a select few comparable outputs [5,8]. Jakeman [12], Kugler [13], Young [14], and Caekenberghe [15] studied elements of pickup acceleration from jogging/running speeds. However, Jakeman collected only SL, step duration, and velocity change; Young used a non-standardized build-up; Kugler primarily studied component-level kinetics; and Caekenberghe detailed how segment orientations and ground reaction forces change per unit of acceleration. Sonderegger [16] examined pickup acceleration from trotting through running entry velocities (1.6, 3, 4.1 m/s), but only examined the relationship between the entry velocity and amax.
Given this research context, the authors developed a hypothesis predicated on their understanding that better static start acceleration performance is associated with more effective initial acceleration, which in turn is associated with better Fh orientation in faster compared to slower athletes [17,18,19]. Cognizant of these findings from the static start research, it was thought that Fh would be similarly important for pickup-acceleration performance. Specifically, it was thought that athletes with better pickup capability would exhibit larger SFh (step horizontal force) outputs during initial acceleration (Transition and Pickup steps). The changes in these forces and associated kinematics, such as step length (SL) and step velocity (Sv), during pickup acceleration are the focus of this article. It was hypothesized that individuals with superior pickup ability would produce greater SFh, resulting in longer SL, greater Sa (step acceleration), and higher Sv (step velocity) across different entry velocities.

2. Materials and Methods

Prior to data collection, all athletes were familiarized with the testing protocol. Forty-eight injury-free male team-sport athletes performed four 30-m maximal pickup accelerations, paced across two submaximal entry velocities (1.5 m/s and 3.0 m/s). Distance- and velocity-time measures were extracted for each trial using a linear position encoder (1080 Sprint, 1080 Motion AB, Lidingö, Sweden) to capture spatiotemporal data at 333 Hz. Participants were divided above and below the mean amax value into equal fast and slow groups, and independent t-tests were used to determine which variables of interest differed significantly at particular time points/steps.
Participants
Forty-eight injury-free male team sport athletes (age: 19.5 ± 4.8 years; height: 1.82 ± 0.08 m; body mass: 80.3 ± 15.69 kg) participated in this study. The group included athletes from baseball (n=14), American football (n=12), basketball (n=10), soccer (n=6), track and field (200 and 400m; n=3), professional ultimate frisbee (AUDL) (n=1), Gaelic football (n=1), and ice hockey (n=1), all with more than one year of training experience. Before testing, participants were instructed to avoid intense exercise for 24 hours. Written informed consent was obtained from each athlete, and ethical approval was granted by the Auckland University of Technology’s ethics committee (Approval Number 21/437)
Procedures
Before beginning data collection, athletes were familiarized with the pacing system and required to match the prescribed entry velocity, completing four submaximal pickup acceleration warm-up repetitions (two at 1.5 m/s and two at 3.0 m/s) while remaining on target with the pacing and striding out submaximally during the warm-up. For data collection, athletes then performed two randomized 30-m pickups for each entry-velocity condition. Each athlete was connected to a linear position encoder (1080 Sprint, 1080 Motion AB, Lidingö, Sweden) via a tether and belt, while entry velocities were controlled using an LED system (LED Rabbit, BV Systems, LLC, Shawnee, KS).
Sprint data were collected using the 1080 Sprint system, which recorded displacement and time-series data in isotonic mode (1 kg load) to minimize resistance and ensure consistent tension on the tether [20,21]. Trial allocation was randomized using an Excel spreadsheet (Microsoft Excel, Microsoft, Redmond, WA, USA). Participants were instructed: “Once the LED Rabbit starts, match and maintain its pace until reaching the next set of cones. From there, accelerate maximally through the remaining cones.” Based on pilot testing, 13-m was required to achieve a stable entry velocity before they accelerated. Trials were discarded (n=7) if an athlete failed to maintain the LED pace; the discarded trials were repeated following five minutes of passive recovery. Each athlete’s outputs were averaged before being used for subsequent analysis.
the 50-M Sprint Setup (See Figure 1) Was Divided Into Two Distinct Zones:
1. 0-20 m paced zone – where the pickup entry velocity was established.
2. 21-50 m (30 m) pickup zone – where maximal acceleration took place.
Data Analysis
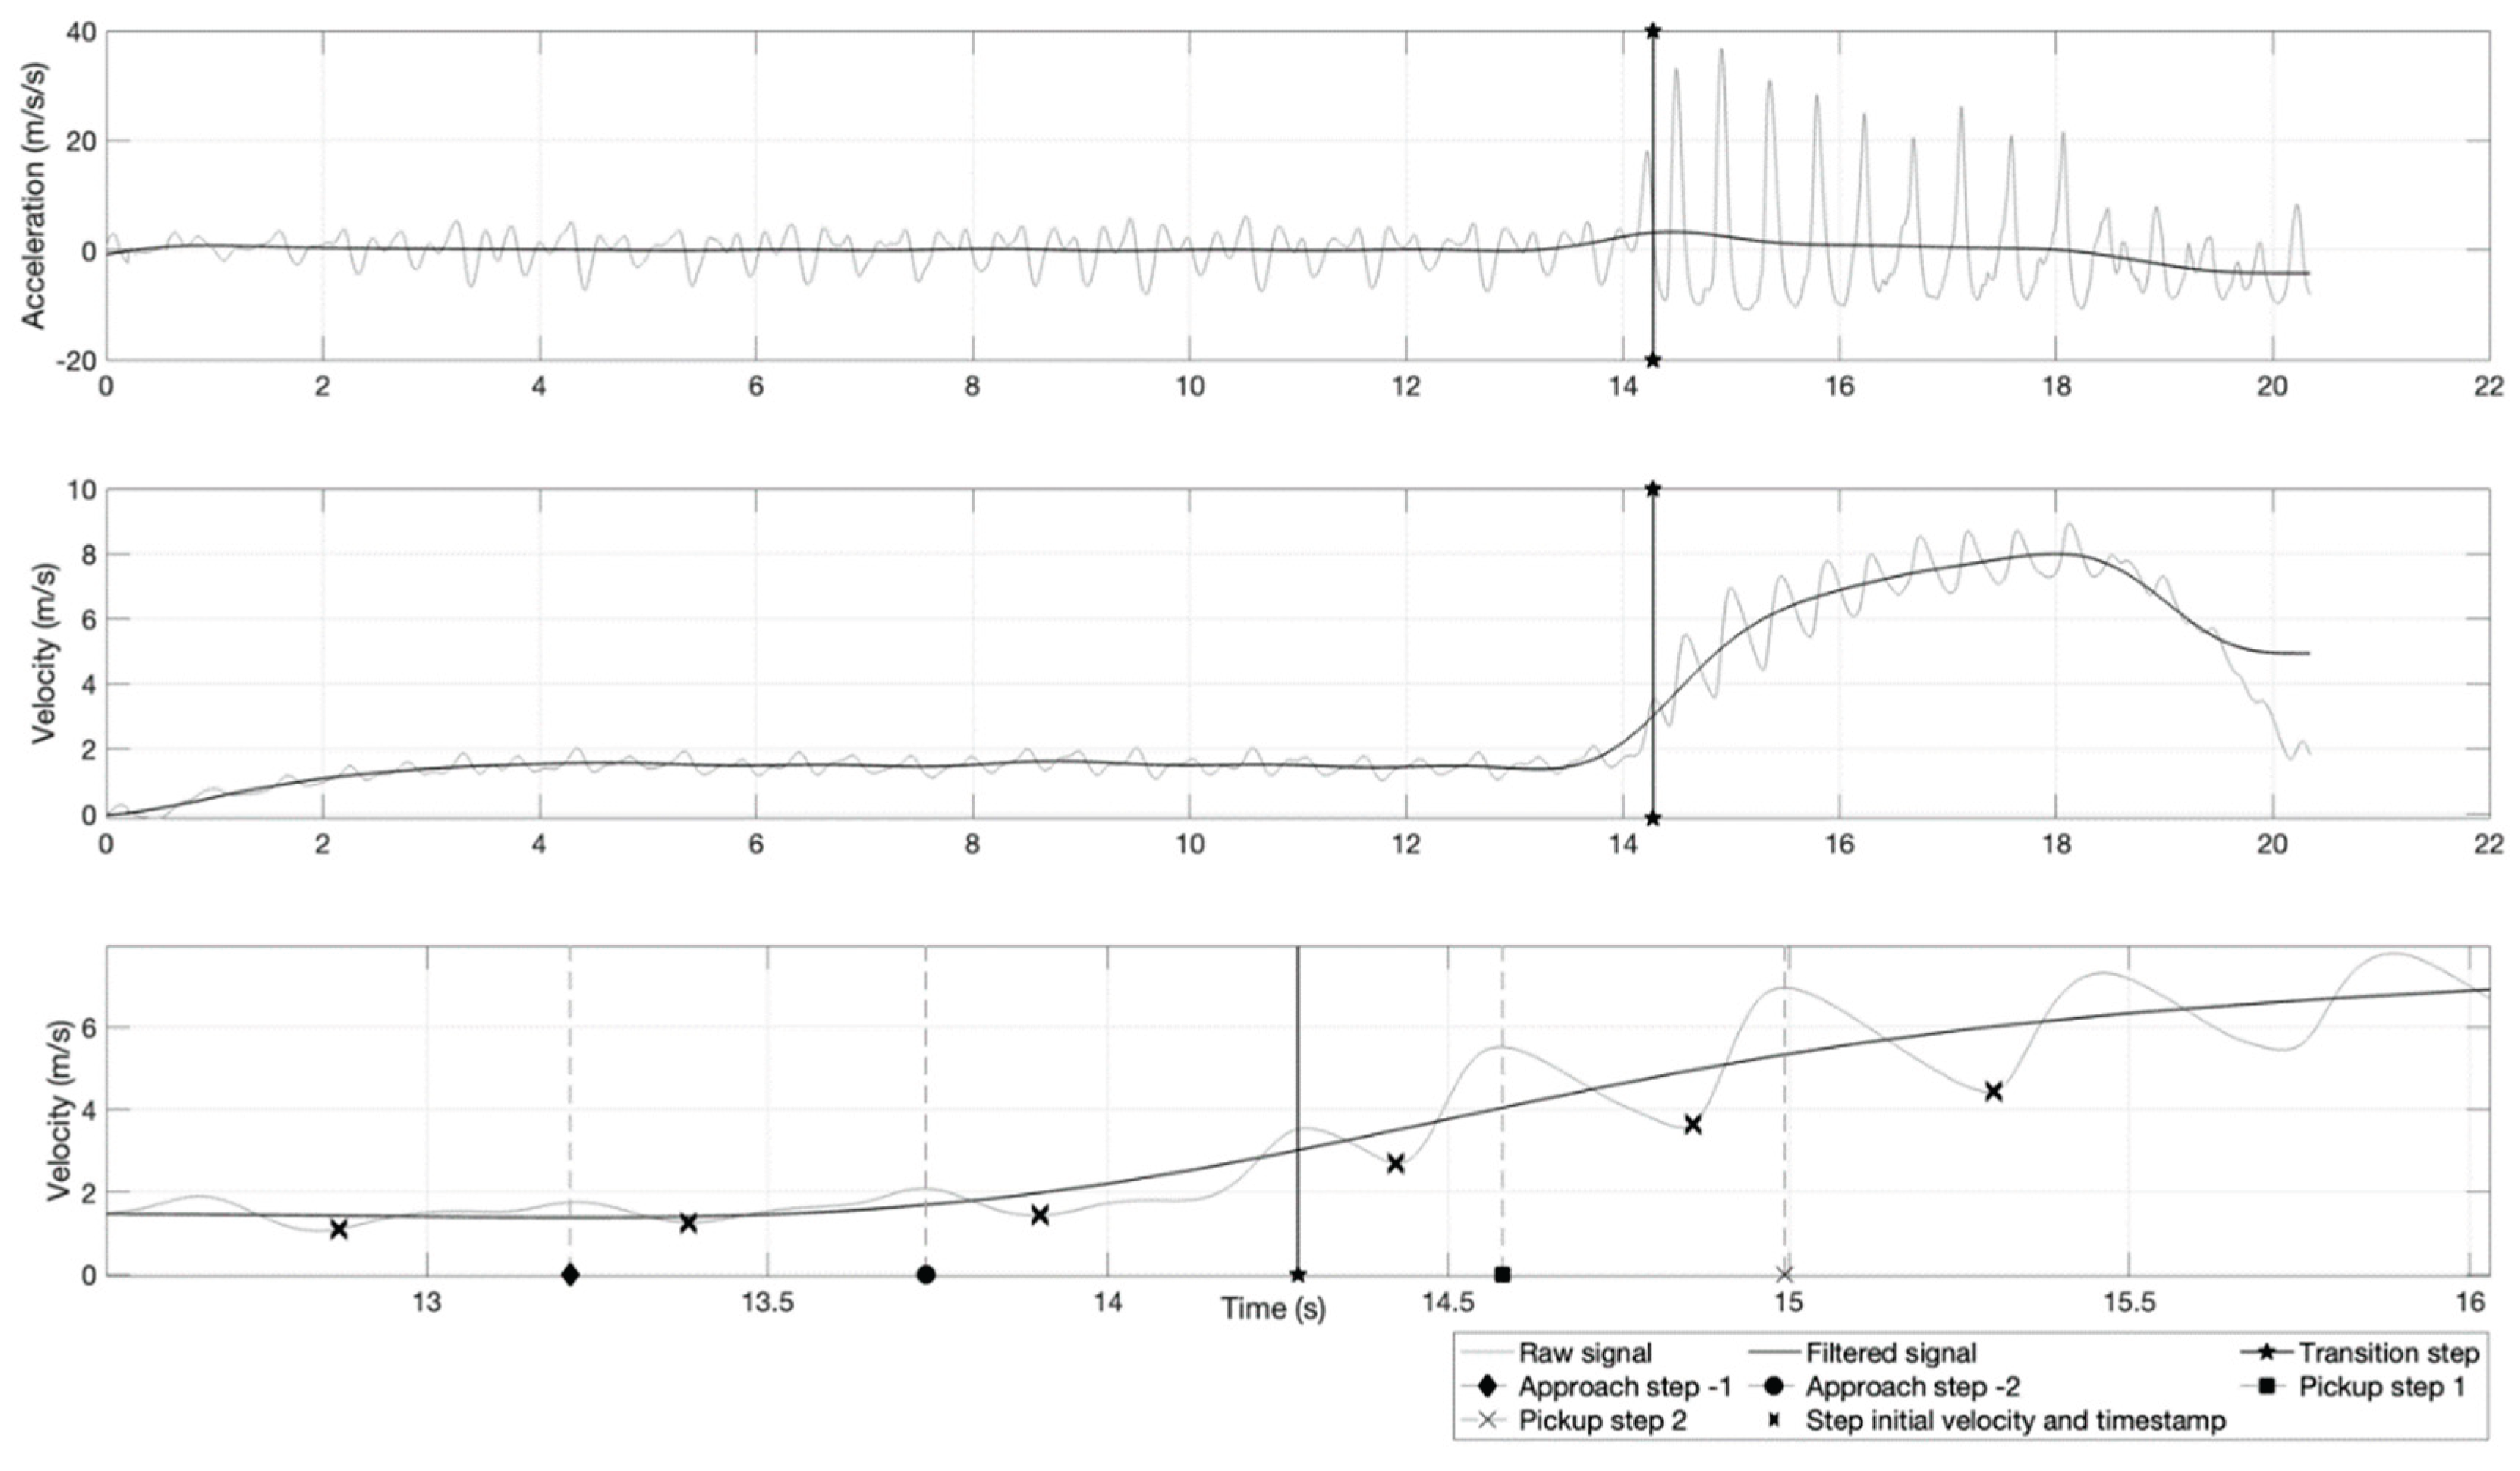
Raw velocity and time data from the 1080 Sprint were processed in MATLAB (MATLAB R2024b Update 3) using custom code to generate velocity–time, acceleration–time, and velocity–distance outputs. Within the raw velocity signal, ground contacts were identified as touchdown and toe-offs from the troughs and peaks of the signal [22,23], allowing manual identification of individual steps (see Figure 2). The pickup acceleration breakpoint was defined as the point at which a distinct increase in both velocity and acceleration occurred. After selecting the breakpoint, the remaining four steps were identified. Analysis began in the valley corresponding to Approach step 2, with MATLAB automatically estimating the most likely peak and valley for each subsequent step. If necessary, the researcher adjusted selections forward or backward to ensure accurate event identification. From the processed data, filtered amax and vmax were derived, and Sv and step time (St) were calculated for the Approach, Transition, and Pickup steps. Selected toe-off and ground-contact distances and their corresponding timestamps were then used to compute SFh, SL, and Sa.
The extracted steps were Approach 2, Approach 1, Transition, Pickup 1, and Pickup 2; however, only Approach 1 through Pickup 2 were analyzed, as Approach 2 was used only to verify the consistency of the subject’s entry velocity. Maximal acceleration was identified using a 0.5 Hz low-pass Butterworth filter and defined as the highest acceleration from trial start to 95% of vmax. This filter was chosen because it smoothed the velocity curve, removing tether motion caused by the belt oscillation attached to the athlete during the sprint’s ground-contact and flight phases [22,24], thereby enabling a more accurate estimate of CoM (center of mass) velocity and acceleration. Maximal velocity was defined as the peak velocity of the trial. All step variables were taken from the unfiltered raw signal. Step acceleration was determined as the change in velocity divided by the change in time (i.e., Sv taken from consecutive step peaks divided by time taken from consecutive valleys). Step horizontal force was computed using SFh = body weight × Sa, with Sa being the step acceleration value from the previous calculations. Step length was measured as the distance between consecutive signal valleys (i.e., from ground contact to ground contact), normalized by the athlete's leg length (measured from the right ASIS to the bottom of the right medial malleolus [25]). The time change was calculated using the timestamps from each valley, immediately before and after the step (indicated by the black X in Figure 2). Step velocity was calculated by subtracting the SL (measured from the signal valley before and after each step) of consecutive steps, then dividing by the time difference between them.
Statistical Analysis
An a priori power analysis was conducted using G*Power (3.1.9.6) to determine the required sample size to detect a between-group difference in amax using an independent-samples t-test. The analysis assumed a large effect size (Cohen’s d), a two-tailed alpha level of 0.05, and a desired power (1-β) of 0.80. The results indicated that a total sample size of 10 participants (5 per group) would be sufficient to detect a significant difference. Given a sample size of 48 participants (24 per group), the achieved power was 0.96, indicating that the study was well powered to detect the expected effect.
Participants were divided above and below the mean amax value into equal fast and slow groups, and independent t-tests with a significance level of p < 0.05 were used to determine which variables of interest differed significantly at particular time points/steps (Approach, Transition, and Pickup steps). Before analysis, the assumptions of normality (Shapiro-Wilk test) and homogeneity of variances (Levene’s test) were assessed. Data were presented as means ± standard deviations (SD) to represent measures of centrality and spread, respectively. In addition to p-values, effect sizes (ES) were calculated using Cohen’s d to assess the practical significance of findings, with thresholds interpreted as trivial (<0.20), small (0.20 – 0.49), moderate (0.50 – 0.79), large (0.80 – 1.0), and very large (>1.0) [26]. Between differences were calculated as symmetrical percent differences with the following formula = Fast – Slow/(Fast + Slow/2) x 100. Ninety-five percent confidence intervals (95% CI) around the mean differences were also reported to provide additional context regarding the precision of the estimates. All statistical analyses were performed using JASP (JASP 0.19.3, University of Amsterdam, Amsterdam, NL).

3. Results

1.5 M/s- Entry Velocity
The means, standard deviations, percent differences, effect sizes, and p-values of all the 1.5.m/s entry velocity step data for the fast and slow groups are shown in Table 1. No significant differences were observed between groups in anthropometric measurements. The vmax and amax were significantly greater in the faster group (averaged ES = 1.78). In terms of SFh production, moderate to large increases (mean ES: 0.82, and mean difference: ~32%; p < 0.05) in horizontal force production were observed across all steps in the fast group, except Approach 1. With regards to SL, small, non-significant differences were observed across all steps, except for Pickup 2, where a moderately longer SL (p < 0.05; 11.0%) was observed in the fast group. Moderate to large increases (p < 0.05; averaged % difference = ~22%) in Sa were noted for all steps but Approach 1 in the fast group. Sv differed significantly only during the Transition and Pickup 1 steps, with moderate-to-large increases in velocity observed in the fast group (averaged ES = 0.73).
3.0 M/s Entry Velocity
The means, standard deviations, percent differences, and p-values for all 3.0 m/s entry velocity step data for the fast and slow groups are shown in Table 2. Once again, no significant differences were observed between groups in anthropometrics. Similarly to 1.5 m/s, the vmax and amax for the fast group were significantly higher (averaged ES = 1.95). In terms of SFh production, moderate to large differences were observed (averaged ES = 0.75 and averaged % difference = ~27%; p < 0.05) for the fast group on the Transition and Pickup 1 steps, with a moderate but non-significant (p = 0.06) increase on Pickup 2. For SL, no significant differences were observed across all steps; small to moderate effects were noted (ES range: -0.44 to 0.54), with the fast group showing shorter Approach 1 and Transition steps and longer Pickup steps (mean ES: -0.36 and 0.47, respectively). Regarding Sa, moderate to large differences were observed (p range = 0.005 to 0.02; averaged % difference = 27%) across all steps, except Approach 1. Sv differed significantly on Approach 1 only (ES = -0.61, p = 0.04), where the slow group had a moderately higher velocity.

4. Discussion

Given that pickup acceleration presents unique mechanical and technical demands compared to static start acceleration [24], it is important to identify which steps and mechanical variables best delineate pickup acceleration ability. The final Approach, the Transition, and the first two Pickup steps were of particular interest to the authors. When participants were divided into faster and slower groups based on amax, several key findings emerged. At the 1.5 m/s (walking) entry velocity, faster athletes achieved significantly higher maximal acceleration and velocity (~12 and ~7%, respectively), primarily due to substantially greater SFh during the Transition and Pickup steps (~29–34%), which led to higher Sa and Sv with only modest increases (~11%) in SL (significant only at Pickup 2). At the 3.0 m/s (jogging) entry velocity, faster athletes again achieved significantly higher amax and vmax (~16% and ~7%), driven by greater SFh during the Transition and Pickup 1 steps (~21–34%), which resulted in higher Sa across subsequent steps, despite minimal and non-significant differences in SL and only small differences in Sv. Before discussing these results in detail, it is important to note that comparisons with existing research are problematic and should be interpreted with caution, given differences in study design, particularly in participants, variables collected, measurement technologies used, and overall study scope.
1.5 M/s Entry
It was hypothesized that from a walking entry, greater SFh would lead to superior pickup acceleration step mechanics and measures. The significant differences in force production for the fast group across all steps except Approach 1 (to be expected), along with higher amax and vmax values (mean differences of ~12% and ~7%, respectively), support this contention. It would seem that the slower group may have employed a suboptimal technical strategy that hindered their ability to rapidly scale up force production after the Transition, compared with the faster group. Alternatively, their ability to generate horizontal force may have been inferior to that of the faster athletes. Only one researcher [8] has examined step-to-step differences in walking-entry SFh; however, participants were not divided by performance, force plates rather than an LPE were used, and force data were separated into braking and propulsive components. They reported a significant decrease (p ≤ 0.05) in horizontal braking impulse on the Transition, followed by a significant increase on Pickup 1, with no significant change in horizontal propulsive force. The differences in the technologies used preclude even-handed comparisons; however, in general terms, the findings align with those from our study, which showed a significant increase in SFh on the Transition, followed by a slight net decrease in SFh on Pickup 1, but the limitation of the LPE precludes the determination of granular Fh metrics that would. The study presented here is the first to report on walking-entry pickup-acceleration step measures in a performance context.
It was thought that the increase in SFh would result in significantly greater SL; however, this was not the case for all steps. The only step that was significantly longer for the fast group was Pickup 2, which was 11.0% longer. Otherwise, SL differences were small, with the faster group taking steps that were <5% longer during the Transition and Pickup 1. Despite this, small effect sizes were noted potentially intimating a meaningful practical difference, where longer SLs may benefit increased CoM velocity. Only two groups have reported on this variable in the gait transitions research [5,27]. The SLs observed were similar to those reported in this study (Approach 1: 0.95 m vs 0.83 m; Transition: 1.22 m vs 1.01 m; Pickup 1: 1.17 m vs 1.20 m), although it was unclear whether distances were reported relative to leg length, and Pickup 2 was not included. The researchers, however, did not examine how SL adapted to pickup acceleration nor was a fast-slow comparison undertaken.
Step acceleration values during Transition, Pickup 1, and Pickup 2 for the walking entry differed significantly, with the faster grouping performing ~16-28% better. This result was expected, given that the grouping in this study (fast-slow) was delineated according to amax, and given the SFh results (i.e., horizontal force being the product of mass x acceleration). In gait transition research, acceleration is typically reported as CoM acceleration, with values ranging widely (0.23–3.63 m/s⁻²). Only one group of researchers [6] reported acceleration values within the range of those in this study (3.63 m/s-2 vs 3.56 m/s-2 for our athletes); other researchers reported a gradual acceleration (0.23 m/s-2) [9]. However, all values were reported as CoM acceleration. To the authors’ knowledge, Sa values have not been reported previously, thereby limiting cross-study comparability.
Finally, the Sv of faster athletes was significantly greater during the Transition and Pickup 1 steps. These between-group differences (~9.0%) in the Transition and Pickup 1 steps are most likely due to the faster group producing substantially more SFh (a ~83 N/33% mean difference between groups), leading to higher Sa and, in turn, higher Sv. Interestingly, it seems that the faster groups’ superior Sv was negligible within two steps, given the non-significant difference between groups at Pickup 2. It would seem that pickup velocity ability may be defined in the first two steps; however, the veracity of such a contention most likely needs further Pickup steps to be analyzed. Previous authors [5,8,27] have reported velocity measures for Approach 1 through Pickup 1, and the range of values was considerably lower (2.30 to 3.01 m/s-1 vs. 1.98 to 5.60 m/s-1) than those reported in this study. This likely reflects differences in protocols (spontaneous rather than maximal acceleration). Furthermore, comparisons to this research are problematic because these researchers used non-athletes, had sample sizes (n < 17), and employed different technologies (laser/Footscan insoles, cameras, and force plates) to collect data.
3.0 M/s Entry
As with the walking entry, greater SFh from a jogging entry was hypothesized to yield superior step-based pickup acceleration performance. When examining SFh production from a jogging entry, faster athletes produced significantly greater force (averaged % difference = ~27%) on the Transition and Pickup 1 steps, and Pickup 2 approached significance (% difference ~23%; p = 0.06). Overall, SFh values were lower than those seen at the 1.5 m/s entry, suggesting that the 3.0 m/s entry condition likely imposed a greater velocity-oriented constraint on the application of force. This force reduction is consistent with established force-velocity behavior during acceleration, whereby higher velocities place athletes farther along the velocity end of the force-velocity spectrum, thereby constraining SFh production and reducing RF% [28]. These results were expected and supportive of our hypothesis. Only two authors [13,15] have investigated Fh production from a jogging pickup. Kugler [13] used an acceleration from a 3.0 m/s entry but did not report on individual steps, and detailed force measures divided into propulsive and braking impulses. Caekenberghe [15] used a variety of entries (not specified in detail) but reported results per 1 m/s-2 of acceleration (i.e., the mean angle of the ground reaction force vector was oriented 4 ± 1° more anterior per unit of acceleration). This study was the first to investigate stepwise changes in SFh in a pickup acceleration setting; however, the findings are consistent with those of researchers who have highlighted the importance of SFh in static start acceleration [29]. Salo reported SFh numbers split into propulsive and braking components, leaving the net force to be calculated manually. Other than the first step (637 N), their values were similar and, like ours, decreased with velocity (ranging from 361 N on step 2 to 79 N on step 4) [29]. Other researchers [30,31,32] have examined force, but values were often reported as relative rather than absolute, making comparisons challenging.
During the jogging entry condition, no statistically significant differences in SL were observed; however, small to moderate differences (ES = -0.27-0.54) were evident, with the faster group having steps that were ~5–11% longer at Pickup 1 and Pickup 2. Jakeman et al. [12] reported SLs of ~1.44 m during Approach 1, 1.12 m during the Transition step, and 1.27–1.42 m during the Pickup steps, with each step significantly longer than the preceding step (p ≤ 0.05). These values were very similar to those observed in this study (Approach 1: 1.16 m; Transition–Pickup 2: 1.25–1.42 m), despite Jakeman et al. using a faster entry velocity (4.0 m·s⁻¹), absolute step lengths, and a recreationally active population rather than team-sport athletes. Compared with the static start literature, SLs also fell within the values reported in this work, ranging from 1.03 to 1.44 m over the first three steps [33,34,35].
Consistent with the greater SFh production at the walking entry velocity, the faster group showed significantly higher Sa (averaged % difference of ~27%) across all steps except Approach 1, as expected. The greater Sa values likely reflect more effective SFh application at ground contact, enabling faster increases in Sa and contributing to the higher amax observed in the faster group. Once more, to the authors’ knowledge, no researchers have examined Sa during pickup acceleration from a jogging entry, which limits cross-study comparisons but underscores the novelty of these findings. Step acceleration is not commonly measured in static-start sprinting, where it is typically reported as CoM acceleration or via profiling measures [36,37]; moreover, the step-to-step acceleration calculated in this study has not been previously investigated.
The only significant Sv difference occurred during the Approach 1 step, in which the slower group had a ~5% higher velocity, suggesting they were accelerating prior to the Transition, despite the LED rabbit modulating the entry velocity. Between-group differences, or lack thereof, were likely influenced by the higher entry velocity, which elevated initial step velocities and reduced the magnitude of subsequent step-to-step velocity increases. Consistent with this, during the later acceleration phases (Pickup 1 and 2), effect sizes were small (ES range = 0.36–0.45), with the faster group exhibiting slightly higher Sv (~3%). Jakeman et al. [15] were the only group to report Sv changes from a jogging entry, finding significant differences in velocity between steps (p ≤ 0.05); however, they implemented a faster entry velocity (4.0 m/s vs 3.0 m/s). The velocity increases observed in their study were more gradual than those reported here (ranging from 0.018 to 0.532 m/s-1), possibly due to the recreational population or the higher entry velocity, which may have constrained changes in Sv.

Limitations and Future Research Directions

The authors acknowledge several limitations that the reader should be aware of when reading this article. Although between-group differences in SFh were observed, the specific mechanisms underlying these differences cannot be definitively determined, as several unmeasured technical and physical factors may have contributed to the results. For example, the faster group may have oriented the body more quickly into a forward lean or adopted more favorable body angles to optimize the orientation of the horizontal force vector [30]. Alternatively, superior strength qualities, such as greater plantar flexor range of motion or enhanced explosive force production, may have influenced performance. Future research incorporating additional technologies, including videography and force dynamometry, is needed to more comprehensively identify the technical and physical determinants of pickup acceleration and superior SFh performance. Videography may clarify joint kinematics and segmental coordination during early acceleration, while dynamometry could quantify maximal force-producing capacity and further distinguish performance groups.
Additionally, although the 1080 Sprint provides valuable kinematic and kinetic insights, SFh is derived from Sa, which is a second derivative of displacement, so successive differentiation amplifies any noise in the signal. In tethered sprint systems, minor belt and center-of-mass oscillations during ground contact and flight may therefore increase variability in acceleration- and force-based measures. Furthermore, the tether's horizontal orientation makes it impossible to determine the magnitude and orientation of force, likely obscuring finer determinants, such as RF%, that are better suited to force plates. Previous researchers [38] comparing the 1080 Sprint to the gold standard, force plates, identified a fixed bias of 16 N and recommended calibration against force plate data to ensure accuracy. Furthermore, the system's inability to accurately quantify step frequency limited the analysis.
Finally, the scope of this study was informed by prior gait transition research [5,7,8], which has primarily examined Approach 2 through Pickup 2; however, inclusion of additional pickup steps may have further clarified between-group differences. Studies using an LPE with 1 kg resistance [20,21,39] have reported “false peaks” in the waveform, likely due to tether oscillations with each gait event, introducing minor signal irregularities that may affect the determination of step variables such as SL and St. The data processing methods employed here replicate those of Magnine [21], including adjustments to account for line sway associated with the preceding step. Finally, although minimal, the 1 kg load does not fully replicate unresisted sprinting.

Conclusion

During pickup acceleration, an athlete must perform maximal acceleration from a non-static start; however, the qualities underlying this capability remain relatively unexplored. This is problematic, given that most understanding of positional demands and decisions around individualized programming occurs based on metrics extracted from static start sprinting. Given the current state of the research, it was hypothesized that individuals with superior pickup ability would produce greater SFh, resulting in longer SL, greater Sa, and higher Sv. This contention was partially supported: the effect of SFh on the Transition and Pickup SLs was minimal, and its impact on Sv depended on the entry velocity. Given the limited research in this area, further applied investigation using video-based kinematic analysis is recommended to clarify the technical factors influencing pickup acceleration performance. Furthermore, profiling the athlete's physical capabilities alongside videography should provide a better understanding of the determinants of pickup acceleration, which, in turn, should inform better exercise prescription to improve this motor quality.

Author Contributions

Conceptualization, M.P., A.U., J.C., and C.K.; methodology, M.P, A.U, and J.C.; software, J.N.; formal analysis, M.P., J.C.; investigation, M.P., A.U., J.C.; resources, M.P. N.M., C.S., S.B., K.A.; data curation, M.P..; writing—original draft preparation, M.P., J.C. A.U..; writing—review and editing, M.P., J.C. A.U.; visualization, M.P., J.C. A.U..; supervision A.U., J.C., J.N,. and C.K.; project administration, M.P, J.C.; All authors have read and agreed to the published version of the manuscript.

Funding

This research received no external funding

Institutional Review Board Statement

The study was conducted in accordance with the Declaration of Helsinki and approved by the Institutional Review Board (or Ethics Committee) of Auckland University of Technology (21/437 Date of Approval 13/12/2021).

Acknowledgments

A big thank you to Chris Slocum, Nick Mascioli, and Sean Barger for their help in getting this part of the project done! Couldn’t have done it without you guys.

Conflicts of Interest

The authors declare no conflicts of interest

References

  1. Faude, O.; Koch, T.; Meyer, T. Straight sprinting is the most frequent action in goal situations in professional football . J Sports Sci 2012, 30(7), 625–31. [Google Scholar] [CrossRef] [PubMed]
  2. Cross, M.R. Mechanical properties of sprinting in elite rugby union and rugby league . Int J Sports Physiol Perform 2015, 10(6), 695–702. [Google Scholar] [CrossRef] [PubMed]
  3. Pryer, M. New perspectives in assessing pickup acceleration . Int J of Strength and Cond 2025. 5, 1, 1–12. [Google Scholar] [CrossRef]
  4. Caldbeck, P.; Dos'Santos, T. A classification of specific movement skills and patterns during sprinting in English Premier League soccer . PLoS One 2022, 17(11), 1–17. [Google Scholar]
  5. De Smet, K. Spatiotemporal characteristics of spontaneous overground walk-to-run transition . Gait Pos 2009, 29(1), 54–8. [Google Scholar]
  6. Segers. Kinematics and dynamics of burst transitions . J Motor Behav 2014, Vol. 46(Issue 4), p. 10. [Google Scholar]
  7. Segers. External forces during actual acceleration across transition speed . J Appl Biomech 2008, 24(4), 340–50. [Google Scholar]
  8. Segers. Biomechanics of spontaneous overground walk-to-run transition . J Exp Biol 2013, 216 Pt 16, 3047–54. [Google Scholar] [CrossRef]
  9. Segers. Dynamics of the body centre of mass during actual acceleration across transition speed . J Exp Biol 2007, 210 Pt 4, 578–85. [Google Scholar] [CrossRef]
  10. Segers. Spatiotemporal characteristics of the walk-to-run and run-to-walk transition when gradually changing speed . Gait Post 2006, 24(2), 247–54. [Google Scholar] [CrossRef]
  11. Segers. Kinematics of the transition between walking and running when gradually changing speed . Gait Post 2007, 26(3), 349–61. [Google Scholar] [CrossRef]
  12. Jakeman, B.; Clothier, P.J.; Gupta, A. Transition from upright to greater forward lean posture predicts faster acceleration during the run-to-sprint transition . Gait Post 2023, 105, 51–57. [Google Scholar] [CrossRef]
  13. Kugler, F.; Janshen, L. Body position determines propulsive forces in accelerated running . J Biomech 2010, 43(2), 343–8. [Google Scholar] [CrossRef] [PubMed]
  14. Young, W.B. Gradual vs. maximal acceleration: Their influence on the prescription of maximal speed sprinting in team sport athletes . Sports (Basel) 2018, 6(3). [Google Scholar] [CrossRef] [PubMed]
  15. Caekenberghe, I.V. Joint kinematics and kinetics of overground accelerated running versus running on an accelerated treadmill . J R Soc Interface 2013, 10(84), 1–11. [Google Scholar] [CrossRef] [PubMed]
  16. Sonderegger, K.; Tschopp, M.; Taube, W. The challenge of evaluating the intensity of short actions in soccer: A new methodological approach using percentage acceleration . PLoS One 2016, 11(11), 1–10. [Google Scholar] [CrossRef]
  17. Wild, J.J. Differences in step characteristics and linear kinematics between rugby players and sprinters during initial sprint acceleration . Eur J Sport Sci 2018, 18(10), 1327–1337. [Google Scholar] [CrossRef]
  18. Morin, J.B.; Edouard, P.; Samozino, P. Technical ability of force application as a determinant factor of sprint performance . Med Sci Sports Exerc 2011, 43(9), 1680–8. [Google Scholar] [CrossRef]
  19. Bezodis, N.; et al. Understanding ratio of forces during early acceleration; 2019. [Google Scholar]
  20. Feser, E. Comparison of two measurement devices for obtaining horizontal force-velocity profile variables during sprint running . Intl J of Sports Sci & Coach 2022, 1–7. [Google Scholar]
  21. Mangine, G.T. Increased Resisted Sprinting Load Decreases Bilateral Asymmetry in Sprinting Kinetics Among Rugby Players . J Strength Cond Res 2021, 35(11), 3076–3083. [Google Scholar] [CrossRef]
  22. Sugisaki, N. Validity of spatiotemporal and ground reaction force estimates during resisted sprinting with a motorized loading device . Scand J Med Sci Sport 2024, 34(3), p. 12. [Google Scholar] [CrossRef]
  23. Røkke, O. Validation of force-, velocity-, and acceleration-time curves and temporal characteristics as output data from the 1080 Sprint, in Dept of Phys Perf.; Norwegian School of Sports Sciences, 2018; p. 63. [Google Scholar]
  24. Pryer, M.E. Understanding Gameplay Acceleration Ability, Using Static Start Assessments: Have We Got It Right? Biomech 2026, 6(1), 1–9. [Google Scholar] [CrossRef]
  25. Gogia, P.P.; Braatz, J.H. Validity and reliability of leg length measurements . J Orthop Sports Phys Ther 1986, 8(4), 185–8. [Google Scholar] [CrossRef]
  26. Hopkins, W.G. A Scale of Magnitudes for Effect Statistics; Sportscience, 2006. 2023. [Google Scholar]
  27. Van Caekenberghe, I. Overground vs. treadmill walk-to-run transition . Gait Post 2010, 31(4), 420–8. [Google Scholar] [CrossRef]
  28. von Lieres Und Wilkau, H.C. The importance of duration and magnitude of force application to sprint performance during the initial acceleration, transition, and maximal velocity phases . J Sports Sci 2020, 38(20), 2359–2366. [Google Scholar] [CrossRef]
  29. Salo, A.I.; Keränen, T.; Viitasalo, J. T. Force production in the first four steps of sprint running . ISBS Conference Proceedings, 2005. [Google Scholar]
  30. Rabita, G. Sprint mechanics in world-class athletes: a new insight into the limits of human locomotion . Scand J Med Sci Sports 2015, 25(5), 583–94. [Google Scholar] [CrossRef]
  31. Bezodis, N.E.; North, J.S.; Razavet, J.L. Alterations to the orientation of the ground reaction force vector affect sprint acceleration performance in team sports athletes . J Sports Sci 2017, 35(18), 1–8. [Google Scholar] [CrossRef]
  32. Lockie, R.G. Factors that differentiate acceleration ability in field sport athletes . J Strength Cond Res 2011, 25(10), 2704–14. [Google Scholar] [CrossRef] [PubMed]
  33. Coh, M.T., K, Kinematic analysis of the sprint start and acceleration from the blocks . New studies in athletics 2006, 21(3), 23–33.
  34. King, D. Relationships between kinematic characteristics and ratio of forces during initial sprint acceleration, in College of Engineering; Swansea University, 2022; p. 109. [Google Scholar]
  35. Murata, M. Spatiotemporal and kinetic determinants of sprint acceleration performance in soccer players . Sports (Basel) 2018, 6(4). [Google Scholar] [CrossRef] [PubMed]
  36. Alonso-Callejo, A. Validity and Reliability of the Acceleration-Speed Profile for Assessing Running Kinematics' Variables Derived From the Force-Velocity Profile in Professional Soccer Players . In J Strength Cond Res; 2023. [Google Scholar]
  37. Nagahara, R. Kinematics of transition during human accelerated sprinting . Biol Open 2014, 3(8), 689–99. [Google Scholar] [CrossRef] [PubMed]
  38. Sugisaki, N. Associations between individual lower limb muscle volumes and 100-m sprint time in male sprinters . Int J Sports Physiol Perform 2017, 1–19. [Google Scholar] [CrossRef] [PubMed]
  39. Mangine, G.T. A resisted sprint improves rate of force development during a 20-m sprint in athletes . J Strength Cond Res 2018, 32(6), 1531–1537. [Google Scholar] [CrossRef] [PubMed]

Figure 1. Sprint lane setup for pickup acceleration testing showing distances and locations of technology used.
Preprints 206253 g001
Figure 2. MATLAB step selection screen showing pickup acceleration breakpoint and step locations.
Preprints 206253 g002
Table 1. The means, standard deviations, percent change, and p-values of all steps at the 1.5 m/s-1 entry velocity data, for the fast and slow groups.
Faster pickup
(x̄ + SD; 95% CI)
Slower pickup
(x̄ + SD; 95% CI)
% difference
(p-value, ES)
Height (m) 1.84 ± 0.07 1.83 ± 0.08 0.55%
(0.63, 0.14)
Weight (kg) 83.9 ± 19.1 79.4 ± 15.2 5.51%
(0.38, 0.26)
Leg length (cm) 97.5 ± 5.42 98.7 ± 6.16 -1.22%
(0.48, -0.20)
Amax (m/s-2) 3.45 ± 0.18
(3.52, 3.37)
3.05 ± 0.20
(3.13, 2.96)
12.3%
(<0.001, 2.10)
Vmax (m/s-1) 7.81 ± 0.43
(7.99, 7.63)
7.26 ± 0.31
(7.39, 7.12)
7.30%
(<0.001, 1.45)
Step Absolute step horizontal force (N)
Approach 1 31.9 ± 34
(17.8, 45.8)
24.3 ± 31.3
(11.4, 31.3)
27.1%
(0.42, 0.23)
Transition 300.7 ± 85.7
(340.3, 261)
215.5 ± 94
(254.3, 176.8)
33.0%
(0.003, 0.89)
Pickup 1 279.1 ± 85.6
(314.4, 243.7)
198.5 ± 86.1
(234, 163)
33.8%
(0.002, 0.94)
Pickup 2 248.7 ± 98.4
(289.3, 208)
185.4 ± 102
(143.3, 102)
29.2%
(0.03, 0.63)
Step length (relative to leg length)
Approach 1 0.80 ± 0.16
(0.86, 0.73)
0.86 ± 0.10
(0.90, 0.82)
-7.23%
(0.11, -0.44)
Transition 1.03 ± 0.16
(1.10, 0.96)
0.98 ± 0.14
(1.04, 0.92)
4.98%
(0.24, 0.36)
Pickup 1 1.22 ± 0.17
(1.30, 1.15)
1.17 ± 0.10
(1.21, 1.12)
4.18%
(0.22, 0.36)
Pickup 2 1.44 ± 0.32
(1.57, 1.30)
1.29 ± 0.13
(1.34, 1.24)
11.0%
(0.04, 0.61)
Step acceleration (m/s-2)
Approach 1 0.38 ± 0.4
5(0.57, 0.19)
0.28 ± 0.43
(0.46, 0.10)
30.3%
(0.44, 0.23)
Transition 3.56 ± 0.77
(3.89, 3.24)
3.04 ± 1.00
(3.46, 2.61)
15.8%
(0.05, 0.60)
Pickup 1 3.37 ± 0.8
5(3.73, 3.01)
2.70 ± 0.67
(2.98, 2.42)
22.1%
(0.004, 0.88)
Pickup 2 3.10 ± 0.95
(3.50, 2.70)
2.35 ± 0.74
(2.67, 2.04)
27.5%
(0.004, 0.87)
Step velocity (m/s-1)
Approach 1 1.98 ± 0.17
(2.05, 1.90)
1.98 ± 0.14
(2.04, 1.92)
0.00%
(0.96, -0.02)
Transition 3.56 ± 0.50
(3.77, 3.34)
3.27 ± 0.50
(3.48, 3.05)
8.49%
(0.05, 0.58)
Pickup 1 4.84 ± 0.43
(5.02, 4.65)
4.44 ± 0.47
(4.64, 4.24)
8.62%
(0.004, 0.87)
Pickup 2 5.60 ± 0.42
(5.77, 5.41)
5.39 ± 0.43`
(5.57, 5.21)
3.82%
(0.11, 0.48)
Note: s, seconds; m, meters; kg, kilograms; m/s-1, meters per second; m/s-2, meters per second squared; N, newton; x̄, mean; SD, standard deviation; CI, confidence interval; ES, effect size; Bold text denotes significant values.
Table 2. The means, standard deviations, percent differences, and p-values of all steps at 3.0 m/s entry velocity data, for the fast and slow groups.
Faster pickup
(x̄ + SD; 95% CI)
Slower pickup
(x̄ + SD; 95% CI)
% difference
(p-value, ES)
Height (m) 1.83 ± 0.05 1.82 ± 0.09 0.55%
(0.99, 0.006)
Weight (kg) 78.6 ± 8.76 81.5 ± 20.5 -3.62%
(0.70, -0.12)
Leg length (cm) 98.4 ± 5.78 97.8 ± 5.87 0.61%
(0.49, 0.20)
amax (m/s-2) 2.57 ± 0.14
(2.63, 2.51)
2.19 ± 0.17
(2.26, 2.12)
16.0%
(<0.001, 2.47)
vmax (m/s-1) 7.75 ± 0.42
(7.93, 7.57)
7.25 ± 0.27
(7.36, 7.14)
6.67%
(<0.001, 1.42)
Step Absolute step horizontal force (N)
Approach 1 51.4 ± 34.
5(66, 36.8)
47.1 ± 34.7
(61.7, 32.4)
8.73%
(0.67, 0.12)
Transition 210.4 ± 58.4
(235.1, 185.7)
170.8 ± 79.6
(204.4, 137.3)
20.8%
(0.05, 0.57)
Pickup 1 206.3 ± 58.4
(234.5, 178)
146.2 ± 64.1
(173.2, 119.1)
34.1%
(0.003, 0.92)
Pickup 2 200.7 ± 68.
5(229.6, 171.7)
158.7 ± 0.78
(193.1, 124.3)
23.4%
(0.06, 0.56)
Step length (relative to leg length)
Approach 1 1.12 ± 0.18
(1.19, 1.04)
1.21 ± 0.24
(1.31, 1.11)
-7.73%
(0.14, -0.44)
Transition 1.23 ± 0.23
(1.33, 1.14)
1.29 ± 0.18
(1.36, 1.21)
-4.76%
(0.36, -0.27)
Pickup 1 1.38 ± 0.19
(1.46, 1.30)
1.31 ± 0.12
(1.39, 1.24)
5.20%
(0.19, 0.40)
Pickup 2 1.52 ± 0.45
(1.68, 1.35)
1.36 ± 0.20
(1.43, 1.27)
11.1%
(0.07, 0.54)
Step acceleration (m/s-2)
Approach 1 0.64 ± 0.41
(0.82, 0.47)
0.62 ± 0.52
(0.84, 0.40)
3.17%
(0.87, 0.05)
Transition 2.71 ± 0.76
(3.03, 2.39)
2.17 ± 0.71
(2.47, 1.87)
22.1%
(0.02, 0.73)
Pickup 1 2.63 ± 0.79
(2.96, 2.29)
2.00 ± 0.69
(2.30, 1.71)
37.2%
(0.005, 0.85)
Pickup 2 2.51 ± 0.68
(2.81, 2.20)
1.99 ± 0.78
(2.32, 1.66)
23.1%
(0.02, 0.68)
Step velocity (m/s-1)
Approach 1 3.60 ± 0.29
(3.71, 3.48)
3.77 ± 0.29
(3.89, 3.65)
-4.51%
(0.04, -0.61)
Transition 4.61 ± 0.42
(4.79, 4.42)
4.62 ± 0.33
(4.76, 4.49)
-0.22%
(0.81, -0.07)
Pickup 1 5.57 ± 0.43
(5.75, 5.40)
5.41 ± 0.36
(5.57, 5.26)
2.96%
(0.22, 0.36)
Pickup 2 6.16 ± 0.39
(6.33, 6.00)
5.99 ± 0.39
(6.16, 5.83)
2.84%
(0.13, 0.45)
Note: s, seconds; m, meters; kg, kilograms; m/s-1, meters per second; m/s-2, meters per second squared; N, newton; x̄, mean; SD, standard deviation; CI, confidence interval; ES, effect size; Bold text denotes significant values.
Disclaimer/Publisher’s Note: The statements, opinions and data contained in all publications are solely those of the individual author(s) and contributor(s) and not of MDPI and/or the editor(s). MDPI and/or the editor(s) disclaim responsibility for any injury to people or property resulting from any ideas, methods, instructions or products referred to in the content.
Copyright: This open access article is published under a Creative Commons CC BY 4.0 license, which permit the free download, distribution, and reuse, provided that the author and preprint are cited in any reuse.
Prerpints.org logo

Preprints.org is a free preprint server supported by MDPI in Basel, Switzerland.

Subscribe

Disclaimer

Terms of Use

Privacy Policy

Privacy Settings

© 2026 MDPI (Basel, Switzerland) unless otherwise stated